SPM 8.0: What’s New - Salford Systemsmedia.salford-systems.com/pdf/SPM8.0WhatsNew.pdfSPM 8.0:...
20
SPM 8.0: What’s New Overview This document outlines what’s new in Salford Predictive Modeler SPM 8.0 and compares features with SPM 7.0. Table of Contents SPM 8.0: What’s New Overview Table of Contents UI Redesign New Features and Major Upgrades Quick Impute ISLE and RuleLearner Next Generation of TreeNet Engine New Loss Functions Effective Model Setup Improved Approximations for Dependency Plots Missing Value Support on TreeNet Dependency Plots Score Distribution Summary Unified Model Summary Advanced Features for Scoring Engine Improved Focus Class Support Upgraded Model Setup Testing tab New Automates Improved Descriptive Stats Improved Profile tab in CART Performance Improvements Correlation Analysis Smaller Improvements Improved Default Settings in Model Setup Exposed New Parameters in Model Setup Saving User Preferences Between Sessions Bug Fixes
Transcript of SPM 8.0: What’s New - Salford Systemsmedia.salford-systems.com/pdf/SPM8.0WhatsNew.pdfSPM 8.0:...
SPM 8.0: What’s New
Overview This document outlines what’s new in Salford Predictive Modeler SPM 8.0 and compares features with SPM 7.0.
Table of Contents
SPM 8.0: What’s New Overview Table of Contents UI Redesign New Features and Major Upgrades
Quick Impute ISLE and RuleLearner Next Generation of TreeNet Engine
New Loss Functions Effective Model Setup Improved Approximations for Dependency Plots Missing Value Support on TreeNet Dependency Plots Score Distribution Summary
Unified Model Summary Advanced Features for Scoring Engine Improved Focus Class Support Upgraded Model Setup Testing tab New Automates Improved Descriptive Stats Improved Profile tab in CART Performance Improvements Correlation Analysis
Smaller Improvements Improved Default Settings in Model Setup Exposed New Parameters in Model Setup Saving User Preferences Between Sessions
Bug Fixes
UI Redesign Salford Systems uses SPM intensively for research, development, and consulting projects and it is our principal tool for any type of data analysis. During the successful adoption of SPM 7.0 by major commercial and many academic users we discovered opportunities to improve the product both due to our in-house use and in response to user comments and suggestions. GUI redesign and usability improvements incorporated are highlighted in topic specific sections in this document.
New Features and Major Upgrades
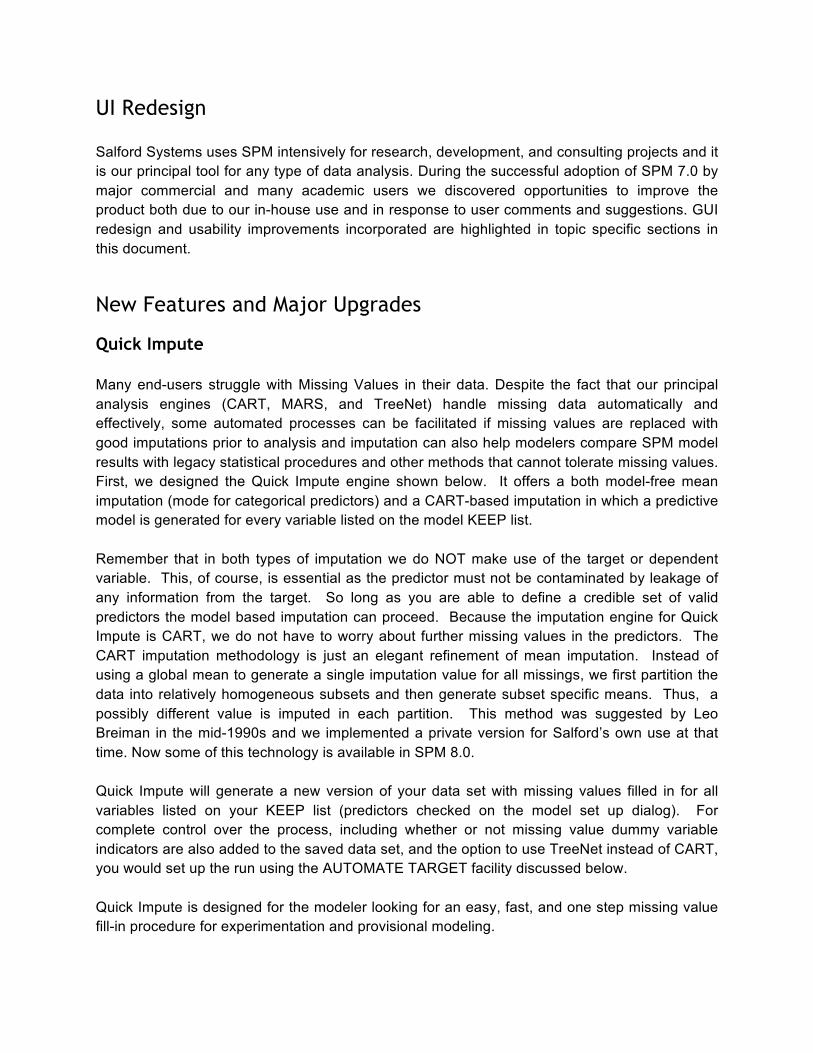
Quick Impute Many end-users struggle with Missing Values in their data. Despite the fact that our principal analysis engines (CART, MARS, and TreeNet) handle missing data automatically and effectively, some automated processes can be facilitated if missing values are replaced with good imputations prior to analysis and imputation can also help modelers compare SPM model results with legacy statistical procedures and other methods that cannot tolerate missing values. First, we designed the Quick Impute engine shown below. It offers a both model-free mean imputation (mode for categorical predictors) and a CART-based imputation in which a predictive model is generated for every variable listed on the model KEEP list. Remember that in both types of imputation we do NOT make use of the target or dependent variable. This, of course, is essential as the predictor must not be contaminated by leakage of any information from the target. So long as you are able to define a credible set of valid predictors the model based imputation can proceed. Because the imputation engine for Quick Impute is CART, we do not have to worry about further missing values in the predictors. The CART imputation methodology is just an elegant refinement of mean imputation. Instead of using a global mean to generate a single imputation value for all missings, we first partition the data into relatively homogeneous subsets and then generate subset specific means. Thus, a possibly different value is imputed in each partition. This method was suggested by Leo Breiman in the mid-1990s and we implemented a private version for Salford’s own use at that time. Now some of this technology is available in SPM 8.0. Quick Impute will generate a new version of your data set with missing values filled in for all variables listed on your KEEP list (predictors checked on the model set up dialog). For complete control over the process, including whether or not missing value dummy variable indicators are also added to the saved data set, and the option to use TreeNet instead of CART, you would set up the run using the AUTOMATE TARGET facility discussed below. Quick Impute is designed for the modeler looking for an easy, fast, and one step missing value fill-in procedure for experimentation and provisional modeling.
ISLE Model Compression and RuleLearner These engines were first introduced in SPM 7.0 and have been deployed successfully by our most sophisticated users. In the last year we have seen many more analysts showing interest in multi-stage modeling techniques and we see that many more data scientists are willing to try out these powerful techniques. For SPM 8.0 we have expanded the number of options and controls for these procedures and made them easier to access and run. ISLE is an acronym for Importance Sampled Learning Ensembles introduced by Jerome Friedman in 2003 and Friedman gave a keynote presentation on this topic at Salford’s 2004 Data Mining Conference in San Francisco. ISLE is a two-stage modeling process and can be applied to any ensemble of trees including Random Forests and bagged CART trees. Friedman focused mainly on TreeNet gradient boosting and this is what we have automated in SPM 8.0. The objective of an ISLE model is to post-processe a TreeNet gradient boosting model to extract a possibly very small subset of trees to use instead of the larger ensemble. If we are lucky the ISLE version of the model will be both much smaller than the original TreeNet and will also be more accurate on future data. We have seen TreeNet models built with 2000 trees reduced down to just 200 with no loss of predictive accuracy. ISLE works by using the outputs (scores) produced by each tree in the TreeNet as new features which are used as predictors in a second stage regularized regression or logistic regression. Since the trees in the TreeNet have already handled nonlinearity, interactions, and missing

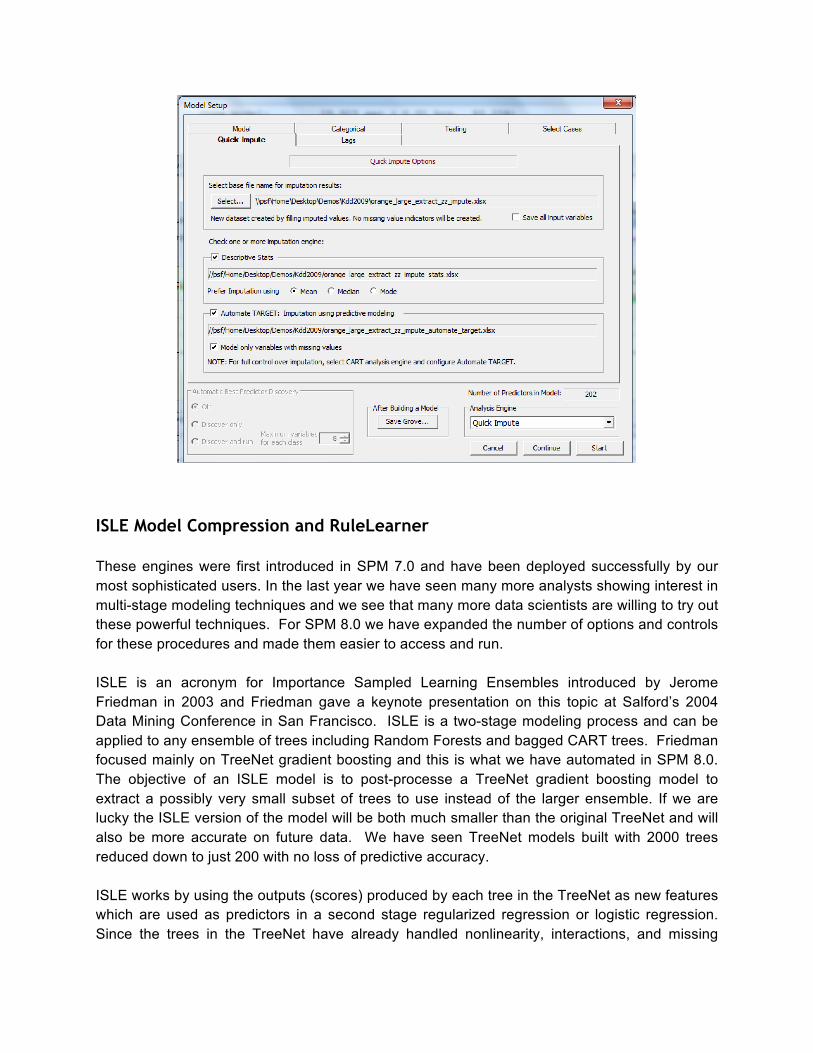
value handling, linear regularized regression is a perfectly fine methodology to produce the final model. The ISLE model is just a select subset of the original TreeNet trees with new weights (coefficients). Much of the “magic” of ISLE and its big brother RuleLearner comes from Friedman’s powerful GPS (Generalized PathSeeker) regularized regression modeler (built in to SPM 8.0) The GPS post-processing uses technology that goes far beyond the conventional “elastic net” and is not available in any other software. Your final model will look just like a TreeNet model. In 2008 Friedman went still further with these ideas. This time his approach was to treat the individual tree growing process in the TreeNet model as a search engine for interesting “rules” describing data. Treating each node (except the root of course) as a candidate rule, RuleLearner desconstructs the entire TreeNet ensemble into individual nodes which are rendered as dummy variables in a new data set. A GPS regularized regression to predict the original target using these new predictors extracts both rules of interest and also a completely recast model. Whereas ISLE treats each tree as a unit, RuleLearner treats each node as unit. GPS technology is important in this two stage modeling process because the number of predictors we need to process in the second stage could be enormous. If we grow a TreeNet using 2000 6-terminal trees we will generate 10 nodes per tree and thus 20,000 predictors. To allow us to run such models at high speed Friedman introduced the ground breaking technology found only in GPS. In SPM 8.0 ISLE and RuleLearner have gained their own dedicated interfaces and can be selected from the Analysis Engine drop down menu. We have also added options to the MARS and Random Forests engines for saving tree and basis function outputs for manual second stage post-processing via GPS regularized regression or other post-processing.
Next Generation TreeNet Gradient Boosting Engine TreeNet is our top performing tool and gradient boosting is widely regarded as the most important all-purpose learning machine by many experienced data scientists. Our proprietary gradient boosting machine was originally written by Stanford University Professor Jerome Friedman (the inventor of the technology) and we have reworked it in consultation with Professor Friedman to make it even more powerful, faster, and more memory efficient. The new version in SPM 8.0 includes the following features.
New Loss Functions TreeNet in SPM 7.0 offered four regression loss functions:
● Least Absolute Deviation (LAD) ● Least Squares (LS) ● Huber-M (LAD + LS hybrid) ● RandomForests
For Classification, we added “Differential Lift Modeling”. Our marketing customers seek to improve Differential Lift of their models. We conducted several real world studies in which this loss function was essential to uncovering the best segments to target.
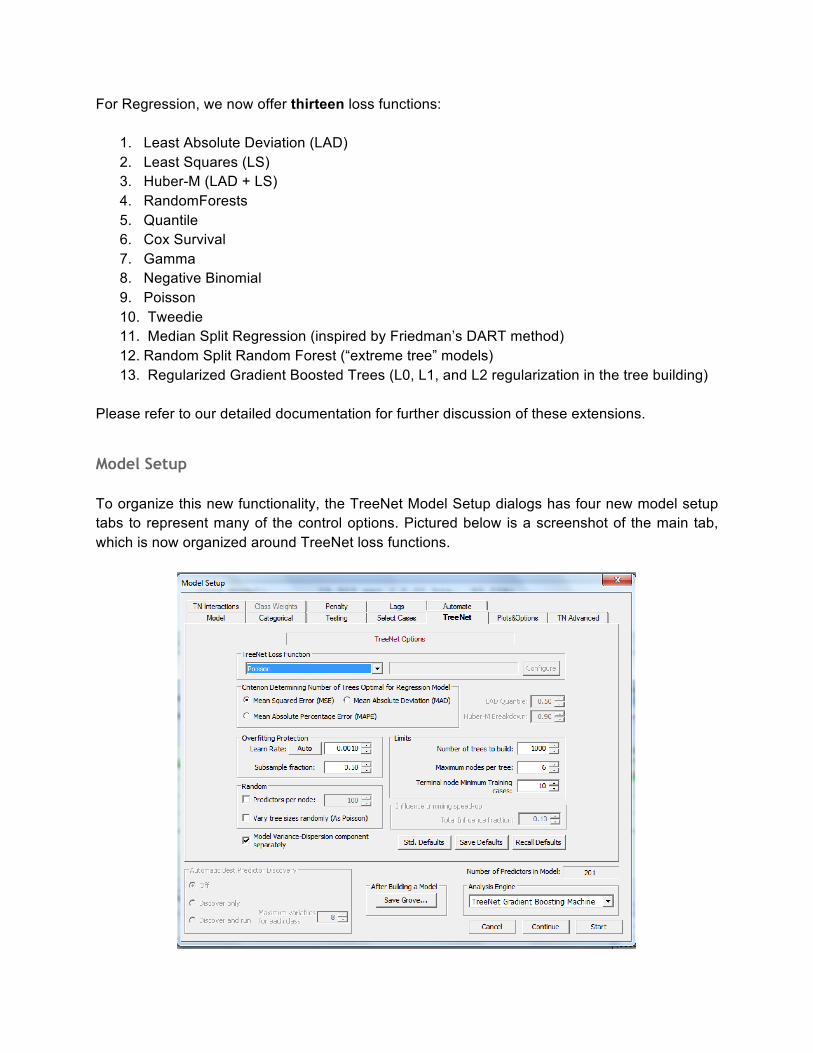
For Regression, we now offer thirteen loss functions:
1. Least Absolute Deviation (LAD) 2. Least Squares (LS) 3. Huber-M (LAD + LS) 4. RandomForests 5. Quantile 6. Cox Survival 7. Gamma 8. Negative Binomial 9. Poisson 10. Tweedie 11. Median Split Regression (inspired by Friedman’s DART method) 12. Random Split Random Forest (“extreme tree” models) 13. Regularized Gradient Boosted Trees (L0, L1, and L2 regularization in the tree building)
Please refer to our detailed documentation for further discussion of these extensions.
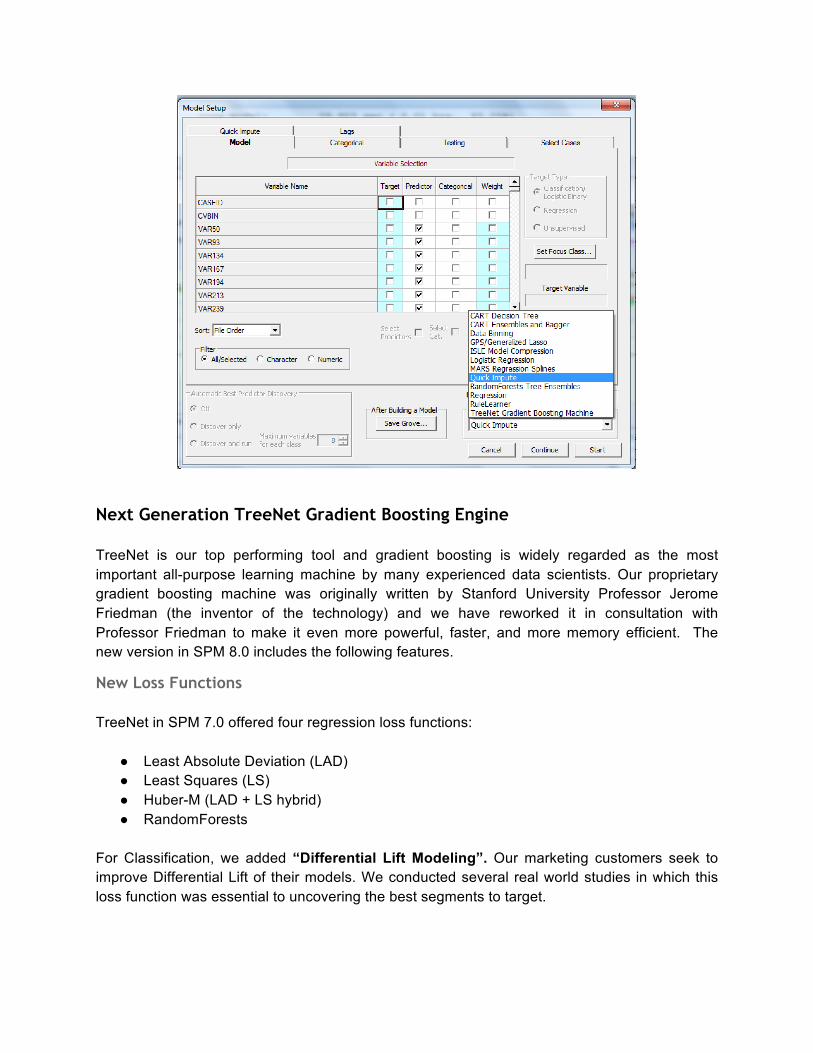
Model Setup To organize this new functionality, the TreeNet Model Setup dialogs has four new model setup tabs to represent many of the control options. Pictured below is a screenshot of the main tab, which is now organized around TreeNet loss functions.
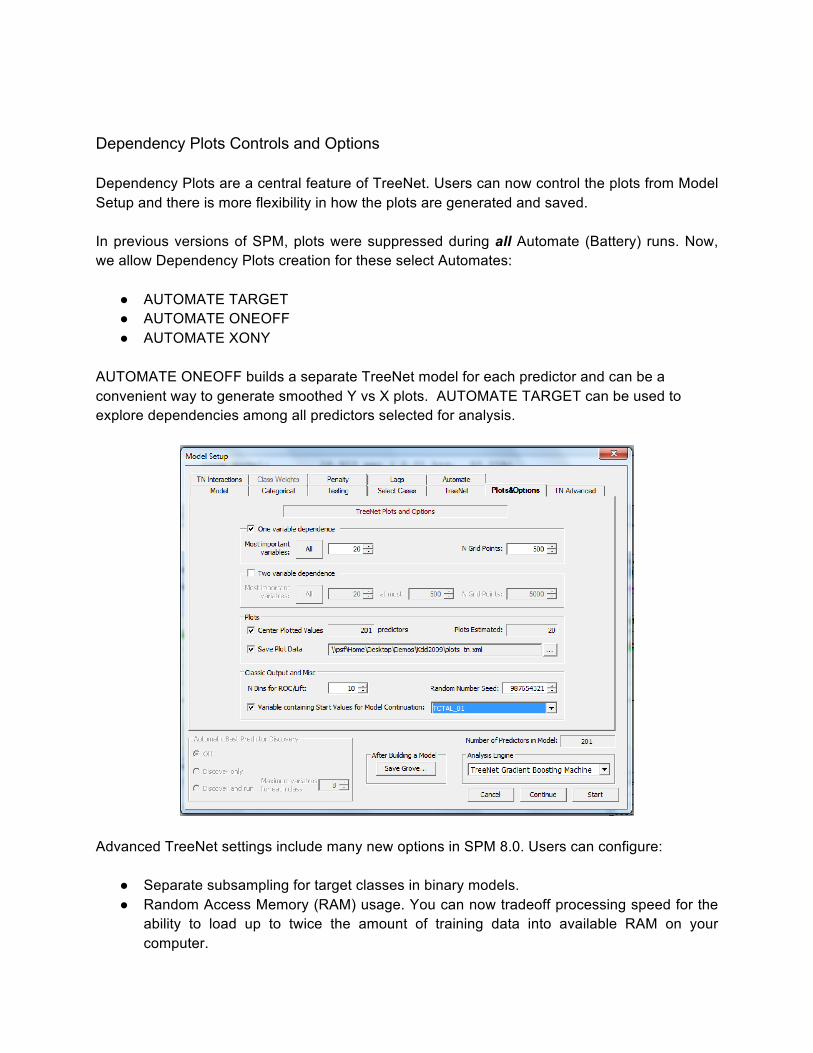
Dependency Plots Controls and Options Dependency Plots are a central feature of TreeNet. Users can now control the plots from Model Setup and there is more flexibility in how the plots are generated and saved. In previous versions of SPM, plots were suppressed during all Automate (Battery) runs. Now, we allow Dependency Plots creation for these select Automates:
● AUTOMATE TARGET ● AUTOMATE ONEOFF ● AUTOMATE XONY
AUTOMATE ONEOFF builds a separate TreeNet model for each predictor and can be a convenient way to generate smoothed Y vs X plots. AUTOMATE TARGET can be used to explore dependencies among all predictors selected for analysis.
Advanced TreeNet settings include many new options in SPM 8.0. Users can configure:
● Separate subsampling for target classes in binary models. ● Random Access Memory (RAM) usage. You can now tradeoff processing speed for the
ability to load up to twice the amount of training data into available RAM on your computer.
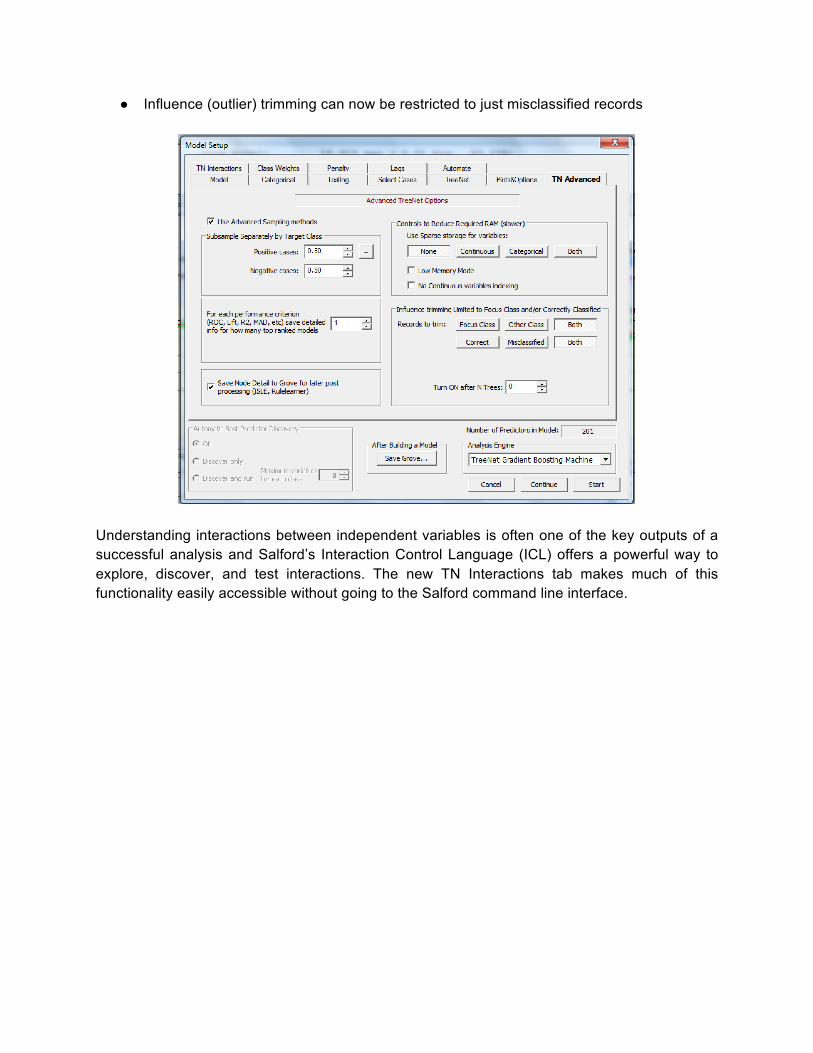
● Influence (outlier) trimming can now be restricted to just misclassified records
Understanding interactions between independent variables is often one of the key outputs of a successful analysis and Salford’s Interaction Control Language (ICL) offers a powerful way to explore, discover, and test interactions. The new TN Interactions tab makes much of this functionality easily accessible without going to the Salford command line interface.
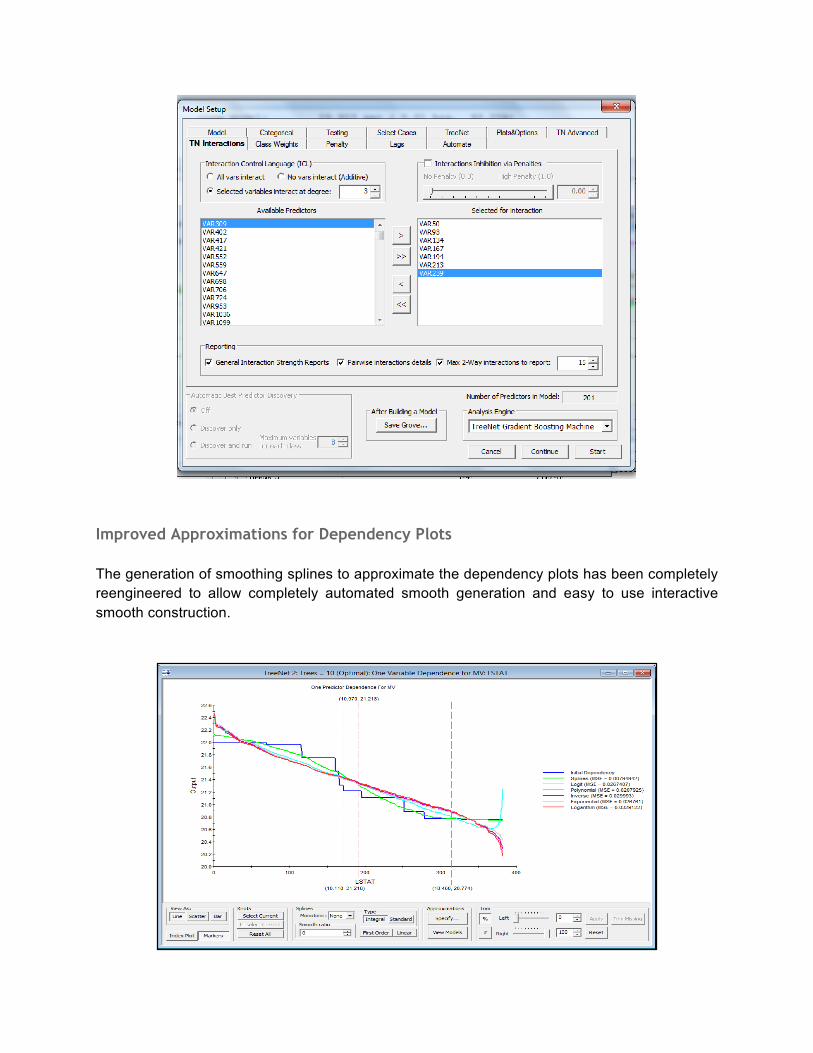
Improved Approximations for Dependency Plots The generation of smoothing splines to approximate the dependency plots has been completely reengineered to allow completely automated smooth generation and easy to use interactive smooth construction.
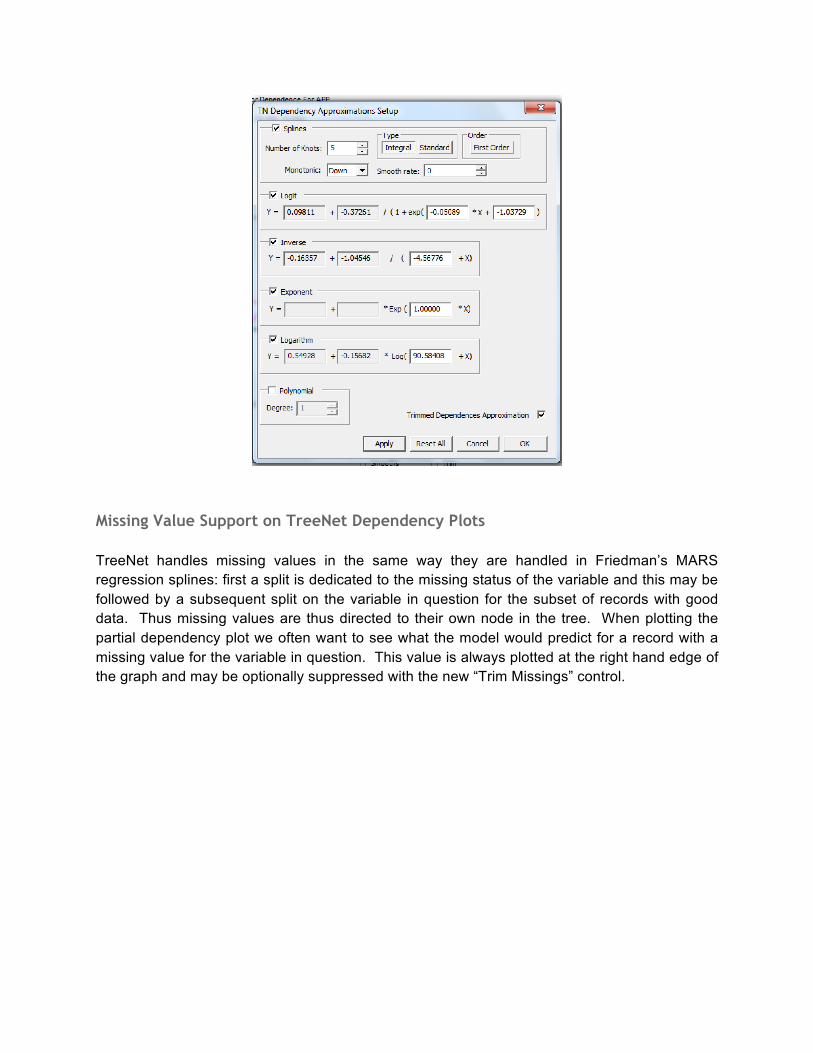
Missing Value Support on TreeNet Dependency Plots TreeNet handles missing values in the same way they are handled in Friedman’s MARS regression splines: first a split is dedicated to the missing status of the variable and this may be followed by a subsequent split on the variable in question for the subset of records with good data. Thus missing values are thus directed to their own node in the tree. When plotting the partial dependency plot we often want to see what the model would predict for a record with a missing value for the variable in question. This value is always plotted at the right hand edge of the graph and may be optionally suppressed with the new “Trim Missings” control.
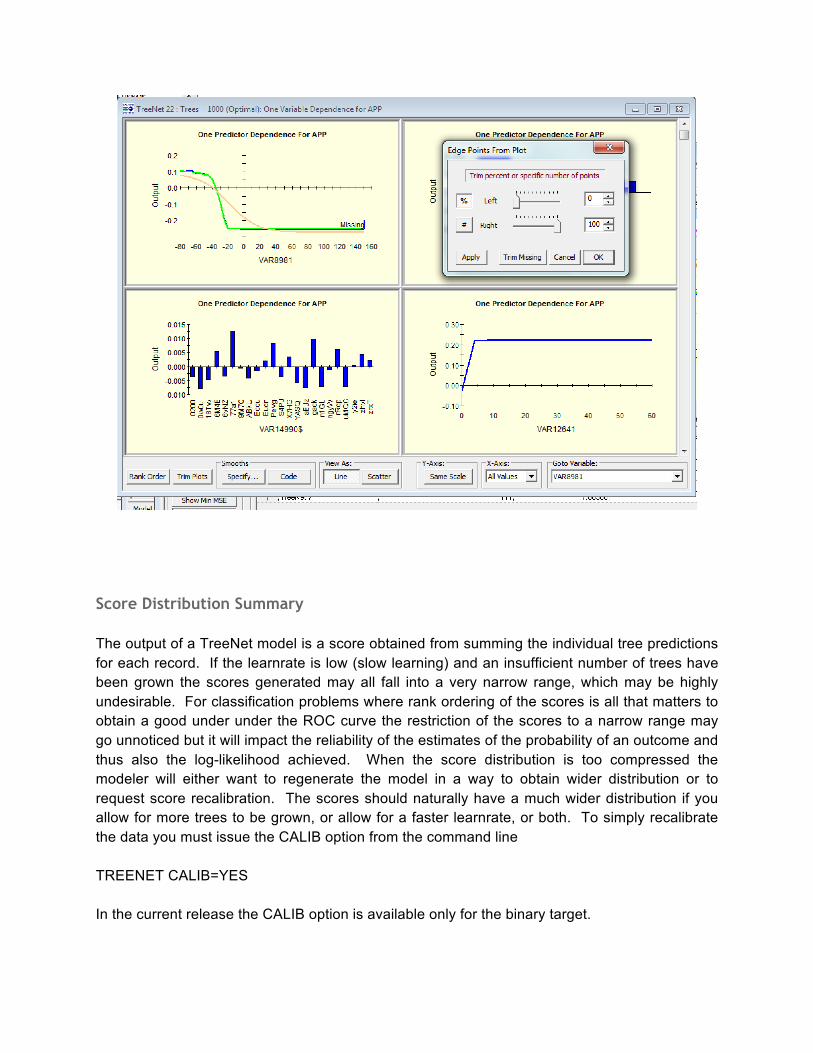
Score Distribution Summary The output of a TreeNet model is a score obtained from summing the individual tree predictions for each record. If the learnrate is low (slow learning) and an insufficient number of trees have been grown the scores generated may all fall into a very narrow range, which may be highly undesirable. For classification problems where rank ordering of the scores is all that matters to obtain a good under under the ROC curve the restriction of the scores to a narrow range may go unnoticed but it will impact the reliability of the estimates of the probability of an outcome and thus also the log-likelihood achieved. When the score distribution is too compressed the modeler will either want to regenerate the model in a way to obtain wider distribution or to request score recalibration. The scores should naturally have a much wider distribution if you allow for more trees to be grown, or allow for a faster learnrate, or both. To simply recalibrate the data you must issue the CALIB option from the command line TREENET CALIB=YES In the current release the CALIB option is available only for the binary target.
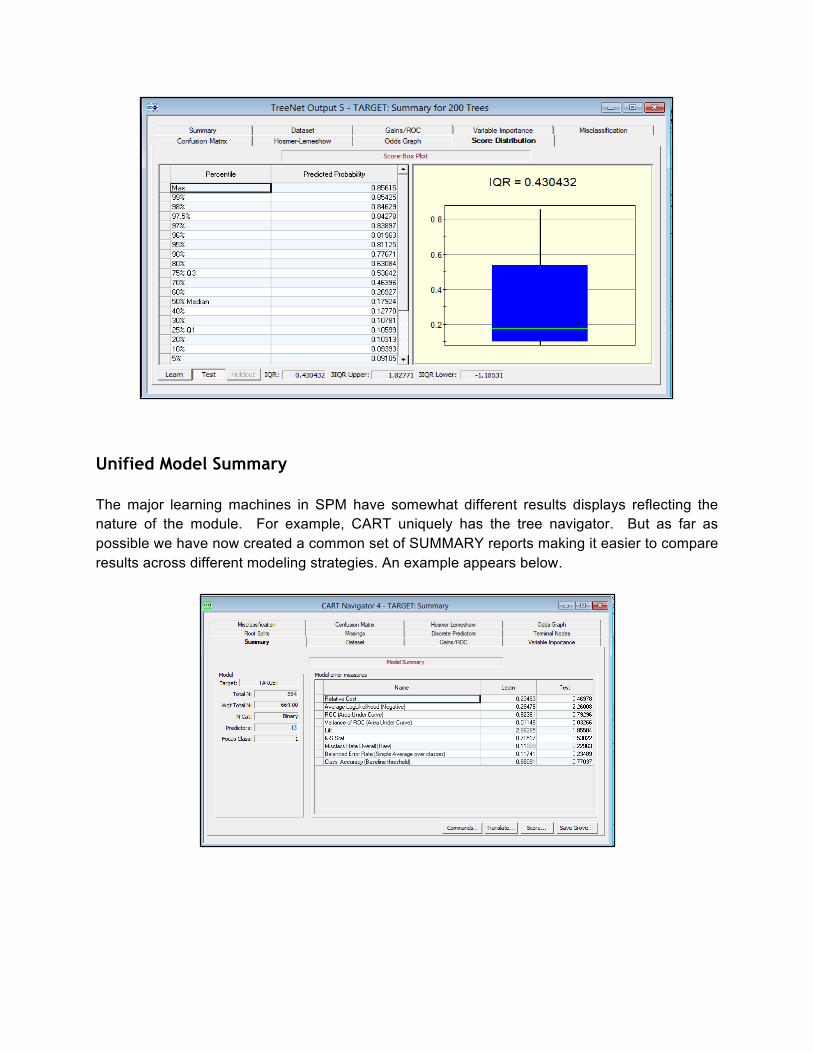
Unified Model Summary The major learning machines in SPM have somewhat different results displays reflecting the nature of the module. For example, CART uniquely has the tree navigator. But as far as possible we have now created a common set of SUMMARY reports making it easier to compare results across different modeling strategies. An example appears below.
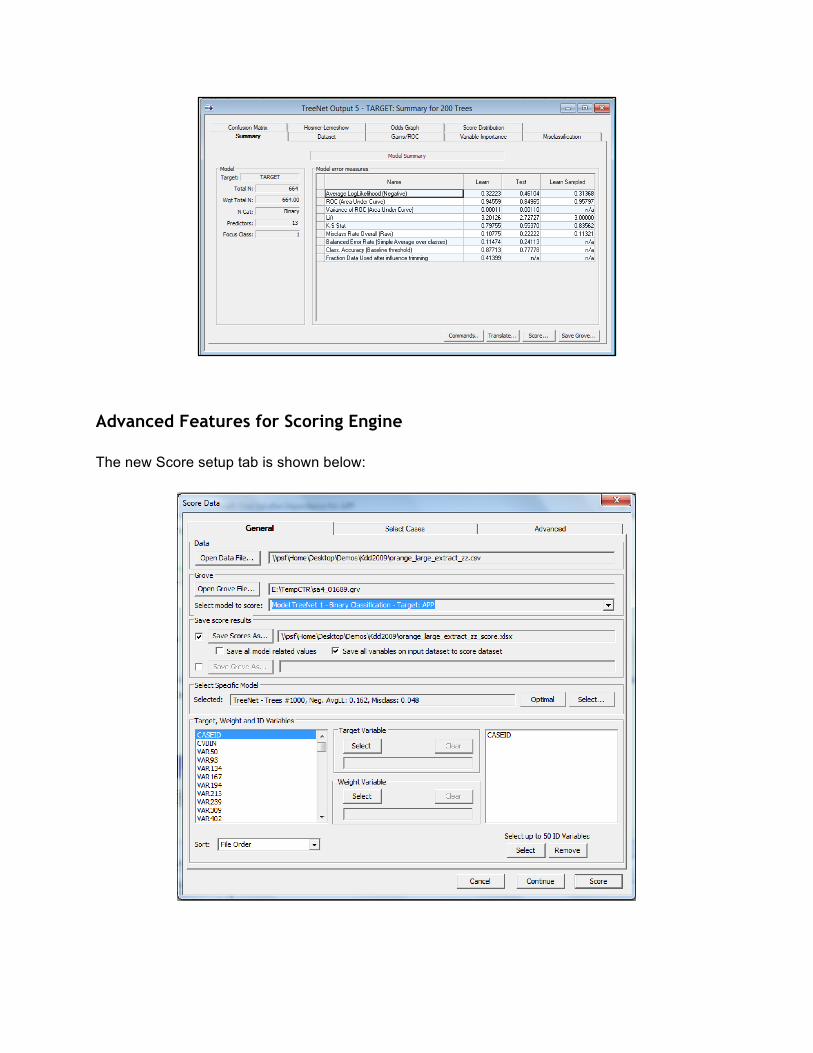
Advanced Features for Scoring Engine The new Score setup tab is shown below:
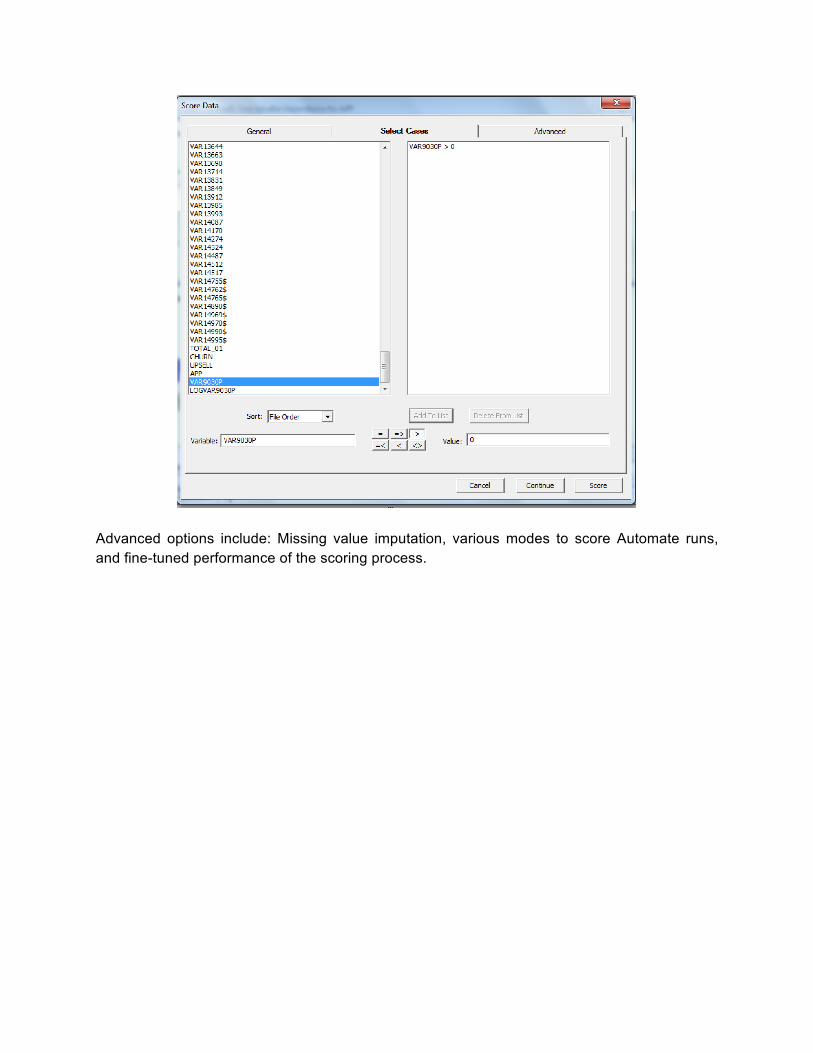
Advanced options include: Missing value imputation, various modes to score Automate runs, and fine-tuned performance of the scoring process.
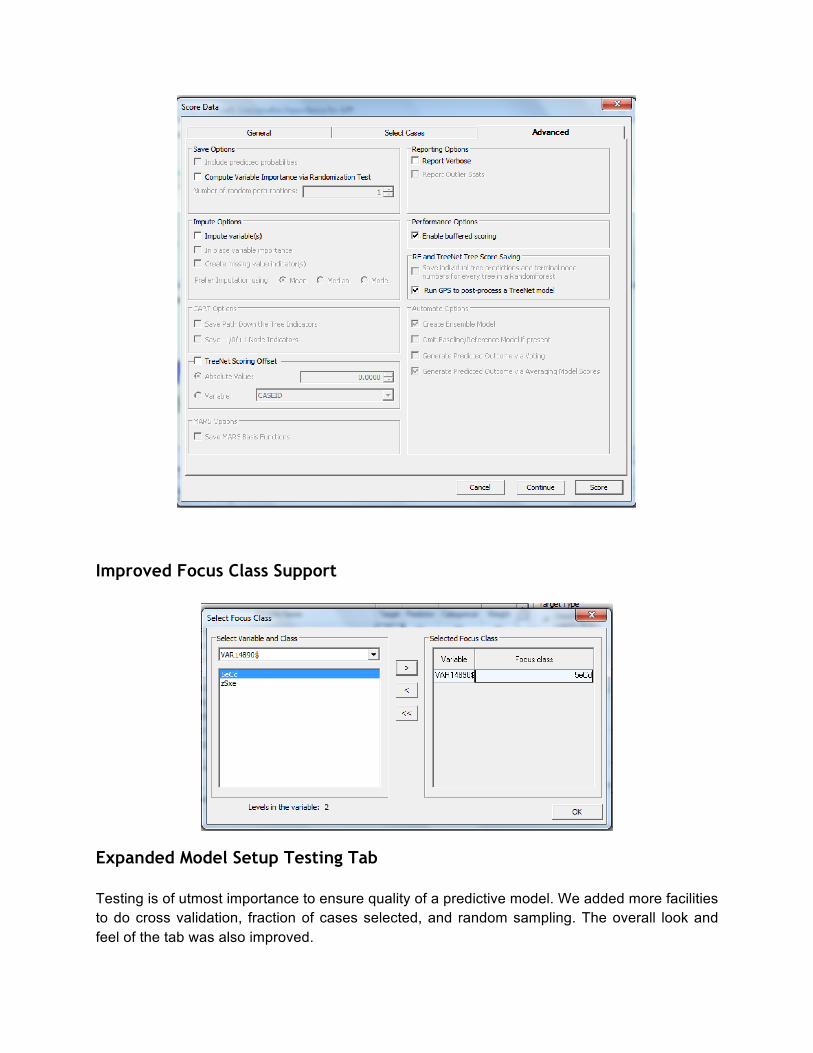
Improved Focus Class Support
Expanded Model Setup Testing Tab Testing is of utmost importance to ensure quality of a predictive model. We added more facilities to do cross validation, fraction of cases selected, and random sampling. The overall look and feel of the tab was also improved.
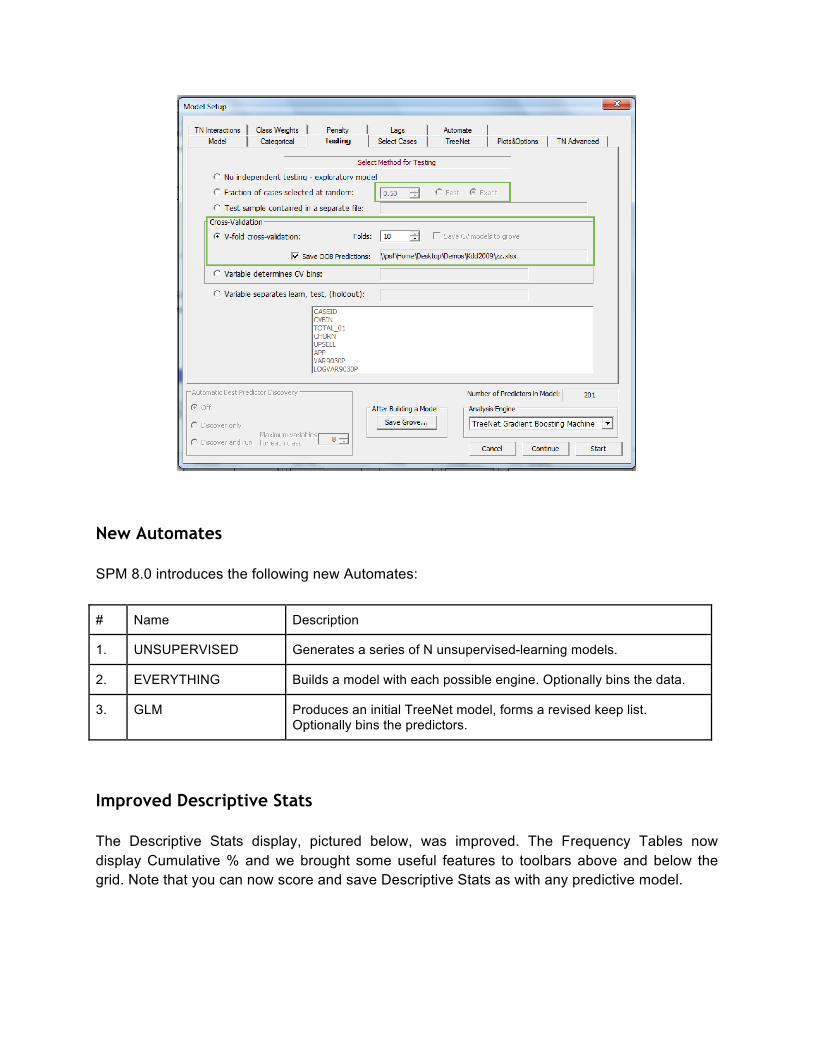
New Automates SPM 8.0 introduces the following new Automates:
# Name Description
1. UNSUPERVISED Generates a series of N unsupervised-learning models.
2. EVERYTHING Builds a model with each possible engine. Optionally bins the data.
3. GLM Produces an initial TreeNet model, forms a revised keep list. Optionally bins the predictors.
Improved Descriptive Stats The Descriptive Stats display, pictured below, was improved. The Frequency Tables now display Cumulative % and we brought some useful features to toolbars above and below the grid. Note that you can now score and save Descriptive Stats as with any predictive model.
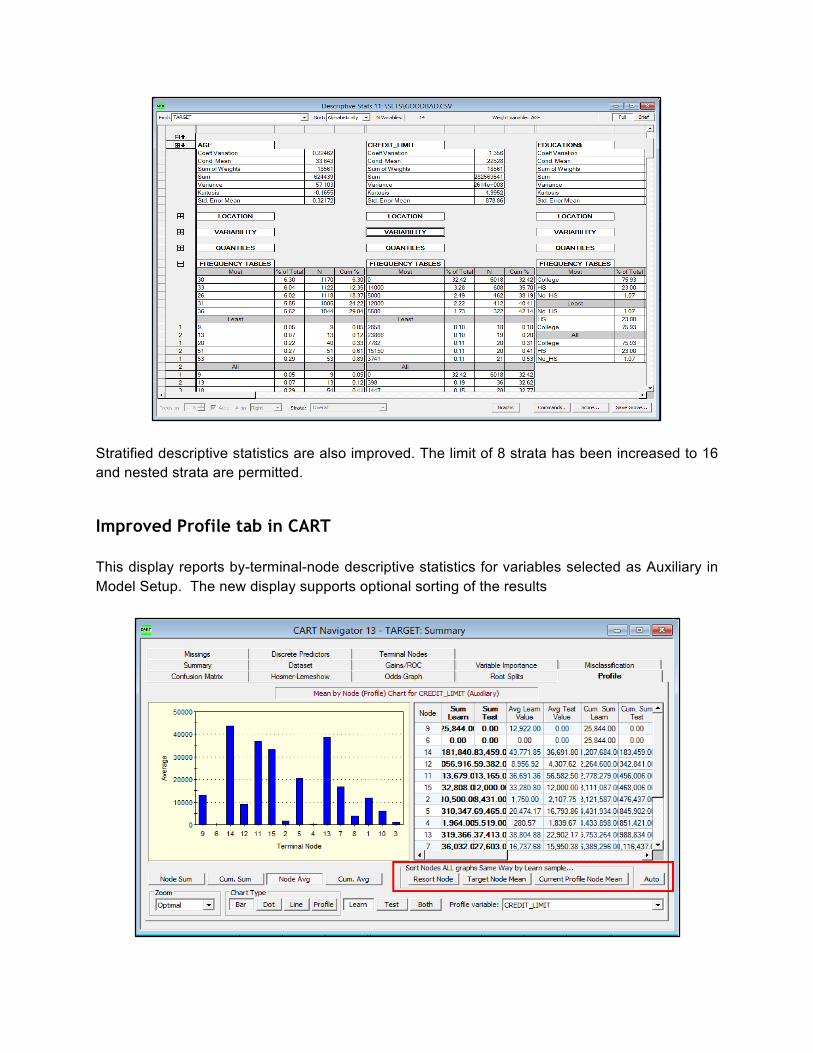
Stratified descriptive statistics are also improved. The limit of 8 strata has been increased to 16 and nested strata are permitted.
Improved Profile tab in CART This display reports by-terminal-node descriptive statistics for variables selected as Auxiliary in Model Setup. The new display supports optional sorting of the results
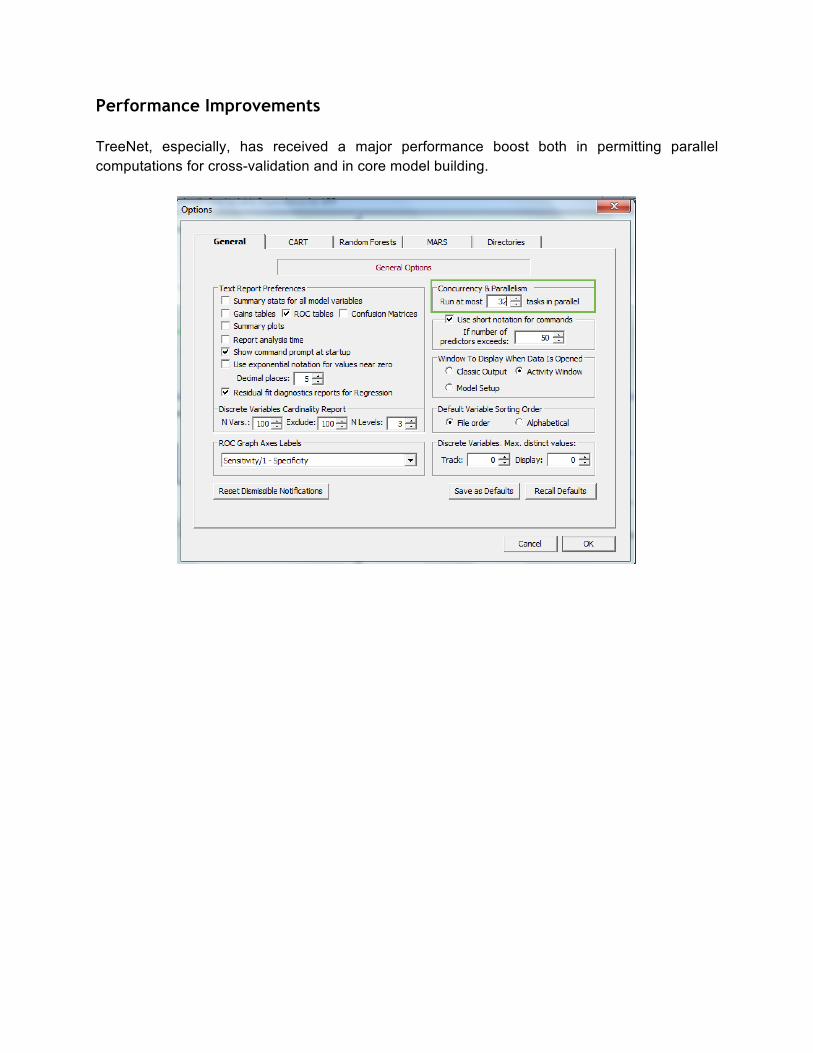
Performance Improvements TreeNet, especially, has received a major performance boost both in permitting parallel computations for cross-validation and in core model building.
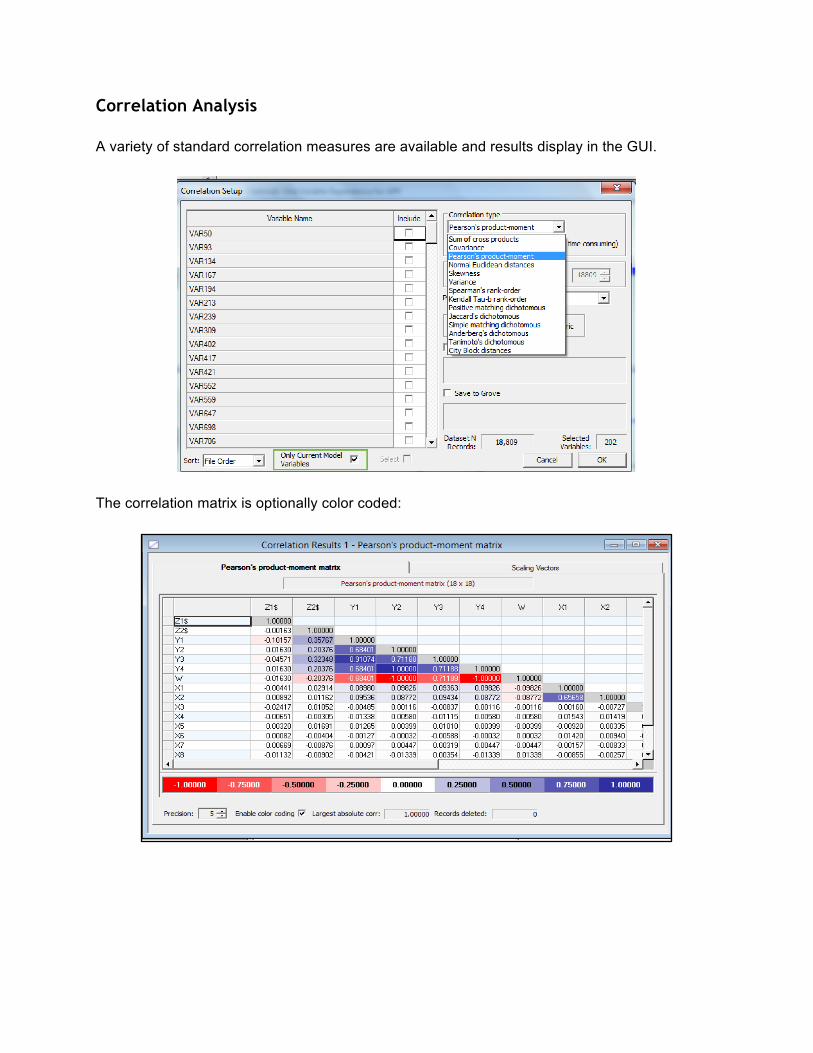
Correlation Analysis A variety of standard correlation measures are available and results display in the GUI.
The correlation matrix is optionally color coded:
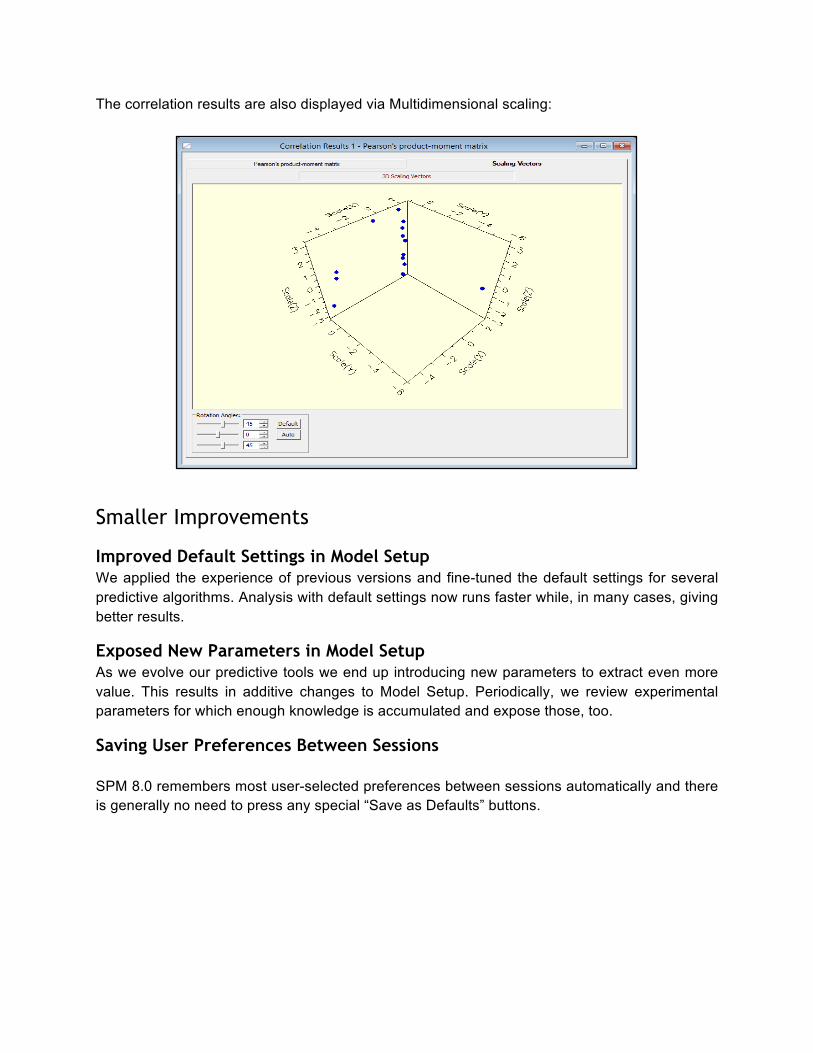
The correlation results are also displayed via Multidimensional scaling:
Smaller Improvements
Improved Default Settings in Model Setup We applied the experience of previous versions and fine-tuned the default settings for several predictive algorithms. Analysis with default settings now runs faster while, in many cases, giving better results.
Exposed New Parameters in Model Setup As we evolve our predictive tools we end up introducing new parameters to extract even more value. This results in additive changes to Model Setup. Periodically, we review experimental parameters for which enough knowledge is accumulated and expose those, too.
Saving User Preferences Between Sessions SPM 8.0 remembers most user-selected preferences between sessions automatically and there is generally no need to press any special “Save as Defaults” buttons.