Splunk 7.0の概要及び新機能
26
© 2017 SPLUNK INC. © 2017 SPLUNK INC. Splunk 7.0の概要及び新機能 モニタリングから問題解決までの統合を実現 池山 邦彦 | Sr. Sales Engineer, Splunk Services Japan Oct 2017 | Version 1.0
-
Upload
kunihiko-ikeyama -
Category
Technology
-
view
673 -
download
2
Transcript of Splunk 7.0の概要及び新機能
© 2017 SPLUNK INC.© 2017 SPLUNK INC.
Splunk 7.0の概要及び新機能モニタリングから問題解決までの統合を実現
池山邦彦 | Sr. Sales Engineer, Splunk Services Japan
Oct 2017 | Version 1.0
© 2017 SPLUNK INC.
During the course of this presentation, we may make forward-looking statements regarding future events or the expected performance of the company. We caution you that such statements reflect our current expectations and estimates based on factors currently known to us and that actual events or results could differ materially. For important factors that may cause actual results to differ from those contained in our forward-looking statements, please review our filings with the SEC.
The forward-looking statements made in this presentation are being made as of the time and date of its live presentation. If reviewed after its live presentation, this presentation may not contain current or accurate information. We do not assume any obligation to update any forward-looking statements we may make. In addition, any information about our roadmap outlines our general product direction and is subject to change at any time without notice. It is for informational purposes only and shall not be incorporated into any contract or other commitment. Splunk undertakes no obligation either to develop the features or functionality described or to include any such feature or functionality in a future release.
Splunk, Splunk>, Listen to Your Data, The Engine for Machine Data, Splunk Cloud, Splunk Light and SPL are trademarks and registered trademarks of Splunk Inc. in the United States and other countries. All other brand names, product names, or trademarks belong to their respective owners. © 2017 Splunk Inc. All rights reserved.
Forward-Looking Statements
THIS SLIDE IS REQUIRED FOR ALL 3 PARTY PRESENTATIONS.
© 2017 SPLUNK INC.
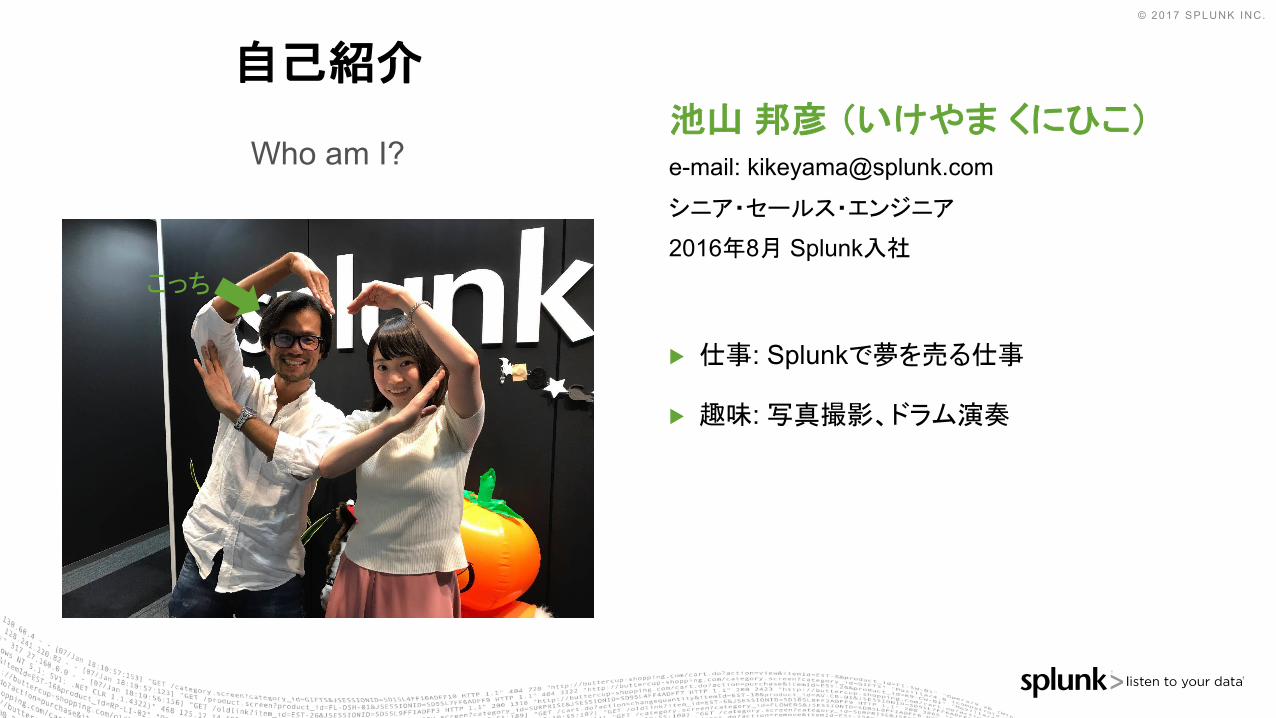
自己紹介
Who am I?池山邦彦 (いけやま くにひこ)e-mail: [email protected]
シニア・セールス・エンジニア
2016年8月 Splunk入社
▶ 仕事: Splunkで夢を売る仕事
▶ 趣味:写真撮影、ドラム演奏
こっち
© 2017 SPLUNK INC.
MACHINE DATA データは語りかける。 君は聞いているか?

© 2017 SPLUNK INC.
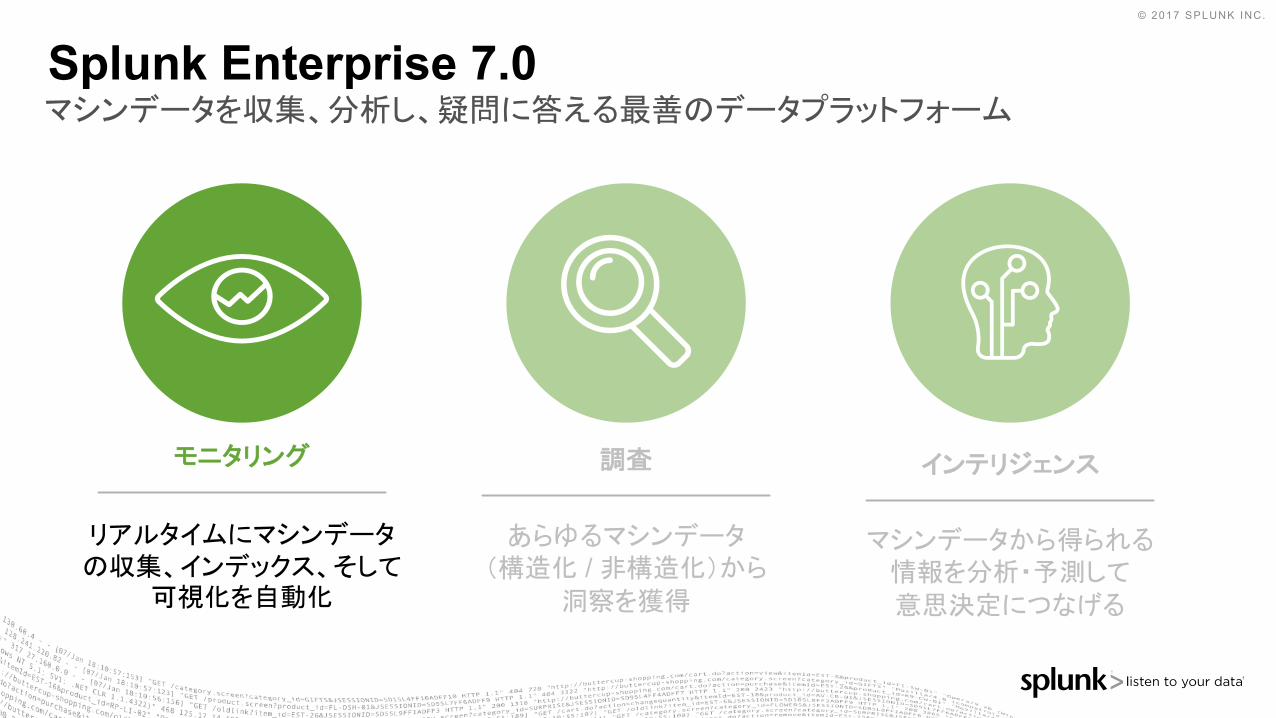
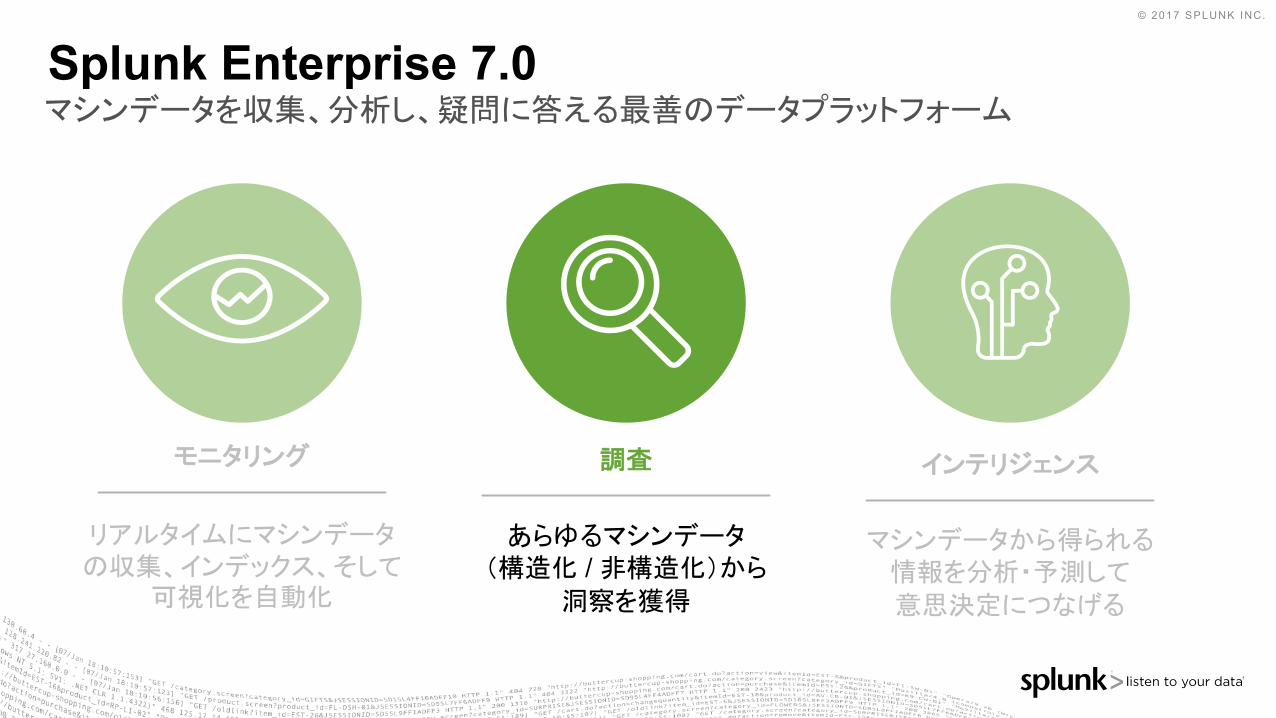
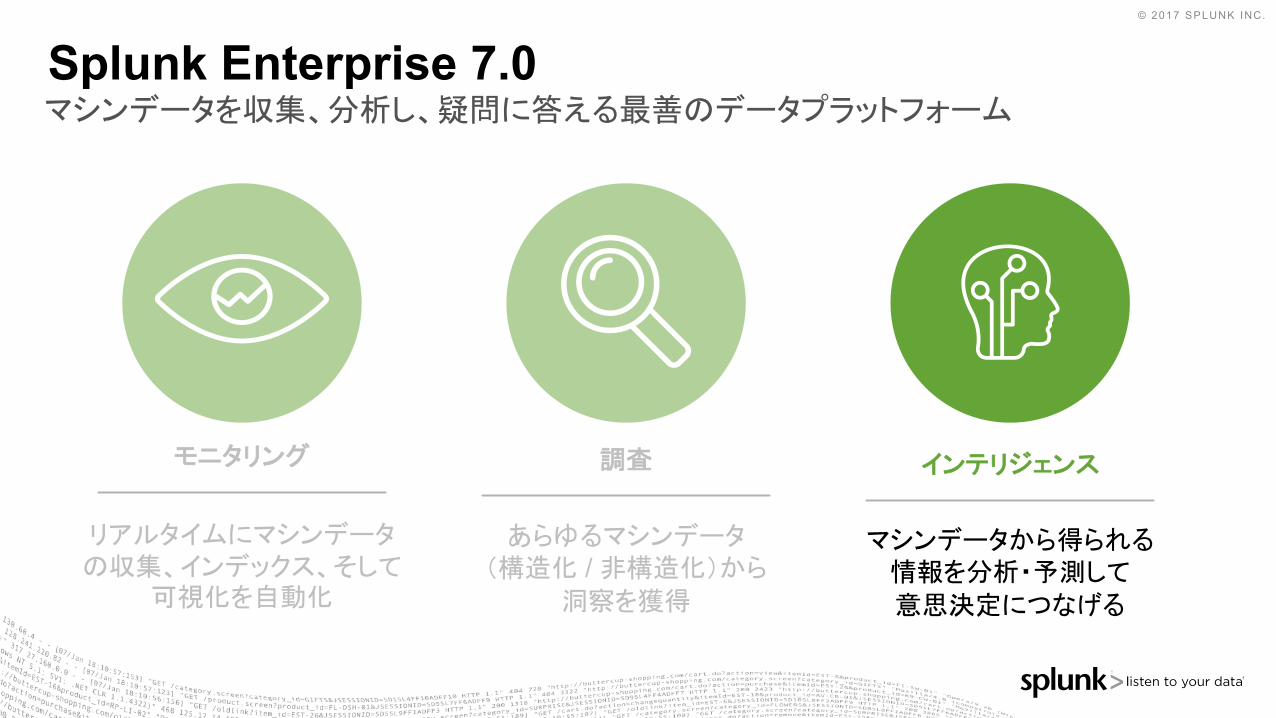
Splunk Enterprise 7.0マシンデータを収集、分析し、疑問に答える最善のデータプラットフォーム
リアルタイムにマシンデータの収集、インデックス、そして
可視化を自動化
モニタリング
あらゆるマシンデータ(構造化 / 非構造化)から
洞察を獲得
調査
マシンデータから得られる情報を分析・予測して
意思決定につなげる
インテリジェンス
© 2017 SPLUNK INC.
Splunk Enterprise 7.0マシンデータを収集、分析し、疑問に答える最善のデータプラットフォーム
リアルタイムにマシンデータの収集、インデックス、そして
可視化を自動化
モニタリング
あらゆるマシンデータ(構造化 / 非構造化)から
洞察を獲得
調査
マシンデータから得られる情報を分析・予測して
意思決定につなげる
インテリジェンス

© 2017 SPLUNK INC.
メトリクスとイベント統合が困難な全く異なるマシンデータソース...それも今は昔の話メトリクス (Metrics)▶ 特定のプロセスやアクティビティを表現する数字
▶ 一定の時間間隔で測定i.e., 時系列データ
▶ メトリクスの例:• システムメトリクス (CPU、メモリ、ディスク)• インフラメトリクス (AWS CloudWatch)
• ウェブトラッキング (Google Analytics)• アプリケーションエージェント (APM、エラートラッキング)
イベント (Events)▶ 時間経過とともに発生する固有のイベントの不変の記録
▶ 3通りの方法で取得: テキスト、構造化データ、バイナリ▶ イベントの例:
• サーバーログ (syslog, journald)• ファイアウォールやIDSのシステムログ
• ソーシャルメディアのフィード (Twitter…)• アプリケーションやミドルウェエア、プラットフォームのログ
(log4j, log4net, Apache, MySQL, AWS)
Timestamp Metric Name Value Dimensions
1481050800 os.cpu.user 42.12345 hq:us-west-1
Sample Metric
[29/Aug/2017 08:47:05:316503] "POST /cart.do?uid=84e8d742-a31d69&action=remove&&product_id=BS-2&JSESSIONID=SD6SAL4FF1ADFF9 HTTP 1.1" 200 2569 "http://www.buttercupenterprises.com/product.screen? product_id=BS-2" "Mozilla/5.0 (Intel Mac OS X 10_12_2) AppleWebKit/537.36 (KHTML, like Gecko) Chrome/57.0.2957.0 Safari/537.36" 98
Sample Log
Equivalent to 1 metric value
モニタリング
© 2017 SPLUNK INC.
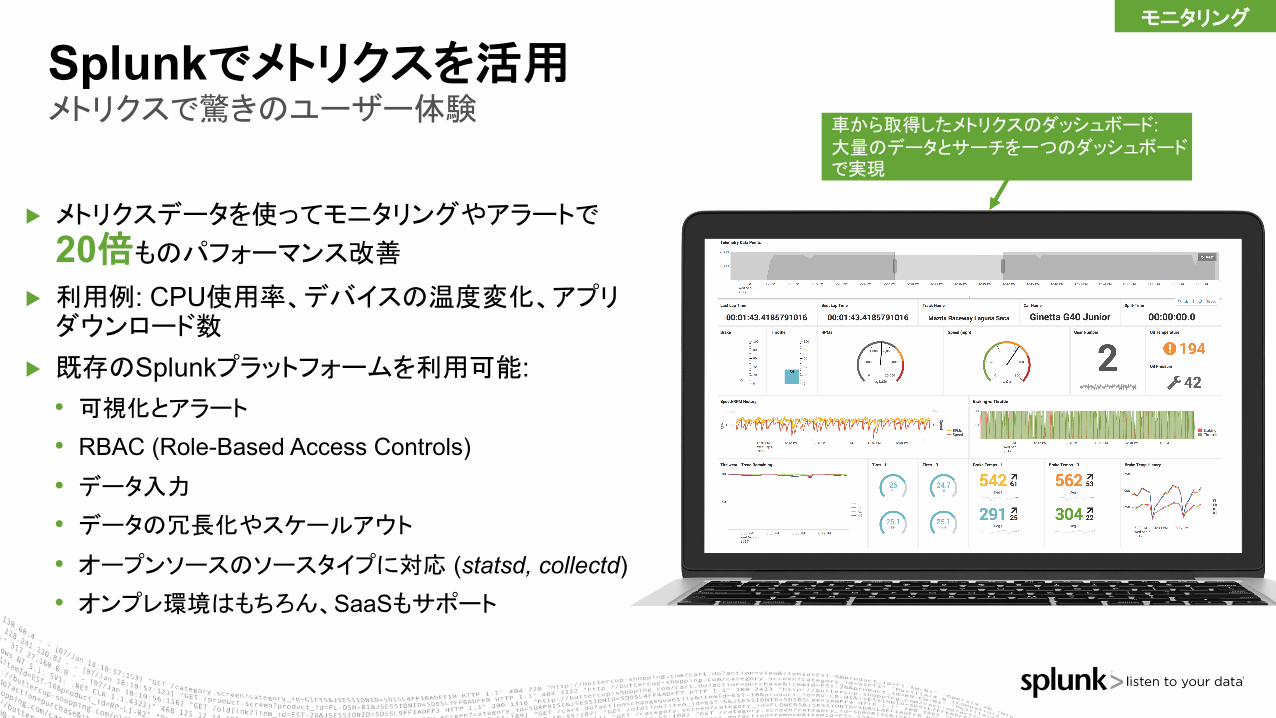
▶ メトリクスデータを使ってモニタリングやアラートで
20倍ものパフォーマンス改善▶ 利用例: CPU使用率、デバイスの温度変化、アプリダウンロード数
▶ 既存のSplunkプラットフォームを利用可能:• 可視化とアラート• RBAC (Role-Based Access Controls)• データ入力• データの冗長化やスケールアウト• オープンソースのソースタイプに対応 (statsd, collectd)• オンプレ環境はもちろん、SaaSもサポート
Splunkでメトリクスを活用メトリクスで驚きのユーザー体験
車から取得したメトリクスのダッシュボード:大量のデータとサーチを一つのダッシュボードで実現
モニタリング
© 2017 SPLUNK INC.
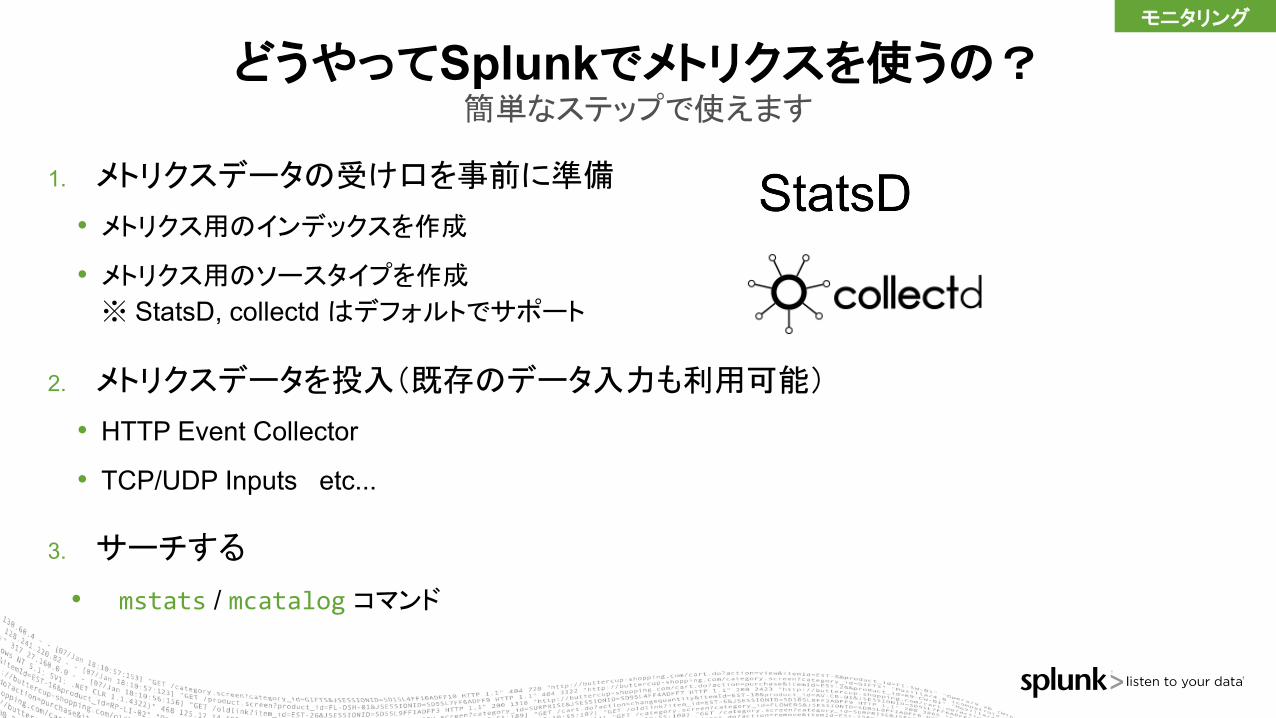
1. メトリクスデータの受け口を事前に準備
• メトリクス用のインデックスを作成• メトリクス用のソースタイプを作成※ StatsD, collectdはデフォルトでサポート
2. メトリクスデータを投入(既存のデータ入力も利用可能)
• HTTP Event Collector
• TCP/UDP Inputs etc...
3. サーチする
• mstats / mcatalog コマンド
どうやってSplunkでメトリクスを使うの?簡単なステップで使えます
モニタリング
© 2017 SPLUNK INC.
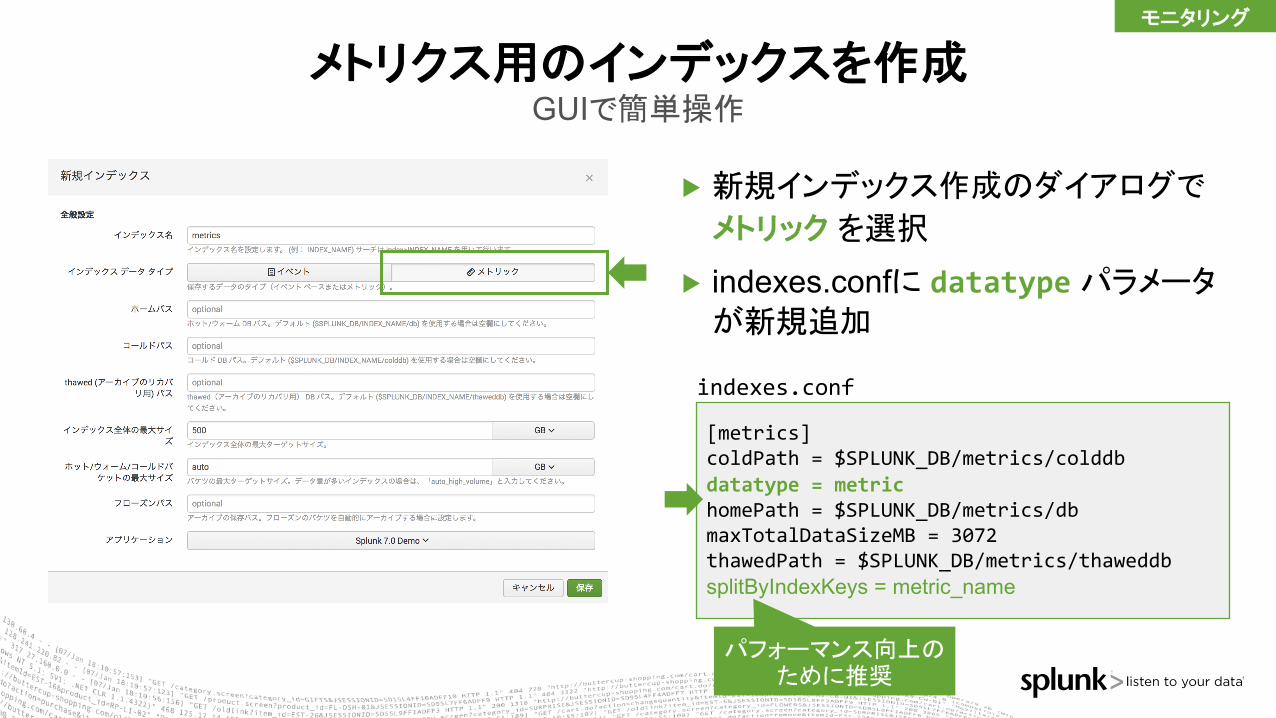
▶ 新規インデックス作成のダイアログで
メトリック を選択
▶ indexes.confに datatypeパラメータが新規追加
メトリクス用のインデックスを作成GUIで簡単操作
[metrics]coldPath = $SPLUNK_DB/metrics/colddbdatatype = metrichomePath = $SPLUNK_DB/metrics/dbmaxTotalDataSizeMB = 3072thawedPath = $SPLUNK_DB/metrics/thaweddbsplitByIndexKeys = metric_name
モニタリング
indexes.conf
パフォーマンス向上のために推奨
© 2017 SPLUNK INC.
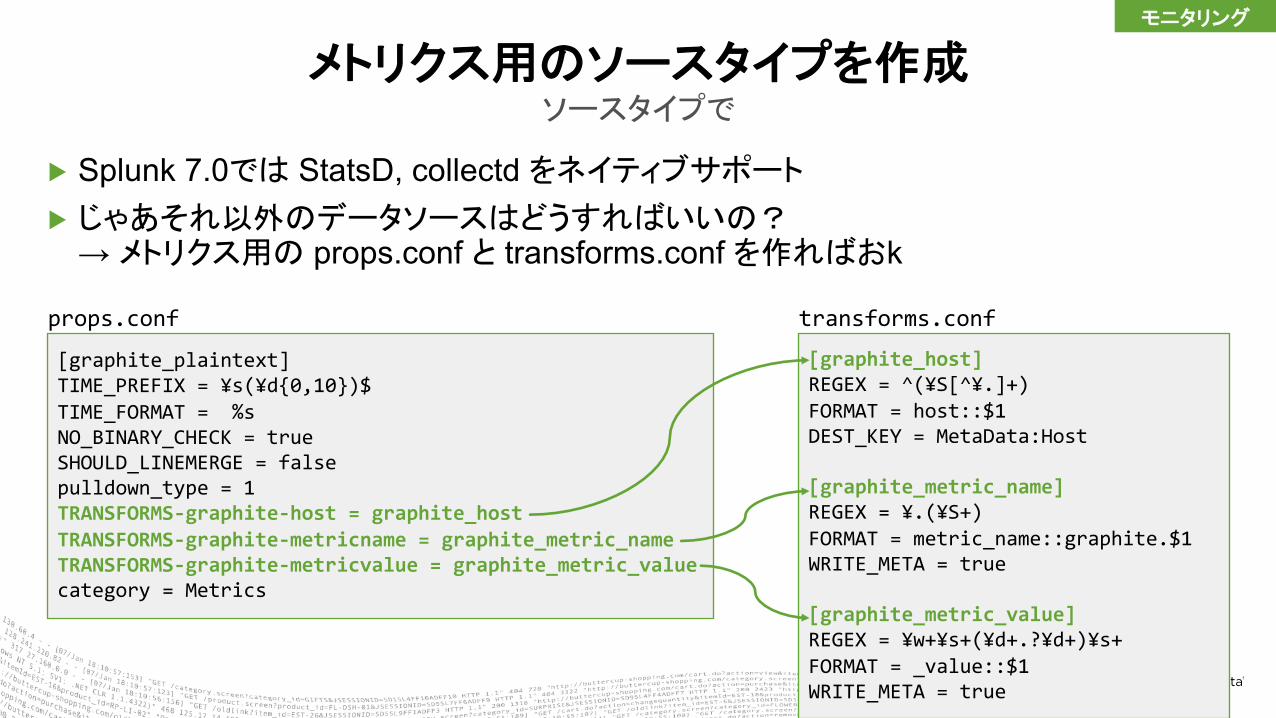
▶ Splunk 7.0では StatsD, collectd をネイティブサポート▶ じゃあそれ以外のデータソースはどうすればいいの?
→ メトリクス用の props.conf と transforms.conf を作ればおk
メトリクス用のソースタイプを作成ソースタイプで
[graphite_plaintext]TIME_PREFIX = ¥s(¥d{0,10})$TIME_FORMAT = %sNO_BINARY_CHECK = trueSHOULD_LINEMERGE = falsepulldown_type = 1TRANSFORMS-graphite-host = graphite_hostTRANSFORMS-graphite-metricname = graphite_metric_nameTRANSFORMS-graphite-metricvalue = graphite_metric_valuecategory = Metrics
[graphite_host]REGEX = ^(¥S[^¥.]+)FORMAT = host::$1DEST_KEY = MetaData:Host
[graphite_metric_name]REGEX = ¥.(¥S+)FORMAT = metric_name::graphite.$1WRITE_META = true
[graphite_metric_value]REGEX = ¥w+¥s+(¥d+.?¥d+)¥s+FORMAT = _value::$1WRITE_META = true
props.conf transforms.conf
モニタリング
© 2017 SPLUNK INC.
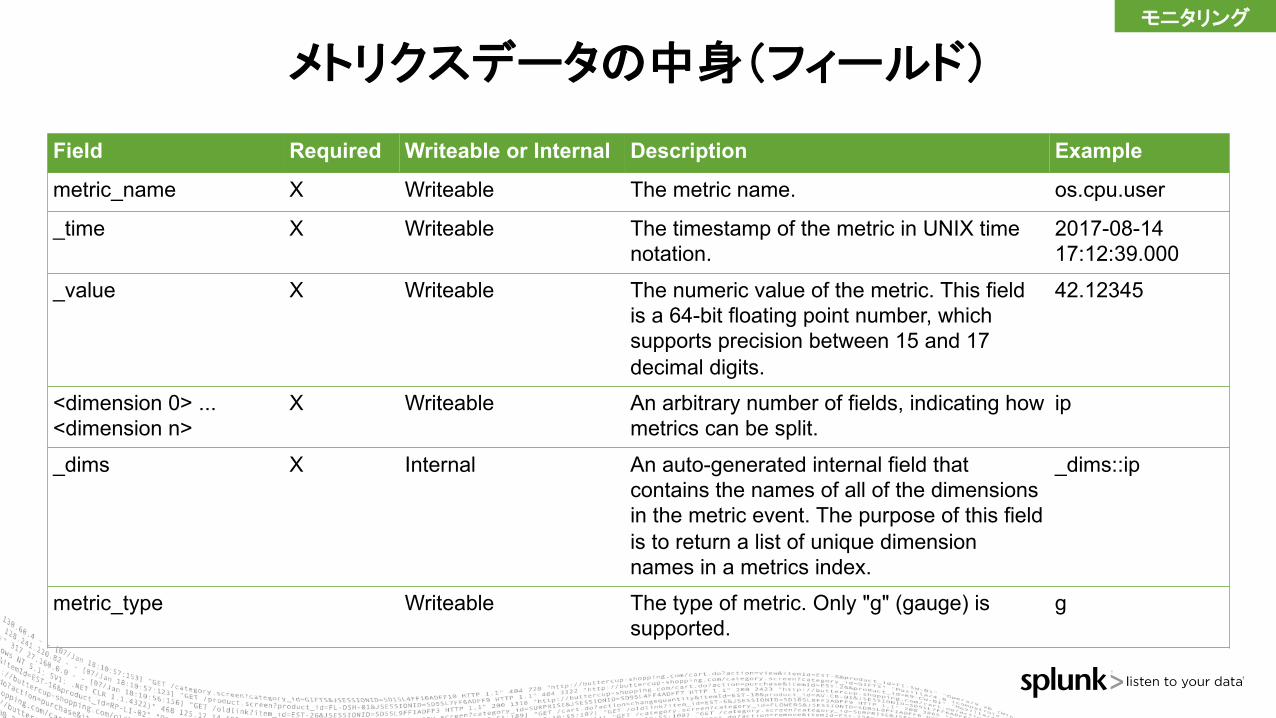
Field Required Writeable or Internal Description Example
metric_name X Writeable The metric name. os.cpu.user
_time X Writeable The timestamp of the metric in UNIX time notation.
2017-08-14 17:12:39.000
_value X Writeable The numeric value of the metric. This field is a 64-bit floating point number, which supports precision between 15 and 17 decimal digits.
42.12345
<dimension 0> ...<dimension n>
X Writeable An arbitrary number of fields, indicating how metrics can be split.
ip
_dims X Internal An auto-generated internal field that contains the names of all of the dimensions in the metric event. The purpose of this field is to return a list of unique dimension names in a metrics index.
_dims::ip
metric_type Writeable The type of metric. Only "g" (gauge) is supported.
g
メトリクスデータの中身(フィールド)モニタリング

© 2017 SPLUNK INC.
Field Required Writeable or Internal Description Example
source Internal The source of the metrics data. udp:8125
host X Internal The origin host. A standard field in Splunk software.
server007
index X Internal The metrics index name. A standard field in Splunk software.
metricsindex
sourcetype X Internal The data structure of the metric. A standard field in Splunk software.
statsd
メトリクスデータの中身(フィールド)モニタリング
© 2017 SPLUNK INC.
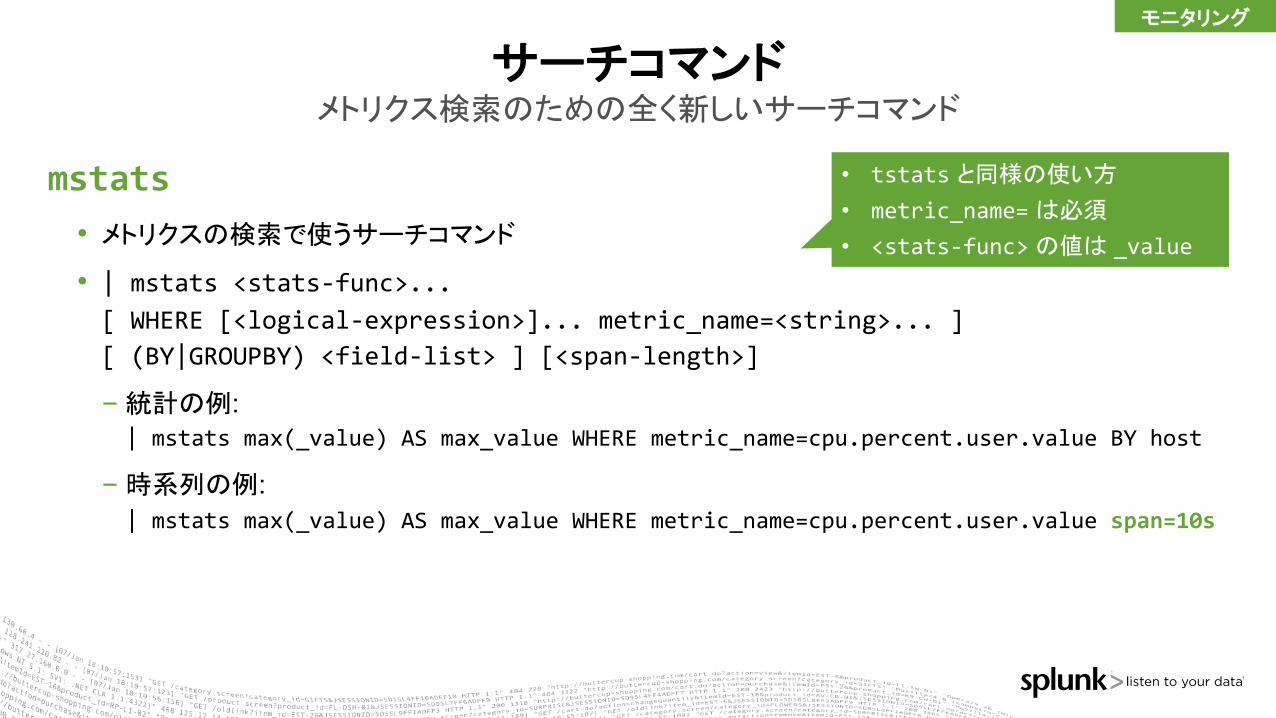
mstats• メトリクスの検索で使うサーチコマンド• | mstats <stats-func>... [ WHERE [<logical-expression>]... metric_name=<string>... ] [ (BY|GROUPBY) <field-list> ] [<span-length>]
-統計の例: | mstats max(_value) AS max_value WHERE metric_name=cpu.percent.user.value BY host
-時系列の例: | mstats max(_value) AS max_value WHERE metric_name=cpu.percent.user.value span=10s
サーチコマンドメトリクス検索のための全く新しいサーチコマンド
• tstats と同様の使い方• metric_name=は必須• <stats-func>の値は _value
モニタリング
© 2017 SPLUNK INC.
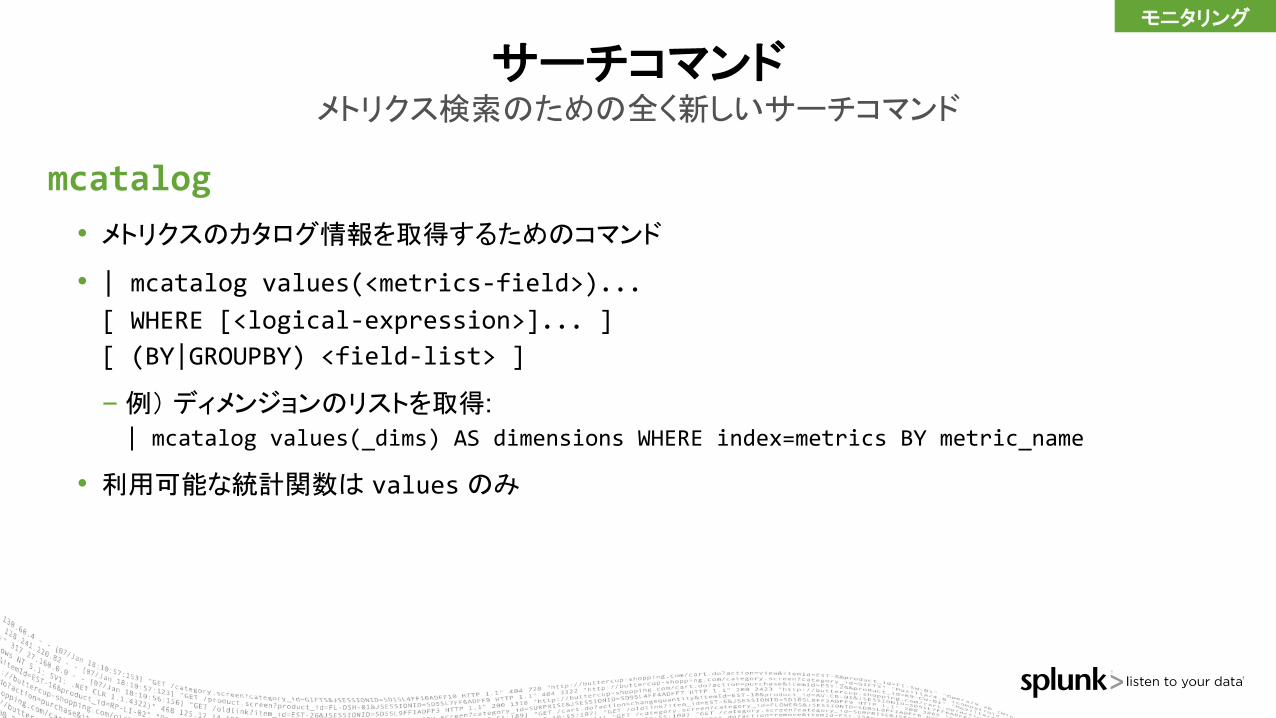
mcatalog• メトリクスのカタログ情報を取得するためのコマンド• | mcatalog values(<metrics-field>)... [ WHERE [<logical-expression>]... ] [ (BY|GROUPBY) <field-list> ]
-例) ディメンジョンのリストを取得: | mcatalog values(_dims) AS dimensions WHERE index=metrics BY metric_name
• 利用可能な統計関数は valuesのみ
サーチコマンドメトリクス検索のための全く新しいサーチコマンド
モニタリング

© 2017 SPLUNK INC.
▶ Metricsマニュアルhttp://docs.splunk.com/Documentation/Splunk/7.0.0/Metrics/Overview
参考資料モニタリング
© 2017 SPLUNK INC.
Splunk Enterprise 7.0マシンデータを収集、分析し、疑問に答える最善のデータプラットフォーム
リアルタイムにマシンデータの収集、インデックス、そして
可視化を自動化
モニタリング
あらゆるマシンデータ(構造化 / 非構造化)から
洞察を獲得
調査
マシンデータから得られる情報を分析・予測して
意思決定につなげる
インテリジェンス
© 2017 SPLUNK INC.
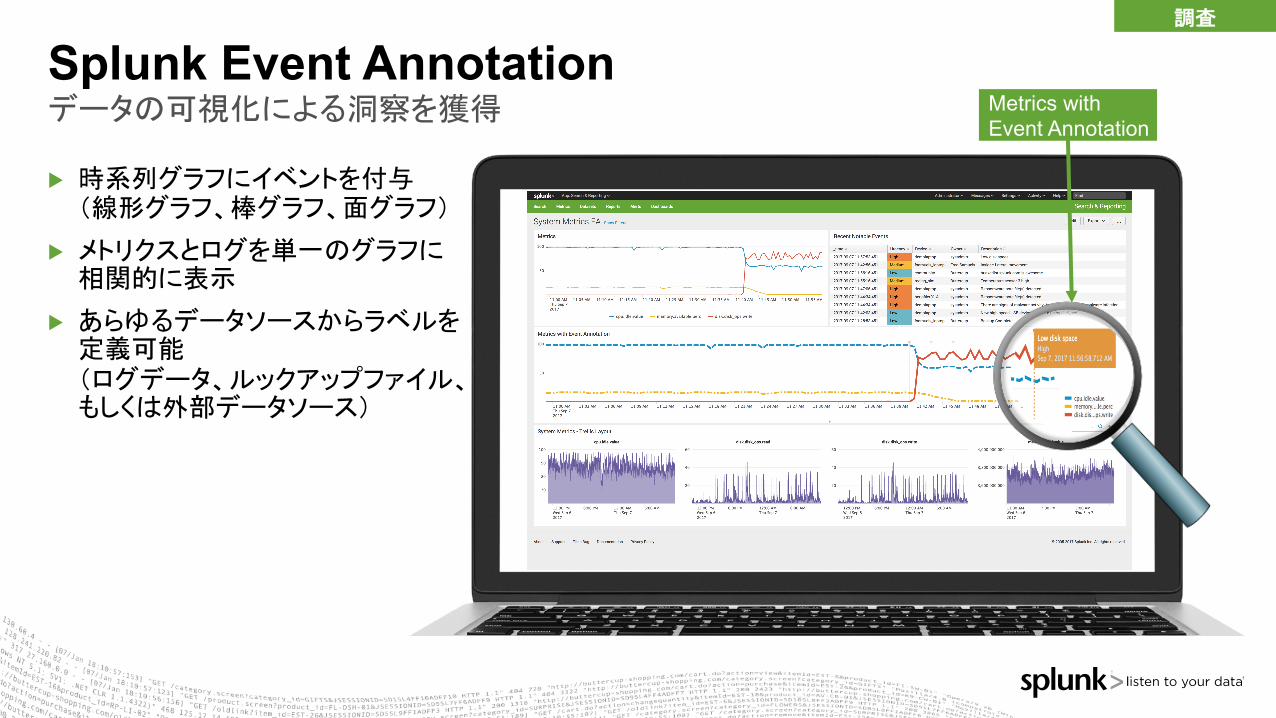
▶ 時系列グラフにイベントを付与(線形グラフ、棒グラフ、面グラフ)
▶ メトリクスとログを単一のグラフに相関的に表示
▶ あらゆるデータソースからラベルを定義可能(ログデータ、ルックアップファイル、もしくは外部データソース)
Splunk Event Annotationデータの可視化による洞察を獲得
調査
Metrics with Event Annotation

© 2017 SPLUNK INC.
DEMOSPLUNK ENTERPRISE 7.0
METRICS & EVENT ANNOTATION
© 2017 SPLUNK INC.
Splunk Enterprise 7.0マシンデータを収集、分析し、疑問に答える最善のデータプラットフォーム
リアルタイムにマシンデータの収集、インデックス、そして
可視化を自動化
モニタリング
あらゆるマシンデータ(構造化 / 非構造化)から
洞察を獲得
調査
マシンデータから得られる情報を分析・予測して
意思決定につなげる
インテリジェンス
© 2017 SPLUNK INC.
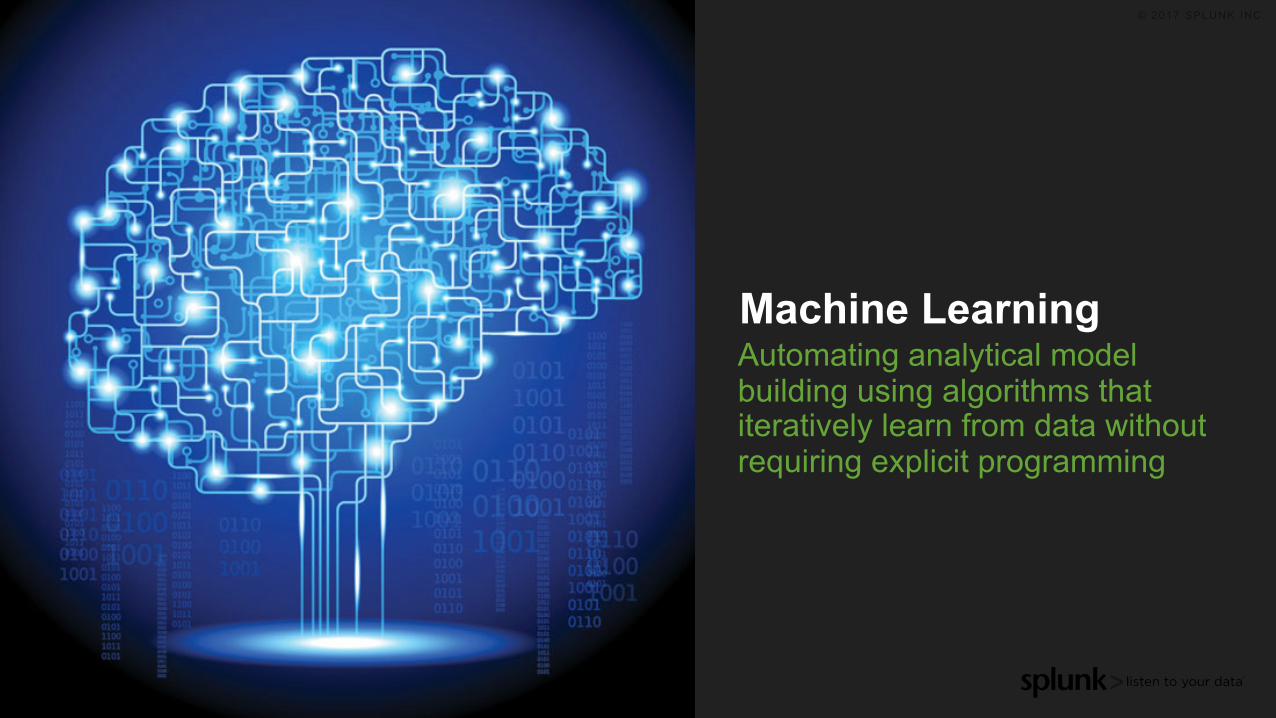
Machine LearningAutomating analytical model building using algorithms that iteratively learn from data without requiring explicit programming
© 2017 SPLUNK INC.
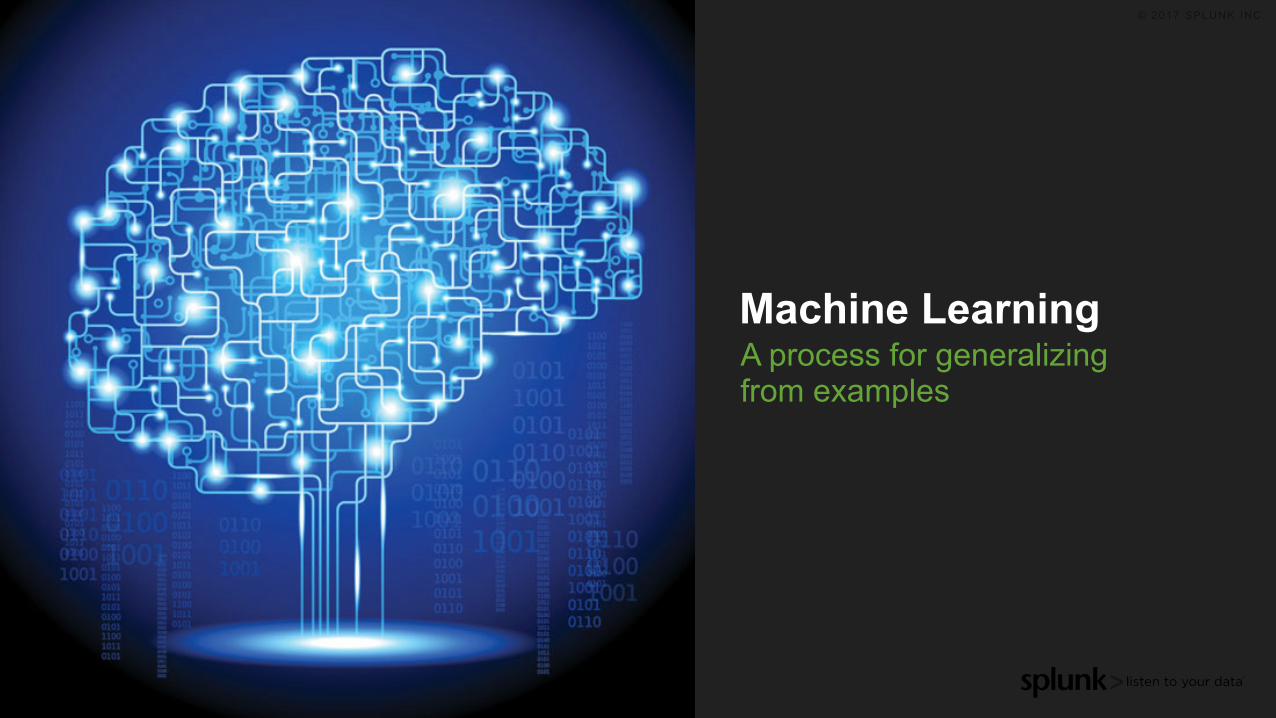
Machine LearningA process for generalizingfrom examples

© 2017 SPLUNK INC.
SPLUNK SEARCH PREMIUM SOLUTIONS MACHINE LEARNING TOOLKIT
Platform for Operational Intelligence
Platform for turning machine data into answers
Splunk Machine Learningマシンデータから得られる情報を分析・予測して意思決定につなげるための最善のプラットフォーム
インテリジェンス

© 2017 SPLUNK INC.
▶ Showcases: IT運用やセキュリティ、ビジネス分析、IoTのインタラクティブなサンプル
▶ Assistants: モデル作成、検証、および展開のガイドライン
▶ Models: 25以上のアルゴリズムを含む柔軟なモデル設計・構築
▶ Commands: モデルの作成、検証、運用可能なSPLコマンド
▶ Free: Machine Learning Toolkit はSplunkbaseTMからダウンロード・インストール可能
Splunk Machine Learning Toolkit サンプルデータやモデルを用いて簡単に利用可能
インテリジェンス

© 2017 SPLUNK INC.
▶ SplunkのRBACに統合されたモデル管理▶ 時系列データ予測にて簡単に利用できるアルゴリズムとパラメータが追加
▶ APIを使って簡単にアルゴリズムをインポート、および] SplunkbaseTM App にエクスポート
▶ Apache Sparkとの統合による分散コンピューティングで大規模データのモデル作成に有効
Splunk Machine Learning Toolkit 3.0サンプルデータやモデルを用いて簡単に利用可能
インテリジェンス
Predict Numeric Fields Detect Numeric Outliers
Forecast Time Series Cluster Numeric Events

© 2017 SPLUNK INC.© 2017 SPLUNK INC.
Thank You池山邦彦 | Sr. Sales Engineer, Splunk Services Japan
Slack ID: @kikeyama