south africa’s coal exports DelivereD to inDia in 2010 68.5 mt/media/Files/A/Anglo-America… ·...
16
32 % SOUTH AFRICA’S COAL EXPORTS DELIVERED TO INDIA IN 2010 68.5 Mt OF THERMAL COAL PRODUCED FROM SOUTH AFRICA AND SOUTH AMERICA THERMAL COAL 98 Anglo American plc — Fact Book 2010
Transcript of south africa’s coal exports DelivereD to inDia in 2010 68.5 mt/media/Files/A/Anglo-America… ·...
32%south africa’s coal exports DelivereD to inDia in 2010
68.5 mtof thermal coal proDuceD from south africa anD south america
THERMAL COAL98 Anglo American plc — Fact Book 2010

thermal coalIn South Africa, our thermal coal business owns and operates nine mines. In Colombia, we have a one-third shareholding (with BHP Billiton and Xstrata each owning one-third) in Cerréjon, Colombia’s largest thermal coal exporter.
Goedehoop Colliery – Stacker and reclaimer taken at dusk – Conveyor in the foreground.
99 Anglo American plc — Fact Book 2010
Other
information
Other M
ining and Industrial
Thermal C
oalM
etallurgical Coal
Iron Ore and M
anganeseN
ickelC
opperD
iamonds
PlatinumAbout Anglo Am
erican
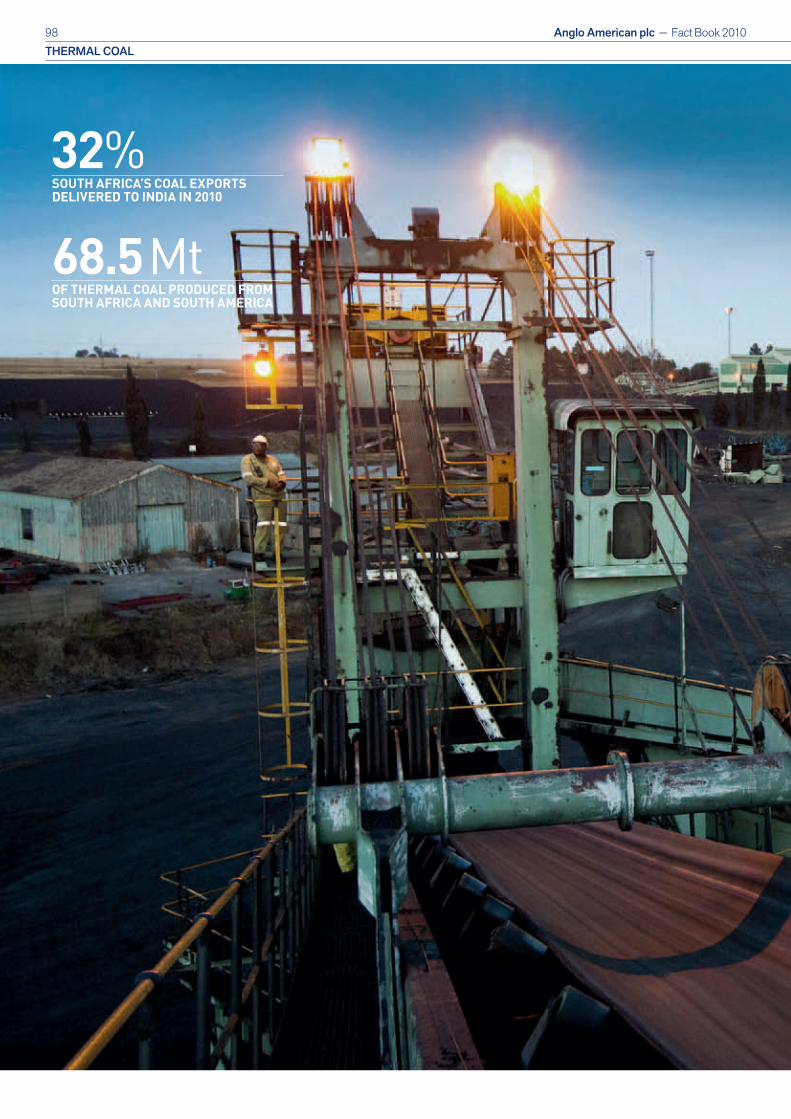
financial highlights
UNDERLYING EARNINGS
0
400
800
200
600
754
517 512
201020092008
$mSHARE OF GROUP NET OPERATING ASSETS
0
1
2
5
4
3 3
4
5
201020092008
%
SHARE OF GROUP OPERATING PROFIT
0
4
12
8
16
20
11
15
7
201020092008
%
OPERATING MARGIN
0
40
10
20
30
35.6
29.0
24.8
201020092008
%ANGLO AMERICAN COAL PRODUCTIONFROM THERMAL COAL
0
20
10
80
70
60
50
40
30
Mt
Trade – Thermal South AfricaTrade – Metallurgical South AfricaTrade – Thermal Cerréjon
Eskom
2008 2009 201020072006
THERMAL COAL100 Anglo American plc — Fact Book 2010

$m 2010 2009 2008TurnoverSubsidiaries 2,105 1,748 2,210Joint ventures – – –Associates 761 742 841Total turnover 2,866 2,490 3,051Of which:South Africa 2,105 1,748 2,210South America 761 742 841
EBITDA 872 875 1,200Of which:South Africa 539 550 814South America 358 352 419Projects and corporate (25) (27) (33)
Depreciation and amortisation 162 154 293Operating profit before special items and remeasurements 710 721 1,078Of which:South Africa 426 442 736South America 309 305 375Projects and corporate (25) (26) (33)Operating special items and remeasurements (2) (6) 2Operating profit after special items and remeasurements 708 715 1,080
Net interest, tax and minority interests (198) (204) (324)
Underlying earnings 512 517 754Of which:South Africa 314 328 543South America 223 215 243Projects and corporate (25) (26) (32)
Net operating assets 2,111 1,707 1,018
Capital expenditure 274 400 365
financial Data
Greenside Colliery – Surveyor Godfrey Motsi measures the size of the coal stockpile using sophisticated GPS technology.
101 Anglo American plc — Fact Book 2010
Other
information
Other M
ining and Industrial
Thermal C
oalM
etallurgical Coal
Iron Ore and M
anganeseN
ickelC
opperD
iamonds
PlatinumAbout Anglo Am
erican

thermal coal resources
3.4 billion tonnes
2010 attriButaBle proDuction from thermal coal
68.5 MtproJecteD coal proDuction from the new ziBulo mine
6.6 Mtpa
financial highlights$ million (unless otherwise stated)
2010 2009
Operating profit 710 721South Africa 426 442Colombia 309 305Projects and corporate (25) (26)
EBITDA 872 875Net operating assets 2,111 1,707Capital expenditure 274 400Share of Group operating profit 7% 15%Share of Group net operating assets 5% 4%
Business overview
Business overview
Thermal Coal operates in South Africa and has a one-third interest in Cerrejón in Colombia. In South Africa, Thermal Coal wholly owns and operates nine mines and has a 50% interest in the Mafube colliery and Phola washing plant. Five of the mines collectively supply 22 Mtpa of thermal coal to both export and local markets. New Vaal, New Denmark and Kriel collieries are domestic product operations supplying 32 Mtpa of thermal coal to Eskom, the state-owned power utility. Isibonelo mine produces 5 Mtpa of thermal coal for Sasol Synthetic Fuels, the coal to liquids producer, under a 20 year supply contract.
Anglo American Inyosi Coal, a broad based black economic empowerment (BBBEE) company valued at approximately $1 billion, is 73% held by Anglo American; the remaining 27% is held by Inyosi, a BEE consortium led by the Pamodzi and Lithemba consortia (66%), with the Women’s Development Bank and a community trust holding the remaining equity. Anglo American Inyosi Coal, in turn, owns Kriel colliery, the new Zibulo multi-product colliery (previously known as the Zondagsfontein project) and the greenfield projects of Elders, New Largo and Heidelberg. The outstanding conditions precedent to the Anglo American Inyosi Coal transaction were fulfilled by the end of May and the transaction became effective from 1 June 2010.
Thermal Coal’s South African operations currently route all export thermal coal through the Richards Bay Coal Terminal (RBCT), in which it has a 27% shareholding, to customers throughout the Med-Atlantic and Asia-Pacific regions. Within South Africa, 62% of total sales tonnes are made to the Eskom power utility, of which the majority are on long term (i.e. life of mine) cost-plus contracts. A further 8% is sold to Sasol and 2% to industrial sector consumers. The remaining 28% is exported through RBCT.
In South America, we have a one-third shareholding (with BHP Billiton and Xstrata each owning one-third) in Cerrejón. Cerrejón is Colombia’s largest thermal coal exporter. This opencast operation has a 32 Mtpa production capacity (10.7 Mtpa attributable). Cerrejón owns and operates its own rail and deep water port facilities and sells into the export thermal and pulverised coal injection (PCI) coal markets.
THERMAL COAL102 Anglo American plc — Fact Book 2010
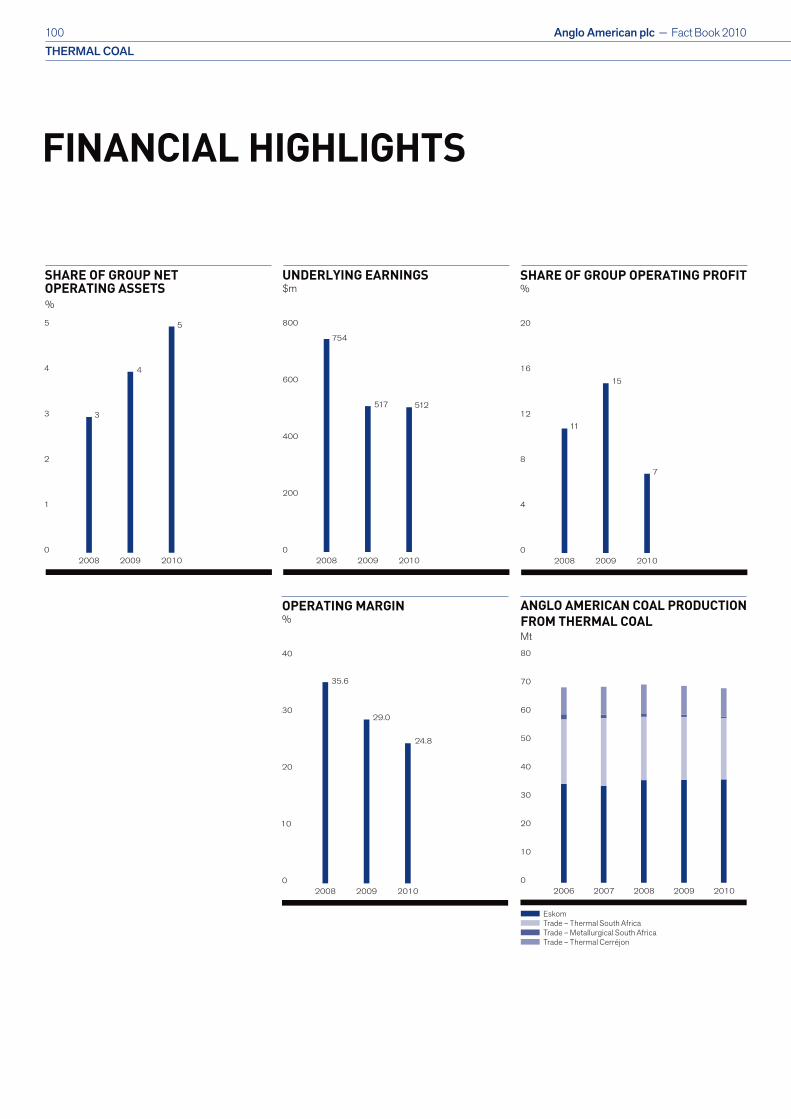
LIFE OF MINE(1) AND RESERVES AND RESOURCES
Indicated 1,240 MtMeasured 2,114 Mt
Probable 359 MtProved 1,348 Mt
Reserves (Operations)(2)
Resources (Operations and Projects)(3)
0
10
20
40
30
20
NewVaal
15
Isibonelo
17
Zibulo
22
Cerrejón
27
New Denmark
Year
Source: Anglo American
(1) Life of Mine in years based on scheduled Coal Reserves.(2) Saleable tonnes including Colombian export thermal and South
African export thermal, other metallurgical, domestic power andSynfuel coal reserves. The figures reported represent 100% of the Saleable Coal Reserves and Coal Resources; the percentage attributable to Anglo American plc is stated separately on pages 109 to 112. Coal reserves are additional to Coal Resources.
(3) Coal Resources for Operations are reported as additional to Coal Reserves.
FIVE LONGEST LIFE OPERATIONS
37
61
2 4
5
1
South Africa1 100% Goedehoop2 100% Greenside3 100% Kleinkopje4 100% Landau5 27.5% Richards Bay
Coal Terminal6 73% Zibulo7 50% Mafube
South America1 33% Cerrejón (Colombia)
key Open Cast Other Underground
our export thermal coal operations
103 Anglo American plc — Fact Book 2010
Other
information
Other M
ining and Industrial
Thermal C
oalM
etallurgical Coal
Iron Ore and M
anganeseN
ickelC
opperD
iamonds
PlatinumAbout Anglo Am
erican

inDustry overview
Coal is the most abundant source of fossil fuel energy in the world, considerably exceeding known reserves of oil and gas. The bulk of all coal produced worldwide is thermal coal, which is used as a fuel for power generation and other industries, notably the cement sector. The seaborne thermal coal market accounts for nearly 692 Mtpa and is supplied from a large number of countries, with coal producers operating in a highly competitive global marketplace.
Thermal coal usage is driven by the demand for electricity and is influenced by the price of competing fuels, such as oil and gas and, increasingly, the cost of carbon. Global thermal coal demand is also affected by the availability of alternative generating technologies, including gas, nuclear, hydro-electricity and renewables. The market for export thermal coal is further impacted by the varying degrees of privatisation and deregulation in electricity markets, with customers focused on securing the lowest cost fuel supply in order to produce power at a competitive price. This has resulted in a move away from longer term contracts towards shorter term contracts priced against various coal price indices, which has given
rise to the development of an increasingly active financial market for hedging and derivative instruments. The extent to which these pricing instruments are used, however, varies from region to region.
Markets Anglo American weighted average achieved FOB price ($/tonne) 2010 2009
RSA export thermal coal 82.49 64.46RSA domestic thermal coal 19.64 18.48Colombian export thermal coal 72.69 73.47
Attributable sales volumes (‘000 tonnes) 2010 2009
RSA export thermal coal 16,347 15,857RSA domestic thermal coal 5,178 6,251Colombian export thermal coal 10,461 10,103
The global seaborne thermal coal market experienced a robust year in 2010. Despite a challenging environment for thermal coal imports into Europe, surging energy demand growth in Asia, provided predominantly by
Goedehoop Colliery – underground – Close-up of a miner operating a remote controlled continuous miner cutting machine.
coal fired power generation, helped drive global demand and support prices.
Thermal coal markets in Europe and the US saw softer demand as weakened power markets and cheaper gas reduced coal consumption. At the beginning of the year, Colombian producers were compelled to price competitively to move thermal coal into their traditional US and European markets. This resulted in delivered thermal coal prices in the European market regularly trading at a discount to the South African FOB export price, which excludes the cost of freight. As demand in the Asia Pacific market progressively improved, South African thermal coal sales into this market increased and Colombian producers began exporting significant volumes to this region for the first time.
China and India imported significantly more thermal coal during 2010, compared with 2009, increasing by some 40% and 15% respectively, which boosted demand for South African coal. RBCT exported 63 Mt during 2010, a 2 Mt increase over 2009, with some 65% exported to Asian markets and about 30% going to the European and Mediterranean region.
inDustry overview
THERMAL COAL104 Anglo American plc — Fact Book 2010
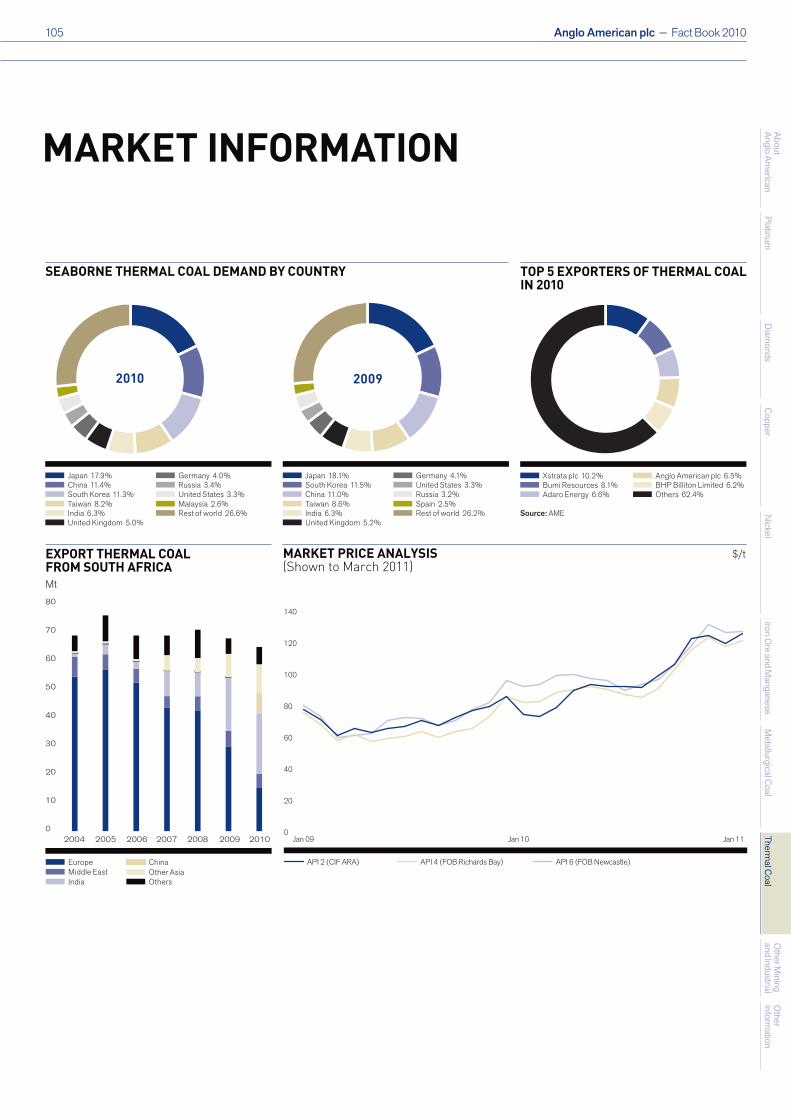
SEABORNE THERMAL COAL DEMAND BY COUNTRY
China 11.4%Japan 17.9%
Taiwan 8.2%South Korea 11.3%
India 6.3%United Kingdom 5.0%
Russia 3.4%Germany 4.0%
Malaysia 2.6%United States 3.3%
Rest of world 26.6%
2010
South Korea 11.5%Japan 18.1%
Taiwan 8.6%China 11.0%
India 6.3%United Kingdom 5.2%
United States 3.3%Germany 4.1%
Spain 2.5%Russia 3.2%
Rest of world 26.2%
2009
marKet information
MARKET PRICE ANALYSIS (Shown to March 2011)
Source: CRU
0
20
40
60
80
100
120
140
$/t
Jan 09 Jan 10 Jan 11
API 4 (FOB Richards Bay) API 6 (FOB Newcastle)API 2 (CIF ARA)
EXPORT THERMAL COAL FROM SOUTH AFRICA
0
20
10
80
70
60
50
40
30
Mt
ChinaOther AsiaOthers
Middle EastIndia
Europe
2008 2009 20102007200620052004
TOP 5 EXPORTERS OF THERMAL COAL IN 2010
Anglo American plc 6.5%BHP Billiton Limited 6.2%Others 62.4%
Bumi Resources 8.1%Xstrata plc 10.2%
Adaro Energy 6.6%
Source: AME
105 Anglo American plc — Fact Book 2010
Other
information
Other M
ining and Industrial
Thermal C
oalM
etallurgical Coal
Iron Ore and M
anganeseN
ickelC
opperD
iamonds
PlatinumAbout Anglo Am
erican

exports, through the RBCT were destined for India. Thermal Coal is evaluating opportunities to increase its market share to India.
In Colombia, Cerrejón’s growth strategy encompasses a two-phased expansion strategy. The first phase requires an increase in the port and logistics chain capacity in order to reach 40 Mtpa. Thereafter, a river diversion would be required to expand the pits. This expansion would allow for a potential increase in production to 50-60 Mtpa. The feasibility study for phase 1 is being reviewed by the shareholders. Phase 2 expansion is at the concept phase of development.
In addition to developing its operations in its existing geographies, Thermal Coal is constantly evaluating potential opportunities in new regions which are well placed to service its growing markets.
ProjectsIn South Africa, the $517 million Zibulo project is approaching completion, the opencast operation is at full production and the underground operation has four of eight production sections deployed. The washing plant, which is a 50:50 joint venture with BHP Billiton Energy Coal South Africa, is fully commissioned and is operating at 80% of planned monthly production. Completion of the man and materials shaft is expected to be in the second quarter of 2011. The
mining rights of Zibulo colliery and the environmental management plan were approved during 2010.
The feasibility study for the New Largo project started in 2010 and is expected to be completed in the first quarter of 2012. Significant progress has been made to complete a provisional coal supply agreement with Eskom by the end of March 2011.
At Cerrejón, a two-phase growth strategy has been adopted and is currently being implemented. The first phase, referred to as P500 Phase 1, requires an increase in the port and logistics chain capacity, while maintaining the current operational footprint, in order to reach a target of 40 Mtpa. The second phase, referred to as P500 Phase 2, will require a river diversion and pit expansions to access the additional reserves required to reach a potential 50-60 Mtpa. The feasibility study for Phase 1 was reviewed by the shareholder review teams towards the end of 2010. A process is under way to address the findings of the review process. The aim is to have the Phase 1 ready for approval by the shareholder boards towards the end of the second quarter of 2011.
strategy anD growth
strategy anD growth
Thermal Coal’s strategy is focused on serving the power generation and industrial sectors from large, low cost coal basins. The business unit has a diverse, high quality asset portfolio in South Africa and Colombia and aims to be a long term, reliable supplier. It also strives to participate actively in the pursuit of cleaner coal solutions for the world’s energy needs.
Thermal Coal is focused on expanding its strong standing in the export market, while maintaining a significant position in the domestic market in South Africa. It will deliver on this ambition through its extensive portfolio of expansion projects, supported by targeted acquisitions. By year end, it had substantially completed a major programme of investment, including investigations into expansions at Cerrejón and the development of Zibulo. The business unit has commenced its feasibility study on New Largo, identified by Eskom as a primary coal supplier to its Kusile power station now under construction. Kusile’s first units are scheduled to be operating in 2013.
India is an ever growing market for South Africa sourced coal, with 2010 showing a pronounced swing from the Med-Atlantic to the Asia-Pacific market. For the year as a whole, 32% of South Africa’s coal exports, and a similar proportion of Thermal Coal’s own
A fog cannon, imported from the united States, is used to spray a fine mist of water on to the tip in order to prevent dust.
THERMAL COAL106 Anglo American plc — Fact Book 2010
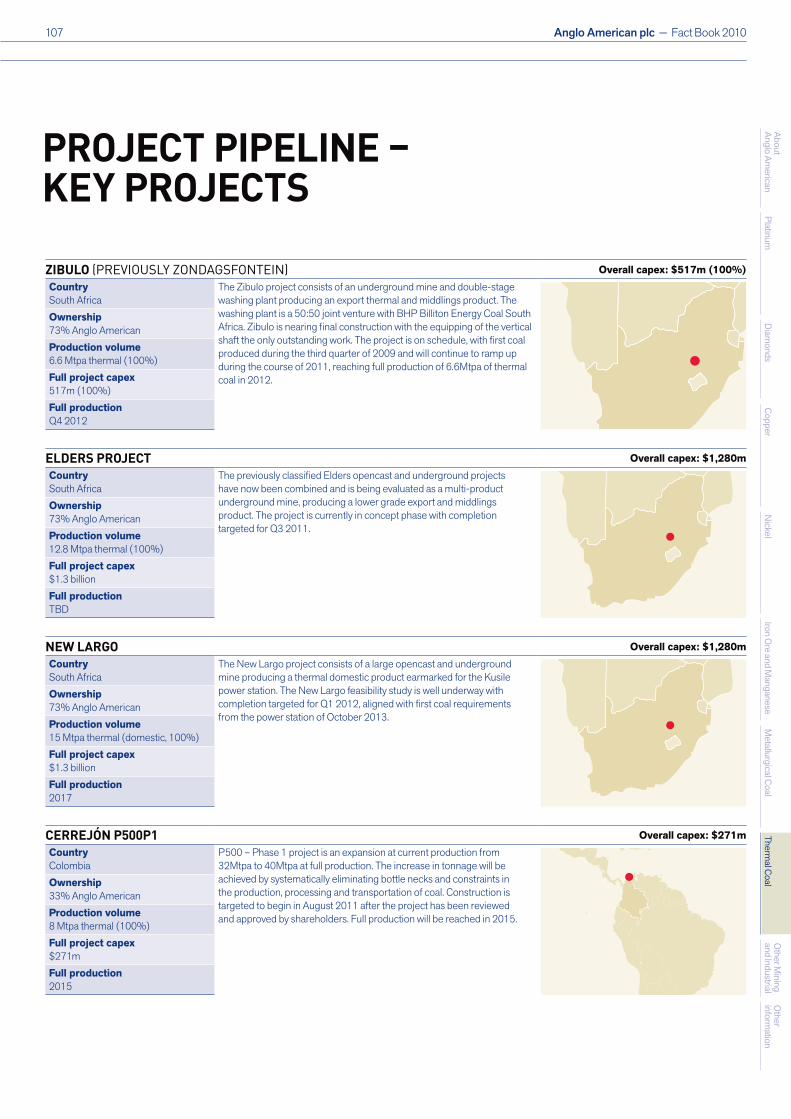
ziBulo (previously zoNdagsfoNteiN) Overall capex: $517m (100%)CountrySouth Africa
The Zibulo project consists of an underground mine and double-stage washing plant producing an export thermal and middlings product. The washing plant is a 50:50 joint venture with BHP Billiton Energy Coal South Africa. Zibulo is nearing final construction with the equipping of the vertical shaft the only outstanding work. The project is on schedule, with first coal produced during the third quarter of 2009 and will continue to ramp up during the course of 2011, reaching full production of 6.6Mtpa of thermal coal in 2012.
Ownership73% Anglo AmericanProduction volume6.6 Mtpa thermal (100%)Full project capex517m (100%)Full productionQ4 2012
elDers proJect Overall capex: $1,280mCountrySouth Africa
The previously classified Elders opencast and underground projects have now been combined and is being evaluated as a multi-product underground mine, producing a lower grade export and middlings product. The project is currently in concept phase with completion targeted for Q3 2011.
Ownership73% Anglo American Production volume12.8 Mtpa thermal (100%)Full project capex$1.3 billionFull productionTBD
new largo Overall capex: $1,280mCountrySouth Africa
The New Largo project consists of a large opencast and underground mine producing a thermal domestic product earmarked for the Kusile power station. The New Largo feasibility study is well underway with completion targeted for Q1 2012, aligned with first coal requirements from the power station of October 2013.
Ownership73% Anglo American Production volume15 Mtpa thermal (domestic, 100%)Full project capex$1.3 billionFull production2017
cerreJón p500p1 Overall capex: $271mCountryColombia
P500 – Phase 1 project is an expansion at current production from 32Mtpa to 40Mtpa at full production. The increase in tonnage will be achieved by systematically eliminating bottle necks and constraints in the production, processing and transportation of coal. Construction is targeted to begin in August 2011 after the project has been reviewed and approved by shareholders. Full production will be reached in 2015.
Ownership33% Anglo AmericanProduction volume8 Mtpa thermal (100%)Full project capex$271mFull production2015
proJect pipeline – Key proJects
107 Anglo American plc — Fact Book 2010
Other
information
Other M
ining and Industrial
Thermal C
oalM
etallurgical Coal
Iron Ore and M
anganeseN
ickelC
opperD
iamonds
PlatinumAbout Anglo Am
erican
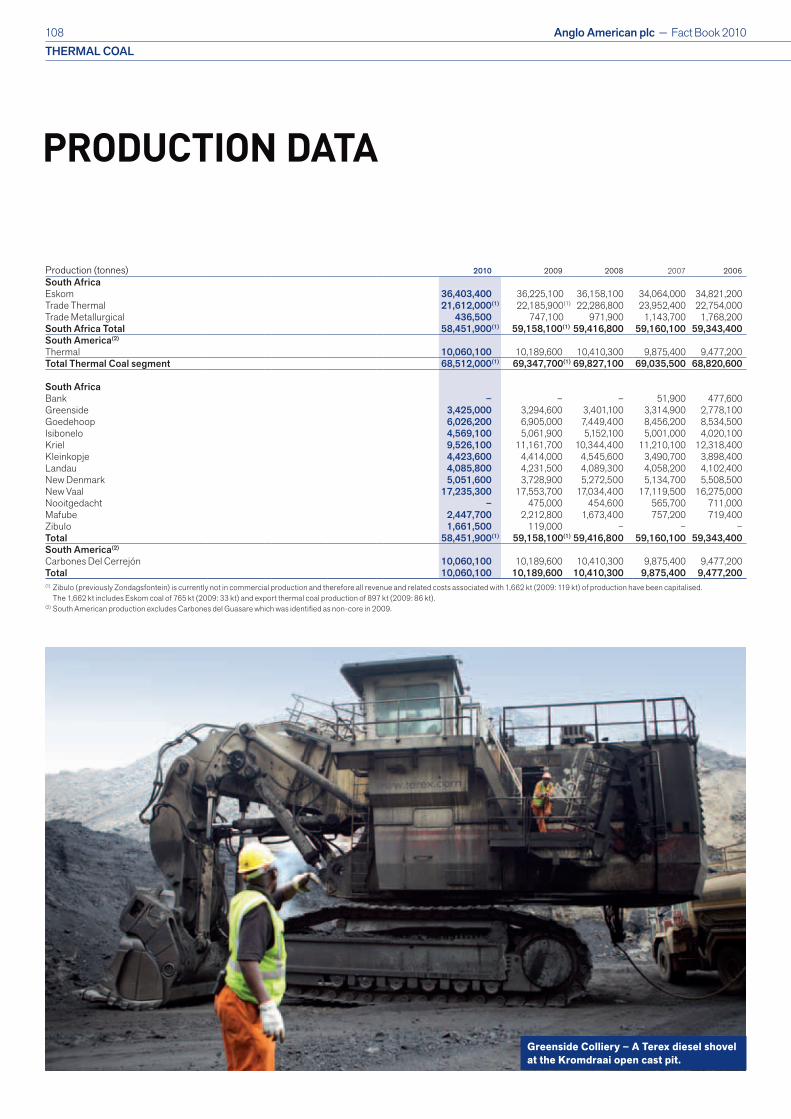
proDuction Data
Production (tonnes) 2010 2009 2008 2007 2006South AfricaEskom 36,403,400 36,225,100 36,158,100 34,064,000 34,821,200Trade Thermal 21,612,000(1) 22,185,900(1) 22,286,800 23,952,400 22,754,000Trade Metallurgical 436,500 747,100 971,900 1,143,700 1,768,200South Africa Total 58,451,900(1) 59,158,100(1) 59,416,800 59,160,100 59,343,400South America(2)
Thermal 10,060,100 10,189,600 10,410,300 9,875,400 9,477,200Total Thermal Coal segment 68,512,000(1) 69,347,700(1) 69,827,100 69,035,500 68,820,600
South AfricaBank – – – 51,900 477,600Greenside 3,425,000 3,294,600 3,401,100 3,314,900 2,778,100Goedehoop 6,026,200 6,905,000 7,449,400 8,456,200 8,534,500Isibonelo 4,569,100 5,061,900 5,152,100 5,001,000 4,020,100Kriel 9,526,100 11,161,700 10,344,400 11,210,100 12,318,400Kleinkopje 4,423,600 4,414,000 4,545,600 3,490,700 3,898,400Landau 4,085,800 4,231,500 4,089,300 4,058,200 4,102,400New Denmark 5,051,600 3,728,900 5,272,500 5,134,700 5,508,500New Vaal 17,235,300 17,553,700 17,034,400 17,119,500 16,275,000Nooitgedacht – 475,000 454,600 565,700 711,000Mafube 2,447,700 2,212,800 1,673,400 757,200 719,400Zibulo 1,661,500 119,000 – – –Total 58,451,900(1) 59,158,100(1) 59,416,800 59,160,100 59,343,400South America(2)
Carbones Del Cerrejón 10,060,100 10,189,600 10,410,300 9,875,400 9,477,200Total 10,060,100 10,189,600 10,410,300 9,875,400 9,477,200(1) Zibulo (previously Zondagsfontein) is currently not in commercial production and therefore all revenue and related costs associated with 1,662 kt (2009: 119 kt) of production have been capitalised.
The 1,662 kt includes Eskom coal of 765 kt (2009: 33 kt) and export thermal coal production of 897 kt (2009: 86 kt).(2) South American production excludes Carbones del Guasare which was identified as non-core in 2009.
Greenside Colliery – A Terex diesel shovel at the kromdraai open cast pit.
THERMAL COAL108 Anglo American plc — Fact Book 2010
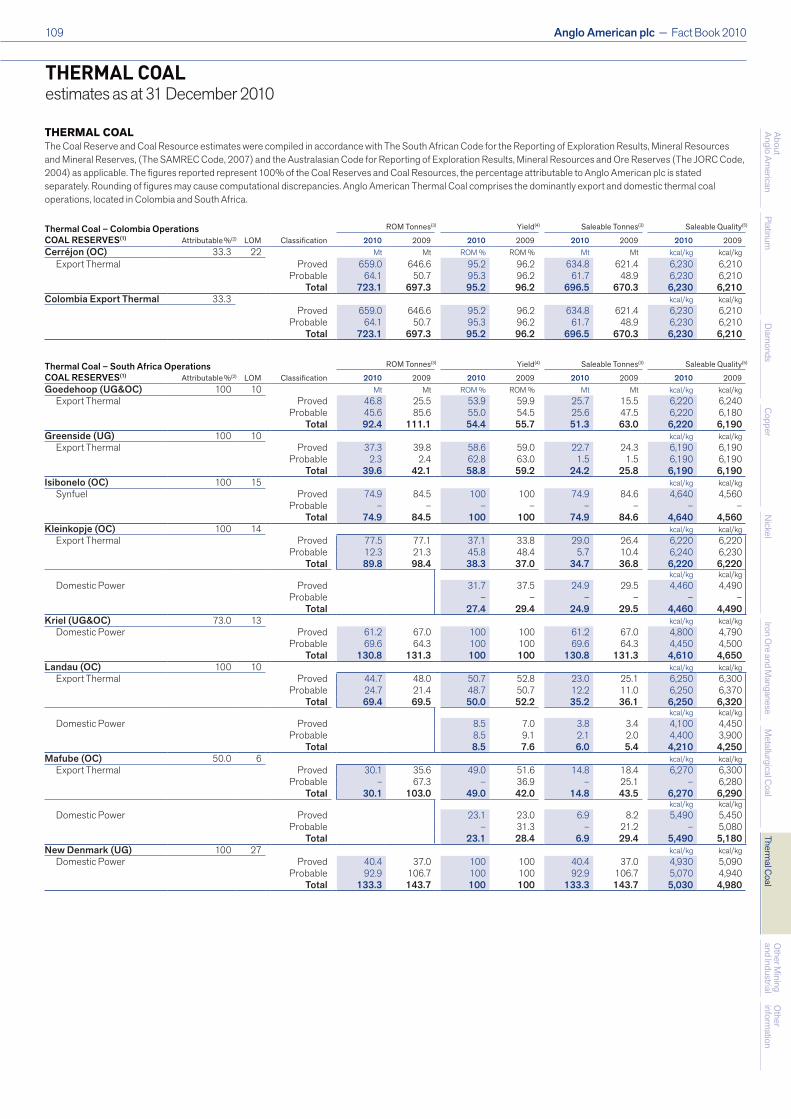
THerMAl COAl The Coal Reserve and Coal Resource estimates were compiled in accordance with The South African Code for the Reporting of Exploration Results, Mineral Resources and Mineral Reserves, (The SAMREC Code, 2007) and the Australasian Code for Reporting of Exploration Results, Mineral Resources and Ore Reserves (The JORC Code, 2004) as applicable. The figures reported represent 100% of the Coal Reserves and Coal Resources, the percentage attributable to Anglo American plc is stated separately. Rounding of figures may cause computational discrepancies. Anglo American Thermal Coal comprises the dominantly export and domestic thermal coal operations, located in Colombia and South Africa.
Thermal Coal – Colombia Operations ROM Tonnes Yield Saleable Tonnes Saleable Quality
COAL RESERVES(1) Attributable % LOM Classification 2010 2009 2010 2009 2010 2009 2010 2009Cerréjon (OC) 33.3 22 Mt Mt ROM % ROM % Mt Mt kcal/kg kcal/kg
Export Thermal Proved 659.0 646.6 95.2 96.2 634.8 621.4 6,230 6,210Probable 64.1 50.7 95.3 96.2 61.7 48.9 6,230 6,210
Total 723.1 697.3 95.2 96.2 696.5 670.3 6,230 6,210Colombia Export Thermal 33.3 kcal/kg kcal/kg
Proved 659.0 646.6 95.2 96.2 634.8 621.4 6,230 6,210Probable 64.1 50.7 95.3 96.2 61.7 48.9 6,230 6,210
Total 723.1 697.3 95.2 96.2 696.5 670.3 6,230 6,210
Thermal Coal – South Africa Operations ROM Tonnes Yield Saleable Tonnes Saleable Quality
COAL RESERVES(1) Attributable % LOM Classification 2010 2009 2010 2009 2010 2009 2010 2009Goedehoop (UG&OC) 100 10 Mt Mt ROM % ROM % Mt Mt kcal/kg kcal/kg
Export Thermal Proved 46.8 25.5 53.9 59.9 25.7 15.5 6,220 6,240Probable 45.6 85.6 55.0 54.5 25.6 47.5 6,220 6,180
Total 92.4 111.1 54.4 55.7 51.3 63.0 6,220 6,190Greenside (UG) 100 10 kcal/kg kcal/kg
Export Thermal Proved 37.3 39.8 58.6 59.0 22.7 24.3 6,190 6,190Probable 2.3 2.4 62.8 63.0 1.5 1.5 6,190 6,190
Total 39.6 42.1 58.8 59.2 24.2 25.8 6,190 6,190Isibonelo (OC) 100 15 kcal/kg kcal/kg
Synfuel Proved 74.9 84.5 100 100 74.9 84.6 4,640 4,560Probable – – – – – – – –
Total 74.9 84.5 100 100 74.9 84.6 4,640 4,560Kleinkopje (OC) 100 14 kcal/kg kcal/kg
Export Thermal Proved 77.5 77.1 37.1 33.8 29.0 26.4 6,220 6,220Probable 12.3 21.3 45.8 48.4 5.7 10.4 6,240 6,230
Total 89.8 98.4 38.3 37.0 34.7 36.8 6,220 6,220kcal/kg kcal/kg
Domestic Power Proved 31.7 37.5 24.9 29.5 4,460 4,490Probable – – – – – –
Total 27.4 29.4 24.9 29.5 4,460 4,490Kriel (UG&OC) 73.0 13 kcal/kg kcal/kg
Domestic Power Proved 61.2 67.0 100 100 61.2 67.0 4,800 4,790Probable 69.6 64.3 100 100 69.6 64.3 4,450 4,500
Total 130.8 131.3 100 100 130.8 131.3 4,610 4,650Landau (OC) 100 10 kcal/kg kcal/kg
Export Thermal Proved 44.7 48.0 50.7 52.8 23.0 25.1 6,250 6,300Probable 24.7 21.4 48.7 50.7 12.2 11.0 6,250 6,370
Total 69.4 69.5 50.0 52.2 35.2 36.1 6,250 6,320kcal/kg kcal/kg
Domestic Power Proved 8.5 7.0 3.8 3.4 4,100 4,450Probable 8.5 9.1 2.1 2.0 4,400 3,900
Total 8.5 7.6 6.0 5.4 4,210 4,250Mafube (OC) 50.0 6 kcal/kg kcal/kg
Export Thermal Proved 30.1 35.6 49.0 51.6 14.8 18.4 6,270 6,300Probable – 67.3 – 36.9 – 25.1 – 6,280
Total 30.1 103.0 49.0 42.0 14.8 43.5 6,270 6,290kcal/kg kcal/kg
Domestic Power Proved 23.1 23.0 6.9 8.2 5,490 5,450Probable – 31.3 – 21.2 – 5,080
Total 23.1 28.4 6.9 29.4 5,490 5,180New Denmark (UG) 100 27 kcal/kg kcal/kg
Domestic Power Proved 40.4 37.0 100 100 40.4 37.0 4,930 5,090Probable 92.9 106.7 100 100 92.9 106.7 5,070 4,940
Total 133.3 143.7 100 100 133.3 143.7 5,030 4,980
(3) (4) (3) (5)
(2)
(3) (4) (3) (5)
(2)
thermal coalestimates as at 31 December 2010
109 Anglo American plc — Fact Book 2010
Other
information
Other M
ining and Industrial
Thermal C
oalM
etallurgical Coal
Iron Ore and M
anganeseN
ickelC
opperD
iamonds
PlatinumAbout Anglo Am
erican

Thermal Coal – South Africa Operations continued ROM Tonnes Yield Saleable Tonnes Saleable Quality
COAL RESERVES(1) Attributable % LOM Classification 2010 2009 2010 2009 2010 2009 2010 2009New Vaal (OC) 100 20 Mt Mt ROM % ROM % Mt Mt kcal/kg kcal/kg
Domestic Power Proved 397.5 423.4 93.4 92.1 384.6 404.0 3,490 3,490Probable – – – – – – – –
Total 397.5 423.4 93.4 92.1 384.6 404.0 3,490 3,490Nooitgedacht 5 Seam (UG) 100 2 kcal/kg kcal/kg
Export Thermal Proved 1.2 1.9 36.5 34.6 0.5 0.7 6,340 6,360Probable – – – – – – – –
Total 1.2 1.9 36.5 34.6 0.5 0.7 6,340 6,360kcal/kg kcal/kg
Other Metallurgical Proved 28.4 27.0 0.4 0.5 6,280 6,300Probable – – – – – –
Total 28.4 27.0 0.4 0.5 6,280 6,300Zibulo (UG&OC) 73.0 17 kcal/kg kcal/kg
Export Thermal Proved – – – – – – – –Probable 111.9 99.3 41.0 39.7 46.3 39.5 6,320 6,350
Total 111.9 99.3 41.0 39.7 46.3 39.5 6,320 6,350kcal/kg kcal/kg
Domestic Power Proved – – – – – –Probable 35.6 37.0 40.9 38.5 4,990 4,880
Total 35.6 37.0 40.9 38.5 4,990 4,880South Africa Export Thermal 90.4 Mt Mt Plant % Plant % Mt Mt kcal/kg kcal/kg
Proved 811.7 839.8 49.3 50.3 115.7 110.3 6,230 6,250Probable 359.3 468.3 46.6 46.2 91.3 135.0 6,280 6,270
Total 1,171.0 1,308.1 48.1 47.7 207.0 245.3 6,250 6,260South Africa Other Metallurgical 100 kcal/kg kcal/kg
Proved 28.4 27.0 0.4 0.5 6,280 6,300Probable – – – – – –
Total 28.4 27.0 0.4 0.5 6,280 6,300South Africa Domestic Power 93.1 kcal/kg kcal/kg
Proved 90.2 89.1 522.0 549.1 3,830 3,850Probable 86.2 82.5 205.5 232.7 4,840 4,810
Total 88.9 86.8 727.5 781.8 4,120 4,130South Africa Synfuel 100 kcal/kg kcal/kg
Proved 100 100 74.9 84.6 4,640 4,560Probable – – – – – –
Total 100 100 74.9 84.6 4,640 4,560
Thermal Coal – Operations ROM Tonnes Yield Saleable Tonnes Saleable Quality
TOTAL COAL RESERVES(1) Attributable % Classification 2010 2009 2010 2009 2010 2009 2010 2009Export Thermal 46.4 Mt Mt Plant % Plant % Mt Mt kcal/kg kcal/kg
Proved 1,470.7 1,486.4 88.1 89.3 750.5 731.7 6,230 6,220Probable 423.3 519.0 66.2 59.5 153.1 183.9 6,260 6,250
Total 1,894.0 2,005.4 84.4 83.2 903.6 915.6 6,230 6,230Other Metallurgical 100 kcal/kg kcal/kg
Proved 28.4 27.0 0.4 0.5 6,280 6,300Probable – – – – – –
Total 28.4 27.0 0.4 0.5 6,280 6,300Domestic Power 93.1 kcal/kg kcal/kg
Proved 90.2 89.1 522.0 549.1 3,830 3,850Probable 86.2 82.5 205.5 232.7 4,840 4,810
Total 88.9 86.8 727.5 781.8 4,120 4,130Synfuel 100 kcal/kg kcal/kg
Proved 100 100 74.9 84.6 4,640 4,560Probable – – – – – –
Total 100 100 74.9 84.6 4,640 4,560
Mining method: OC = Open Cast, UG = Underground. LOM = Life of Mine in years based on scheduled Coal Reserves. For the multi-product operations, the ROM tonnage figures apply to each product. The Saleable tonnage cannot be calculated directly from the ROM reserve tonnage using the air dried yields as presented since the difference in moisture content is not taken into account. Attributable percentages for country totals are weighted by Saleable tonnes and should not be directly applied to the ROM tonnage. Additional footnotes appear at the end of the section.
Export Thermal refers to low- to high-volatile thermal coal primarily for export in the use of power generation; quality measured by calorific value (CV).Other Metallurgical refers to semi soft, soft, hard, semi-hard or anthracite coal, other than Coking Coal, such as pulverized coal injection (PCI) or other general metallurgical coal for the export or domestic market with a wider range of properties than Coking Coal. Domestic Power refers to low- to high-volatile thermal or semi-soft coal primarily for domestic consumption for power generation; quality measured by calorific value (CV).Synfuel refers to a coal specifically for the domestic production of synthetic fuel and chemicals; quality measured by calorific value (CV).
(3) (4) (3) (5)
(2)
(3) (4) (3) (5)
(2)
thermal coal continuedestimates as at 31 December 2010
THERMAL COAL110 Anglo American plc — Fact Book 2010
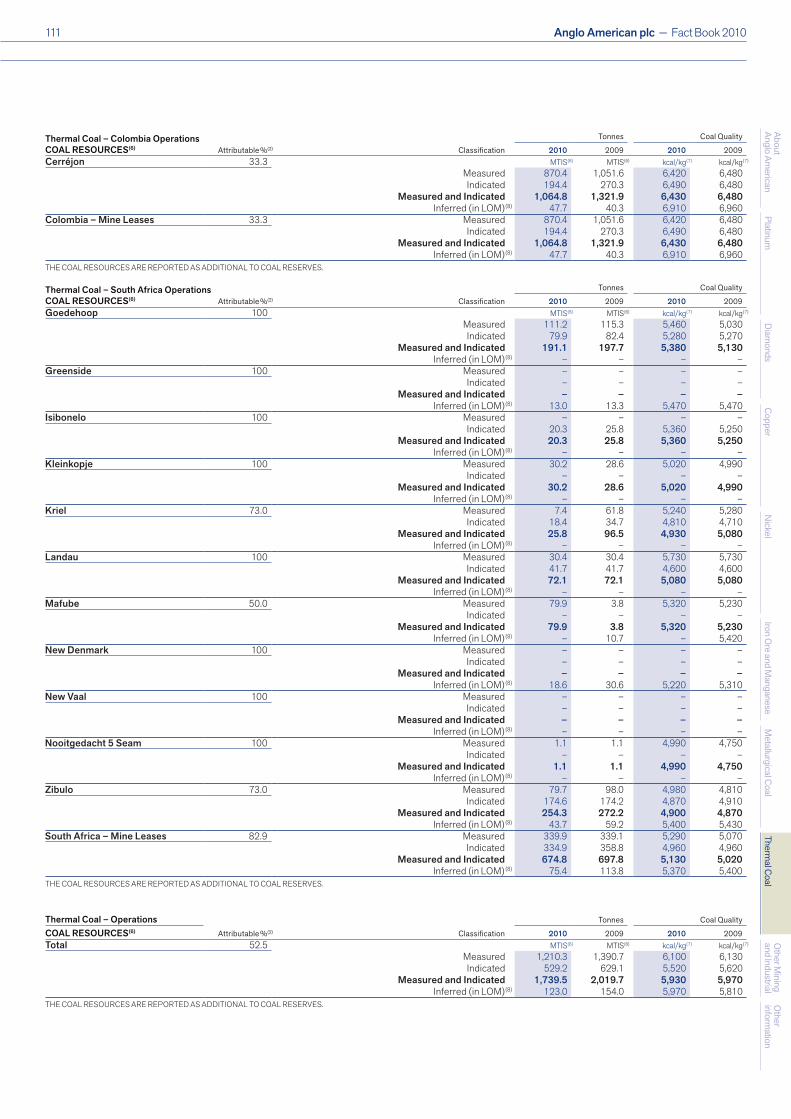
Thermal Coal – Colombia Operations Tonnes Coal Quality
COAL RESOURCES(6) Attributable % Classification 2010 2009 2010 2009Cerréjon 33.3 MTIS MTIS kcal/kg kcal/kg
Measured 870.4 1,051.6 6,420 6,480Indicated 194.4 270.3 6,490 6,480
Measured and Indicated 1,064.8 1,321.9 6,430 6,480Inferred (in LOM) 47.7 40.3 6,910 6,960
Colombia – Mine Leases 33.3 Measured 870.4 1,051.6 6,420 6,480Indicated 194.4 270.3 6,490 6,480
Measured and Indicated 1,064.8 1,321.9 6,430 6,480Inferred (in LOM) 47.7 40.3 6,910 6,960
THE COAL RESOURCES ARE REPORTED AS ADDITIONAL TO COAL RESERVES.
Thermal Coal – South Africa Operations Tonnes Coal Quality
COAL RESOURCES(6) Attributable % Classification 2010 2009 2010 2009Goedehoop 100 MTIS MTIS kcal/kg kcal/kg
Measured 111.2 115.3 5,460 5,030Indicated 79.9 82.4 5,280 5,270
Measured and Indicated 191.1 197.7 5,380 5,130Inferred (in LOM) – – – –
Greenside 100 Measured – – – –Indicated – – – –
Measured and Indicated – – – –Inferred (in LOM) 13.0 13.3 5,470 5,470
Isibonelo 100 Measured – – – –Indicated 20.3 25.8 5,360 5,250
Measured and Indicated 20.3 25.8 5,360 5,250Inferred (in LOM) – – – –
Kleinkopje 100 Measured 30.2 28.6 5,020 4,990Indicated – – – –
Measured and Indicated 30.2 28.6 5,020 4,990Inferred (in LOM) – – – –
Kriel 73.0 Measured 7.4 61.8 5,240 5,280Indicated 18.4 34.7 4,810 4,710
Measured and Indicated 25.8 96.5 4,930 5,080Inferred (in LOM) – – – –
Landau 100 Measured 30.4 30.4 5,730 5,730Indicated 41.7 41.7 4,600 4,600
Measured and Indicated 72.1 72.1 5,080 5,080Inferred (in LOM) – – – –
Mafube 50.0 Measured 79.9 3.8 5,320 5,230Indicated – – – –
Measured and Indicated 79.9 3.8 5,320 5,230Inferred (in LOM) – 10.7 – 5,420
New Denmark 100 Measured – – – –Indicated – – – –
Measured and Indicated – – – –Inferred (in LOM) 18.6 30.6 5,220 5,310
New Vaal 100 Measured – – – –Indicated – – – –
Measured and Indicated – – – –Inferred (in LOM) – – – –
Nooitgedacht 5 Seam 100 Measured 1.1 1.1 4,990 4,750Indicated – – – –
Measured and Indicated 1.1 1.1 4,990 4,750Inferred (in LOM) – – – –
Zibulo 73.0 Measured 79.7 98.0 4,980 4,810Indicated 174.6 174.2 4,870 4,910
Measured and Indicated 254.3 272.2 4,900 4,870Inferred (in LOM) 43.7 59.2 5,400 5,430
South Africa – Mine Leases 82.9 Measured 339.9 339.1 5,290 5,070Indicated 334.9 358.8 4,960 4,960
Measured and Indicated 674.8 697.8 5,130 5,020Inferred (in LOM) 75.4 113.8 5,370 5,400
THE COAL RESOURCES ARE REPORTED AS ADDITIONAL TO COAL RESERVES.
Thermal Coal – Operations Tonnes Coal Quality
COAL RESOURCES(6) Attributable % Classification 2010 2009 2010 2009Total 52.5 MTIS MTIS kcal/kg kcal/kg
Measured 1,210.3 1,390.7 6,100 6,130Indicated 529.2 629.1 5,520 5,620
Measured and Indicated 1,739.5 2,019.7 5,930 5,970Inferred (in LOM) 123.0 154.0 5,970 5,810
THE COAL RESOURCES ARE REPORTED AS ADDITIONAL TO COAL RESERVES.
(2)
(6) (6) (7) (7)
(8)
(8)
(2)
(6) (6) (7) (7)
(8)
(8)
(8)
(8)
(8)
(8)
(8)
(8)
(8)
(8)
(8)
(8)
(2)
(6) (6) (7) (7)
(8)
111 Anglo American plc — Fact Book 2010
Other
information
Other M
ining and Industrial
Thermal C
oalM
etallurgical Coal
Iron Ore and M
anganeseN
ickelC
opperD
iamonds
PlatinumAbout Anglo Am
erican
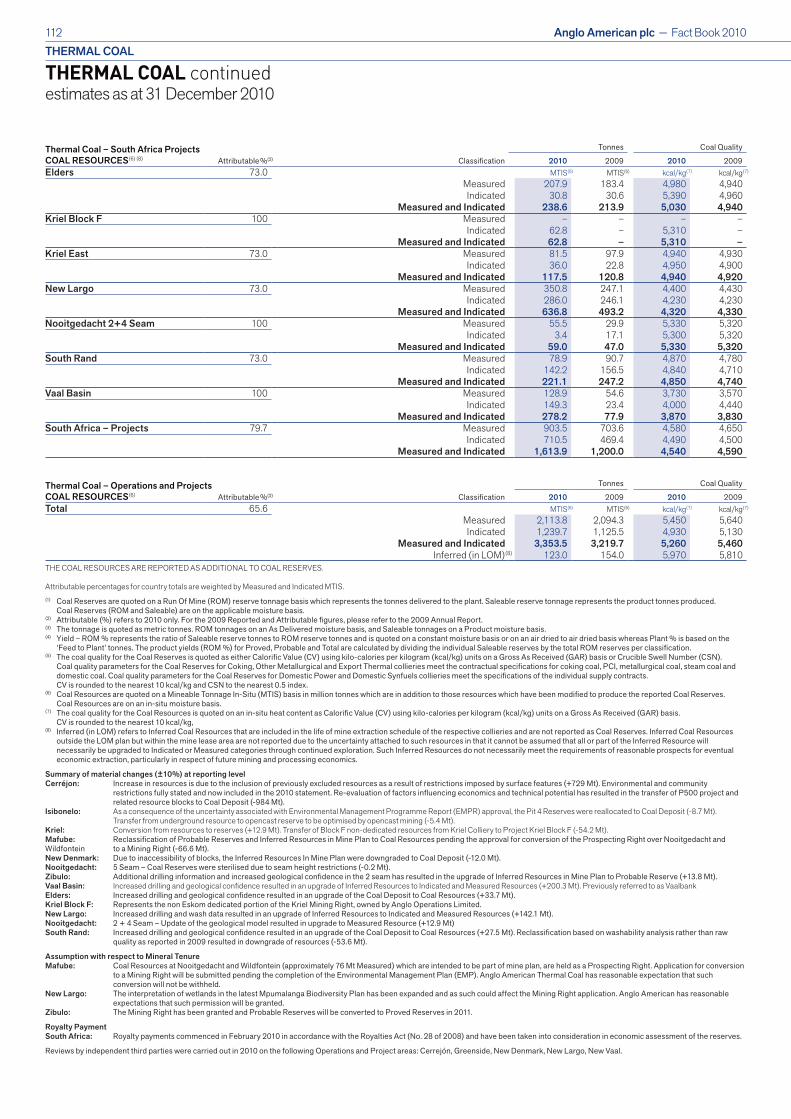
Thermal Coal – South Africa Projects Tonnes Coal Quality
COAL RESOURCES(6) (8) Attributable % Classification 2010 2009 2010 2009Elders 73.0 MTIS MTIS kcal/kg kcal/kg
Measured 207.9 183.4 4,980 4,940Indicated 30.8 30.6 5,390 4,960
Measured and Indicated 238.6 213.9 5,030 4,940Kriel Block F 100 Measured – – – –
Indicated 62.8 – 5,310 –Measured and Indicated 62.8 – 5,310 –
Kriel East 73.0 Measured 81.5 97.9 4,940 4,930Indicated 36.0 22.8 4,950 4,900
Measured and Indicated 117.5 120.8 4,940 4,920New Largo 73.0 Measured 350.8 247.1 4,400 4,430
Indicated 286.0 246.1 4,230 4,230Measured and Indicated 636.8 493.2 4,320 4,330
Nooitgedacht 2+4 Seam 100 Measured 55.5 29.9 5,330 5,320Indicated 3.4 17.1 5,300 5,320
Measured and Indicated 59.0 47.0 5,330 5,320South Rand 73.0 Measured 78.9 90.7 4,870 4,780
Indicated 142.2 156.5 4,840 4,710Measured and Indicated 221.1 247.2 4,850 4,740
Vaal Basin 100 Measured 128.9 54.6 3,730 3,570Indicated 149.3 23.4 4,000 4,440
Measured and Indicated 278.2 77.9 3,870 3,830South Africa – Projects 79.7 Measured 903.5 703.6 4,580 4,650
Indicated 710.5 469.4 4,490 4,500Measured and Indicated 1,613.9 1,200.0 4,540 4,590
Thermal Coal – Operations and Projects Tonnes Coal Quality
COAL RESOURCES(6) Attributable % Classification 2010 2009 2010 2009Total 65.6 MTIS MTIS kcal/kg kcal/kg
Measured 2,113.8 2,094.3 5,450 5,640Indicated 1,239.7 1,125.5 4,930 5,130
Measured and Indicated 3,353.5 3,219.7 5,260 5,460Inferred (in LOM) 123.0 154.0 5,970 5,810
THE COAL RESOURCES ARE REPORTED AS ADDITIONAL TO COAL RESERVES. Attributable percentages for country totals are weighted by Measured and Indicated MTIS.(1) Coal Reserves are quoted on a Run Of Mine (ROM) reserve tonnage basis which represents the tonnes delivered to the plant. Saleable reserve tonnage represents the product tonnes produced.
Coal Reserves (ROM and Saleable) are on the applicable moisture basis.(2) Attributable (%) refers to 2010 only. For the 2009 Reported and Attributable figures, please refer to the 2009 Annual Report.(3) The tonnage is quoted as metric tonnes. ROM tonnages on an As Delivered moisture basis, and Saleable tonnages on a Product moisture basis.(4) Yield – ROM % represents the ratio of Saleable reserve tonnes to ROM reserve tonnes and is quoted on a constant moisture basis or on an air dried to air dried basis whereas Plant % is based on the
‘Feed to Plant’ tonnes. The product yields (ROM %) for Proved, Probable and Total are calculated by dividing the individual Saleable reserves by the total ROM reserves per classification.(5) The coal quality for the Coal Reserves is quoted as either Calorific Value (CV) using kilo-calories per kilogram (kcal/kg) units on a Gross As Received (GAR) basis or Crucible Swell Number (CSN).
Coal quality parameters for the Coal Reserves for Coking, Other Metallurgical and Export Thermal collieries meet the contractual specifications for coking coal, PCI, metallurgical coal, steam coal and domestic coal. Coal quality parameters for the Coal Reserves for Domestic Power and Domestic Synfuels collieries meet the specifications of the individual supply contracts.
CV is rounded to the nearest 10 kcal/kg and CSN to the nearest 0.5 index.(6) Coal Resources are quoted on a Mineable Tonnage In-Situ (MTIS) basis in million tonnes which are in addition to those resources which have been modified to produce the reported Coal Reserves.
Coal Resources are on an in-situ moisture basis.(7) The coal quality for the Coal Resources is quoted on an in-situ heat content as Calorific Value (CV) using kilo-calories per kilogram (kcal/kg) units on a Gross As Received (GAR) basis.
CV is rounded to the nearest 10 kcal/kg,(8) Inferred (in LOM) refers to Inferred Coal Resources that are included in the life of mine extraction schedule of the respective collieries and are not reported as Coal Reserves. Inferred Coal Resources
outside the LOM plan but within the mine lease area are not reported due to the uncertainty attached to such resources in that it cannot be assumed that all or part of the Inferred Resource will necessarily be upgraded to Indicated or Measured categories through continued exploration. Such Inferred Resources do not necessarily meet the requirements of reasonable prospects for eventual economic extraction, particularly in respect of future mining and processing economics.
Summary of material changes (±10%) at reporting levelCerréjon: Increase in resources is due to the inclusion of previously excluded resources as a result of restrictions imposed by surface features (+729 Mt). Environmental and community restrictions fully stated and now included in the 2010 statement. Re-evaluation of factors influencing economics and technical potential has resulted in the transfer of P500 project and related resource blocks to Coal Deposit (-984 Mt).Isibonelo: As a consequence of the uncertainty associated with Environmental Management Programme Report (EMPR) approval, the Pit 4 Reserves were reallocated to Coal Deposit (-8.7 Mt). Transfer from underground resource to opencast reserve to be optimised by opencast mining (-5.4 Mt).Kriel: Conversion from resources to reserves (+12.9 Mt). Transfer of Block F non-dedicated resources from Kriel Colliery to Project Kriel Block F (-54.2 Mt).Mafube: Reclassification of Probable Reserves and Inferred Resources in Mine Plan to Coal Resources pending the approval for conversion of the Prospecting Right over Nooitgedacht and Wildfontein to a Mining Right (-66.6 Mt).New Denmark: Due to inaccessibility of blocks, the Inferred Resources In Mine Plan were downgraded to Coal Deposit (-12.0 Mt).Nooitgedacht: 5 Seam – Coal Reserves were sterilised due to seam height restrictions (-0.2 Mt).Zibulo: Additional drilling information and increased geological confidence in the 2 seam has resulted in the upgrade of Inferred Resources in Mine Plan to Probable Reserve (+13.8 Mt).Vaal Basin: Increased drilling and geological confidence resulted in an upgrade of Inferred Resources to Indicated and Measured Resources (+200.3 Mt). Previously referred to as VaalbankElders: Increased drilling and geological confidence resulted in an upgrade of the Coal Deposit to Coal Resources (+33.7 Mt).Kriel Block F: Represents the non Eskom dedicated portion of the Kriel Mining Right, owned by Anglo Operations Limited.New Largo: Increased drilling and wash data resulted in an upgrade of Inferred Resources to Indicated and Measured Resources (+142.1 Mt).Nooitgedacht: 2 + 4 Seam – Update of the geological model resulted in upgrade to Measured Resource (+12.9 Mt)South Rand: Increased drilling and geological confidence resulted in an upgrade of the Coal Deposit to Coal Resources (+27.5 Mt). Reclassification based on washability analysis rather than raw
quality as reported in 2009 resulted in downgrade of resources (-53.6 Mt).
Assumption with respect to Mineral TenureMafube: Coal Resources at Nooitgedacht and Wildfontein (approximately 76 Mt Measured) which are intended to be part of mine plan, are held as a Prospecting Right. Application for conversion to a Mining Right will be submitted pending the completion of the Environmental Management Plan (EMP). Anglo American Thermal Coal has reasonable expectation that such conversion will not be withheld.New Largo: The interpretation of wetlands in the latest Mpumalanga Biodiversity Plan has been expanded and as such could affect the Mining Right application. Anglo American has reasonable expectations that such permission will be granted.Zibulo: The Mining Right has been granted and Probable Reserves will be converted to Proved Reserves in 2011.
Royalty PaymentSouth Africa: Royalty payments commenced in February 2010 in accordance with the Royalties Act (No. 28 of 2008) and have been taken into consideration in economic assessment of the reserves.
Reviews by independent third parties were carried out in 2010 on the following Operations and Project areas: Cerrejón, Greenside, New Denmark, New Largo, New Vaal.
(2)
(6) (6) (7) (7)
(2)
(6) (6) (7) (7)
(8)
thermal coal continuedestimates as at 31 December 2010
THERMAL COAL112 Anglo American plc — Fact Book 2010
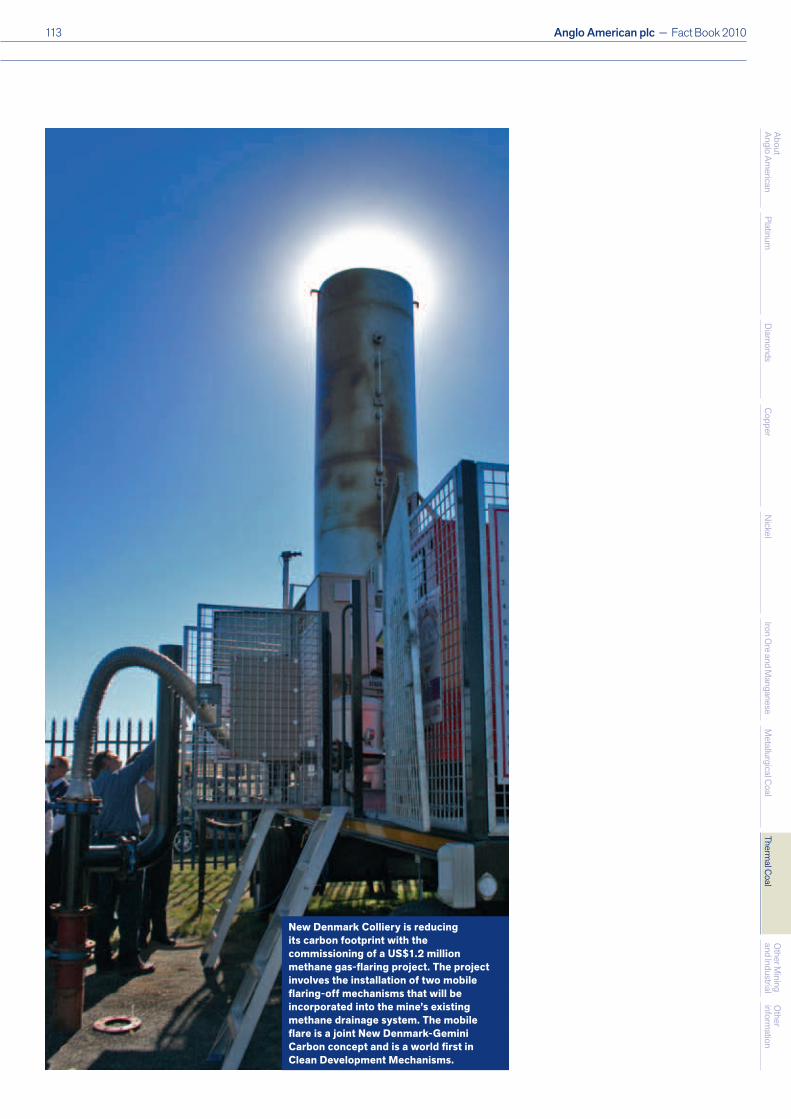
New Denmark Colliery is reducing its carbon footprint with the commissioning of a uS$1.2 million methane gas-flaring project. The project involves the installation of two mobile flaring-off mechanisms that will be incorporated into the mine’s existing methane drainage system. The mobile flare is a joint New Denmark-Gemini Carbon concept and is a world first in Clean Development Mechanisms.
113 Anglo American plc — Fact Book 2010
Other
information
Other M
ining and Industrial
Thermal C
oalM
etallurgical Coal
Iron Ore and M
anganeseN
ickelC
opperD
iamonds
PlatinumAbout Anglo Am
erican