© 2014 HALLIBURTON. ALL RIGHTS RESERVED. Baroid® High Pressure/High Temperature Drilling Solutions.

1
Halliburton
CLIENT REPORT
SONTAG SOLUTIONS
Samuel Kaplan
Reece Denzel
Guy Sherzer

2
Professor Likens' Senior Seminar
Contents
Executive Summary……………………………………………………………………….3
Company Background……………………………………………………………………. 3
General………………………………………………………………………………….. 3
Key Operational Drivers................................................................................................... 5
Baker Hughes.................................................................................................................... 7
Macondo ………………………………………………………………………………8
Current Industry Dynamics.................................................................................................. 9
Financial Analysis.............................................................................................................. 13
Operations……............................................................................................................... 13
Productivity..................................................................................................................... 14
Liquidity & Solvency...................................................................................................... 15
Cash Flows…………………………………….............................................................. 18
Competitive Analysis (Five Forces).................................................................................. 21
Internal Rivalry.................................................................................................................. 21
Buyer Power....................................................................................................................22
Supplier Power................................................................................................................ 22
Threat of New Entrants................................................................................................... 23
Threat of Substitutes....................................................................................................... 23
SWOT Analysis ................................................................................................................ 24
Strengths......................................................................................................................... 24
Weaknesses..................................................................................................................... 25
Opportunities...................................................................................................................26
Threats.............................................................................................................................27
Strategic Recommendations...............................................................................................29
Appendix ........................................................................................................................... 34

3
Executive Summary
Halliburton (the Company) is a leading player in the oil and gas services industry. The
Company is a top performer among its peers with respect to growth, efficiency,
profitability and balance sheet strength. Halliburton currently suffers from an industry
cyclical downturn, as oil prices dropped nearly 50% between June 2014 and December
2014. The Company depends on the capital spending of oil and gas companies to sustain
operations. Therefore, the Halliburton faces 1-2 years of poor cash flow performance, but
even under severe circumstances, will likely meet its obligations. Halliburton and Baker
Hughes have agreed on a merger agreement, which is expected to be executed in the
second half of 2015. While the merger may create initial additional costs, most analysts
expect significant long-term synergies that will put Halliburton in a strong position to
compete with its largest competitor, Schlumberger. In order to make it through the next
1-2 years, Halliburton needs to focus on limiting counterparty risk, prioritize the most
profitable business segments, restructure compensation structure and invest in innovative
technologies
Background
General
Halliburton is the world’s second largest provider of products and services to the oil and
gas industry. The Company was founded in 1919 and has over 75,000 employees in more
than 80 countries representing 140 nationalities.1 Halliburton operates 13 product service
1 Halliburton 10k 2014 page 1

4
lines, which are divided into two divisions: Drilling and Evaluation (D&E) and
Completion and Production (C&P). Each product service line is responsible assisting
clients with strategy, technology development, process development, human capital
development and financial capital allocation. More specifically, the D&E division
provides field and reservoir modeling, drilling, evaluation and precise well-bore
placement solutions that enable customers to model, measure, and optimize their well
construction activities. The C&P division provides cementing, stimulation, well
intervention, pressure control, completion, and pipeline and process services. While
Halliburton operates worldwide, its primary market is the United States and has recently
focused growth opportunities in the Middle East and Asia. Please find a breakdown of
Halliburton’s revenues and operating income by business segment and geographic region
in Charts 1-4 below.2
2 All operational data found in the Halliburton 10k 2014
62%
38%
Chart 1: Revenue Breakdown by Business Segment
Completion andProduction
Drilling and Evaluation
68%
32%
Chart 2: Operating Income Breakdown by Business Segment
Completion andProduction
Drilling and Evaluation

5
Over the past year, Halliburton’s equity has performed poorly, primarily due to the crash
of oil prices in the second half of 2014. Graph 1 (below) illustrates this trend.3
Key Operational Drivers
Given current suppressed oil and gas prices and the distressed environment within the
energy industry, there are three key drivers that will significantly impact the Company’s
operational performance and cash flows.
3 Stock information found on Yahoo! Finance
54%
12%
17%
18%
Chart 3: Revenue Breakdown by Region
North America
Latin America
Europe/Africa/CIS
Middle East/Asia 60%8%
12%
20%
Chart 4: Operating Income Breakdown by Region
North America
Latin America
Europe/Africa/CIS
Middle East/Asia
30
35
40
45
50
55
60
65
70
75
80
Graph 1: Halliburton 1 Year Stock Price
6
1) Customer Capital Expenditures- Halliburton business relies heavily on customer
capital expenditure efforts. In particular, demand for the Company’s products and
services are sensitive to the level of exploration, development and production
activity of oil natural gas companies. The level of capital spending of
Halliburton’s customers depends on market commodity prices. Simplistically, if
oil and natural gas prices are high enough to cover variable costs, companies will
produce. Moreover, customer expansion is more reliant the belief oil and gas
companies have about oil prices in the future rather than what actually happens.
Due to market dynamics out of Halliburton’s control, management has indicated
that “2015 will be a challenging year” (10k 13). The primary concern for the
company going forward must be to cut costs in order to deal with lower capital
spending in the industry.
2) Accounts Receivable- Halliburton depends on a limited number of influential
customers. None of these customers account for more than 10% of the Company’s
business, but the loss of one customer due to bankruptcy or bad relations would
severely impact Halliburton’s performance. The Company bills customers in
arrear, which leaves the possibility of delayed or unpaid invoices. Due to the
depressed oil and gas prices, customers will likely be liquidity constrained, which
may lead to more delayed invoice payments. Halliburton may have its own
liquidity issues and must limit customers stretching receivable days as much as
possible without tarnishing valuable relationships.

7
3) Raw Material Vendors- Many of Halliburton’s product lines are dependent on
timely delivery of raw materials such as, proppants, hydrochloric acid and gels. In
some cases the Company has a relationship with a single provider of these
materials. If vendors become distressed in the current depressed market,
Halliburton could face issues delivering products and services to clients in a
timely manner. The Company must consistently monitor high value vendors to be
certain that these concerns are never realized.
Baker Hughes
On November 16th, 2014 Halliburton and Baker Hughes entered into a merger agreement
in which the Company will acquire all of the outstanding shares of Baker Hughes in a
stock and cash transaction. Baker Hughes is a leading supplier of oilfield services,
products, technology and systems to the worldwide oil and natural gas industry. The
acquisition is intended to boost Halliburton’s market share and technological capabilities
and drive cost synergies between the two industry giants. The merger agreement states
that, “Baker Hughes common stock will be converted into the right to receive 1.12 shares
of [Halliburton] common stock and $19.00 in cash”.4
Halliburton has estimated that approximately 490 million shares of its common stock and
approximately $8.3 billion to be paid in cash. In order to finance the transaction, the
Company has already obtained a commitment for a senior unsecured bridge facility worth
4 Halliburton 10k 2014 page 51

8
$8.6 bn.5 While Halliburton will acquire all of Baker Hughes’ cash flows, the Company
will come close to doubling its debt burden. This higher debt load could 1) reduce the
chances of refinancing other debt securities at attractive rates; 2) limit the Company’s
flexibility to execute on strategic opportunities; 3) damage the Companies ability to fund
capital expenditures and working capital needs. Moreover costs associated with
combining the two companies will reduce cash flows in the early years of the merger.
Therefore, when accounting for interest increases and other acquisition related expenses,
Halliburton’s cost cutting initiatives become even more important over what looks to be a
strained few years. Despite the difficulties relating to the merger, if Halliburton can
efficiently make it through the current market downturn, the Company will become a
significantly stronger player.
Macondo
Halliburton remains liable for lawsuits relating to the British Petroleum Macondo oil well
spill in the Gulf of Mexico. In September 2014, the court ruled that, “(1) BP’s conduct
was reckless, Transocean’s conduct was negligent, and [Halliburton’s] conduct was
negligent, (2) fault for the Macondo blowout, explosion, and spill is apportioned 67% to
BP, 30% to Transocean, and 3% to [Halliburton], and (3) the indemnity and release
clauses in [Halliburton’s] contract with BP are valid and enforceable against BP”.6
During 2014, Halliburton reached an agreement to settle a substantial portion of claims
for approximately $1.1 billion, of which $805 million remains payable as of December
5 Ibid 6 Halliburton 10k 2014 page 9
9
31, 2014, with $367 million expected to be paid during 2015.7 Additionally, certain
insurance companies have notified Halliburton that they do not intent to reimburse the
Company for approximately $200 mm of insurance coverage relating the Macondo
settlements.8 While these one-time expenses are large, they finally provide Halliburton
with vision into the extent of their future expenses relating to the spill.
Current Industry Dynamics
In the second half of 2014 oil prices plummeted. Specifically, WTI spot prices fell from
$108 per barrel in June to $53 per barrel in December and Brent crude spot prices fell
from $115 per barrel in June to $55 per barrel in December.9 Oil prices fell due to a
variety of factors, including weakening demand in Europe and Asia, increased production
in the United States, and the decision by OPEC to maintain levels of production. The oil
supply industry is currently in a prisoner’s dilemma crisis: any producer that cuts supply
risks losing significant market share, but if all producers decrease production, the
industry can increase profits. The suppressed oil prices have caused marginal oilrigs and
wells with higher break-even costs to begin shutting down. If prices continue to stay
depressed many more unprofitable rigs may come offline, which would drastically hurt
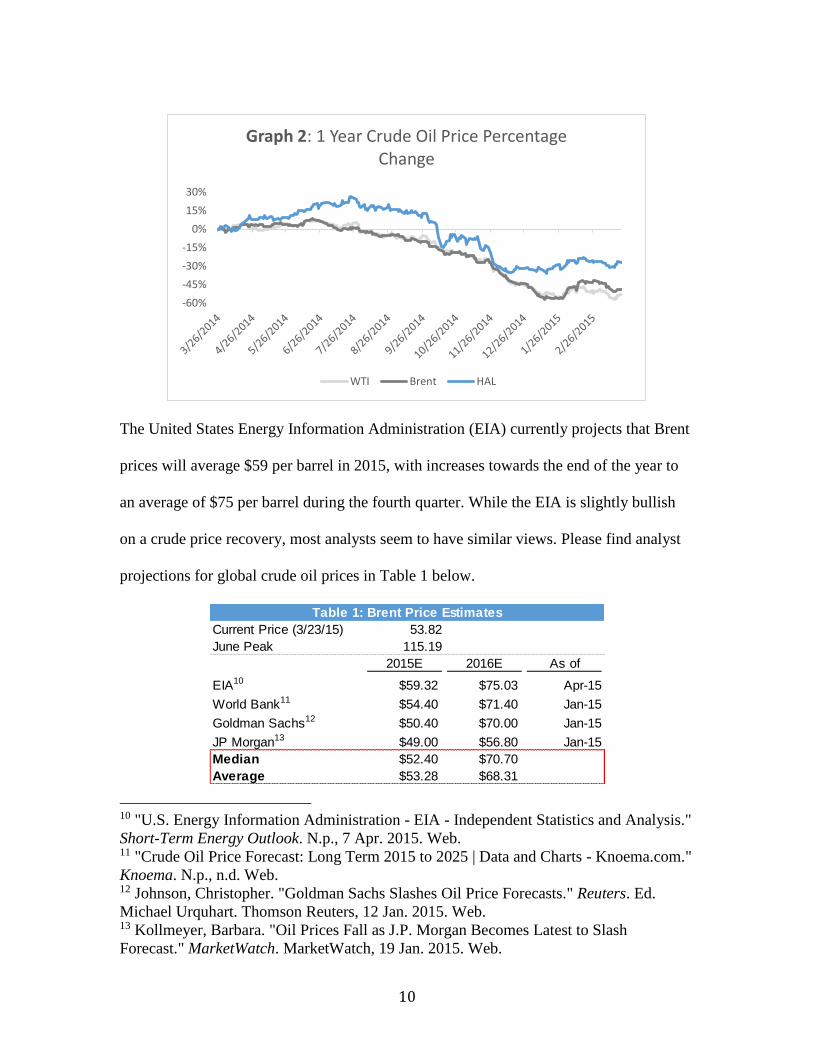
Halliburton’s top line. Graph 2 (below) illustrates the percentage change of crude oil
prices over the past year. Note that Halliburton’s stock price closely follows the price of
crude oil.
7 Halliburton 10k 2014 page 10 8 Ibid 9 All historical oil price information provided by the U.S. Energy Information
Administration (EIA)
10
The United States Energy Information Administration (EIA) currently projects that Brent
prices will average $59 per barrel in 2015, with increases towards the end of the year to
an average of $75 per barrel during the fourth quarter. While the EIA is slightly bullish
on a crude price recovery, most analysts seem to have similar views. Please find analyst
projections for global crude oil prices in Table 1 below.10111213
10 "U.S. Energy Information Administration - EIA - Independent Statistics and Analysis."
Short-Term Energy Outlook. N.p., 7 Apr. 2015. Web. 11 "Crude Oil Price Forecast: Long Term 2015 to 2025 | Data and Charts - Knoema.com."
Knoema. N.p., n.d. Web. 12 Johnson, Christopher. "Goldman Sachs Slashes Oil Price Forecasts." Reuters. Ed.
Michael Urquhart. Thomson Reuters, 12 Jan. 2015. Web. 13 Kollmeyer, Barbara. "Oil Prices Fall as J.P. Morgan Becomes Latest to Slash
Forecast." MarketWatch. MarketWatch, 19 Jan. 2015. Web.
-60%
-45%
-30%
-15%
0%
15%
30%
Graph 2: 1 Year Crude Oil Price Percentage Change
WTI Brent HAL
Table 1: Brent Price Estimates
Current Price (3/23/15) 53.82
June Peak 115.19
2015E 2016E As of
EIA10 $59.32 $75.03 Apr-15
World Bank11 $54.40 $71.40 Jan-15
Goldman Sachs12 $50.40 $70.00 Jan-15
JP Morgan13 $49.00 $56.80 Jan-15
Median $52.40 $70.70
Average $53.28 $68.31
11
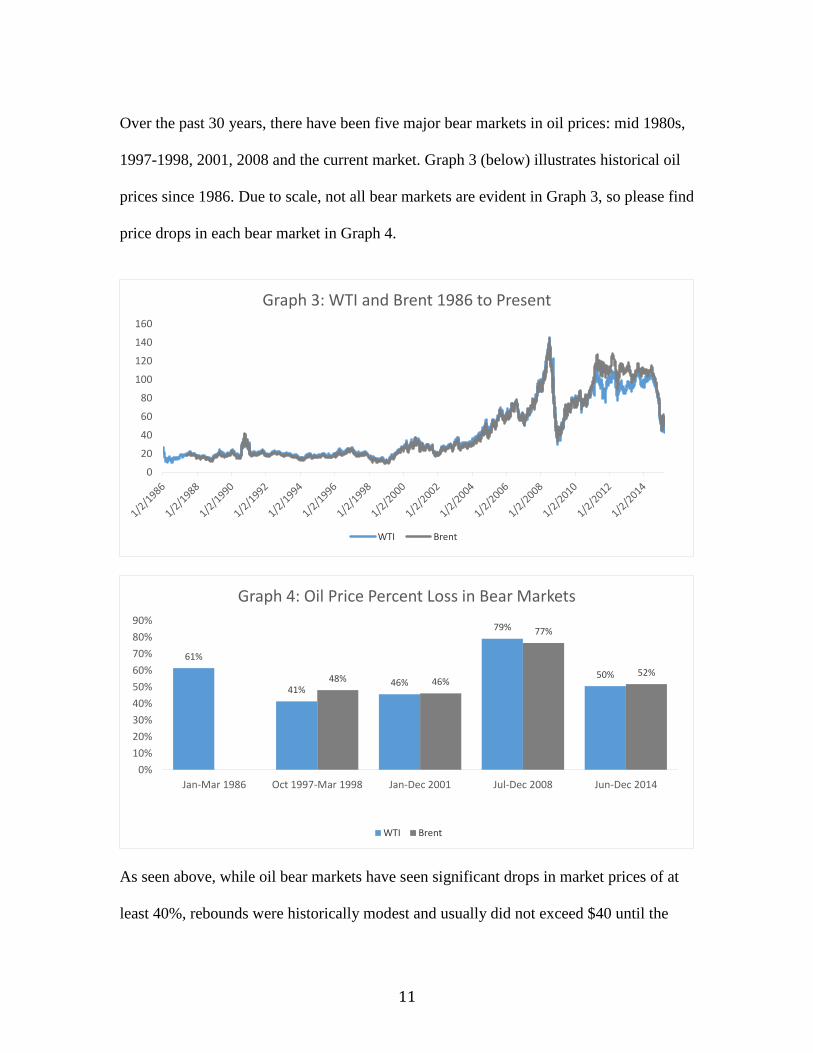
Over the past 30 years, there have been five major bear markets in oil prices: mid 1980s,
1997-1998, 2001, 2008 and the current market. Graph 3 (below) illustrates historical oil
prices since 1986. Due to scale, not all bear markets are evident in Graph 3, so please find
price drops in each bear market in Graph 4.
As seen above, while oil bear markets have seen significant drops in market prices of at
least 40%, rebounds were historically modest and usually did not exceed $40 until the
0
20
40
60
80
100
120
140
160
Graph 3: WTI and Brent 1986 to Present
WTI Brent
61%
41%46%
79%
50%48% 46%
77%
52%
0%
10%
20%
30%
40%
50%
60%
70%
80%
90%
Jan-Mar 1986 Oct 1997-Mar 1998 Jan-Dec 2001 Jul-Dec 2008 Jun-Dec 2014
Graph 4: Oil Price Percent Loss in Bear Markets
WTI Brent

12
mid-2000s. During the great recession, oil prices fell almost 80% following the strongest
bull market in history. However, in 2008, forward prices did not fall with spot prices,
indicating that the market believed the fall in prices was a result of the Great Recession
and prices would rebound to previous levels as the economy moved back toward
expansion. This outlook proved to be correct until the second half of 2014, when, as
discussed above, prices plummeted again. Unlike 2008, forward prices did fall with spot
prices in 2014, demonstrating that the market believes the current market conditions are
due to inherent industry dynamics that may continue to suppress future oil prices. Given
this market reaction and analyst estimates, mid-long term oil prices will likely rebound
modestly as supply and demand rebalance, but will not reach the historically high levels
of 2008 and 2014.
The current market conditions will clearly differentiate the strong long term players and
the poorly managed competitors that may not survive. As seen below in the financial
analysis, Transoecean Ltd (RIG) is a poor performer with negative growth, margins and
interest coverage and asset efficiency well below industry average. With stock prices at
all-time lows, Transocean could be another acquisition candidate for Halliburton. If
conditions continue to deteriorate, Halliburton could potentially buy Transoecean assets
at attractive prices or acquire the entire business to expand its capabilities to offshore.

13
Financial Analysis14
Operations
Despite the weakening market, Halliburton performed remarkably well in 2014 with
annual revenue and net income growth of 11.8% and 62.4%, respectively. However, it is
important to note that in 2013 Halliburton took a $1bn loss on its income statement due to
the Macando well incident. Adjusting 2013 earnings for this non-recurring item
Halliburton’s net income growth falls to approximately 16.4%. Even considering this
adjustment, Halliburton’s growth significantly outpaced the industry average and median,
demonstrating the Company’s ability to win contracts in a tight market. Moreover, after
the oil market plunge, in the fourth quarter Halliburton was able to grow its revenues and
net income year over year 14.9% and 17.1%, respectively. This growth was due to locked
in contracts and Halliburton’s preemptive cost cutting initiatives. Please find
Halliburton’s growth compared with its industry peers in Table 2 below.
14 All financial data for Halliburton and competitors was found on each company’s
respective annual report (10k) for the year ending 2014
Table 2: Growth
Net
Company Revenue Income
Schlumberger 7.3% -18.2%
Baker Hughes 9.8% 56.9%
Weatherford International -2.3% 71.7%
Fluor Corporation -21.3% -21.3%
Transocean -0.8% -240.6%
Average -1.5% -30.3%
Median -0.8% -18.2%
Halliburton 11.8% 62.4%

14
In addition, Halliburton leads the industry with respect to margins. With EBIT, EBITDA
and net income margins of 15.5%, 22,0% and 10.5%, respectively, Halliburton’s cost
efficiency is second only to Schlumberger, the largest player in the industry. As seen in
Table 3 (below), the largest companies have the best overall margins, indicating that
significant cost economies of scale exist within the oil and gas services industry.
Therefore, industry evidence demonstrates that the Company’s merger with Baker
Hughes may yield even better margin performance.
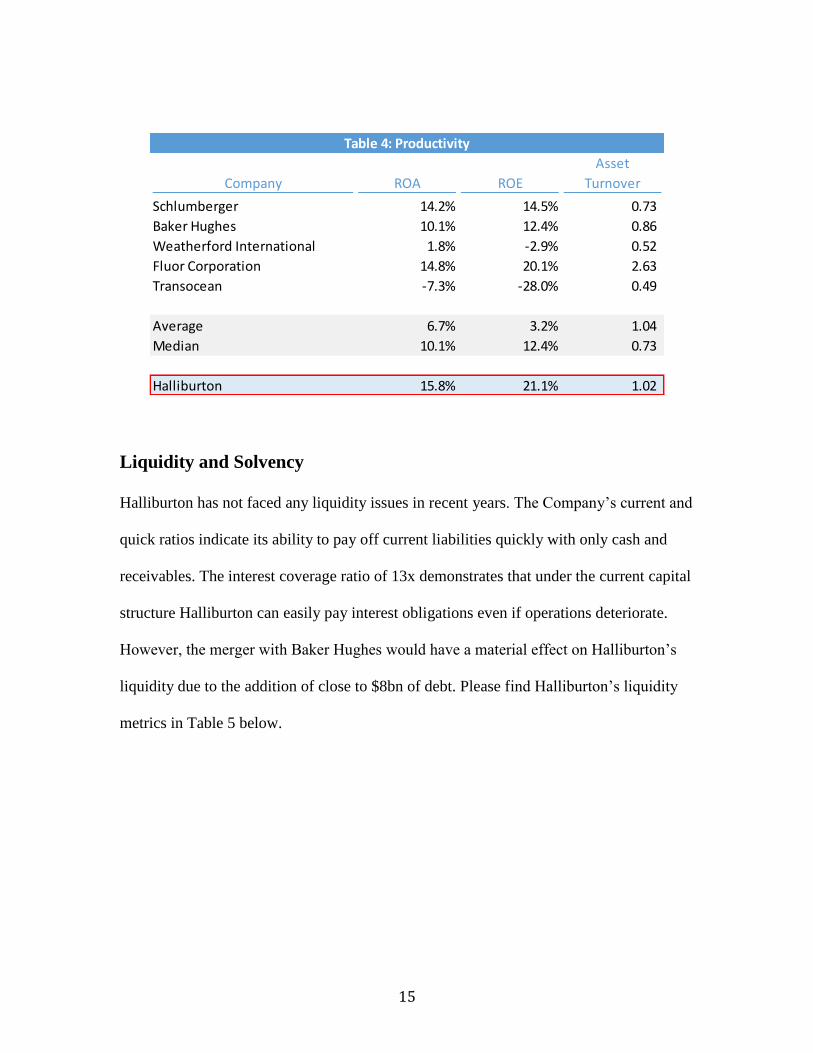
Productivity
The Company’s return on assets (ROA), return on equity (ROE) and asset turnover are all
well above the median among Halliburton’s peers. Halliburton’s 15% ROA and 1.02
asset turnover indicate more efficient use of assets than even Schlumberger. Moreover, if
Halliburton implements best practices in the Baker Hughes merger, there is strong
potential upside to increase the productivity of Baker Hughes as well. Please find
Halliburton’s productivity compared to its industry peers in Table 4 below:
Table 3: Margins
Net Market
Company EBIT EBITDA Income Capitalization
Schlumberger 19.5% 28.0% 11.3% $104,580
Baker Hughes 11.6% 19.0% 7.1% 26,960
Weatherford International 3.4% 12.6% -3.6% 9,330
Fluor Corporation 5.6% 6.5% 3.0% 8,550
Transocean -15.0% -2.6% -21.4% 5,550
Average 5.0% 12.7% -0.7% 30,994
Median 5.6% 12.6% 3.0% 9,330
Halliburton 15.5% 22.0% 10.5% 36,200
15
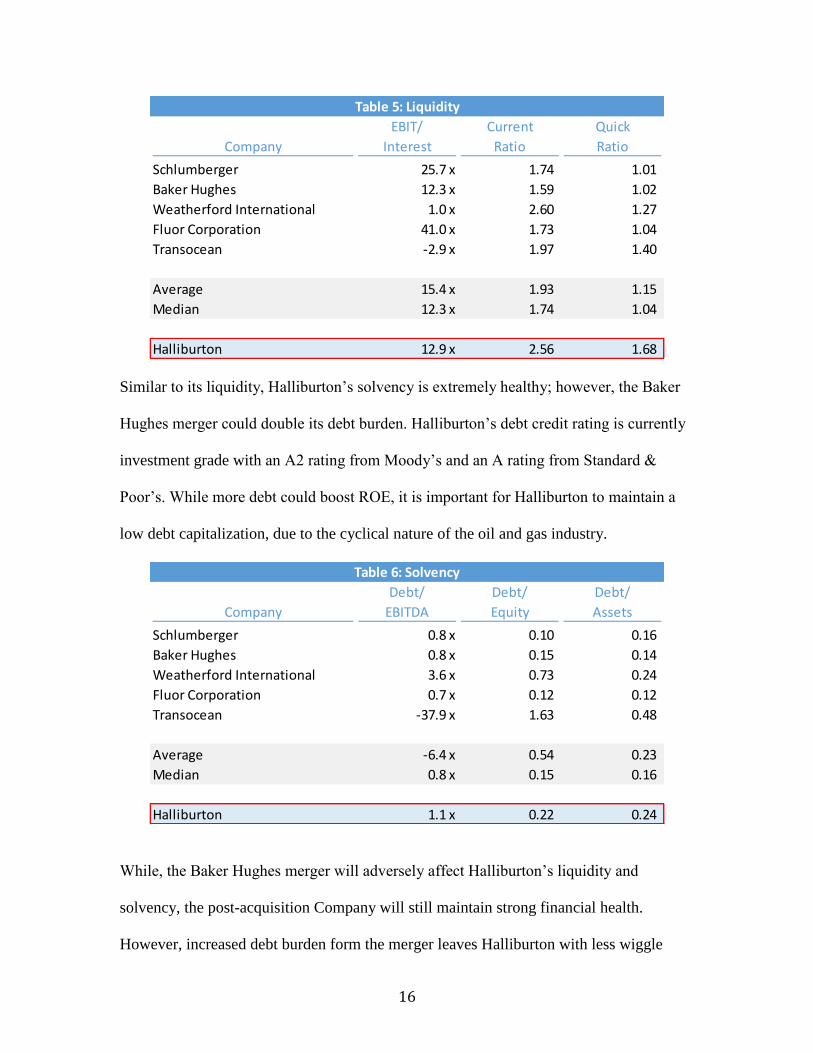
Liquidity and Solvency
Halliburton has not faced any liquidity issues in recent years. The Company’s current and
quick ratios indicate its ability to pay off current liabilities quickly with only cash and
receivables. The interest coverage ratio of 13x demonstrates that under the current capital
structure Halliburton can easily pay interest obligations even if operations deteriorate.
However, the merger with Baker Hughes would have a material effect on Halliburton’s
liquidity due to the addition of close to $8bn of debt. Please find Halliburton’s liquidity
metrics in Table 5 below.
Table 4: Productivity
Asset
Company ROA ROE Turnover
Schlumberger 14.2% 14.5% 0.73
Baker Hughes 10.1% 12.4% 0.86
Weatherford International 1.8% -2.9% 0.52
Fluor Corporation 14.8% 20.1% 2.63
Transocean -7.3% -28.0% 0.49
Average 6.7% 3.2% 1.04
Median 10.1% 12.4% 0.73
Halliburton 15.8% 21.1% 1.02
16
Similar to its liquidity, Halliburton’s solvency is extremely healthy; however, the Baker
Hughes merger could double its debt burden. Halliburton’s debt credit rating is currently
investment grade with an A2 rating from Moody’s and an A rating from Standard &
Poor’s. While more debt could boost ROE, it is important for Halliburton to maintain a
low debt capitalization, due to the cyclical nature of the oil and gas industry.
While, the Baker Hughes merger will adversely affect Halliburton’s liquidity and
solvency, the post-acquisition Company will still maintain strong financial health.
However, increased debt burden form the merger leaves Halliburton with less wiggle
Table 5: Liquidity
EBIT/ Current Quick
Company Interest Ratio Ratio
Schlumberger 25.7 x 1.74 1.01
Baker Hughes 12.3 x 1.59 1.02
Weatherford International 1.0 x 2.60 1.27
Fluor Corporation 41.0 x 1.73 1.04
Transocean -2.9 x 1.97 1.40
Average 15.4 x 1.93 1.15
Median 12.3 x 1.74 1.04
Halliburton 12.9 x 2.56 1.68
Table 6: Solvency
Debt/ Debt/ Debt/
Company EBITDA Equity Assets
Schlumberger 0.8 x 0.10 0.16
Baker Hughes 0.8 x 0.15 0.14
Weatherford International 3.6 x 0.73 0.24
Fluor Corporation 0.7 x 0.12 0.12
Transocean -37.9 x 1.63 0.48
Average -6.4 x 0.54 0.23
Median 0.8 x 0.15 0.16
Halliburton 1.1 x 0.22 0.24

17
room with respect to worse than expected performance during the cyclical downturn.
Please find Halliburton’s pre and post-acquisition pro forma debt capitalization in Tables
7 and 8 below.
Table 7: Debt Capitalization (Pre Acquisition) Table 7: Debt Capitalization Adjusted for Acquisition
Principle Cash
Security Outstanding Interest
3.5% senior notes due August 2023 $1,098 $38
6.15% senior notes due September 2019 998 61
7.45% senior notes due September 2039 995 74
4.75% senior notes due August 2043 898 43
6.7% senior notes due September 2038 800 54
1.0% senior notes due August 2016 600 6
3.25% senior notes due November 2021 499 16
4.5% senior notes due November 2041 498 22
2.0% senior notes due August 2018 400 8
5.9% senior notes due September 2018 400 24
7.6% senior debentures due August 2096 293 22
8.75% senior debentures due February 2021 184 16
6.75% notes due February 2027 104 7
7.53% notes due May 2017 45 3
Other 42
Total 7,854 395
Leverage (Debt/EBITDA) 1.1 x
Interest Coverage (EBIT/Interest) 12.9 x
Weighted Average Interest Rate 5.06%
Table 8: Debt Capitalization Adjusted for Acquisition
Principle Cash
Security Outstanding Interest
Pre Acquisition Debt $7,854 $395
8.75% Senior Secured Bridge Facility 8,300 726
Total 16,154 1,121
Leverage (Debt/EBITDA) 1.4 x
Interest Coverage (EBIT/Interest) 6.1 x
Weighted Average Interest Rate 6.96%

18
Moreover, Halliburton does not currently have any significant debt maturities until its
$600mm of 1% senior notes are due in August of 2016. By the time that ~$2bn worth of
debt matures in 2018 and 2019 Halliburton will likely be able to refinance or pay off its
debt due to better market conditions. Please find a Halliburton’s debt maturities by year
in Table 9 below.
Cash Flows
The most important financial analysis for Halliburton is the cash flow analysis. Due to
current depressed oil prices, Halliburton faces a difficult year ahead with respect to its
cash. Four main factors will drive Halliburton’s cash flows. (1) Weakening supply of oil
will lead to lower demand for the Company, reducing Halliburton’s top line. (2) The
acquisition of Baker Hughes will decrease operating margins for at least one year while
the two companies integrate their operations. (3) Halliburton’s customers will likely try
to stretch receivables in the face of poor market conditions to conserve their own cash.
(4) As stated in the Company’s 2014 10k, Halliburton’s management is committed to
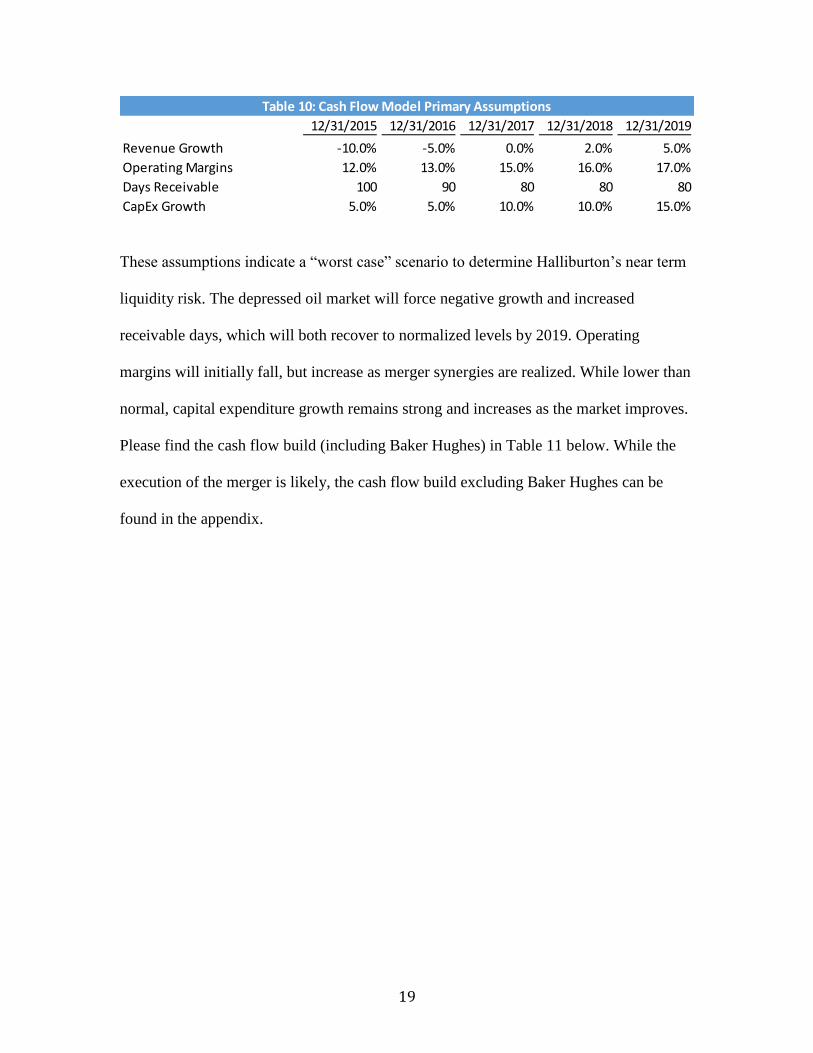
maintaining consistent capital expenditure growth with a long-term market view. Please
find the primary assumptions made in the Halliburton projected cash flow model in Table
10 below.
Table 9: Debt Maturity Risk
Year 12/31/2015 12/31/2016 12/31/2017 12/31/2018 12/31/2019 Thereafter Total
Principle Due $14 $610 $52 $806 $1,000 $5,389 $7,857
19
These assumptions indicate a “worst case” scenario to determine Halliburton’s near term
liquidity risk. The depressed oil market will force negative growth and increased
receivable days, which will both recover to normalized levels by 2019. Operating
margins will initially fall, but increase as merger synergies are realized. While lower than
normal, capital expenditure growth remains strong and increases as the market improves.
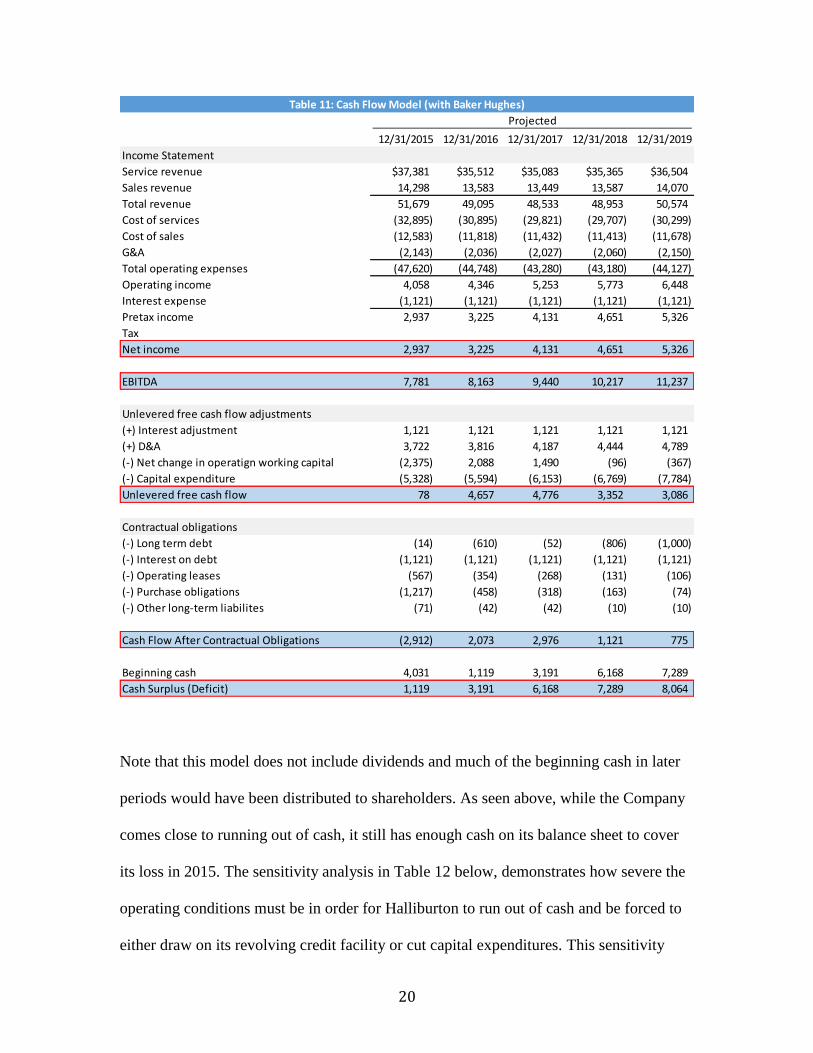
Please find the cash flow build (including Baker Hughes) in Table 11 below. While the
execution of the merger is likely, the cash flow build excluding Baker Hughes can be
found in the appendix.
Table 10: Cash Flow Model Primary Assumptions
12/31/2015 12/31/2016 12/31/2017 12/31/2018 12/31/2019
Revenue Growth -10.0% -5.0% 0.0% 2.0% 5.0%
Operating Margins 12.0% 13.0% 15.0% 16.0% 17.0%
Days Receivable 100 90 80 80 80
CapEx Growth 5.0% 5.0% 10.0% 10.0% 15.0%
20
Note that this model does not include dividends and much of the beginning cash in later
periods would have been distributed to shareholders. As seen above, while the Company
comes close to running out of cash, it still has enough cash on its balance sheet to cover
its loss in 2015. The sensitivity analysis in Table 12 below, demonstrates how severe the
operating conditions must be in order for Halliburton to run out of cash and be forced to
either draw on its revolving credit facility or cut capital expenditures. This sensitivity
Table 11: Cash Flow Model (with Baker Hughes)
Projected
12/31/2015 12/31/2016 12/31/2017 12/31/2018 12/31/2019
Income Statement
Service revenue $37,381 $35,512 $35,083 $35,365 $36,504
Sales revenue 14,298 13,583 13,449 13,587 14,070
Total revenue 51,679 49,095 48,533 48,953 50,574
Cost of services (32,895) (30,895) (29,821) (29,707) (30,299)
Cost of sales (12,583) (11,818) (11,432) (11,413) (11,678)
G&A (2,143) (2,036) (2,027) (2,060) (2,150)
Total operating expenses (47,620) (44,748) (43,280) (43,180) (44,127)
Operating income 4,058 4,346 5,253 5,773 6,448
Interest expense (1,121) (1,121) (1,121) (1,121) (1,121)
Pretax income 2,937 3,225 4,131 4,651 5,326
Tax
Net income 2,937 3,225 4,131 4,651 5,326
EBITDA 7,781 8,163 9,440 10,217 11,237
Unlevered free cash flow adjustments
(+) Interest adjustment 1,121 1,121 1,121 1,121 1,121
(+) D&A 3,722 3,816 4,187 4,444 4,789
(-) Net change in operatign working capital (2,375) 2,088 1,490 (96) (367)
(-) Capital expenditure (5,328) (5,594) (6,153) (6,769) (7,784)
Unlevered free cash flow 78 4,657 4,776 3,352 3,086
Contractual obligations
(-) Long term debt (14) (610) (52) (806) (1,000)
(-) Interest on debt (1,121) (1,121) (1,121) (1,121) (1,121)
(-) Operating leases (567) (354) (268) (131) (106)
(-) Purchase obligations (1,217) (458) (318) (163) (74)
(-) Other long-term liabilites (71) (42) (42) (10) (10)
Cash Flow After Contractual Obligations (2,912) 2,073 2,976 1,121 775
Beginning cash 4,031 1,119 3,191 6,168 7,289
Cash Surplus (Deficit) 1,119 3,191 6,168 7,289 8,064

21
analysis illustrates the effect of receivable days and operating margins. The maximum
loss equals the cash on the balance sheet in the beginning of 2015. Values highlighted in
red indicate situations when Halliburton’s balance sheet cannot cover its cash losses.
Please find Table 12 below.
Competitive Analysis (Five Forces)
Internal Rivalry- High
Although there are thousands of oilfield services companies throughout the world, the
market is dominated by the top five players. While Halliburton sits comfortably as one of
the largest companies in the industry, second only to Schlumberger, the competition
between the leaders in the industry is intense. The top players in the oilfield services
industry are all constantly competing for contracts with the largest customers to maintain
their high volume of business. Depressed oil prices will further exacerbate internal rivalry
by decreasing demand and putting pressure on contract prices.
Table 12: 2015 Cash Flow Sensitivity- Days Receivable vs. Margins
(with Baker Hughes)
Max Loss $4,031 Days Receivable
(2,912) 90 95 100 105 110
15% 705 (13) (731) (1,448) (2,166)
14% (22) (740) (1,458) (2,176) (2,893)
13% (749) (1,467) (2,185) (2,903) (3,621)
12% (1,477) (2,194) (2,912) (3,630) (4,348)
11% (2,204) (2,922) (3,639) (4,357) (5,075)
Operating
Margin
22
Buyer Power- High
While none of Halliburton’s customers represent more than 10% of its revenue, the
Company still depends on a relatively limited number of customers. As the company
stated in its annual report, “the loss of one of our more significant customers could have a
material adverse effect on our business.” This reliance on each customer gives
Halliburton’s customers the bargaining strength to stretch receivables, which could hurt
Halliburton’s cash flows. Customers are increasingly likely to delay or even default on
their obligations during the current cyclical downturn.
In addition, close to 50% of Halliburton’s revenue is generated in the United States.
While there are many customers within the United States, Halliburton has significant
exposure to this particular geographic region and could suffer large losses if there is any
issue with the North American customer base.
Supplier Power- Moderate
The availability and quick delivery of raw materials is essential to Halliburton’s business
and delays will have a negative impact on operations. Moreover, there are some markets
where Halliburton has a relationship with only one supplier for a particular resource.
Therefore, suppliers have some bargaining power over the Company. There is a strong
threat that during the market downturn an important supplier will go out of business,
which would severely hinder Halliburton’s ability to provide high quality products and
services to its customers.

23
Threat of New Entrants- Low
Barriers to entry in the oilfield services industry are high due to high cost of the
equipment used in the oil extraction process. In order to attain any profitable economies
of scale significant capital is required. Some types of pumping trucks at well sites can
cost upwards of $1 million each. The high learning curve and intense rivalry among
existing players also serves as a deterrent for potential industry entrants.
Threat of Substitute Products- Moderate
While there are many alternative energy sources, none are currently technologically
capable of replacing oil and natural gas. Oil and natural gas provide a consistent baseline
source of energy, which cannot be replicated by alternatives. For example, solar energy is
only effective during the day (when the sun is out) and wind energy is generally most
effective at night (when there is the most wind). Since there are no current efficient ways
of storing the energy produced by alternatives, fuels like oil, natural gas and coal are
necessary to maintain consistent baseline energy in power plants. However, if technology
progresses such that energy produced from alternatives can be efficiently stored,
Halliburton’s business will be significantly negatively impacted.

24
SWOT Analysis
Strengths
Diversified Product Offerings – Halliburton is well known within the industry for
consistently delivering a wide array of necessary products and services for oil and gas
extraction. This one-stop-shop characteristic allows the company to more easily retain
existing clients and gain new clients as further oil infrastructure is established. The
Company’s diversified array of income from numerous projects and product lines allows
the Halliburton to hedge risk from a downturn in any one specific point along the
upstream oil and gas extraction process.
Size Advantage – The Company is well positioned to enforce pricing power and has the
resources to deal with any changes in the industry or regulatory environment. As seen in
the financial analysis, the oil field services industry is subject to significant economies of
scale, which allow Halliburton to more efficiently cut costs and create barriers to entry
SWOT Analysis
Strengths Weaknesses
1. Diversified Product Offerings 1. Near Term Cash Flows
2. Size Advantage 2. Exposure to Oil Prices
3. Financial Strength 3. Exposure to Exchange Rates
4. Exposure to Interest Rates
Opportunities Threats
1. Growing Energy Demands 1. Counterparty Risk
2. Complexity of Extraction Process 2. Regulatory Obstacles and Fines
3. Baker Hughes Merger 3. Political and Economic Turmoil
4. Extended Depressed Oil Prices

25
for large contracts. The Baker Hughes merger will further enhance Halliburton’s size
advantage.
Financial Strength- Halliburton is an industry leader in terms of growth, margins and
asset efficiency. Moreover, the Company has minimal risk of financial distress due to its
strong balance sheet. This financial strength gives Halliburton flexibility to execute
quickly on any strategic opportunities that arise. Even the potential increased debt burden
from the Baker Hughes merger will leave Halliburton with a strong liquidity and
solvency metrics.
Weaknesses
Near Term Cash Flow – Halliburton might have difficulties in securing adequate cash
flow to cover its short-term obligations. Capital expenditures consume a significant
portion of overall cash flow, and the company has recently seen an extension of its
timeframe for accounts receivable, further restricting capital flexibility. Additionally,
fines and fees from regulators could tie up much needed capital (such as those from the
BP oil spill). If the Company’s operating and market situation fall weaker than the bear
case outlined above, then Halliburton will be forced to either cut capital expenditure or
increase debt by drawing down on its $3 bn revolving credit facility.
Exposure to Oil Prices – Since new drilling projects are highly sensitive to the market
price of oil, low prices translate into decreased drilling activities across the board. With
oil prices hovering near multi-year lows, demand for oilfield products and services is
26
likely to remain subdued. Thus Halliburton’s top line will suffer as customers cut back
marginal capital spending projects.
Exposure to Exchange Rates- While Halliburton uses derivative instruments, including
forward foreign exchange contracts and foreign exchange options, significant exchange
rate volatility could have an adverse effect on cash flows. The Company notes that a
hypothetical 10% adverse change in the value of foreign currency positions relative to the
United States dollar as of December 31, 2014 would result in a $90mm, pre-tax, loss for
net monetary assets denominated in currencies other than United States dollars. While a
$90mm is insignificant during a booming market, a loss of this size could seriously hurt
Halliburton’s cash flows over the next two years.
Exposure to Interest Rates- Due to floating rate debt securities, Halliburton faces risk that
interest rates will increase. The real risk free rate is currently hovering around 0%, but as
the United States economy continues improve, it is likely that the Federal Reserve will
begin increasing short term rates again. Halliburton’s floating rate debt is fixed to the
LIBOR rate. The company estimates that due to its current interest rate swap positions, a
hypothetical 100 basis point increase in the LIBOR rate would result in approximately an
additional $15 million of interest charges for the year ended December 31, 2014.
Opportunities
Growing Energy Demands– Global consumption of energy continues to rise. Developing
countries in particular will likely continue to rely on petroleum and natural gas to fuel
economic and industrial growth. As demand grows, so too will the need to expand
27
extraction efforts, offering Halliburton the opportunity to capitalize on new projects
internationally and further diversify its business geographically.
Complexity of Extraction Process – As companies try to find oil in hard to reach places
and the oil and gas extraction process becomes increasingly difficult, customers will
require more complex and scientific technology. Halliburton’s continued research and
capital spending puts the Company in strong position to capture a large portion of the
potential market for complex drilling solutions. Moreover, if Halliburton is able to
develop proprietary efficient technology, the Company can boost margins, earnings and
cash flows.
Baker Hughes Merger- The pending merger with Baker Hughes will allow Halliburton to
more effectively compete with Schlumberger, the leading player in the industry. The
combined company will be able to drive cost efficiencies, increase margins and grow at a
faster rate. Some analysts project that the merger will create $2bn in synergies through a
combination of research and development and operations15. However, the merger does
not come without risks. If Halliburton fails to acquire Baker Hughes, the Company could
face a breakup fee as high as $3.5bn if it fails to clear regulatory agencies.
15 De La Merced, Michael J. "Halliburton and Baker Hughes Agree to Friendly $34.6
Billion Merger." DealBook Halliburton and Baker Hughes Agree to Friendly 346 Billion
Merger Comments. New York Times, 17 Nov. 2014. Web.
28
Threats
Counterparty Risk- Halliburton’s most significant risk is its exposure to poorly
performing customers and vendors. As discussed above, if vendors fail to supply the
Company with quality and timely raw materials, Halliburton’s relationships with
customers will be severely tarnished. Moreover, since Halliburton charges all of its
customer on credit, it runs the risk of not being paid for its products and services. Over
the past 5 years, the Company’s allowances for bad debts have ranged between 1.6% and
2.7%. Halliburton currently estimates that, “a hypothetical 100 basis point change in our
estimate of the collectability of our notes and accounts receivable balance as of
December 31, 2014 would have resulted in a $76 million adjustment to 2014 total
operating costs and expenses.” Halliburton’s large customers have the lowest probability
of default given their stronger balance sheets and large credit facilities. Defaulting
accounts will likely be the product of liquidity constraints in smaller industry players.
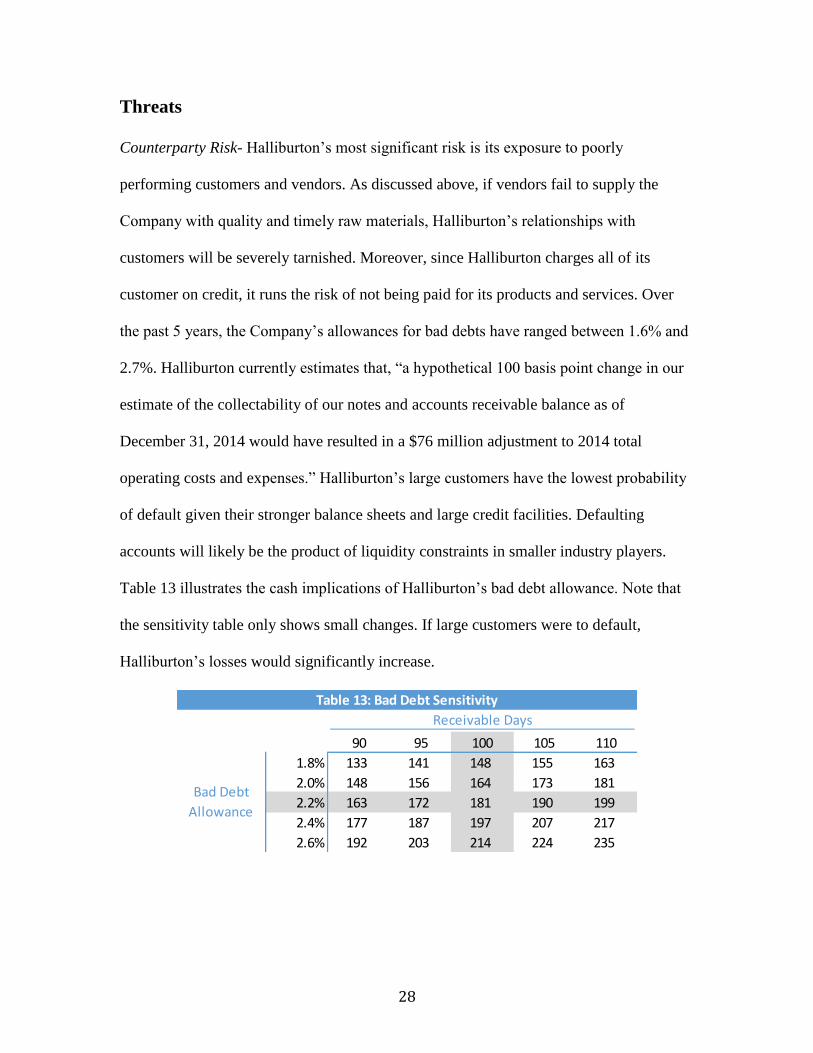
Table 13 illustrates the cash implications of Halliburton’s bad debt allowance. Note that
the sensitivity table only shows small changes. If large customers were to default,
Halliburton’s losses would significantly increase.
Table 13: Bad Debt Sensitivity
Receivable Days
148 90 95 100 105 110
1.8% 133 141 148 155 163
2.0% 148 156 164 173 181
2.2% 163 172 181 190 199
2.4% 177 187 197 207 217
2.6% 192 203 214 224 235
Bad Debt
Allowance

29
Regulatory Obstacles and Fines– Government regulations pose a serious threat to oil and
natural gas extraction both in terms of cost and volume. Incidents like the BP oil spill
continue to put pressure on the fossil fuel extraction industry. Combined with financial
compensation or fees, this regulation could hinder growth.
Political and Economic Turmoil - Oil extraction is highly dependent on stability, both to
continue operations and also to ensure return on capital. Unrest in the Middle East or the
developing world could easily halt production or even cause ownership to change hands.
Additionally, economic instability can strain both the demand for extraction as well as the
ability to undertake long term capital intensive projects like those with which Halliburton
contracts.
Extended Depressed Oil Prices- Halliburton’s financial strength will likely carry it
through the current downturn in the oil market, but the Company cannot sustain business
with oil prices at current levels forever. If the crude market takes longer than expected to
rebound to profitable levels, Halliburton’s operations may be severely impacted.
Strategic Recommendations
Halliburton is an operationally and financially strong company that is prepared to handle
poor industry conditions for the next 1-2 years. If Halliburton is able to weather the
current storm, it will emerge as a much stronger player in the industry due to its Baker
Hughes merger and increasing cost efficiency. The following are strategic
30
recommendations for Halliburton to increase operational performance in the near and
long term.
Focus on High Quality Counterparties- As discussed above, Halliburton’s primary risk
during the current industry downturn is counterparty risk, i.e. the risk that a customer will
not pay their accounts or a vendor will not supply a product on time. Therefore, it is
extremely important that the Company choose its customers and vendors carefully.
Moreover, if Halliburton has enough cash, it may need to cover for its vendor’s lack of
liquidity. For example, Halliburton could finance its vendor’s work in progress
inventories to assure timely delivery of materials.
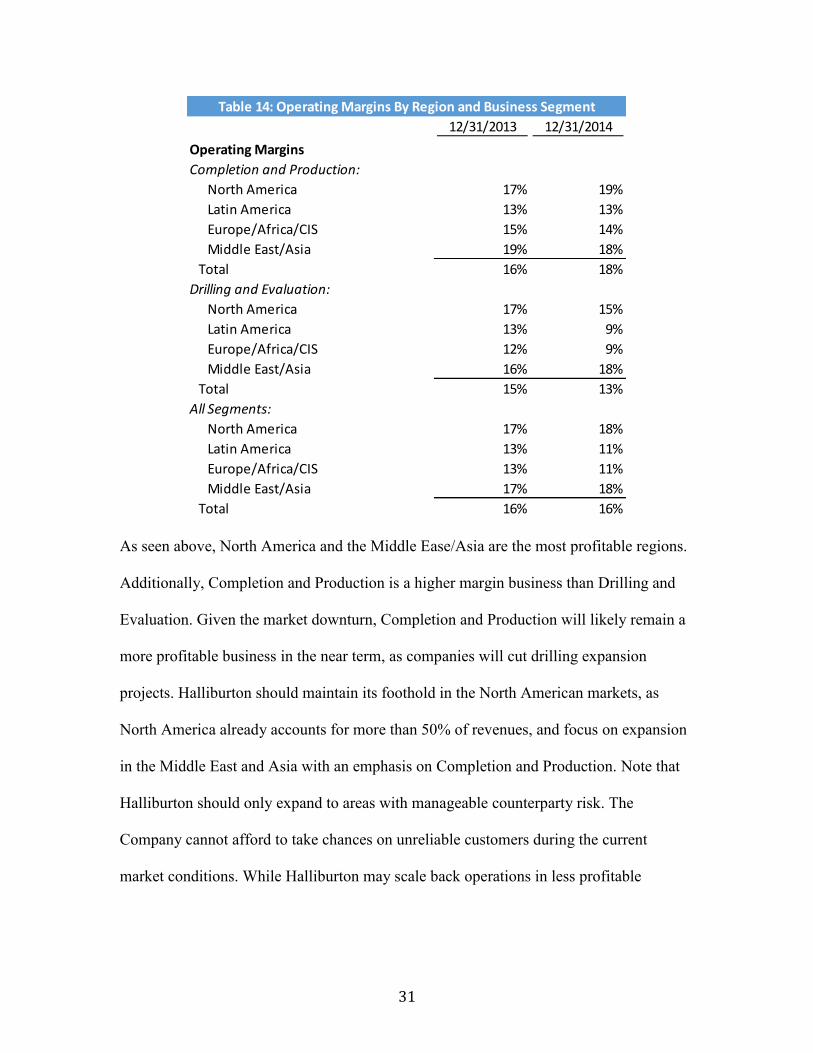
Focus on High Margin Regions and Business Segments- With counterparty quality in
mind, Halliburton must focus resources on the most profitable and reliable business areas,
while cutting back on the underperforming segments. Please find a breakdown of
Halliburton’s operating margins in Table 14 below.
31
As seen above, North America and the Middle Ease/Asia are the most profitable regions.
Additionally, Completion and Production is a higher margin business than Drilling and
Evaluation. Given the market downturn, Completion and Production will likely remain a
more profitable business in the near term, as companies will cut drilling expansion
projects. Halliburton should maintain its foothold in the North American markets, as
North America already accounts for more than 50% of revenues, and focus on expansion
in the Middle East and Asia with an emphasis on Completion and Production. Note that
Halliburton should only expand to areas with manageable counterparty risk. The
Company cannot afford to take chances on unreliable customers during the current
market conditions. While Halliburton may scale back operations in less profitable
Table 14: Operating Margins By Region and Business Segment
12/31/2013 12/31/2014
Operating Margins
Completion and Production:
North America 17% 19%
Latin America 13% 13%
Europe/Africa/CIS 15% 14%
Middle East/Asia 19% 18%
Total 16% 18%
Drilling and Evaluation:
North America 17% 15%
Latin America 13% 9%
Europe/Africa/CIS 12% 9%
Middle East/Asia 16% 18%
Total 15% 13%
All Segments:
North America 17% 18%
Latin America 13% 11%
Europe/Africa/CIS 13% 11%
Middle East/Asia 17% 18%
Total 16% 16%

32
businesses and regions, the Company should maintain presence in every market in order
to diversify and facilitate expansion on the other side of the cycle.
Stock Based Compensation Structure- With significant portion of expenses in the oilfield
services industry coming from employee costs, Halliburton’s ability to implement cash
cost cutting initiatives with its employees will be of great importance. The Company
plans to eliminate redundant corporate positions in its merger with Baker Hughes. When
corporations merge, the threat of layoffs pushes many employees to preemptively reach
out to head hunters to find positions at other firms. However, Halliburton only leads its
industry due to its ability to retain the top talent. Therefore, the Company cannot
eliminate too many jobs without running the risk of strong employees leaving for safer
jobs. Halliburton should save cash on its employee costs by restructuring its
compensation. For example, the Company could pay its employees less cash and more
stock with a five year vesting period.
Invest in Innovative Technology- Most companies within the oil and gas services industry
provide similar products and services. Therefore, the industry leaders have traditionally
used economies of scale and cost leadership to achieve superior profitability. However,
companies can gain a competitive advantage through innovative systems. Halliburton
should focus a portion of its cash on research and development to differentiate its
products. In addition, the Company should be aware of potential acquisition targets that
are developing innovative technologies.
33
Continue “Rainy Day” Fund- As the current market conditions have reminded the
industry, the oil and gas industry is inherently cyclical. Therefore, Halliburton should
continue to maintain significant cash reserves and revolving credit facilities to act as a
shock absorber if the Company is subject to lawsuits or the industry market conditions
further deteriorate.
34
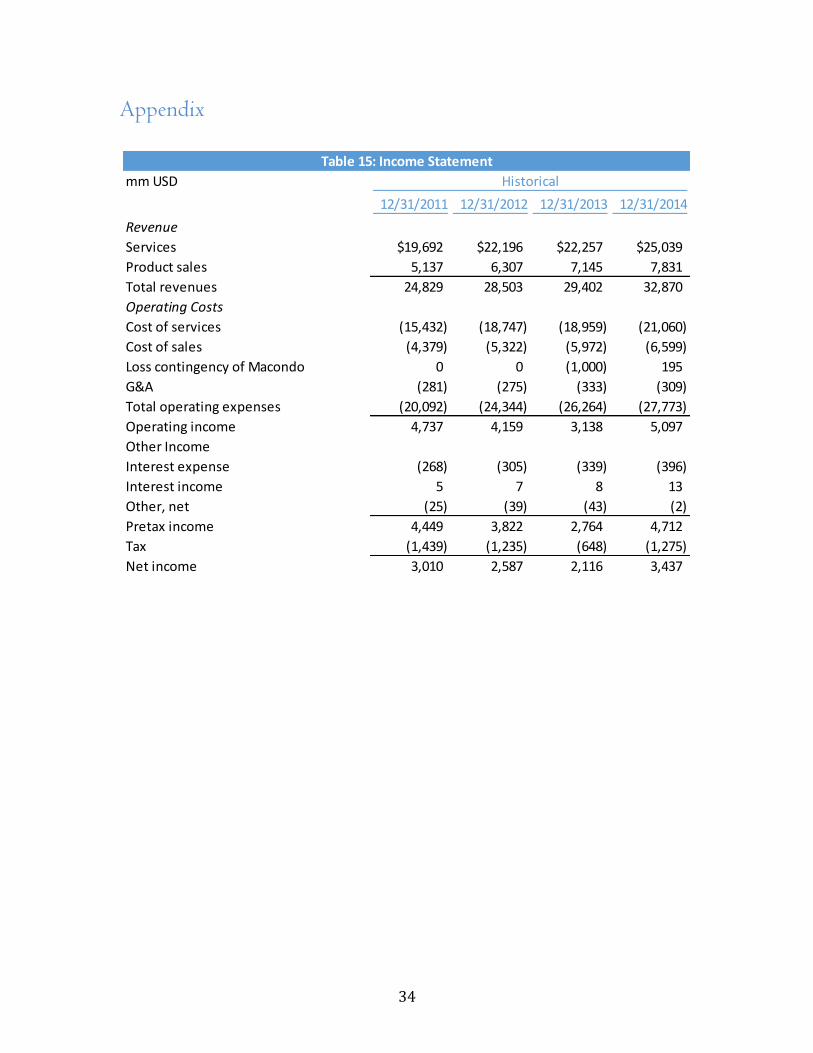
Appendix
Table 15: Income Statement
mm USD Historical
12/31/2011 12/31/2012 12/31/2013 12/31/2014
Revenue
Services $19,692 $22,196 $22,257 $25,039
Product sales 5,137 6,307 7,145 7,831
Total revenues 24,829 28,503 29,402 32,870
Operating Costs
Cost of services (15,432) (18,747) (18,959) (21,060)
Cost of sales (4,379) (5,322) (5,972) (6,599)
Loss contingency of Macondo 0 0 (1,000) 195
G&A (281) (275) (333) (309)
Total operating expenses (20,092) (24,344) (26,264) (27,773)
Operating income 4,737 4,159 3,138 5,097
Other Income
Interest expense (268) (305) (339) (396)
Interest income 5 7 8 13
Other, net (25) (39) (43) (2)
Pretax income 4,449 3,822 2,764 4,712
Tax (1,439) (1,235) (648) (1,275)
Net income 3,010 2,587 2,116 3,437
35
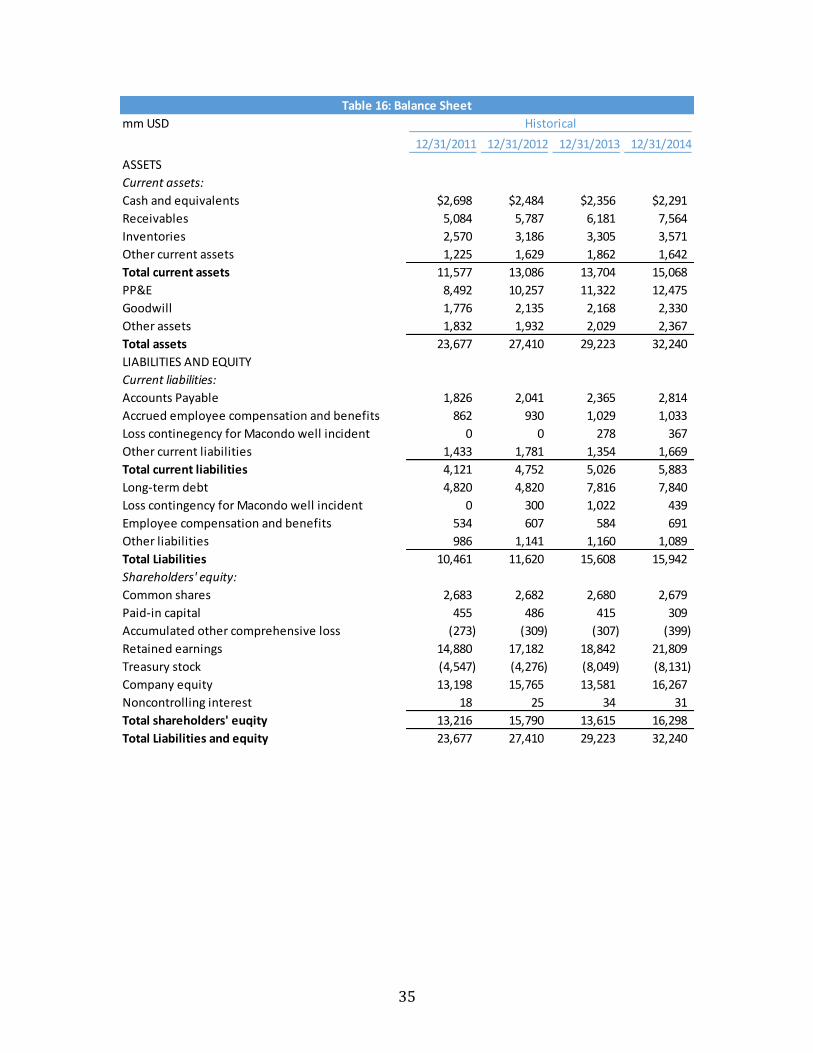
Table 16: Balance Sheet
mm USD Historical
12/31/2011 12/31/2012 12/31/2013 12/31/2014
ASSETS
Current assets:
Cash and equivalents $2,698 $2,484 $2,356 $2,291
Receivables 5,084 5,787 6,181 7,564
Inventories 2,570 3,186 3,305 3,571
Other current assets 1,225 1,629 1,862 1,642
Total current assets 11,577 13,086 13,704 15,068
PP&E 8,492 10,257 11,322 12,475
Goodwill 1,776 2,135 2,168 2,330
Other assets 1,832 1,932 2,029 2,367
Total assets 23,677 27,410 29,223 32,240
LIABILITIES AND EQUITY
Current liabilities:
Accounts Payable 1,826 2,041 2,365 2,814
Accrued employee compensation and benefits 862 930 1,029 1,033
Loss continegency for Macondo well incident 0 0 278 367
Other current liabilities 1,433 1,781 1,354 1,669
Total current liabilities 4,121 4,752 5,026 5,883
Long-term debt 4,820 4,820 7,816 7,840
Loss contingency for Macondo well incident 0 300 1,022 439
Employee compensation and benefits 534 607 584 691
Other liabilities 986 1,141 1,160 1,089
Total Liabilities 10,461 11,620 15,608 15,942
Shareholders' equity:
Common shares 2,683 2,682 2,680 2,679
Paid-in capital 455 486 415 309
Accumulated other comprehensive loss (273) (309) (307) (399)
Retained earnings 14,880 17,182 18,842 21,809
Treasury stock (4,547) (4,276) (8,049) (8,131)
Company equity 13,198 15,765 13,581 16,267
Noncontrolling interest 18 25 34 31
Total shareholders' euqity 13,216 15,790 13,615 16,298
Total Liabilities and equity 23,677 27,410 29,223 32,240

36
Table 17: Cash Flow Statement
mm USD Historical
12/31/2011 12/31/2012 12/31/2013 12/31/2014
Cash flows from operations:
Net income $3,010 $2,587 $2,116 $3,501
Adjustments to reconcile cash flows:
D&A 1,359 1,628 1,900 2,126
Deferred income tax benefit (30) 165 (132) (454)
Activity related to Macondo 0 300 1,000 (569)
Changes in working capital:
Receivables (1,218) (682) (449) (1,375)
Accounts payable 649 200 327 489
Inventories (564) (611) (107) (247)
Payment of Barracuda-Caratinga obligation
Other 478 67 11 591
Total cash flow from operations 3,684 3,654 4,447 4,062
Cash flows from investing:
Capital expenditure (2,953) (3,566) (2,934) (3,283)
Sale of investment securities 1,001 258 356 444
Payments to acquire businesses, net (880) (214) (94) (231)
Purchases of investment securities (501) (506) (329) (183)
Other investing activities 143 340 131 115
Total cash lfows from investing (3,190) (3,688) (2,870) (3,138)
Cash flows from financing activities:
Payments to reacquire common stock 0 0 (4,356) (800)
Dividends (330) (333) (465) (533)
Proceeds from long-term borrowings, net 978 0 2,968 0
Other financing activities 185 161 99 303
Total cash flows from financing 833 (172) (1,754) (1,030)
Effect of exchange rate on cash (27) (8) 49 41
Change in cash and equivalents 1,300 (214) (128) (65)
Cash and equivalents at beginning of period 1,398 2,698 2,484 2,356
Cash and equivalents at end of period 2,698 2,484 2,356 2,291

37
Table 18: Cash Flow Model (w/o Baker Hughes) Table 11: Cash Flow Model (with Baker Hughes)
Projected
12/31/2015 12/31/2016 12/31/2017 12/31/2018 12/31/2019
Income Statement
Service revenue $22,535 $21,408 $20,980 $20,980 $21,400
Sales revenue 7,048 6,696 6,562 6,562 6,693
Total revenue 29,583 28,104 27,542 27,542 28,093
Cost of services (19,831) (18,625) (17,833) (17,623) (17,762)
Cost of sales (6,202) (5,825) (5,577) (5,512) (5,555)
G&A (447) (425) (417) (417) (425)
Total operating expenses (26,480) (24,875) (23,827) (23,552) (23,742)
Operating income 3,103 3,228 3,715 3,990 4,351
Interest expense (411) (411) (411) (411) (411)
Pretax income 2,701 2,821 3,312 3,592 3,953
Tax (810) (846) (994) (1,078) (1,186)
Net income 1,891 1,975 2,319 2,514 2,767
EBITDA 4,993 5,203 6,033 6,504 7,118
Unlevered free cash flow adjustments
(+) Interest adjustment 402 407 402 398 398
(+) D&A 1,891 1,975 2,319 2,514 2,767
(-) Net change in operatign working capital (1,376) 1,174 893 (4) (121)
(-) Capital expenditure (3,447) (3,620) (3,981) (4,380) (5,037)
Unlevered free cash flow (640) 1,912 1,951 1,043 774
Contractual obligations
(-) Long term debt (14) (610) (52) (806) (1,000)
(-) Interest on debt (362) (369) (371) (376) (351)
(-) Operating leases (283) (201) (115) (79) (54)
(-) Purchase obligations (1,100) (429) (289) (118) (29)
(-) Other long-term liabilites (43) (3) (3) (2) (2)
Cash Flow After Contractual Obligations (2,442) 300 1,121 (338) (662)
Beginning cash 2,291 (151) 149 1,270 932
Cash Surplus (Deficit) (151) 149 1,270 932 270
Table 19: 2015 Cash Flow Sensitivity- Days Receivable vs. Margins
(w/o Baker Hughes)
Max Loss $2,291 Days Receivable
(2,442) 90 95 100 105 110
15% (390) (801) (1,211) (1,622) (2,033)
14% (800) (1,211) (1,622) (2,033) (2,443)
13% (1,210) (1,621) (2,032) (2,443) (2,854)
12% (1,620) (2,031) (2,442) (2,853) (3,264)
11% (2,030) (2,441) (2,852) (3,263) (3,674)
Operating
Margin