Hydrostatic pressure promotes endothelial tube formation ...
Advanced Powder Technol., Vol. 17, No. 3, pp. 319–332 (2006)! VSP and Society of Powder Technology, Japan 2006.Also available online - www.vsppub.com
Original paper
Slurry characterization by hydrostatic pressuremeasurement — analysis based on apparentweight flux ratio
TAKAMASA MORI 1,!, KIYOHITO KUNO 1, MAKOTO ITO 1,JUNICHIRO TSUBAKI 1 and TOMOHIRO SAKURAI 2
1 Department of Molecular Design and Engineering, Nagoya University, Furo-cho, Chikusa-ku,Nagoya 464-8603, Japan
2 Sysmex Corp., 4-4-4 Takatsukadai, Nishi-ku, Kobe 651-2271, Japan
Received 27 July 2005; accepted 1 October 2005
Abstract—The flocculation degree of a dense slurry was evaluated by hydrostatic pressure measure-ment. In order to discuss the relationship between the results obtained from the hydrostatic pressuremeasurement and the final packing fraction of a sediment, the ratio of apparent weight flux of thedepositing particle to that of teh settling particle, Ub/Uu was introduced. It was shown that the finalpacking fraction of the sediment increased with Ub/Uu. In addition, the value of Ub/Uu was the-oretically estimated when the particles were well dispersed and hindered settling occurred, and theestimated value was compared with the experimental value in order to discuss the settling behavior indetail.
Keywords: Hydrostatic pressure; ratio of apparent weight flux; packing fraction of sediment; hinderedsettling.
NOMENCLATURE
g gravitational acceleration (m/s2)U particle volumetric flux (m/s)U ! dimensionless particle volumetric flux (—)Ub apparent weight flux of depositing particle (kg/m2/s)Uu apparent weight flux of settling particle (kg/m2/s)P hydrostatic pressure at the bottom (Pa)t settling time (s)
!To whom correspondence should be addressed. E-mail: [email protected]
320 T. Mori et al.
u settling velocity of a particle (m/s)u" terminal settling velocity of a particle (m/s)v velocity of an interface (m/s)
Greek
! volumetric concentration of slurry (—)!0 initial volumetric concentration of a slurry (—)" final packing fraction of a sediment (—)#p particle density (kg/m3)#f liquid density (kg/m3)
1. INTRODUCTION
It is important to accurately evaluate the particle dispersion state of slurries inmany industrial fields, including ceramics, coating and solid–liquid separation.Many investigations have been performed to evaluate the rheological properties ofslurries, such as apparent viscosity [1, 2]; however, it was reported that the apparentviscosity of slurries does not have a good relation with the packing fraction of greenbodies [3–7]. In recent reports [8–10], the properties of slurries were evaluatedby a gravitational settling test, although the experimental time was very long.Alternatively, particle dispersion or flocculation in slurries was directly observed byusing in situ solidification [11]. However, a quicker and easier evaluation of slurryproperties is desirable for enabling its application in industrial fields. In our previousreports, we proposed the hydrostatic pressure measurement method [12, 13] and theconstant pressure filtration method [14]; these can evaluate the particle dispersionstate in a slurry within a short period. For the hydrostatic pressure measurement,the particle dispersion state could be evaluated by monitoring the time change ofhydrostatic pressure at the bottom of the slurry. In our previous report it was shownthat the difference of hydrostatic pressure at the bottom was very clear even thoughthe height of the slurry interface was almost the same [12]. In this report, therelationship between the results of the hydrostatic pressure measurement and finalpacking fraction of the sediment is discussed in detail.
2. EXPERIMENT
2.1. Slurry preparation
Slurries were prepared from abrasive alumina powder (average particle size of3 µm; Fujimi) and distilled water by ball milling for 2 h using alumina ballsin a polyethylene bottle. The solid concentration was 30 vol.%. A solution ofhydrochloric acid was used to adjust the pH values of the slurries in order to controlthe degree of flocculation. The $ potential of this powder was measured using
Slurry characterization by hydrostatic pressure 321
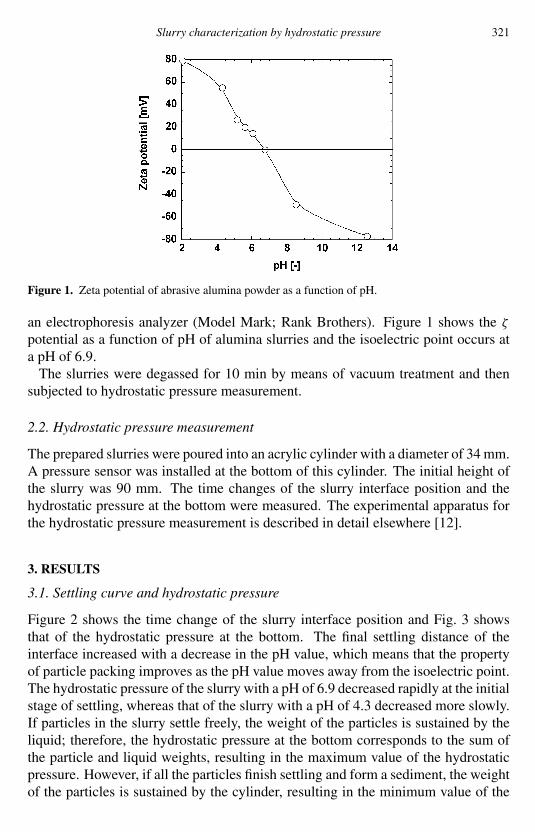
Figure 1. Zeta potential of abrasive alumina powder as a function of pH.
an electrophoresis analyzer (Model Mark; Rank Brothers). Figure 1 shows the $potential as a function of pH of alumina slurries and the isoelectric point occurs ata pH of 6.9.
The slurries were degassed for 10 min by means of vacuum treatment and thensubjected to hydrostatic pressure measurement.
2.2. Hydrostatic pressure measurement
The prepared slurries were poured into an acrylic cylinder with a diameter of 34 mm.A pressure sensor was installed at the bottom of this cylinder. The initial height ofthe slurry was 90 mm. The time changes of the slurry interface position and thehydrostatic pressure at the bottom were measured. The experimental apparatus forthe hydrostatic pressure measurement is described in detail elsewhere [12].
3. RESULTS
3.1. Settling curve and hydrostatic pressure
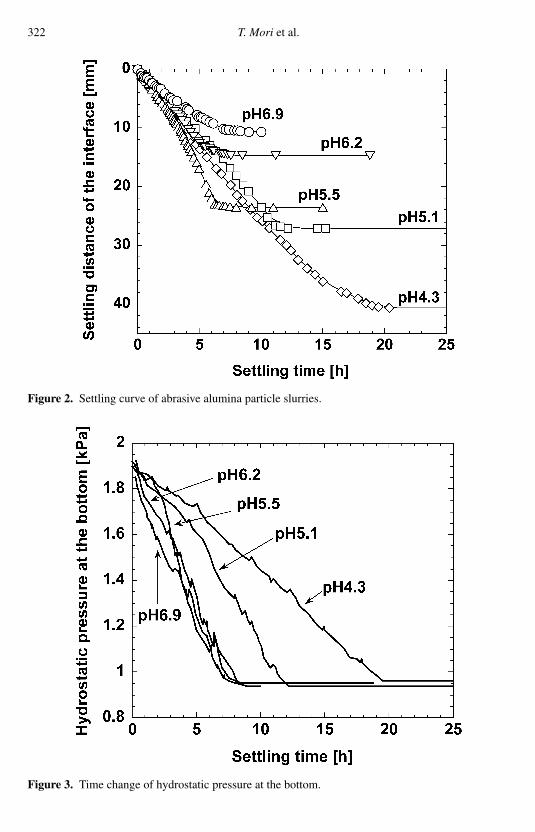
Figure 2 shows the time change of the slurry interface position and Fig. 3 showsthat of the hydrostatic pressure at the bottom. The final settling distance of theinterface increased with a decrease in the pH value, which means that the propertyof particle packing improves as the pH value moves away from the isoelectric point.The hydrostatic pressure of the slurry with a pH of 6.9 decreased rapidly at the initialstage of settling, whereas that of the slurry with a pH of 4.3 decreased more slowly.If particles in the slurry settle freely, the weight of the particles is sustained by theliquid; therefore, the hydrostatic pressure at the bottom corresponds to the sum ofthe particle and liquid weights, resulting in the maximum value of the hydrostaticpressure. However, if all the particles finish settling and form a sediment, the weightof the particles is sustained by the cylinder, resulting in the minimum value of the
322 T. Mori et al.
Figure 2. Settling curve of abrasive alumina particle slurries.
Figure 3. Time change of hydrostatic pressure at the bottom.
Slurry characterization by hydrostatic pressure 323
hydrostatic pressure, which is equal to only the hydrostatic pressure of the liquid.In other words, the hydrostatic pressure decreases with an increase in the particlessettled at the bottom. This implies that we can evaluate particle deposition behaviorfrom the time change of the hydrostatic pressure at the bottom [12, 13]. For theslurry with a pH of 6.9, the particles were flocculated more easily and quickly ascompared to those of the slurry with a pH of 4.3 because the hydrostatic pressuredecreased more rapidly, as shown in Fig. 3.
Initially the hydrostatic pressure of the slurry with a pH of 5.5 decreased at thesame rate as that of the slurry with a pH of 4.3. However, this decreased drasticallyafter 2 h, at which time the rate became almost equal to that of the slurry with a pHof 6.9. Similarly, the hydrostatic pressures of slurries with pH values of 5.1 and 6.2decreased rapidly after 5 h. These results suggest that the particles in these slurrieswere well dispersed initially, followed by flocculation at a certain time, as shown ina previous report [13].
3.2. Relation between apparent viscosity and final packing fraction
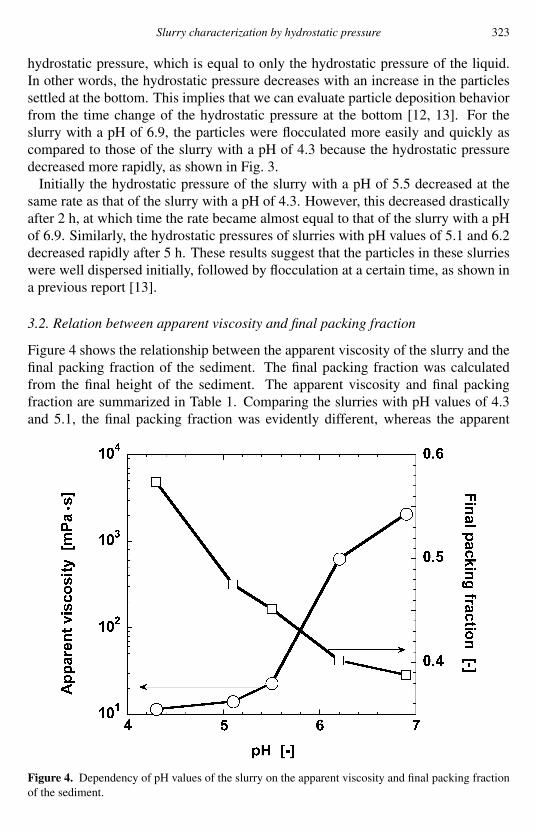
Figure 4 shows the relationship between the apparent viscosity of the slurry and thefinal packing fraction of the sediment. The final packing fraction was calculatedfrom the final height of the sediment. The apparent viscosity and final packingfraction are summarized in Table 1. Comparing the slurries with pH values of 4.3and 5.1, the final packing fraction was evidently different, whereas the apparent
Figure 4. Dependency of pH values of the slurry on the apparent viscosity and final packing fractionof the sediment.
324 T. Mori et al.
Table 1.Apparent viscosity of slurries and final packing fraction of sediments
pH Apparent viscosity (mPa/s) Final packing fraction (—)4.3 11.6 0.5745.1 14.0 0.4755.5 23.0 0.4526.2 635 0.4026.9 2090 0.388
viscosity was nearly the same. In other words, the property of these two slurriescould hardly be distinguished by their apparent viscosity; therefore, the apparentviscosity measurement alone is not sufficient for optimizing the slurry conditions.
4. DISCUSSION
4.1. Definition of ratio of the apparent weight flux
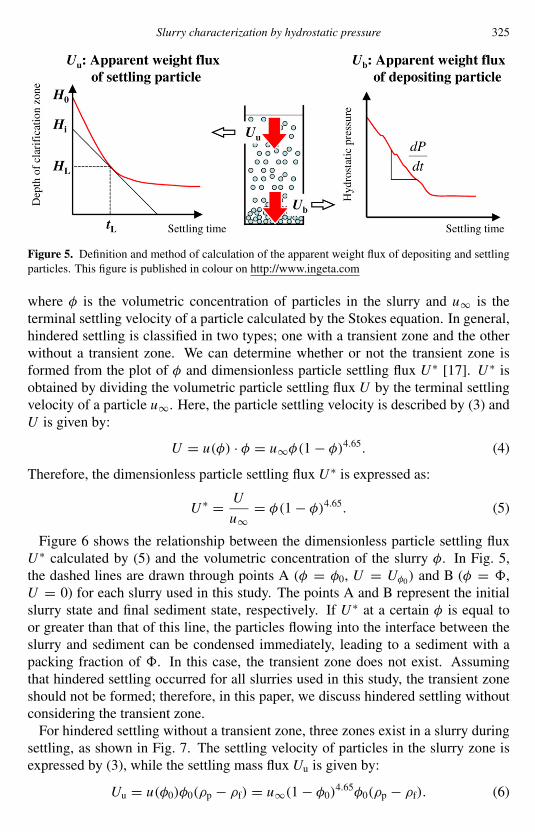
In order to discuss the relation between the final packing fraction and the result ofthe hydrostatic pressure measurement, the ratio of the apparent weight flux, Ub/Uu,shown in Fig. 5 was introduced. Uu is the apparent weight flux of settling particles,which denotes the particle flux settling below the interface between the slurry andsupernatant. Uu can be calculated from the particle volumetric concentration ! andparticle settling velocity u at the interface at a given time t :
Uu = u!(#p # #f). (1)
u and ! can be calculated from a settling curve by Kynch’s theory [15]. Ub
is the apparent weight flux of depositing particles, which denotes the particleflux deposited at the bottom. Ub can be calculated from the time change of thehydrostatic pressure at the bottom:
Ub = #1g
dP
dt. (2)
If particles are well dispersed and freely settled, Uu and Ub would have almost thesame value, i.e. Ub/Uu will almost equal unity. However, if particles flocculateeasily, the particles form a network structure and Ub would exceed Uu. In otherwords, the value of Ub/Uu will be lower when the particles are well dispersed.
4.2. Uu/Ub for hindered settling
When particles are well dispersed and hindered settling occurs, Ub/Uu can beestimated theoretically by the following equations. Here, for simplicity, we considera mono-size particle system and the settling velocity of the particles obeys theRichardson–Zaki equation [16]:
u(!) = u"(1 # !)4.65, (3)
Slurry characterization by hydrostatic pressure 325
Figure 5. Definition and method of calculation of the apparent weight flux of depositing and settlingparticles. This figure is published in colour on http://www.ingeta.com
where ! is the volumetric concentration of particles in the slurry and u" is theterminal settling velocity of a particle calculated by the Stokes equation. In general,hindered settling is classified in two types; one with a transient zone and the otherwithout a transient zone. We can determine whether or not the transient zone isformed from the plot of ! and dimensionless particle settling flux U ! [17]. U ! isobtained by dividing the volumetric particle settling flux U by the terminal settlingvelocity of a particle u". Here, the particle settling velocity is described by (3) andU is given by:
U = u(!) · ! = u"!(1 # !)4.65. (4)
Therefore, the dimensionless particle settling flux U ! is expressed as:
U ! = U
u"= !(1 # !)4.65. (5)
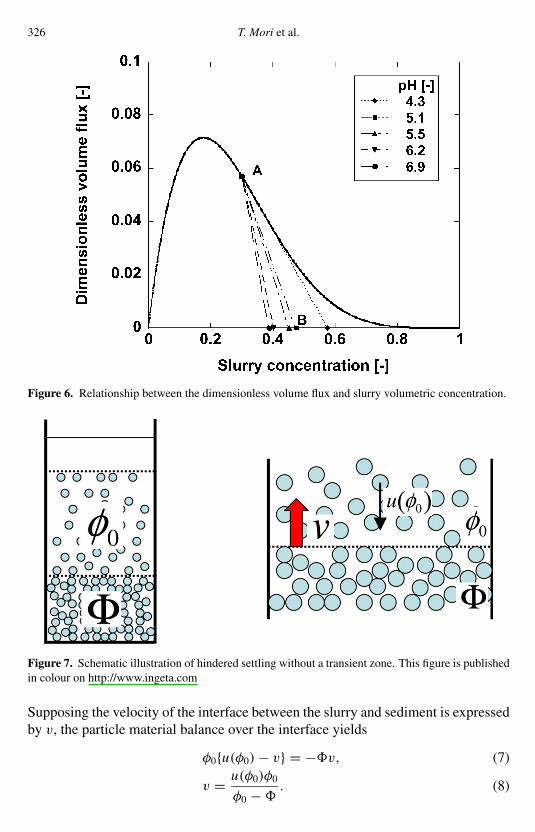
Figure 6 shows the relationship between the dimensionless particle settling fluxU ! calculated by (5) and the volumetric concentration of the slurry !. In Fig. 5,the dashed lines are drawn through points A (! = !0, U = U!0) and B (! = ",U = 0) for each slurry used in this study. The points A and B represent the initialslurry state and final sediment state, respectively. If U ! at a certain ! is equal toor greater than that of this line, the particles flowing into the interface between theslurry and sediment can be condensed immediately, leading to a sediment with apacking fraction of ". In this case, the transient zone does not exist. Assumingthat hindered settling occurred for all slurries used in this study, the transient zoneshould not be formed; therefore, in this paper, we discuss hindered settling withoutconsidering the transient zone.
For hindered settling without a transient zone, three zones exist in a slurry duringsettling, as shown in Fig. 7. The settling velocity of particles in the slurry zone isexpressed by (3), while the settling mass flux Uu is given by:
Uu = u(!0)!0(#p # #f) = u"(1 # !0)4.65!0(#p # #f). (6)
326 T. Mori et al.
Figure 6. Relationship between the dimensionless volume flux and slurry volumetric concentration.
Figure 7. Schematic illustration of hindered settling without a transient zone. This figure is publishedin colour on http://www.ingeta.com
Supposing the velocity of the interface between the slurry and sediment is expressedby v, the particle material balance over the interface yields
!0{u(!0) # v} = #"v, (7)
v = u(!0)!0
!0 # ". (8)
Slurry characterization by hydrostatic pressure 327
Therefore, Ub is calculated by the following equation:
Ub = #v"(#p # #f) = u"(1 # !0)4.65 !0"
" # !0(#p # #f). (9)
Combining (4) and (7), the ratio of the apparent weight flux of the depositingparticle to that of the settling particle is given by:
Ub
Uu= "
" # !0. (10)
4.3. Comparison of the ratio of the apparent weight flux between experiment andcalculation
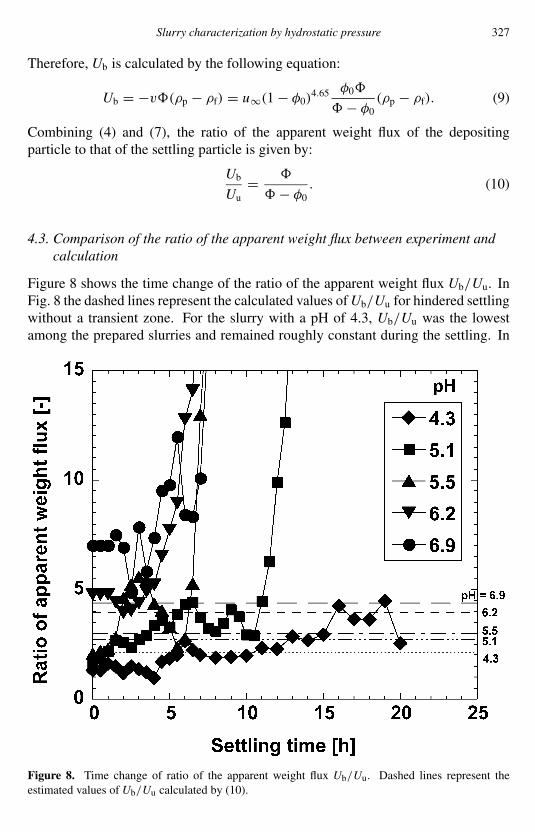
Figure 8 shows the time change of the ratio of the apparent weight flux Ub/Uu. InFig. 8 the dashed lines represent the calculated values of Ub/Uu for hindered settlingwithout a transient zone. For the slurry with a pH of 4.3, Ub/Uu was the lowestamong the prepared slurries and remained roughly constant during the settling. In
Figure 8. Time change of ratio of the apparent weight flux Ub/Uu. Dashed lines represent theestimated values of Ub/Uu calculated by (10).
328 T. Mori et al.
addition, the experimental value was quite similar to the calculated value; therefore,the particles were well dispersed and settled. However, at the initial stage of settlingfor the slurry with a pH of 6.9, Ub/Uu obtained from the experiment was greaterthan the calculated value. Further, the value increased drastically after several hours.This means that the particles settled by a flocculate at the beginning of the settlingand then formed the network structure, because the particles were strongly attractedto each other. In the case of slurries with pH values of 5.1, 5.5 and 6.2, Ub/Uu
was close to the calculated value initially, suggesting that the particles were welldispersed at the initial stage of settling. However, at a certain settling time, particlesbegan to flocculate and this resulted in a rapid increase of Ub/Uu.
4.4. Relationship between Ub/Uu and final packing fraction
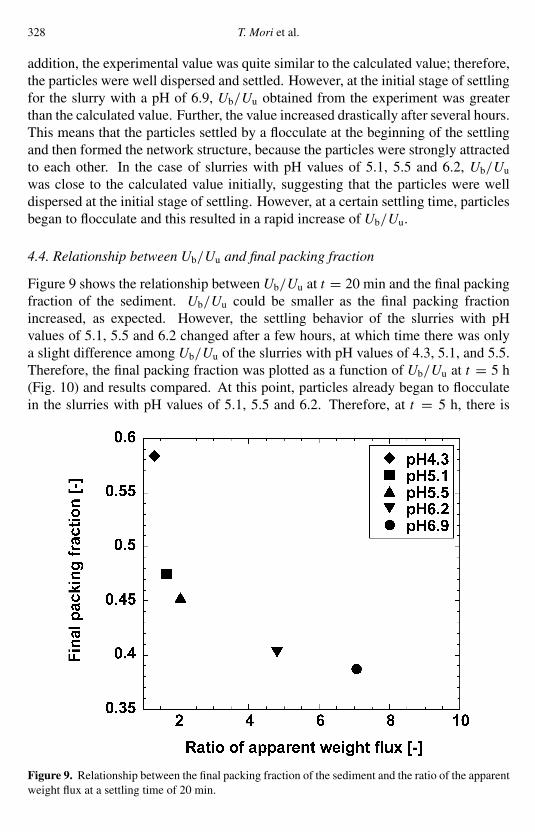
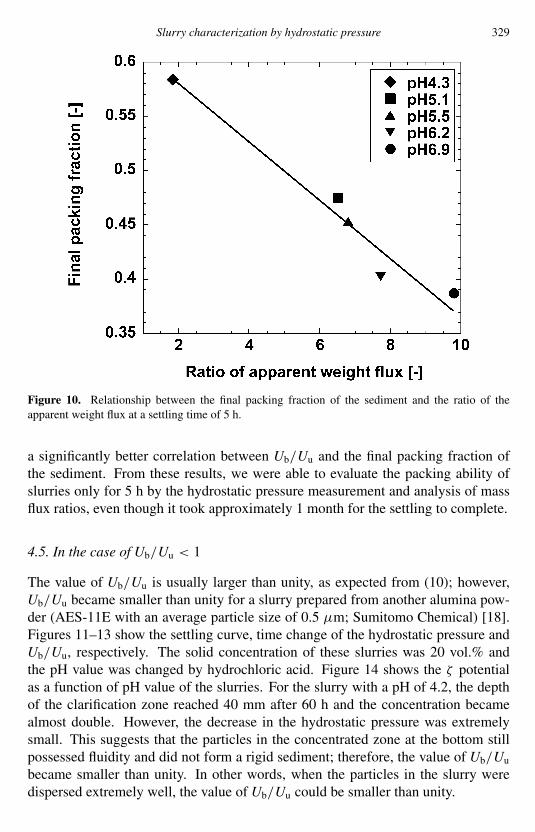
Figure 9 shows the relationship between Ub/Uu at t = 20 min and the final packingfraction of the sediment. Ub/Uu could be smaller as the final packing fractionincreased, as expected. However, the settling behavior of the slurries with pHvalues of 5.1, 5.5 and 6.2 changed after a few hours, at which time there was onlya slight difference among Ub/Uu of the slurries with pH values of 4.3, 5.1, and 5.5.Therefore, the final packing fraction was plotted as a function of Ub/Uu at t = 5 h(Fig. 10) and results compared. At this point, particles already began to flocculatein the slurries with pH values of 5.1, 5.5 and 6.2. Therefore, at t = 5 h, there is
Figure 9. Relationship between the final packing fraction of the sediment and the ratio of the apparentweight flux at a settling time of 20 min.
Slurry characterization by hydrostatic pressure 329
Figure 10. Relationship between the final packing fraction of the sediment and the ratio of theapparent weight flux at a settling time of 5 h.
a significantly better correlation between Ub/Uu and the final packing fraction ofthe sediment. From these results, we were able to evaluate the packing ability ofslurries only for 5 h by the hydrostatic pressure measurement and analysis of massflux ratios, even though it took approximately 1 month for the settling to complete.
4.5. In the case of Ub/Uu < 1
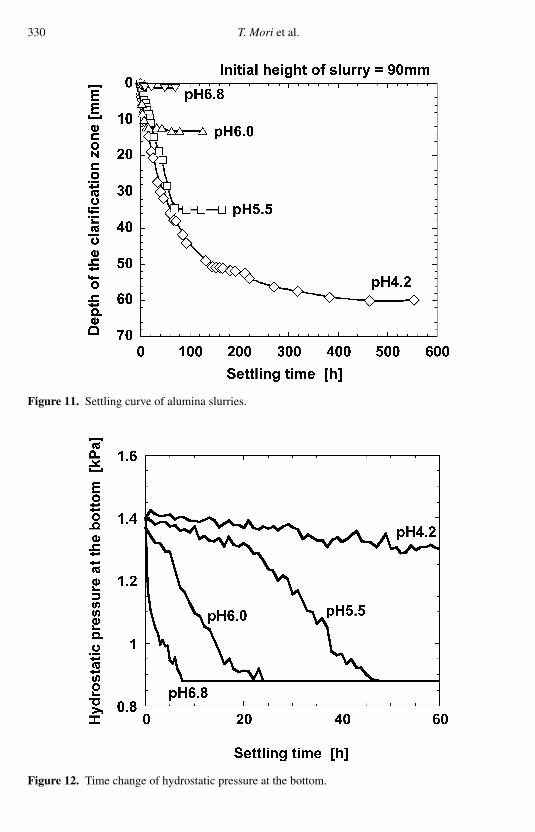
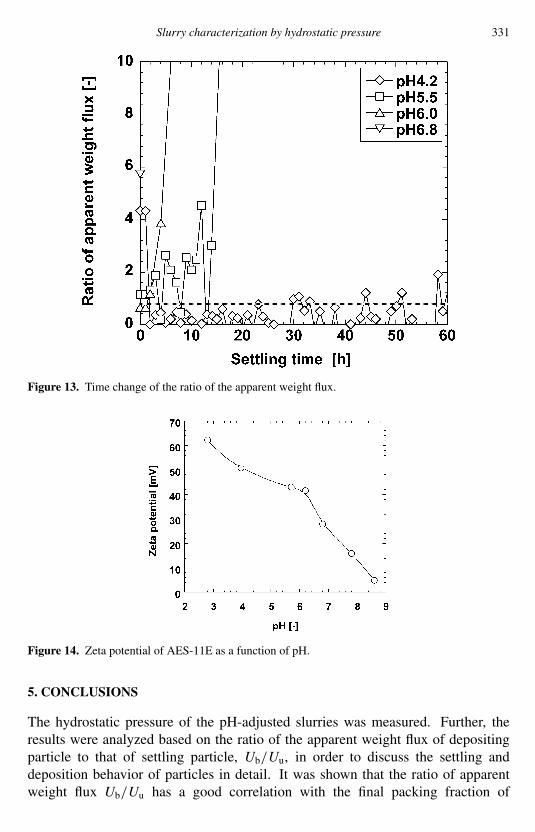
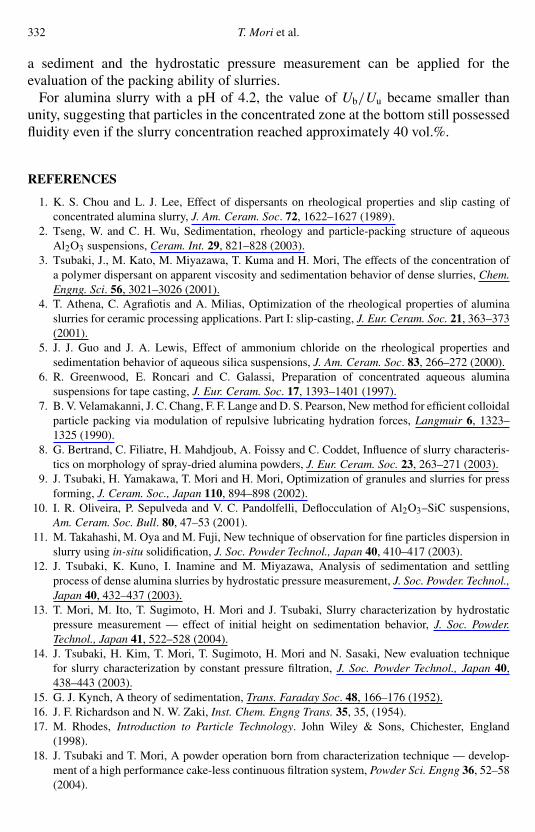
The value of Ub/Uu is usually larger than unity, as expected from (10); however,Ub/Uu became smaller than unity for a slurry prepared from another alumina pow-der (AES-11E with an average particle size of 0.5 µm; Sumitomo Chemical) [18].Figures 11–13 show the settling curve, time change of the hydrostatic pressure andUb/Uu, respectively. The solid concentration of these slurries was 20 vol.% andthe pH value was changed by hydrochloric acid. Figure 14 shows the $ potentialas a function of pH value of the slurries. For the slurry with a pH of 4.2, the depthof the clarification zone reached 40 mm after 60 h and the concentration becamealmost double. However, the decrease in the hydrostatic pressure was extremelysmall. This suggests that the particles in the concentrated zone at the bottom stillpossessed fluidity and did not form a rigid sediment; therefore, the value of Ub/Uu
became smaller than unity. In other words, when the particles in the slurry weredispersed extremely well, the value of Ub/Uu could be smaller than unity.
330 T. Mori et al.
Figure 11. Settling curve of alumina slurries.
Figure 12. Time change of hydrostatic pressure at the bottom.
Slurry characterization by hydrostatic pressure 331
Figure 13. Time change of the ratio of the apparent weight flux.
Figure 14. Zeta potential of AES-11E as a function of pH.
5. CONCLUSIONS
The hydrostatic pressure of the pH-adjusted slurries was measured. Further, theresults were analyzed based on the ratio of the apparent weight flux of depositingparticle to that of settling particle, Ub/Uu, in order to discuss the settling anddeposition behavior of particles in detail. It was shown that the ratio of apparentweight flux Ub/Uu has a good correlation with the final packing fraction of
332 T. Mori et al.
a sediment and the hydrostatic pressure measurement can be applied for theevaluation of the packing ability of slurries.
For alumina slurry with a pH of 4.2, the value of Ub/Uu became smaller thanunity, suggesting that particles in the concentrated zone at the bottom still possessedfluidity even if the slurry concentration reached approximately 40 vol.%.
REFERENCES
1. K. S. Chou and L. J. Lee, Effect of dispersants on rheological properties and slip casting ofconcentrated alumina slurry, J. Am. Ceram. Soc. 72, 1622–1627 (1989).
2. Tseng, W. and C. H. Wu, Sedimentation, rheology and particle-packing structure of aqueousAl2O3 suspensions, Ceram. Int. 29, 821–828 (2003).
3. Tsubaki, J., M. Kato, M. Miyazawa, T. Kuma and H. Mori, The effects of the concentration ofa polymer dispersant on apparent viscosity and sedimentation behavior of dense slurries, Chem.Engng. Sci. 56, 3021–3026 (2001).
4. T. Athena, C. Agrafiotis and A. Milias, Optimization of the rheological properties of aluminaslurries for ceramic processing applications. Part I: slip-casting, J. Eur. Ceram. Soc. 21, 363–373(2001).
5. J. J. Guo and J. A. Lewis, Effect of ammonium chloride on the rheological properties andsedimentation behavior of aqueous silica suspensions, J. Am. Ceram. Soc. 83, 266–272 (2000).
6. R. Greenwood, E. Roncari and C. Galassi, Preparation of concentrated aqueous aluminasuspensions for tape casting, J. Eur. Ceram. Soc. 17, 1393–1401 (1997).
7. B. V. Velamakanni, J. C. Chang, F. F. Lange and D. S. Pearson, New method for efficient colloidalparticle packing via modulation of repulsive lubricating hydration forces, Langmuir 6, 1323–1325 (1990).
8. G. Bertrand, C. Filiatre, H. Mahdjoub, A. Foissy and C. Coddet, Influence of slurry characteris-tics on morphology of spray-dried alumina powders, J. Eur. Ceram. Soc. 23, 263–271 (2003).
9. J. Tsubaki, H. Yamakawa, T. Mori and H. Mori, Optimization of granules and slurries for pressforming, J. Ceram. Soc., Japan 110, 894–898 (2002).
10. I. R. Oliveira, P. Sepulveda and V. C. Pandolfelli, Deflocculation of Al2O3–SiC suspensions,Am. Ceram. Soc. Bull. 80, 47–53 (2001).
11. M. Takahashi, M. Oya and M. Fuji, New technique of observation for fine particles dispersion inslurry using in-situ solidification, J. Soc. Powder Technol., Japan 40, 410–417 (2003).
12. J. Tsubaki, K. Kuno, I. Inamine and M. Miyazawa, Analysis of sedimentation and settlingprocess of dense alumina slurries by hydrostatic pressure measurement, J. Soc. Powder. Technol.,Japan 40, 432–437 (2003).
13. T. Mori, M. Ito, T. Sugimoto, H. Mori and J. Tsubaki, Slurry characterization by hydrostaticpressure measurement — effect of initial height on sedimentation behavior, J. Soc. Powder.Technol., Japan 41, 522–528 (2004).
14. J. Tsubaki, H. Kim, T. Mori, T. Sugimoto, H. Mori and N. Sasaki, New evaluation techniquefor slurry characterization by constant pressure filtration, J. Soc. Powder Technol., Japan 40,438–443 (2003).
15. G. J. Kynch, A theory of sedimentation, Trans. Faraday Soc. 48, 166–176 (1952).16. J. F. Richardson and N. W. Zaki, Inst. Chem. Engng Trans. 35, 35, (1954).17. M. Rhodes, Introduction to Particle Technology. John Wiley & Sons, Chichester, England
(1998).18. J. Tsubaki and T. Mori, A powder operation born from characterization technique — develop-
ment of a high performance cake-less continuous filtration system, Powder Sci. Engng 36, 52–58(2004).