Sifting through the ASHes - · PDF fileSifting through the ASHes Performance Analysis with...
50
Sifting through the ASHes Performance Analysis with the Oracle 10g Active Session History Graham Wood [email protected] Oracle Corporation
Transcript of Sifting through the ASHes - · PDF fileSifting through the ASHes Performance Analysis with...

Sifting through the ASHes Performance Analysis with the Oracle 10g
Active Session HistoryGraham Wood
Oracle Corporation
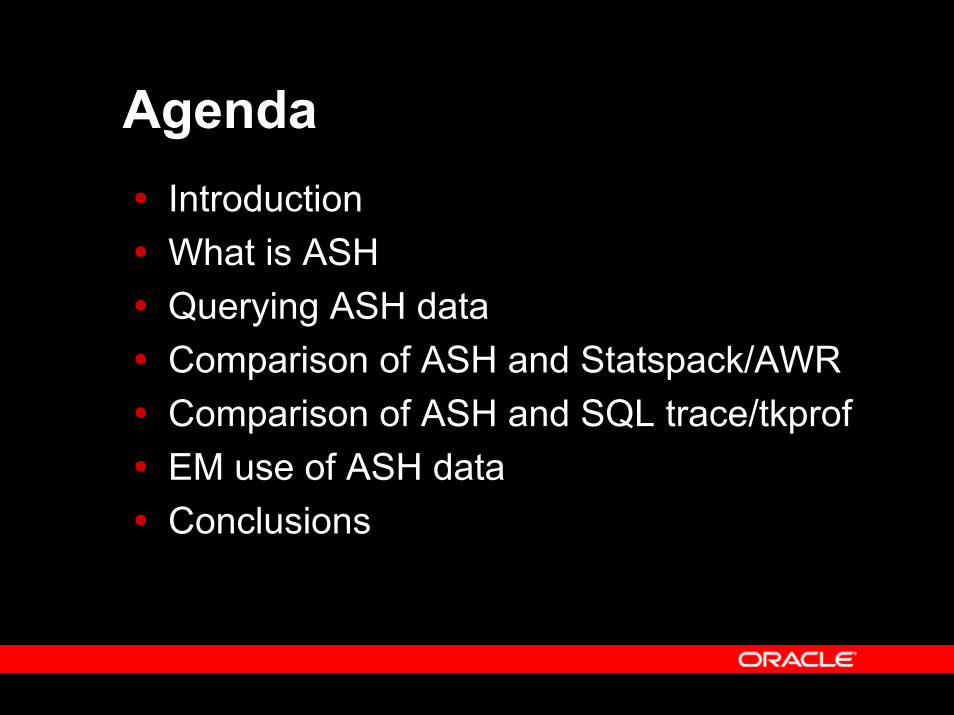
AgendaIntroductionWhat is ASH Querying ASH dataComparison of ASH and Statspack/AWRComparison of ASH and SQL trace/tkprofEM use of ASH dataConclusions
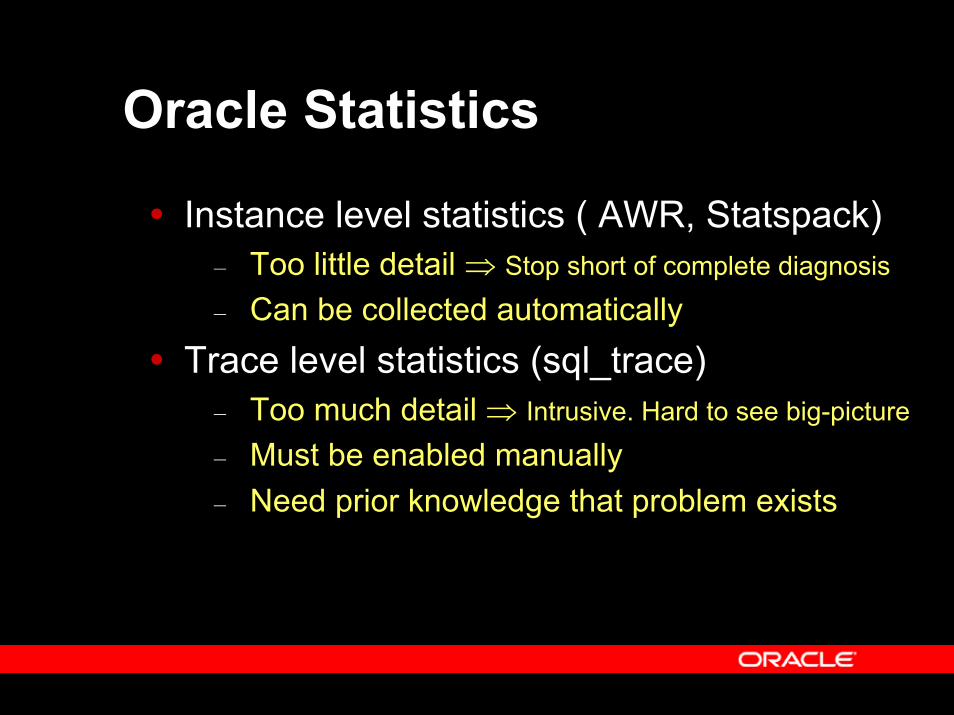
Oracle Statistics
Instance level statistics ( AWR, Statspack)– Too little detail ⇒ Stop short of complete diagnosis
– Can be collected automaticallyTrace level statistics (sql_trace)
– Too much detail ⇒ Intrusive. Hard to see big-picture
– Must be enabled manually– Need prior knowledge that problem exists
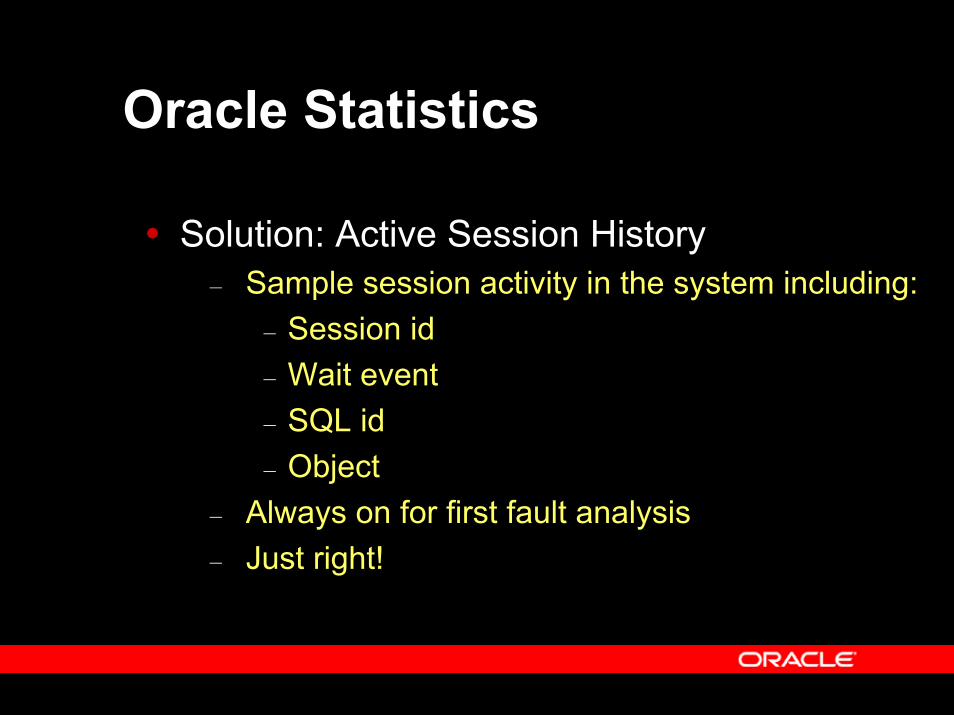
Oracle Statistics
Solution: Active Session History– Sample session activity in the system including:
– Session id– Wait event– SQL id– Object
– Always on for first fault analysis– Just right!
Active Session HistorySampled, detailed,non-intrusive activity dataPart of Oracle 10gOn by defaultLicensed as part of the Diagnostic pack
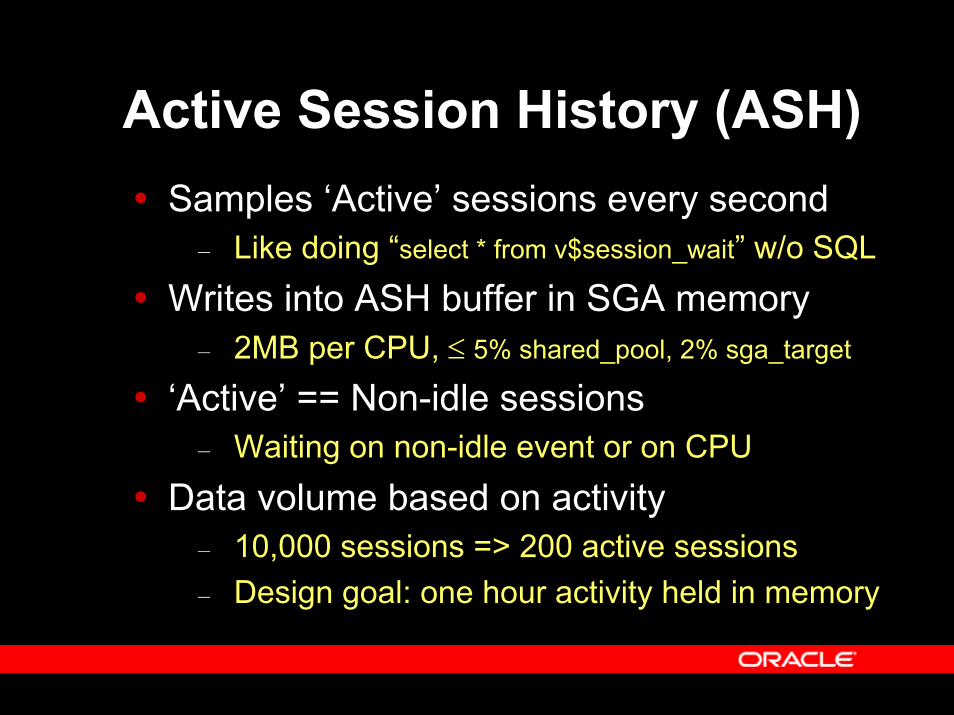
Active Session History (ASH)Samples ‘Active’ sessions every second
– Like doing “select * from v$session_wait” w/o SQLWrites into ASH buffer in SGA memory
– 2MB per CPU, ≤ 5% shared_pool, 2% sga_target
‘Active’ == Non-idle sessions– Waiting on non-idle event or on CPU
Data volume based on activity– 10,000 sessions => 200 active sessions– Design goal: one hour activity held in memory
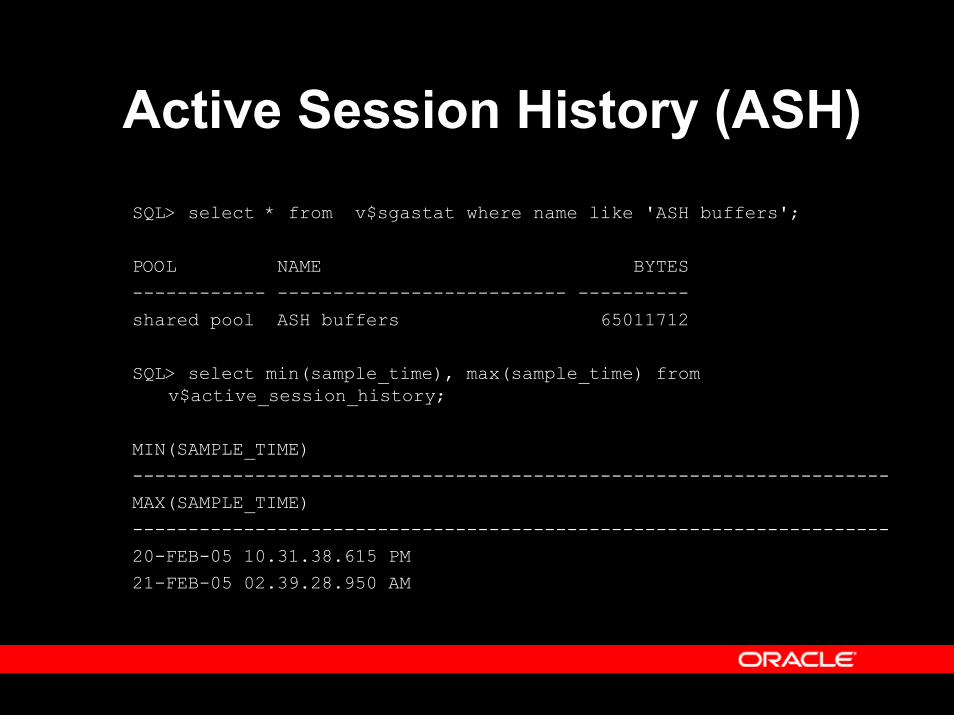
Active Session History (ASH)SQL> select * from v$sgastat where name like 'ASH buffers';
POOL NAME BYTES------------ -------------------------- ----------shared pool ASH buffers 65011712
SQL> select min(sample_time), max(sample_time) from v$active_session_history;
MIN(SAMPLE_TIME)--------------------------------------------------------------------MAX(SAMPLE_TIME)--------------------------------------------------------------------20-FEB-05 10.31.38.615 PM21-FEB-05 02.39.28.950 AM
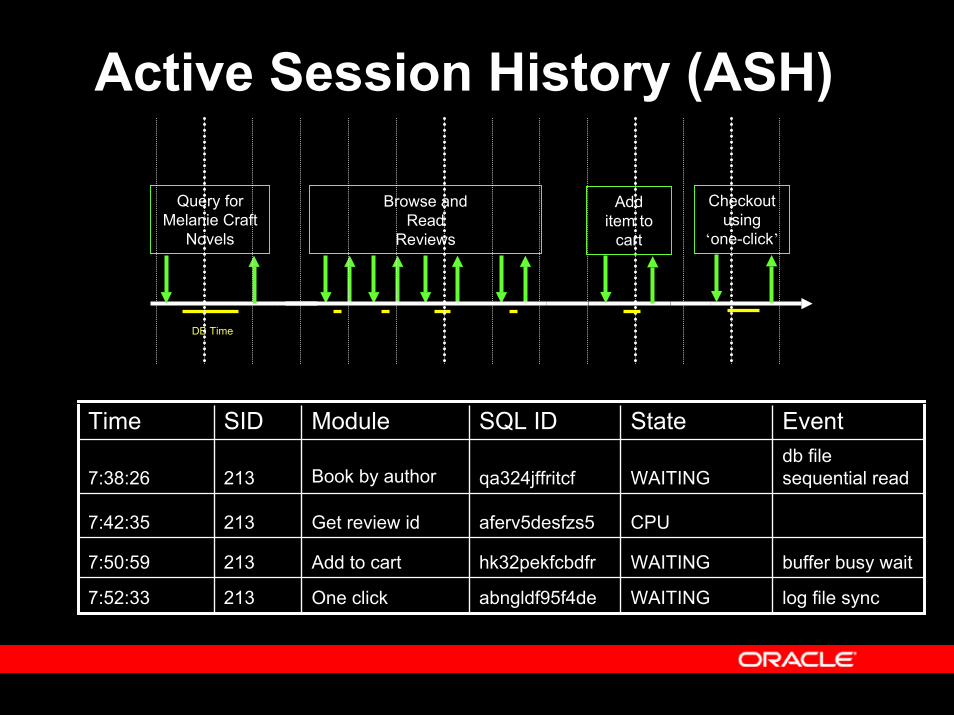
Active Session History (ASH)
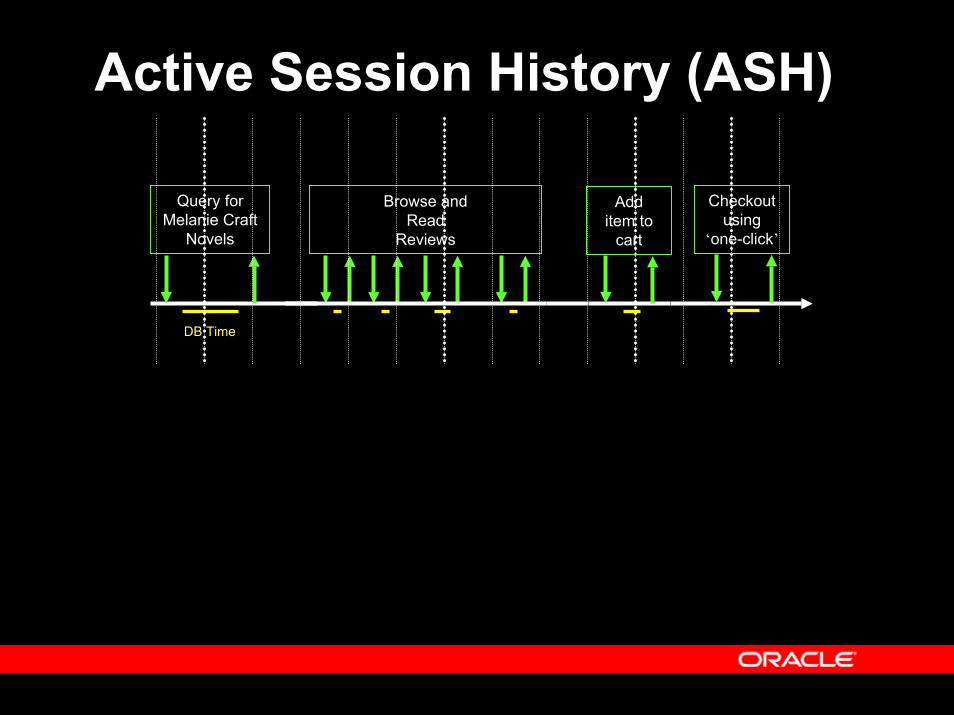
DB Time
Query for Melanie Craft
Novels
Browse andRead
Reviews
Add item to
cart
Checkout using
‘one-click’
Active Session History (ASH)
DB Time
Query for Melanie Craft
Novels
Browse andRead
Reviews
Add item to
cart
Checkout using
‘one-click’
WAITING
Statedb file sequential readqa324jffritcf2137:38:26
EventSQL IDModule
Book by author
SIDTime
CPUaferv5desfzs5Get review id2137:42:35
WAITING log file syncabngldf95f4deOne click2137:52:33
7:50:59 213 Add to cart hk32pekfcbdfr WAITING buffer busy wait
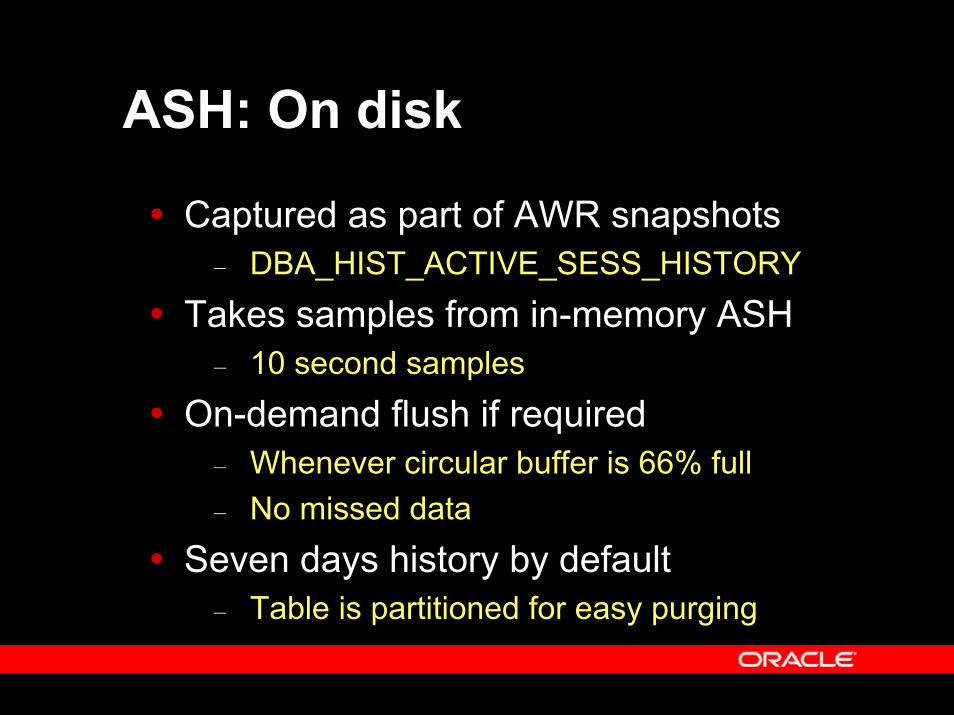
ASH: On disk
Captured as part of AWR snapshots– DBA_HIST_ACTIVE_SESS_HISTORY
Takes samples from in-memory ASH– 10 second samples
On-demand flush if required– Whenever circular buffer is 66% full– No missed data
Seven days history by default– Table is partitioned for easy purging
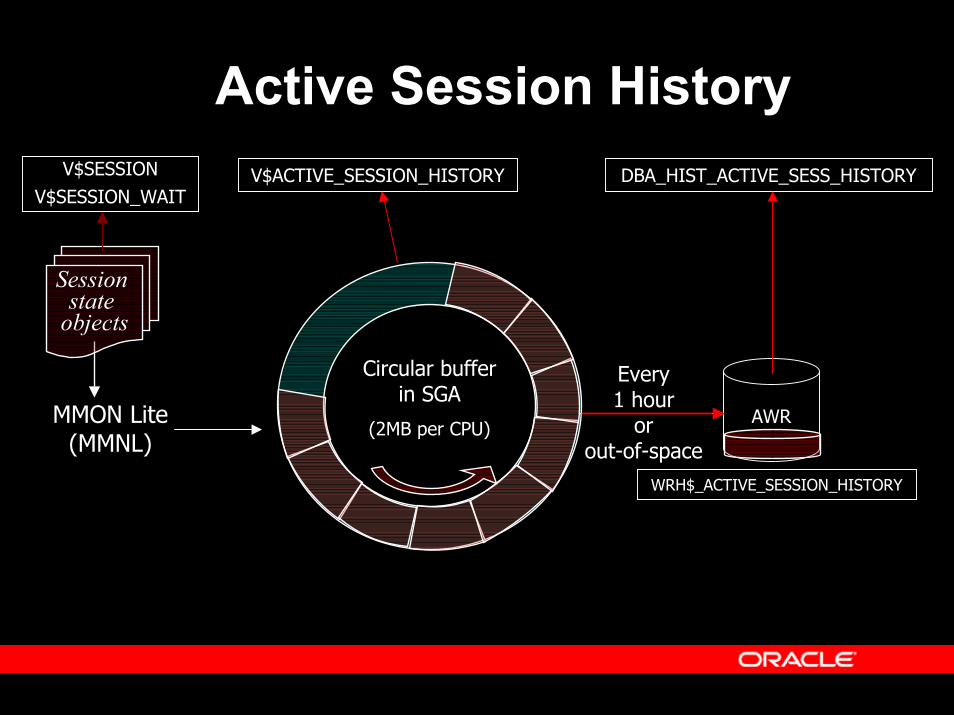
Active Session History
Every 1 hour
or out-of-space
AWR
Circular bufferin SGA
(2MB per CPU)
DBA_HIST_ACTIVE_SESS_HISTORYV$ACTIVE_SESSION_HISTORY
MMON Lite(MMNL)
Session state
objects
V$SESSIONV$SESSION_WAIT
WRH$_ACTIVE_SESSION_HISTORY
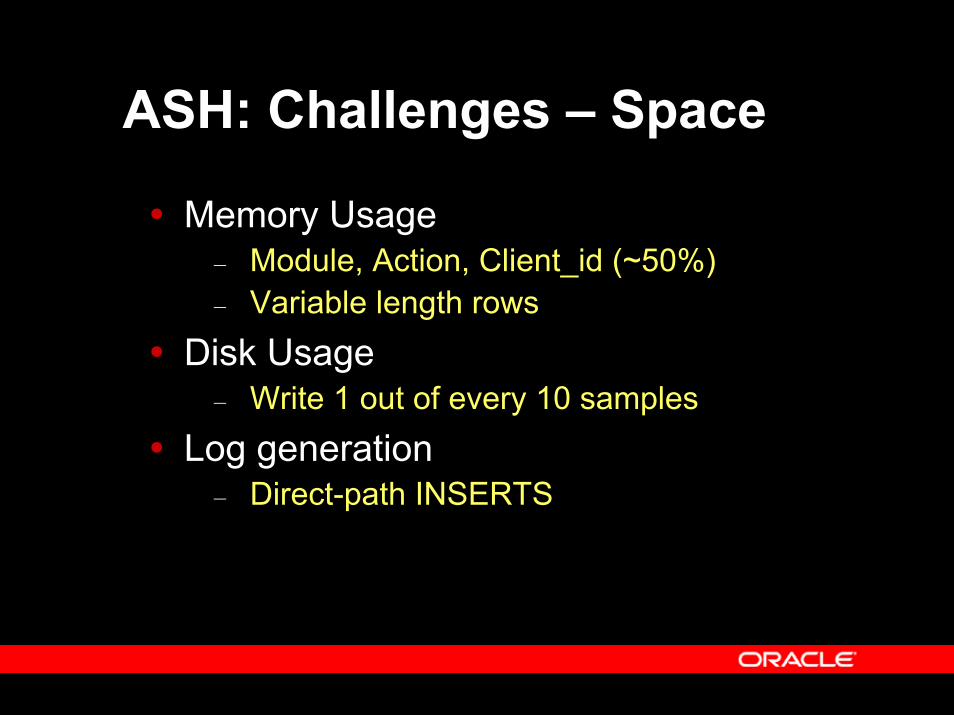
ASH: Challenges – Space
Memory Usage– Module, Action, Client_id (~50%)– Variable length rows
Disk Usage– Write 1 out of every 10 samples
Log generation– Direct-path INSERTS

Active Session History
Every 1 hour
or out-of-space
AWR
Circular bufferin SGA
(2MB per CPU)
DBA_HIST_ACTIVE_SESS_HISTORYV$ACTIVE_SESSION_HISTORY
Session state
objects
MMON Lite(MMNL)
V$SESSIONV$SESSION_WAIT
Variable length rows
Direct-pathINSERTS
Write 1 out of 10
samples
ASH: Challenges – Time
Reader-Writer Concurrency– No Consistent-Read requirement– 1 Writer – Multiple Readers– Readers go unlatched
Indexed on time– Both V$ view and DBA_HIST view
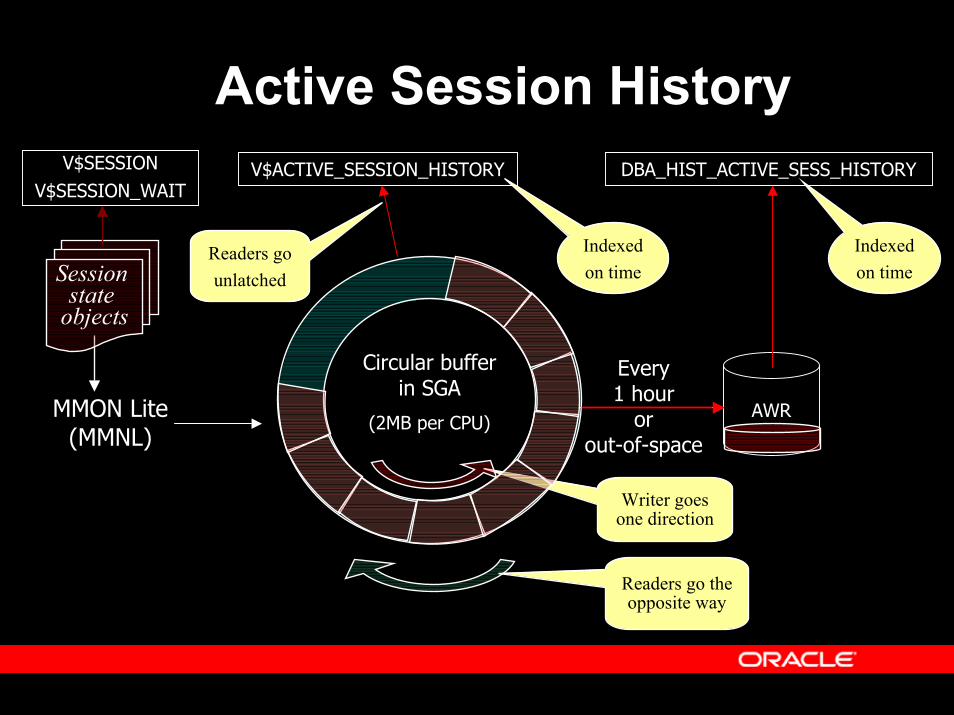
Active Session History
Readers go unlatched
Writer goesone direction
Every 1 hour
or out-of-space
AWR
Circular bufferin SGA
(2MB per CPU)
DBA_HIST_ACTIVE_SESS_HISTORYV$ACTIVE_SESSION_HISTORY
MMON Lite(MMNL)
Session state
objects
V$SESSIONV$SESSION_WAIT
Readers go theopposite way
Indexed on time
Indexed on time
What you can do with itSTATISTICAL analysis of where time was being spent by many different dimension.
– What events were taking most time?– What was a session doing?– What does a SQL statement wait for?
Can decide on dimension after the event!
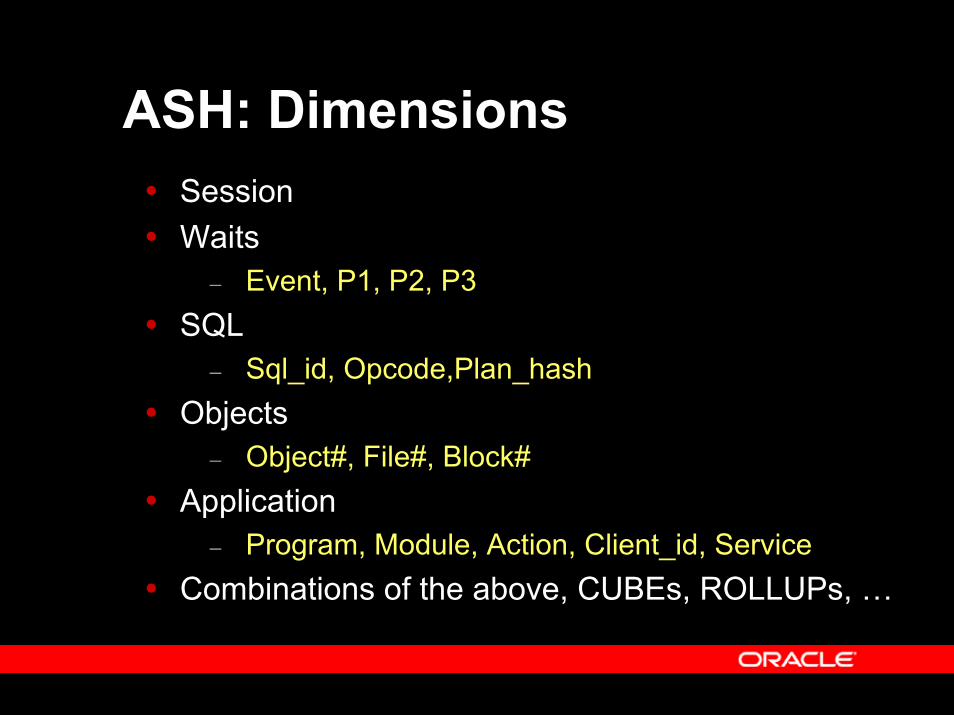
ASH: DimensionsSessionWaits
– Event, P1, P2, P3SQL
– Sql_id, Opcode,Plan_hashObjects
– Object#, File#, Block#Application
– Program, Module, Action, Client_id, ServiceCombinations of the above, CUBEs, ROLLUPs, …
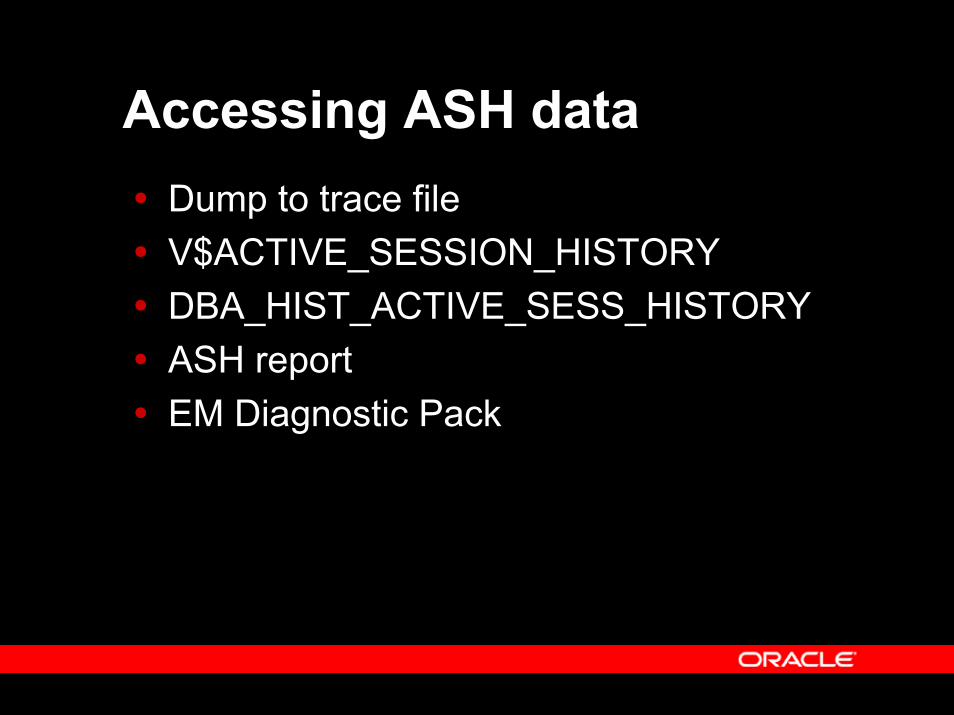
Accessing ASH dataDump to trace fileV$ACTIVE_SESSION_HISTORYDBA_HIST_ACTIVE_SESS_HISTORYASH reportEM Diagnostic Pack
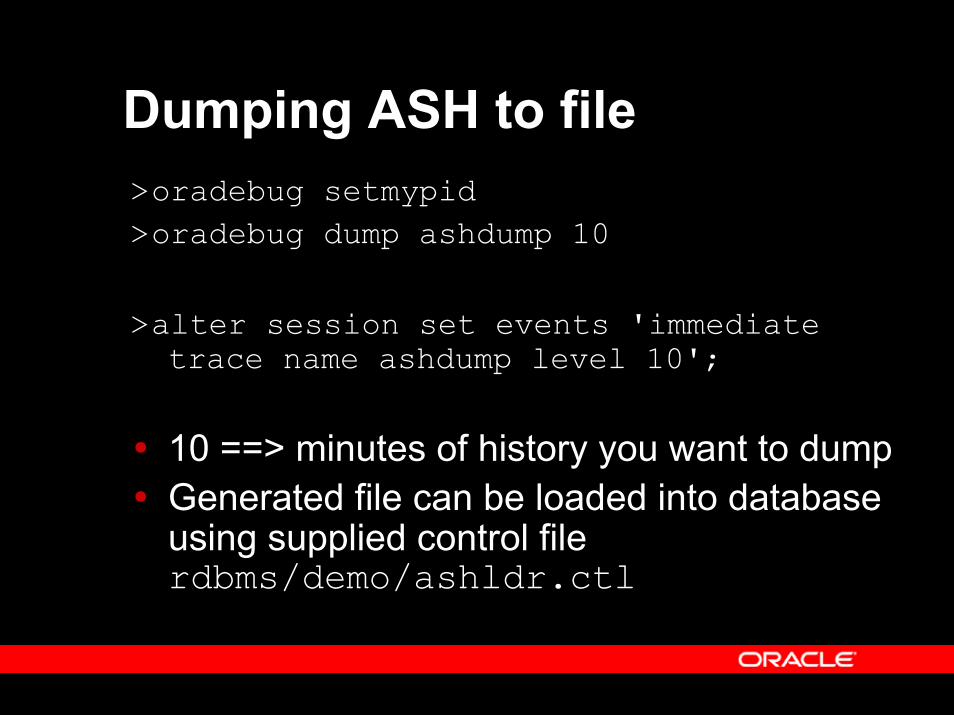
Dumping ASH to file>oradebug setmypid>oradebug dump ashdump 10
>alter session set events 'immediate trace name ashdump level 10';
10 ==> minutes of history you want to dumpGenerated file can be loaded into database using supplied control file rdbms/demo/ashldr.ctl
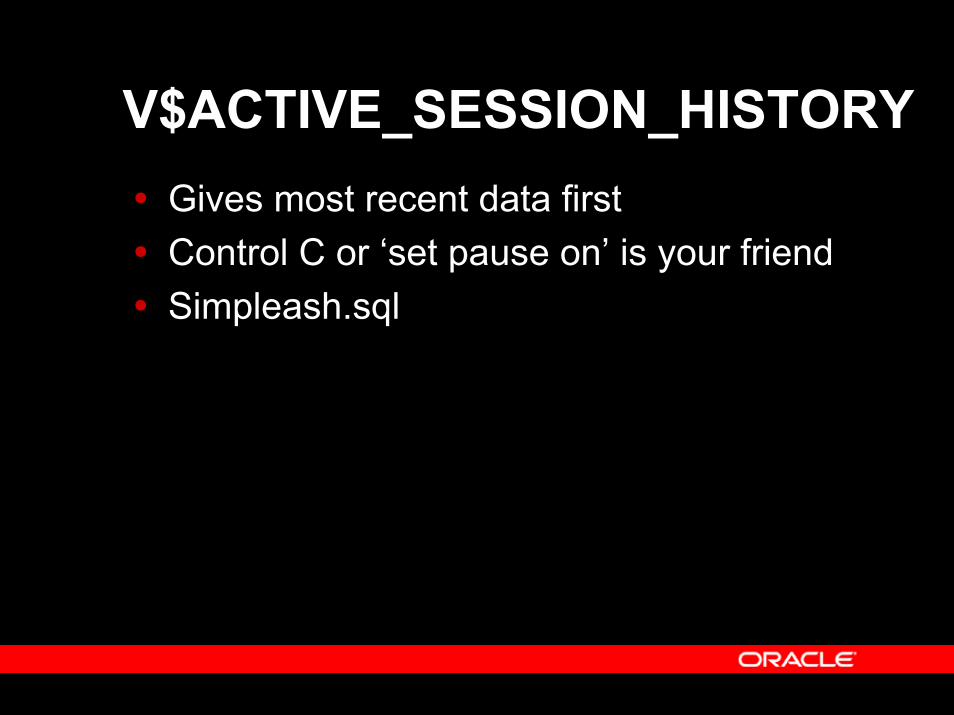
V$ACTIVE_SESSION_HISTORYGives most recent data firstControl C or ‘set pause on’ is your friendSimpleash.sql
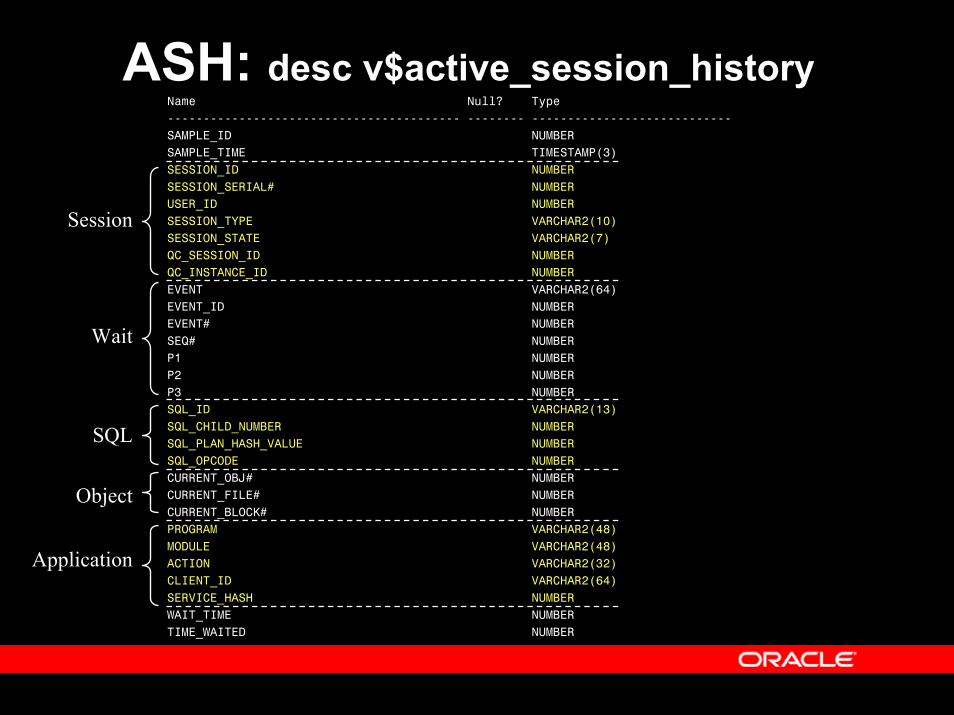
ASH: desc v$active_session_historyName Null? Type----------------------------------------- -------- ----------------------------SAMPLE_ID NUMBERSAMPLE_TIME TIMESTAMP(3)SESSION_ID NUMBERSESSION_SERIAL# NUMBERUSER_ID NUMBERSESSION_TYPE VARCHAR2(10)SESSION_STATE VARCHAR2(7)QC_SESSION_ID NUMBERQC_INSTANCE_ID NUMBEREVENT VARCHAR2(64)EVENT_ID NUMBEREVENT# NUMBERSEQ# NUMBERP1 NUMBERP2 NUMBERP3 NUMBERSQL_ID VARCHAR2(13)SQL_CHILD_NUMBER NUMBERSQL_PLAN_HASH_VALUE NUMBERSQL_OPCODE NUMBERCURRENT_OBJ# NUMBERCURRENT_FILE# NUMBERCURRENT_BLOCK# NUMBERPROGRAM VARCHAR2(48)MODULE VARCHAR2(48)ACTION VARCHAR2(32)CLIENT_ID VARCHAR2(64)SERVICE_HASH NUMBERWAIT_TIME NUMBERTIME_WAITED NUMBER
Session
Wait
SQL
Object
Application
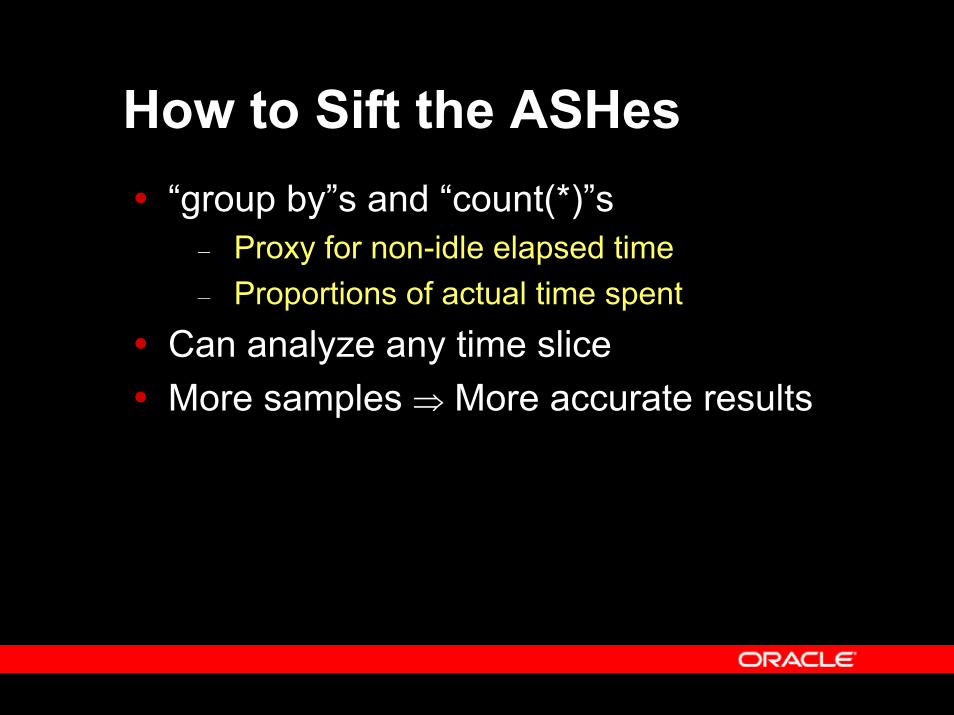
How to Sift the ASHes“group by”s and “count(*)”s
– Proxy for non-idle elapsed time– Proportions of actual time spent
Can analyze any time sliceMore samples ⇒ More accurate results
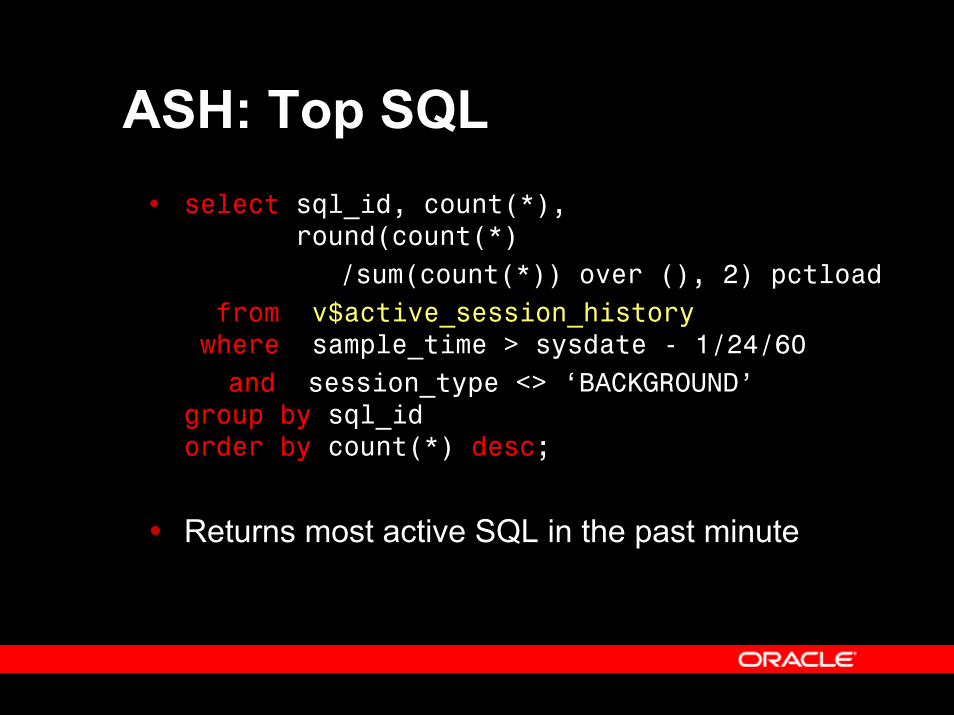
ASH: Top SQLselect sql_id, count(*),
round(count(*)/sum(count(*)) over (), 2) pctload
from v$active_session_historywhere sample_time > sysdate - 1/24/60and session_type <> ‘BACKGROUND’
group by sql_idorder by count(*) desc;
Returns most active SQL in the past minute
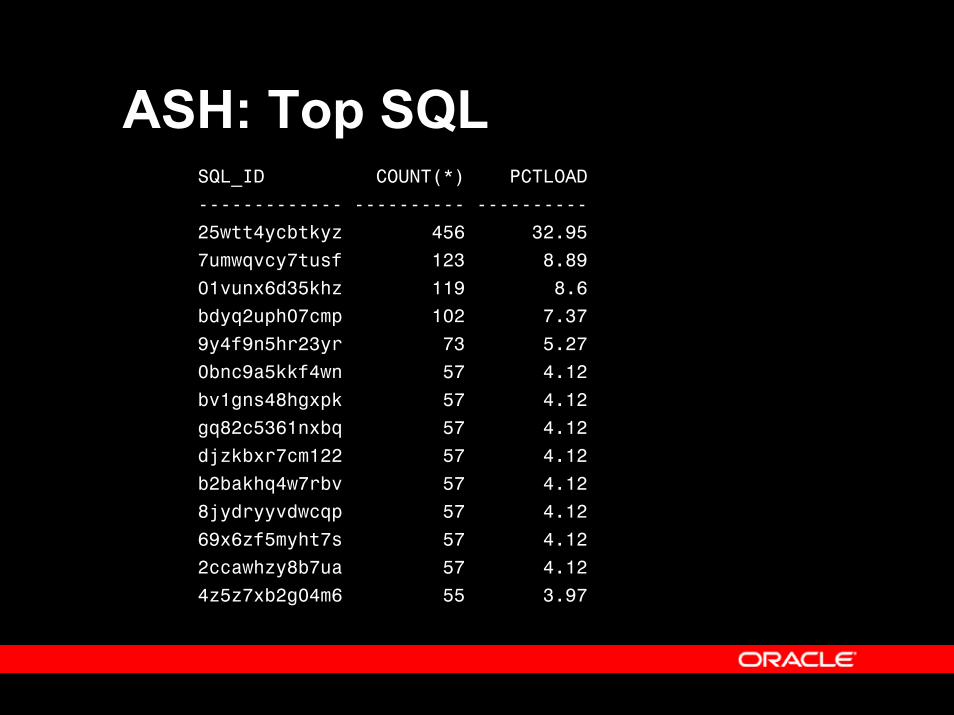
ASH: Top SQLSQL_ID COUNT(*) PCTLOAD------------- ---------- ----------25wtt4ycbtkyz 456 32.957umwqvcy7tusf 123 8.8901vunx6d35khz 119 8.6bdyq2uph07cmp 102 7.379y4f9n5hr23yr 73 5.270bnc9a5kkf4wn 57 4.12bv1gns48hgxpk 57 4.12gq82c5361nxbq 57 4.12djzkbxr7cm122 57 4.12b2bakhq4w7rbv 57 4.128jydryyvdwcqp 57 4.1269x6zf5myht7s 57 4.122ccawhzy8b7ua 57 4.124z5z7xb2g04m6 55 3.97
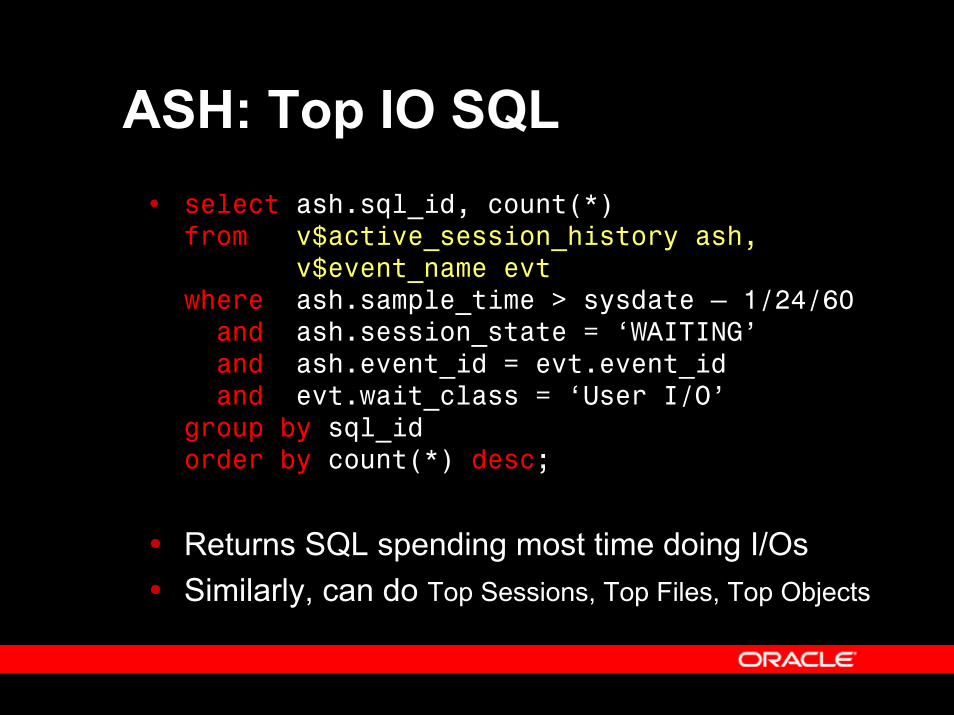
ASH: Top IO SQLselect ash.sql_id, count(*) from v$active_session_history ash,
v$event_name evtwhere ash.sample_time > sysdate – 1/24/60and ash.session_state = ‘WAITING’and ash.event_id = evt.event_idand evt.wait_class = ‘User I/O’
group by sql_idorder by count(*) desc;
Returns SQL spending most time doing I/OsSimilarly, can do Top Sessions, Top Files, Top Objects
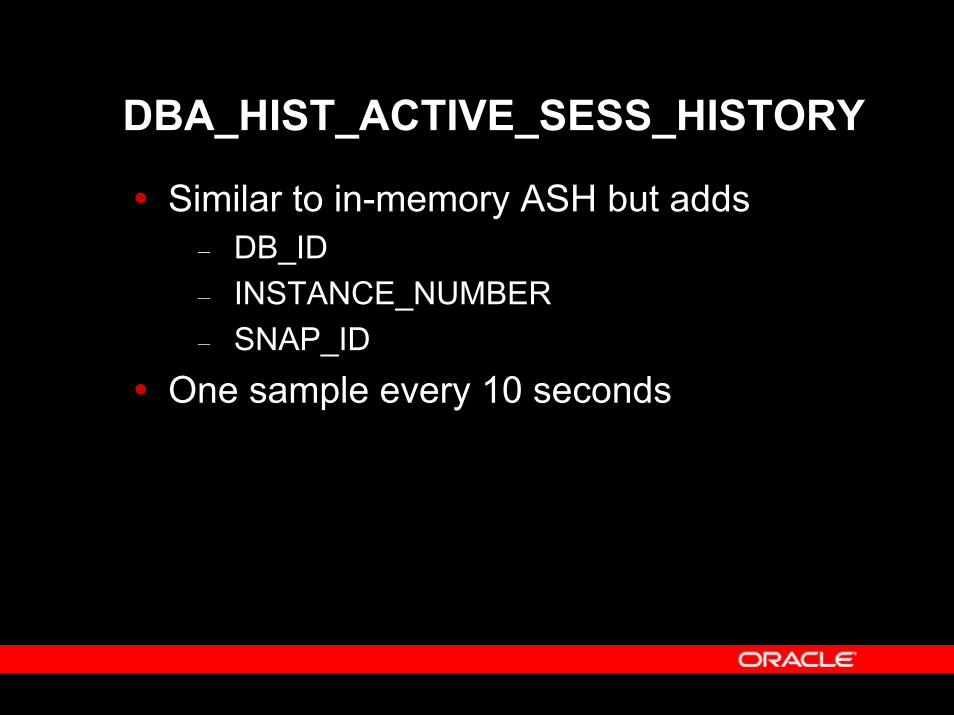
DBA_HIST_ACTIVE_SESS_HISTORY
Similar to in-memory ASH but adds – DB_ID– INSTANCE_NUMBER– SNAP_ID
One sample every 10 seconds
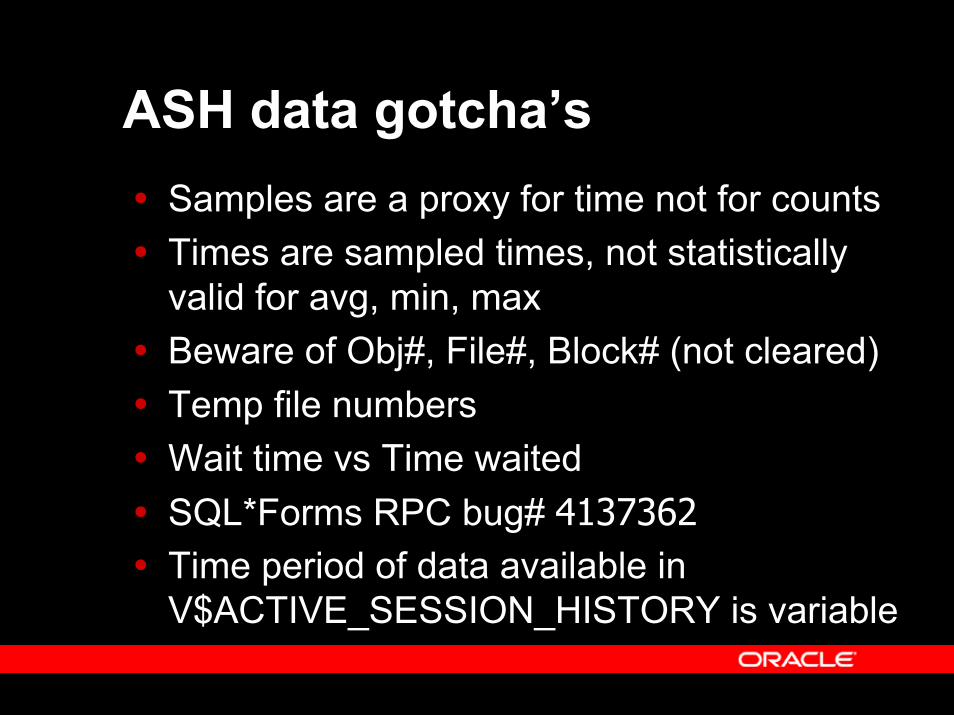
ASH data gotcha’sSamples are a proxy for time not for countsTimes are sampled times, not statistically valid for avg, min, maxBeware of Obj#, File#, Block# (not cleared)Temp file numbersWait time vs Time waitedSQL*Forms RPC bug# 4137362Time period of data available in V$ACTIVE_SESSION_HISTORY is variable
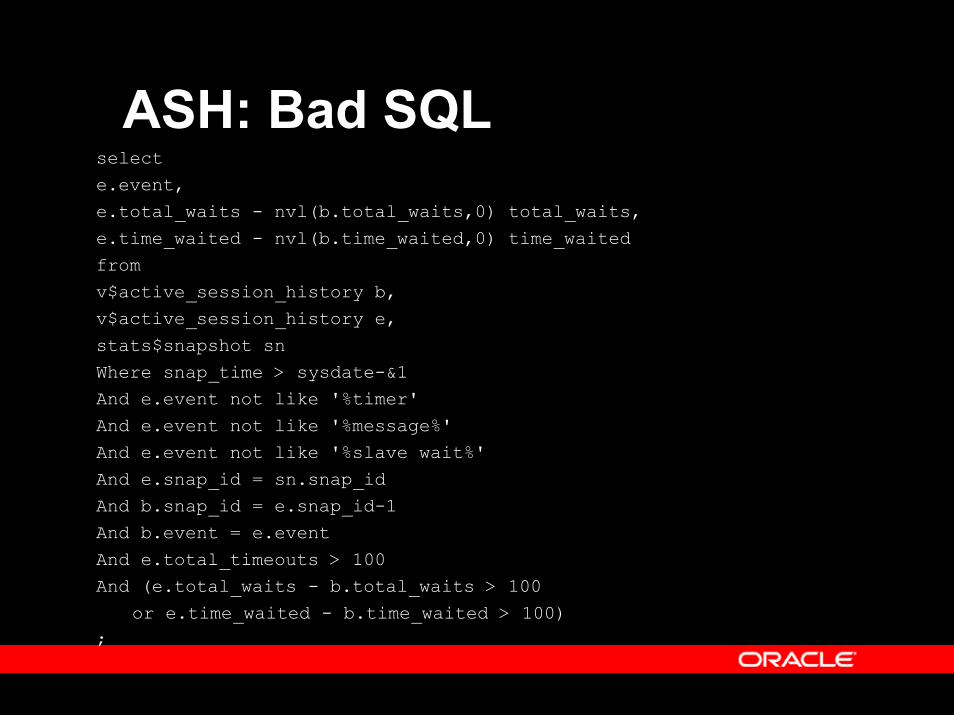
ASH: Bad SQLselecte.event,e.total_waits - nvl(b.total_waits,0) total_waits,e.time_waited - nvl(b.time_waited,0) time_waitedfromv$active_session_history b,v$active_session_history e,stats$snapshot snWhere snap_time > sysdate-&1And e.event not like '%timer'And e.event not like '%message%'And e.event not like '%slave wait%'And e.snap_id = sn.snap_idAnd b.snap_id = e.snap_id-1And b.event = e.eventAnd e.total_timeouts > 100And (e.total_waits - b.total_waits > 100
or e.time_waited - b.time_waited > 100);
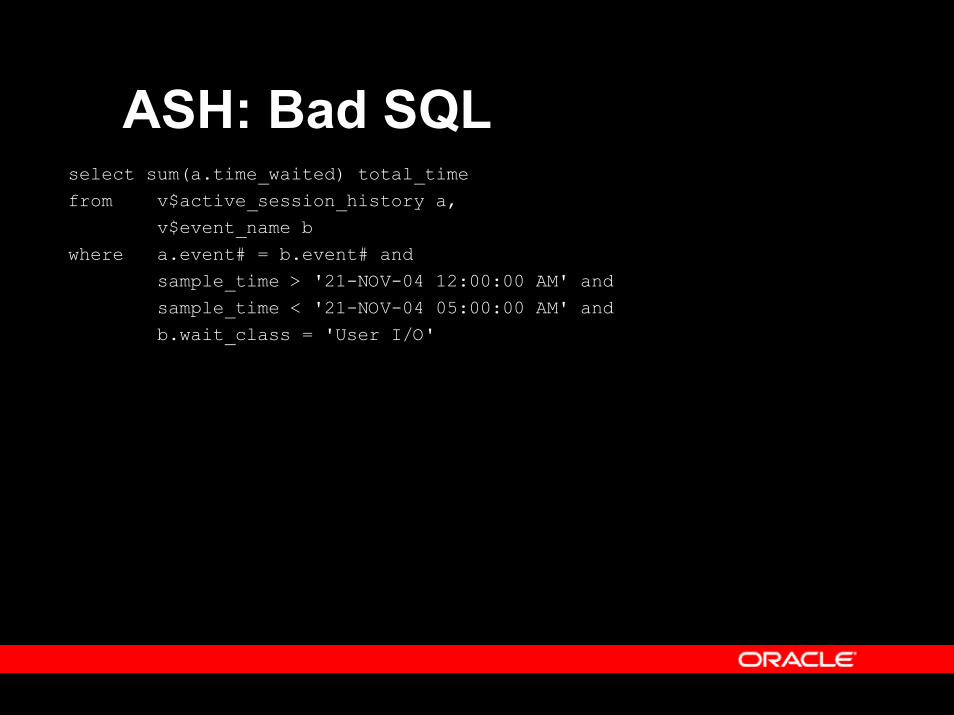
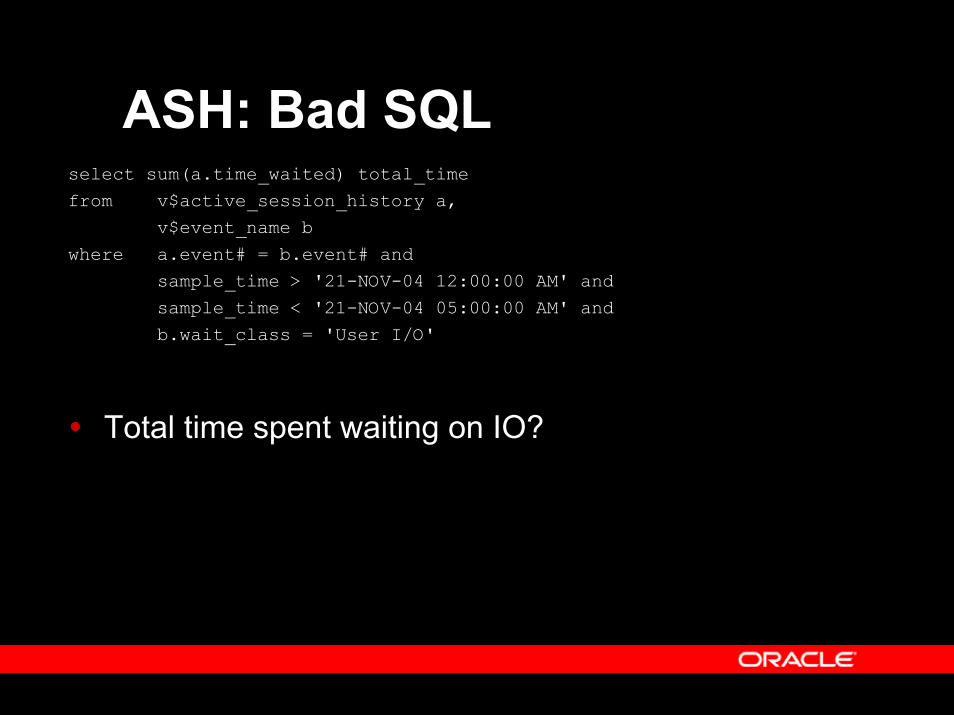
ASH: Bad SQLselect sum(a.time_waited) total_timefrom v$active_session_history a,
v$event_name bwhere a.event# = b.event# and
sample_time > '21-NOV-04 12:00:00 AM' and sample_time < '21-NOV-04 05:00:00 AM' andb.wait_class = 'User I/O'
ASH: Bad SQLselect sum(a.time_waited) total_timefrom v$active_session_history a,
v$event_name bwhere a.event# = b.event# and
sample_time > '21-NOV-04 12:00:00 AM' and sample_time < '21-NOV-04 05:00:00 AM' andb.wait_class = 'User I/O'
Total time spent waiting on IO?
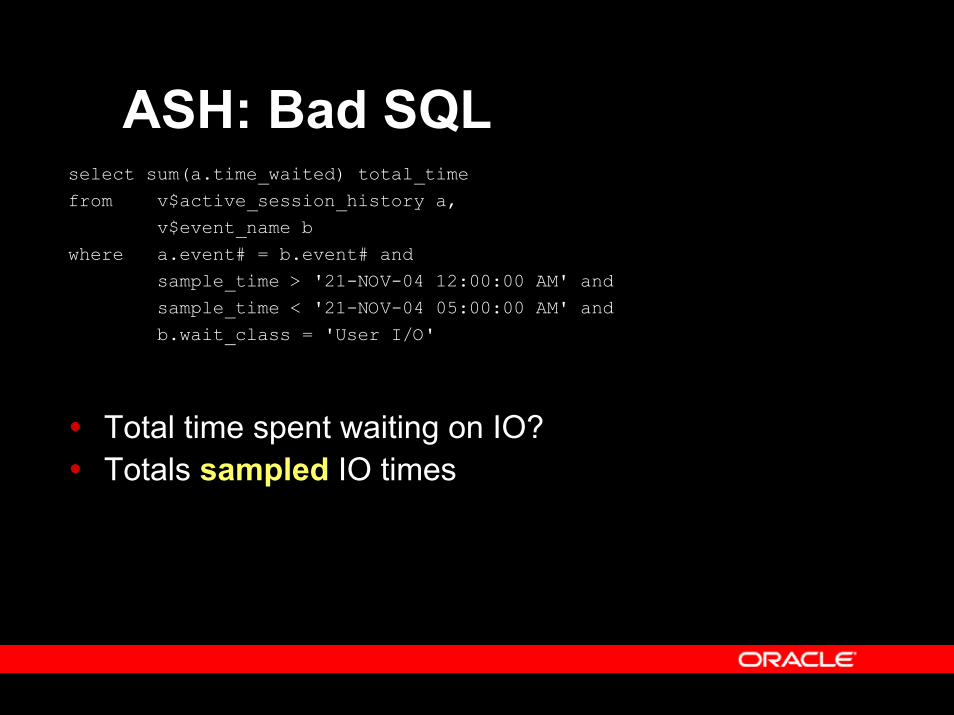
ASH: Bad SQLselect sum(a.time_waited) total_timefrom v$active_session_history a,
v$event_name bwhere a.event# = b.event# and
sample_time > '21-NOV-04 12:00:00 AM' and sample_time < '21-NOV-04 05:00:00 AM' andb.wait_class = 'User I/O'
Total time spent waiting on IO?Totals sampled IO times
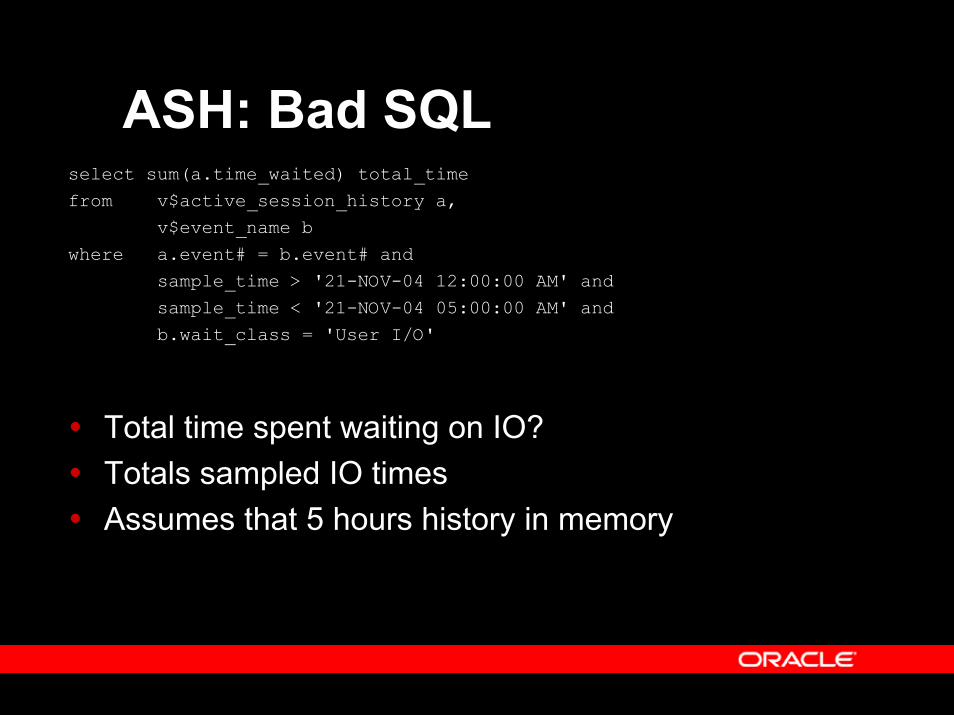
ASH: Bad SQLselect sum(a.time_waited) total_timefrom v$active_session_history a,
v$event_name bwhere a.event# = b.event# and
sample_time > '21-NOV-04 12:00:00 AM' and sample_time < '21-NOV-04 05:00:00 AM' andb.wait_class = 'User I/O'
Total time spent waiting on IO?Totals sampled IO timesAssumes that 5 hours history in memory
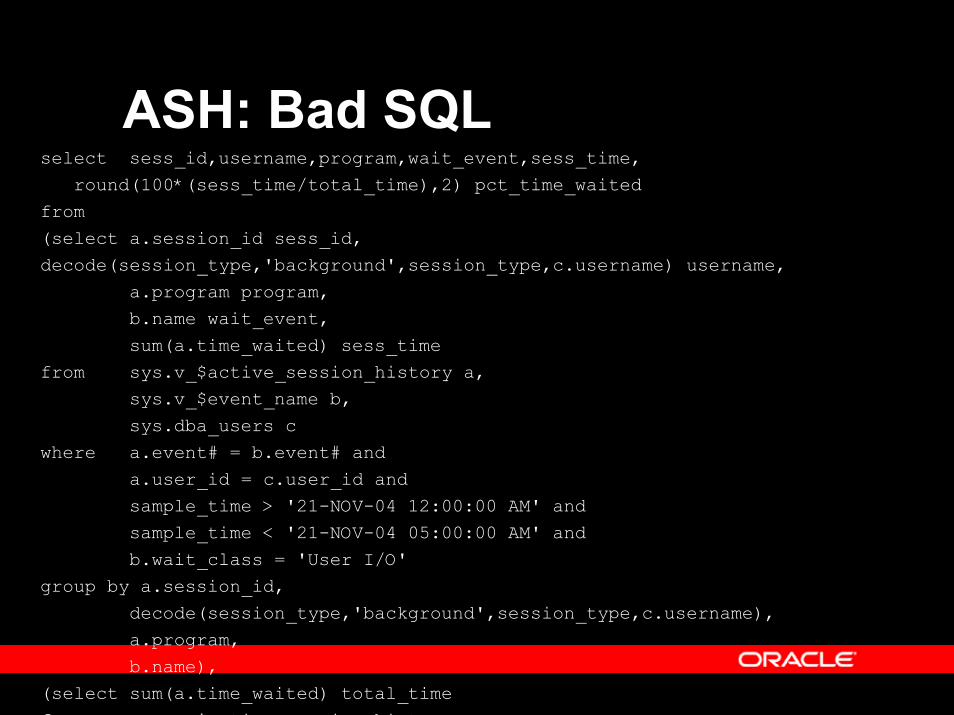
ASH: Bad SQLselect sess_id,username,program,wait_event,sess_time,
round(100*(sess_time/total_time),2) pct_time_waitedfrom(select a.session_id sess_id,decode(session_type,'background',session_type,c.username) username,
a.program program,b.name wait_event,sum(a.time_waited) sess_time
from sys.v_$active_session_history a,sys.v_$event_name b,sys.dba_users c
where a.event# = b.event# anda.user_id = c.user_id andsample_time > '21-NOV-04 12:00:00 AM' and sample_time < '21-NOV-04 05:00:00 AM' andb.wait_class = 'User I/O'
group by a.session_id,decode(session_type,'background',session_type,c.username),a.program,b.name),
(select sum(a.time_waited) total_timef $ ti i hi t
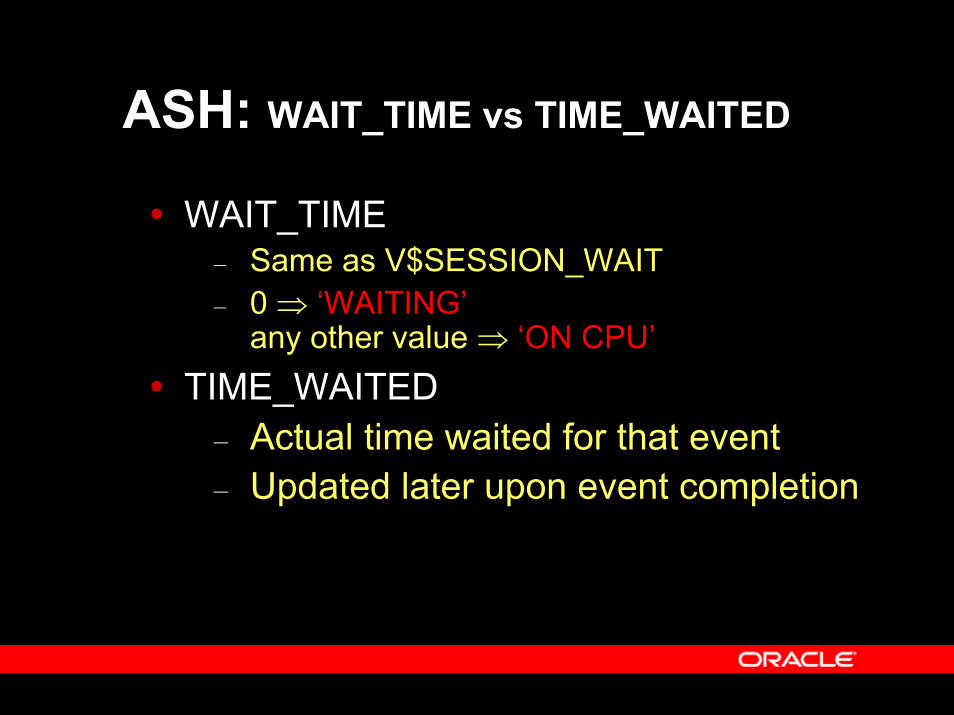
ASH: WAIT_TIME vs TIME_WAITED
WAIT_TIME– Same as V$SESSION_WAIT – 0 ⇒ ‘WAITING’
any other value ⇒ ‘ON CPU’TIME_WAITED
– Actual time waited for that event– Updated later upon event completion
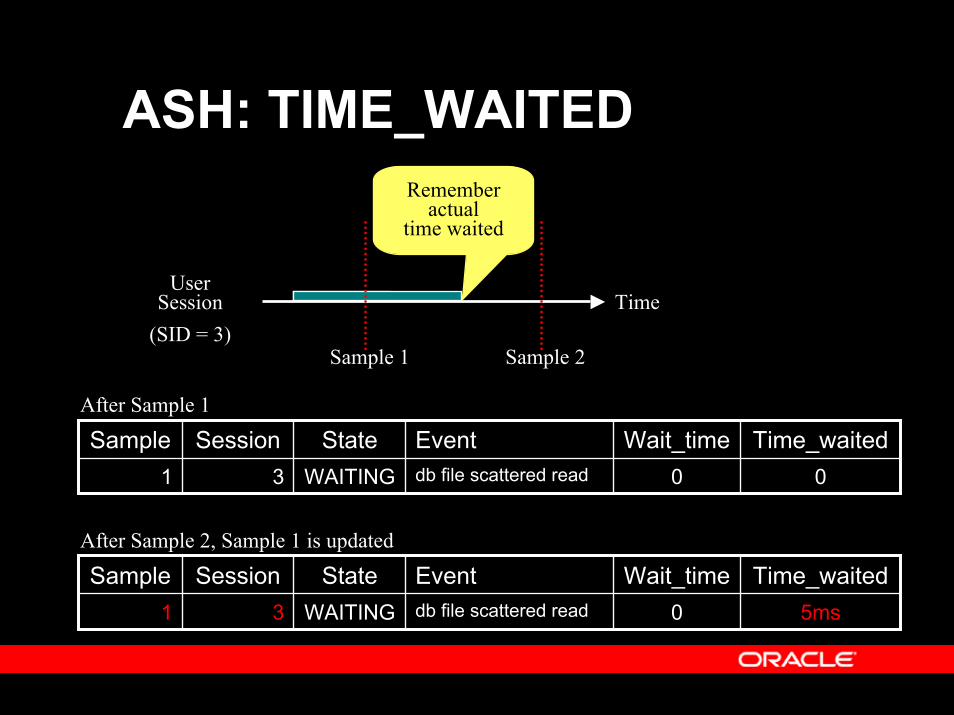
ASH: TIME_WAITED
UserSession
(SID = 3)
Rememberactual
time waited
Sample 1 Sample 2
Time
1
Sample0
Wait_timeWAITING
State0db file scattered read3
Time_waitedEventSessionAfter Sample 1
1
Sample0
Wait_timeWAITING
State5msdb file scattered read3
Time_waitedEventSessionAfter Sample 2, Sample 1 is updated
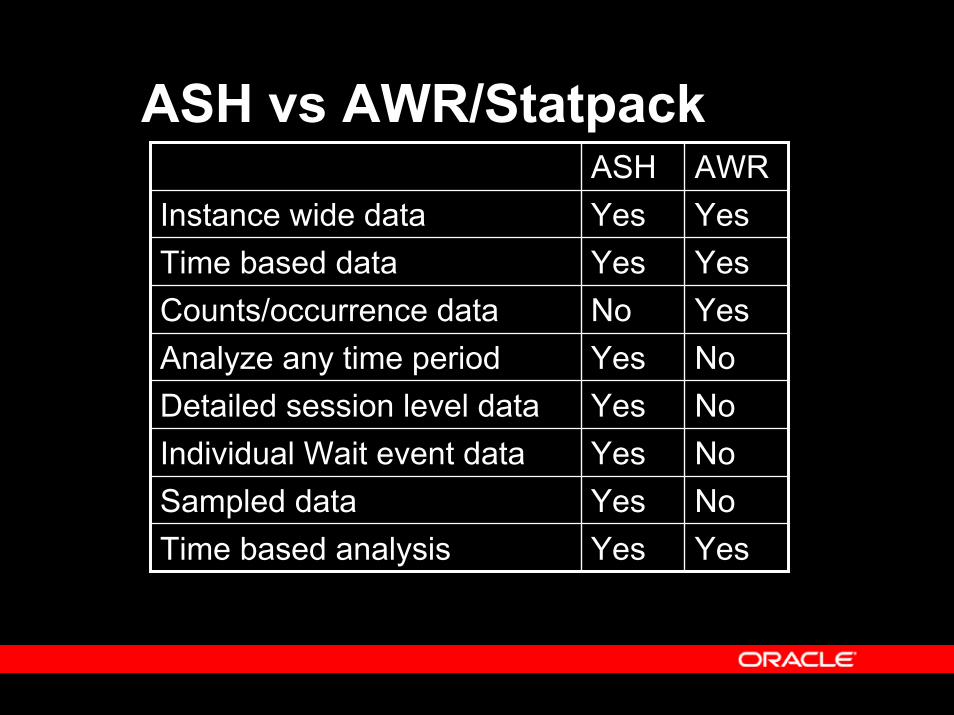
ASH vs AWR/Statpack
NoYesSampled dataYesYesTime based analysis
NoYesIndividual Wait event data NoYesDetailed session level dataNoYesAnalyze any time periodYesNoCounts/occurrence dataYesYesTime based dataYesYesInstance wide dataAWRASH
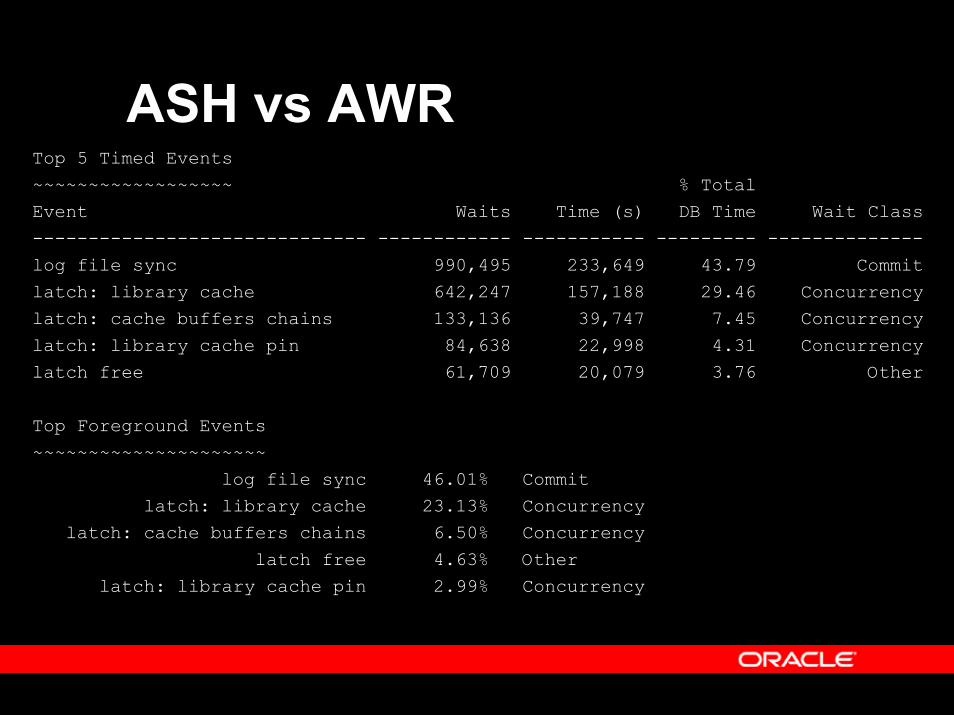
ASH vs AWRTop 5 Timed Events~~~~~~~~~~~~~~~~~~ % TotalEvent Waits Time (s) DB Time Wait Class------------------------------ ------------ ----------- --------- --------------log file sync 990,495 233,649 43.79 Commitlatch: library cache 642,247 157,188 29.46 Concurrencylatch: cache buffers chains 133,136 39,747 7.45 Concurrencylatch: library cache pin 84,638 22,998 4.31 Concurrencylatch free 61,709 20,079 3.76 Other
Top Foreground Events~~~~~~~~~~~~~~~~~~~~~
log file sync 46.01% Commit latch: library cache 23.13% Concurrency
latch: cache buffers chains 6.50% Concurrency latch free 4.63% Other
latch: library cache pin 2.99% Concurrency
D E M O N S T R A T I O N
ASH Report
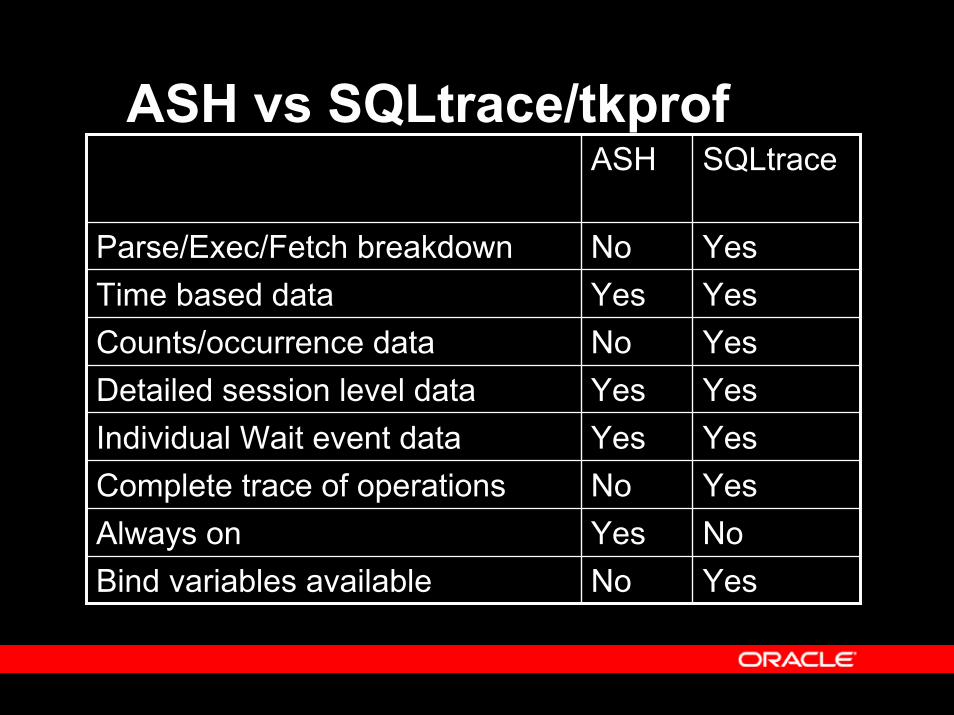
ASH vs SQLtrace/tkprof
YesYesDetailed session level dataYesYesIndividual Wait event data YesNoComplete trace of operationsNoYesAlways onYesNo Bind variables available
YesNoCounts/occurrence dataYesYesTime based dataYesNoParse/Exec/Fetch breakdown
SQLtraceASH
D E M O N S T R A T I O N
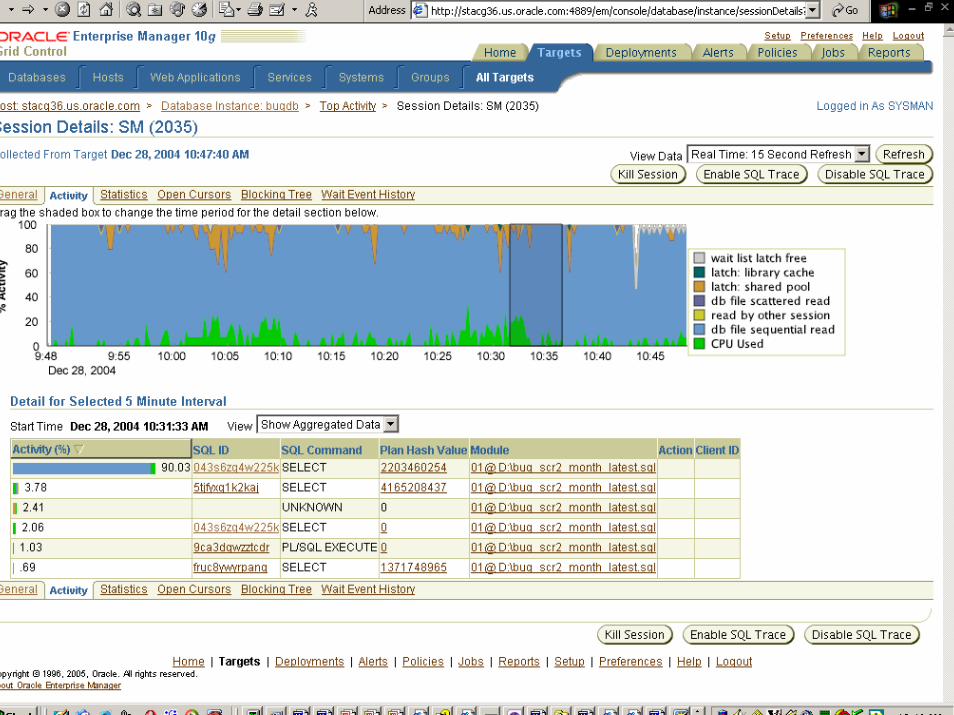
ASH Session Report

D E M O N S T R A T I O N
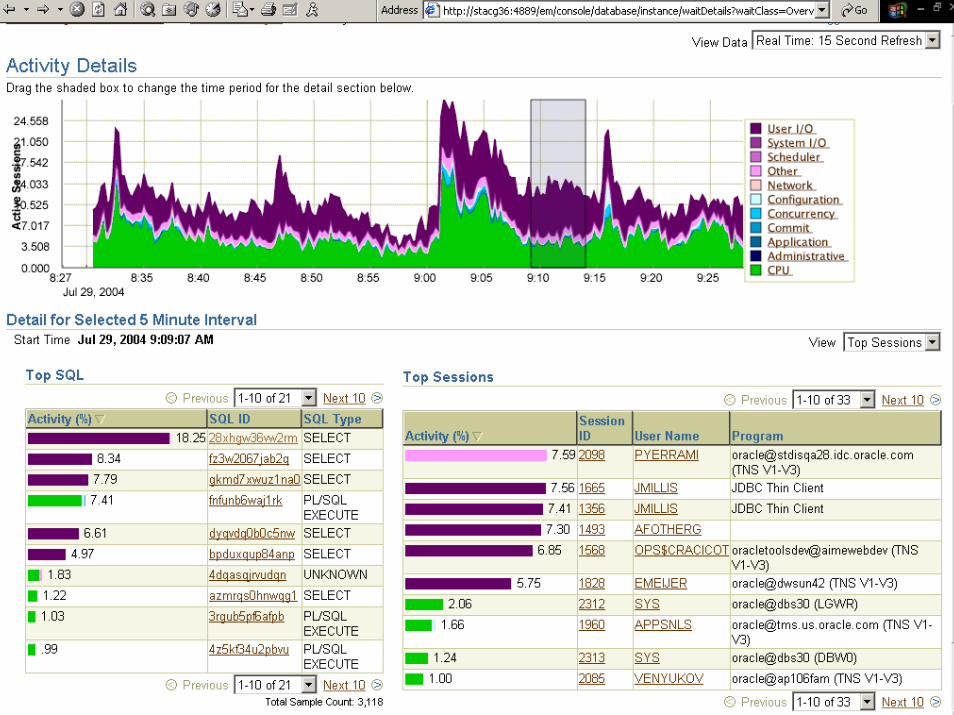
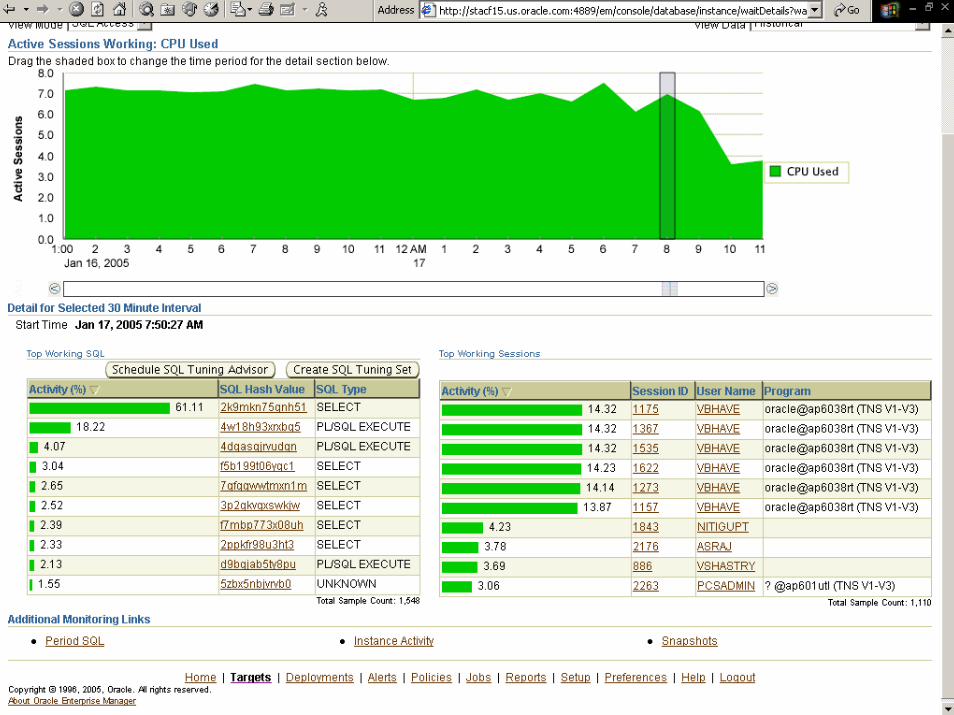
EM Diagnostic Pack
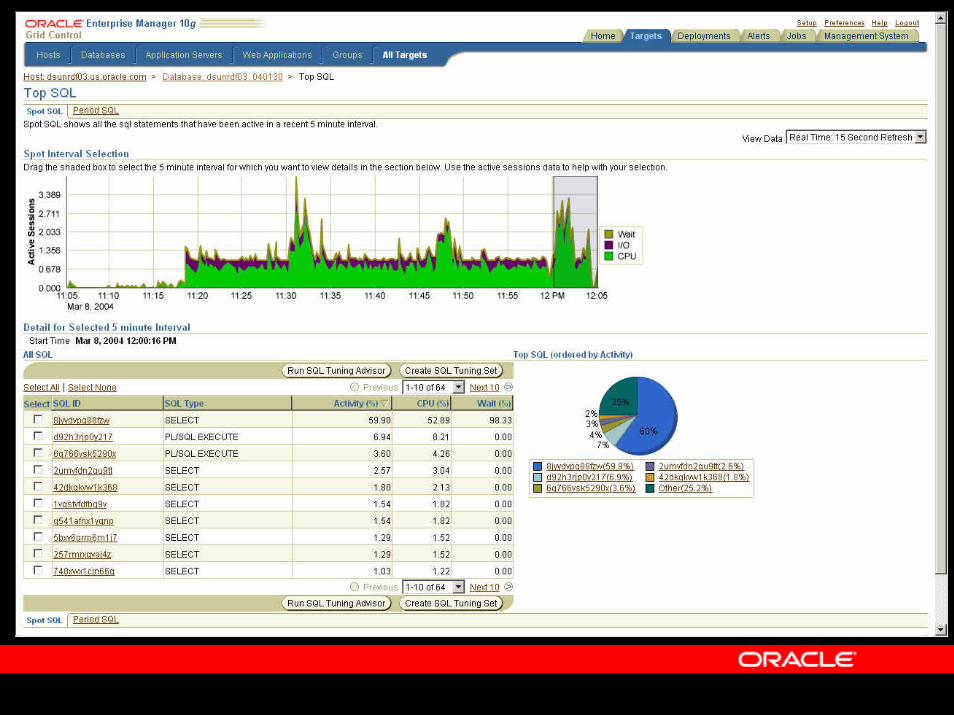
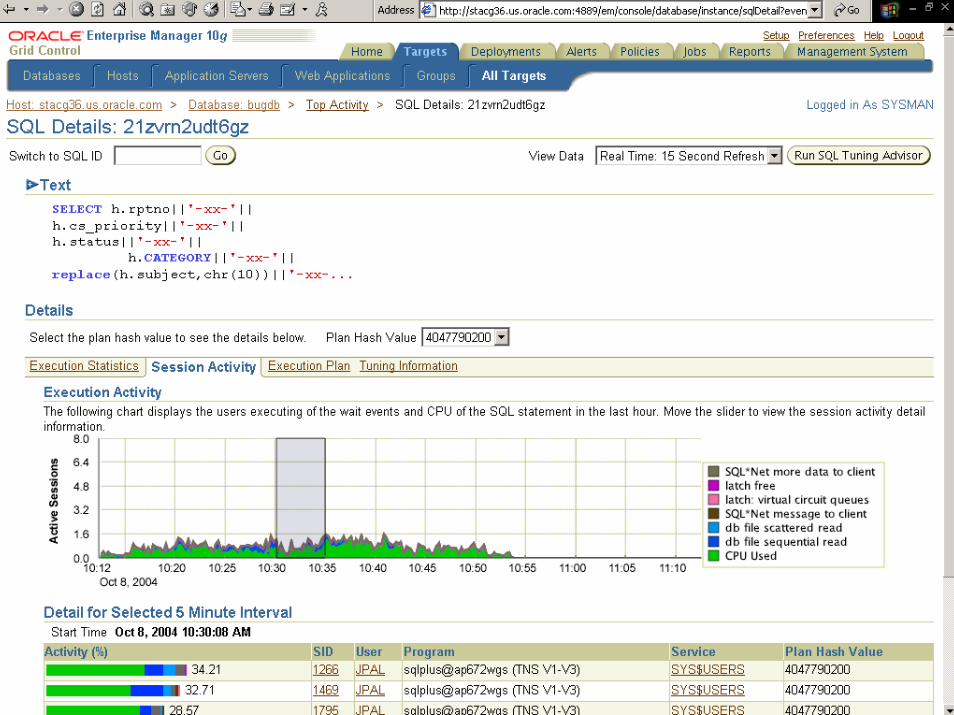
ASH: Top SQL from EM
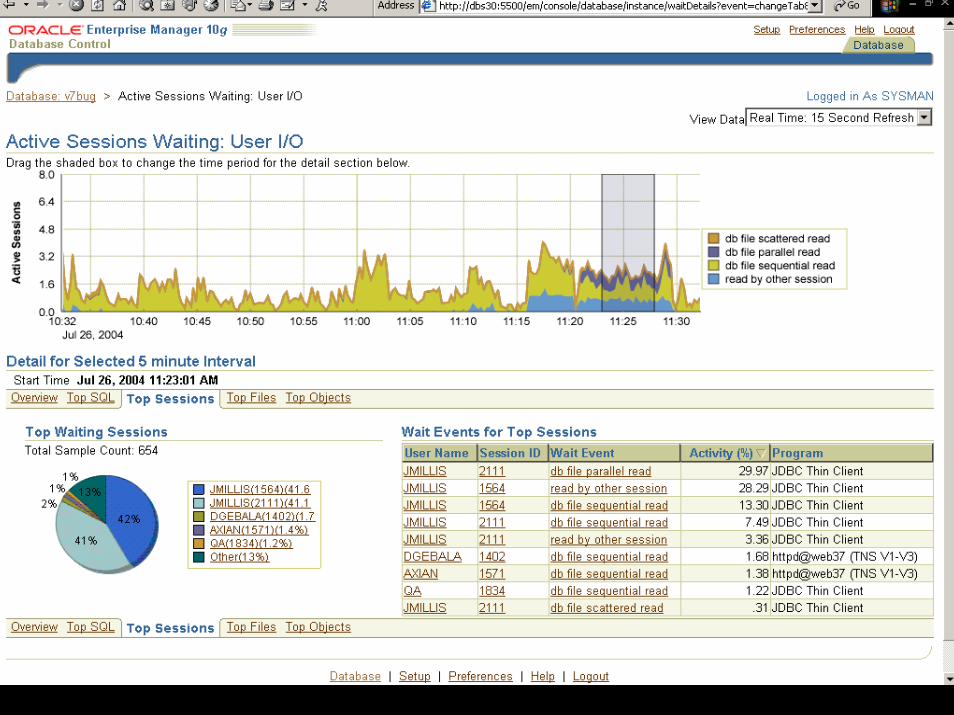
Wait Class + ASH: I/O Drill-down from EM
jmillistake3.png
ASH: What new in 10gR2
Blocking sid (maybe in 10.1.0.5)XID
ConclusionASH data always availableAllows instance wide performance analysisAllows detailed session level performance analysisBut it is sampled data, so use statistical analysis techniques

Q U E S T I O N SQ U E S T I O N SA N S W E R SA N S W E R S