SIÊU ÂM ĐÀN HỒI và ỨNG DỤNG LÂM SÀNG
187
SIÊU ÂM ĐÀN HỒI và ỨNG DỤNG LÂM SÀNG Page1 TRUNG TÂM Y KHOA MEDIC HOÀ HẢO SIÊU ÂM ĐÀN HỒI và ỨNG DỤNG LÂM SÀNG Thành phố Hồ Chí Minh 2015
-
Upload
hungnguyenthien -
Category
Health & Medicine
-
view
573 -
download
1
Transcript of SIÊU ÂM ĐÀN HỒI và ỨNG DỤNG LÂM SÀNG
SIÊU ÂM ĐÀN HỒI và ỨNG DỤNG LÂM SÀNG
Pag
e1
TRUNG TÂM Y KHOA MEDIC HOÀ HẢO
SIÊU ÂM ĐÀN HỒI và ỨNG DỤNG LÂM SÀNG
Thành phố Hồ Chí Minh
2015

SIÊU ÂM ĐÀN HỒI và ỨNG DỤNG LÂM SÀNG
Pag
e2
MỤC LỤC
1. TỔNG QUAN VỀ SIÊU ÂM ĐÀN HỒI.
2. CÁC LOẠI SIÊU ÂM ĐÀN HỒI TẠI VIỆT NAM.
3. ỨNG DỤNG LÂM SÀNG SIÊU ÂM ĐÀN HỒI.
- GAN LÁCH MẬT
- NIỆU THẬN TIỀN LIỆT TUYẾN TINH HOÀN
- GIÁP
- VÚ
- CƠ XƯƠNG KHỚP
- TIM MẠCH
- SẢN PHỤ KHOA
- DA

SIÊU ÂM ĐÀN HỒI và ỨNG DỤNG LÂM SÀNG
Pag
e3
SIÊU ÂM ĐÀN HỒI LÀ GÌ?
Siêu âm đàn hồi dùng áp lực để dời chỗ mô và sau đó theo dõi sự chuyển động gây
ra trong mô.
Có 2 phƣơng pháp đo chuyển động mô khác nhau để đáp ứng với áp lực từ ngoài
xuất hiện trong những năm 1990. Tạo hình sonoelasticity, sử dụng siêu âm
Doppler màu để theo dõi dời chỗ mô khi đáp ứng với kích thích rung động từ ngoài
đã đƣợc báo cáo bởi Lerner, Parker và những ngƣời khác vào năm 1987, là một
phƣơng pháp để phát hiện ung thƣ tuyến tiền liệt. Đo đàn hồi tĩnh cho vú và khối u
tiền liệt tuyến, là phƣơng pháp khác, đã đƣợc báo cáo vào năm 1991 bởi Ophir và
cs.
Có hai phƣơng pháp đo độ đàn hồi chính gồmquasistatic (còn đƣợc gọi là "static,
tĩnh"), khi mô phản ứng với một sự đè ấn chậm duy nhất dùng để đo độ cứng mô;
và dynamic, khi mô phản ứng với sự đè ấn nhanh hoặc rung động.
Đo đàn hồi tĩnh (static elastography)
Static elastography là hình thức phổ biến của elastographic imaging từ 2008. Trong
phƣơng pháp này, một đè ấn duy nhất, rất nhỏ đƣợc áp dụng (thƣờng ít hơn 0,5
mm), bằng cách ấn với chính đầu dò siêu âm, và dời chỗ mô đƣợc đo ở mỗi độ sâu
hoặc khoảng cách từ đầu dò bằng cách sử dụng cross-correlation function, hàm
tƣơng quan chéo (hình 1). Mức độ thay đổi trong khoảng dời chỗ mô là một hàm
của khoảng cách từ đầu dò đƣợc gọi là "mô căng, tissue strain " và sẽ đƣợc hiển thị
bằng hình ảnh. Với vật liệu mềm, mức độ thay đổi trong sự dời chỗ lớn với các vật
chất gần với đầu dò, và xa đầu dò thì dời chỗ ít nhất. Ở vật liệu rất cứng, chẳng hạn
nhƣ trong một khối thép, áp lực làm toàn bộ khối để di chuyển đƣợc một đơn vị với
phần xa đầu dò chuyển động giống nhƣ phần gần với đầu dò. Vì vậy, tỷ lệ thay đổi
trong sự dời chỗ từ rìa gần của khối với rìa xa là gần bằng zero (hình 2). Vì vậy, vật
liệu cứng cho thấy các giá trị căng rất thấp và vật liệu mềm có giá trị căng lớn hơn.
Trên bản đồ đàn hồi [elastogram], các giá trị căng thấp thƣờng đƣợc hiển thị nhƣ
dark [tối], trong khi các giá trị lớn nhƣ bright [sáng] (hình 3). Khối u thƣờng cứng
hơn môi trƣờng xung quanh nên hiểu hiện là một khối tối nhúng trong một nền sáng
hơn. Trên màn hình màu, các giá trị căng thấp thƣờng đƣợc hiển thị nhƣ green
(xanh lá cây) hoặc blue (xanh dƣơng) và các giá trị biến dạng lớn, là yellow [vàng]
hay red [đỏ] (hình 4).Màu sắc thƣờng chồng trên hình B-scan của các tổn thƣơng.

SIÊU ÂM ĐÀN HỒI và ỨNG DỤNG LÂM SÀNG
Pag
e4
H.1: Đánh giá dời chỗ mô bằng cách dùng cross-correlation. Với đè ấn, RF Backscatter
Waveform bị nén và lệch trong vị trí.Lệch vị trí (d) của một đoạn dữ liệu đƣợc xác định bằng
một “cửa sổ” đƣợc xác định bằng cách dùng hàm tƣơng quan chéo [cross-correlation
function]. Tiến trình này đƣợc lập lại ở nhiều độ sâu và cho mỗi vị trí dọc theo mặt đầu dò
bằng cách tạo ra một bản đồ 2-D của dời chỗ mô đối với độ sâu.
H.2: Giản đồ cho thấy cách đơn giản của đánh giá sự căng của dời chỗ mô của các khối
cứng và mềm và điều này trình bày sự biến dạng tăng lên nhƣ thế nào dƣới sự đè ấn cho
khối mềm gây nên giá trị căng cao hơn cho khối cứng.
Hình (căng) biến dạng, hoặc bản đồ đàn hồi [elastogram], là hình của độ cứng
tƣơng đối, vì số lƣợng áp lực do ấn đầu dò sẽ thay đổi số lƣợng mô dời chỗ và thay
đổi mức độ trong sự dời chỗ.
Static elastography đã đƣợc áp dụng cho nhiều cơ quan khác nhau và trong bệnh
học.Thông báo ứng dụng đầu tiên của elastography là phân biệt u vú lành tính và ác
tính, và breast elastography là dạng siêu âm đàn hồi đƣợc áp dụngnhiều nhất hiện
nay. Để có một elastogram vú, bệnh nhân nằm ngữa và mô vú đƣợc nén bằng đầu
dò vào thành ngực. Ban đầu đè ấn do máy tính kiểm soát, sau đƣợc thay thế bằng
kỹ thuật ấn tự do (free hand technique). Bình thƣờng chuyển động thở của bệnh
nhân cũng đủ chống lại áp lực của đầu dò để có đƣợc một elastogram chất lƣợng
tốt. Nhiều hình tĩnh hoặc short cine loops đƣợc ghi lại tự động để xem lại sau. Bởi vì
có rất nhiều vùng tƣơng đối tối có không có ý nghĩa lâm sàng có thể xuất hiện trên
elastogram, elastogram luôn luôn đƣợc xem cùng với hình siêu âm từ chính vị trí
tƣơng tự; hoặc elastogram chồng lên hình siêu âm nhƣ một lớp phủ màu. Thủ thuật
này giúp so sánh một tổn thƣơng trên siêu âm với biểu hiện đàn hồi của nó.

SIÊU ÂM ĐÀN HỒI và ỨNG DỤNG LÂM SÀNG
Pag
e5
H.3: Một tổn thƣơng tƣơng đối mềm (vùng đóng vòng) hiếm khi xuất hiện trên elastogram
vì độ cứng của nó tƣơng tự nhƣ mô xung quanh (A). Mặt khác, một tổn thƣơng cứng dễ xác
định đƣợc vì tối hơn nhiều mô xung quanh trên elastogram (B).
H.4: (A) Elastogram màu sai, (B) hình B-mode của một tổn thƣơng, (C) và elastogram
thang xám.
H.5: IDC xâm lấn nhỏ ở (A) elastogram và (B) hình siêu âm. Ghi nhận bóng lƣng trung tâm
trên hình siêu âm và độ cứng cao (tối) của tổn thƣơng trên elastogram. Tổn thƣơng cũng
xuất hiện to trên elastogram hơn trong hình siêu âm, nếu chỉ chú ý tổn thƣơng echo kém và
không kể đến bờ có echo xung quanh.
Elastograms thƣờng đƣợc sử dụng để đánh giá một khối lành tính hay ác tính trên
siêu âm. Gồm 2yếu tố :độ cứng tương đối của tổn thƣơng và kích thước của tổn
thƣơng trên elastogram so với hình siêu âm. Ung thƣ có xu hƣớng cứng (tối hơn)
nhiều hơn so với các mô xung quanh (hình 5), trong khi tổn thƣơng lành tính có xu
hƣớng có độ cứng tƣơng tự nhƣ mô xung quanh. Một tổn thƣơng lành tính thấy rõ
trên siêu âm có thể gần nhƣ vô hình trên elastogram (hình 6). Bởi vì ung thƣ
thƣờng liên quan đến mô xung quanh, tạo ra một viền dày có echo, elastogram sẽ
thƣờng xuyên hiển thị tổn thƣơng lớn hơn đáng kể so với hình siêu âm (hình 7). Với
hai yếu tố này, hầu hết các nghiên cứu đã báo cáo các đƣờng cong ROC trong
phạm vi 0,90-0,95, nghĩa là tốt. Thay vì chẩn đoán ung thƣ, elastography thƣờng

SIÊU ÂM ĐÀN HỒI và ỨNG DỤNG LÂM SÀNG
Pag
e6
đƣợc dùng để tăng sự chắc chắn về lâm sàng một tổn thƣơng có vẻ lành tính, có
nghĩa là tránh đƣợc sinh thiết, chỉ cần theo dõi. Theo kinh nghiệm của chúng tôi, có
khoảng 15% tổn thƣơng có thể tránh làm sinh thiết mà không làm tăng tỷ lệ ung thƣ
bị bỏ qua.
H.6: FA lành tính dễ thấy nhƣ tổn thƣơng echo kém trên (A) hình siêu âm nhƣng không
thấy trên (B) elastogram. H.7: (A) Color elastogram cho thấy một ung thƣ (dark blue) vì lớn hơn đáng kể tổn thƣơng
echo kém trên hình siêu âm tƣơng ứng (B).
Elastograms có thể rất khó để giải thích vì một số yếu tố có thể làm cho hình bị
nhiễu hoặc gây hiểu lầm. Đè ấn đầu dò quá mức làm cứng mô xung quanh, và làm
cho ung thƣ không khác so với mô xung quanh. Quá nhiều áp lực cũng gây ra
chuyển động sang bên [sideways movement] của khối u, gây nhiễu và xảo ảnh
trong elastogram, làm khó diễn giải hơn. Quá nhiều hoặc quá ít chuyển động đầu dò
khi đè ấn có thể làm cho phƣơng pháp tƣơng quan (cross-correlation method) để
phát hiện mô dời chỗ thất bại, gây ra xảo ảnh và gây hiểu nhầm các vùng "tối". Hầu
hết các nhà sản xuất có đặt một chỉ số chất lƣợng hình (quality indicator) trên
elastogram để hỗ trợ ngƣời sử dụng trong việc lựa chọn những hình ảnh đúng để
giải thích (hình 8).Chỉ số chất lƣợng, có thể đƣợc hiển thị nhƣ một giá trị số hoặc là
một color bar (thanh màu), để ƣớc tính chính xác giá trị căng trong hình elastogram.

SIÊU ÂM ĐÀN HỒI và ỨNG DỤNG LÂM SÀNG
Pag
e7
H.8: Bộ phận đánh giá chất lƣợng hình. Một máy (A) trình bày “quality factor” là giá trị số
(mủi tên) trong khí máy thứ hai (B) hiển thị chất lƣợng elastogram là pie chart trong đó các
phân đoạn xanh lá cây xác định chất lƣợng cao hơn (mủi tên).
Do đó cần thực hành nhiều để khám và giải thích bản đồ đàn hồi [elastograms].
Thêm vào việc phân biệt khối rắn lành tính và ác tính, breast elastography đã tỏ ra
hữu ích để chẩn đoán có debris trong tổn thƣơng nang, thƣờng giả dạng nhƣ khối u
đặc.
H.9: 2 phát hiện nang khác nhau. Trên elastogram (A), nang xuất hiện là tổn thƣơng dark
với trung tâm bright. Máy khác cho thấy nang có kiểu hỗn hợp của các vùng sáng và tối (B).

SIÊU ÂM ĐÀN HỒI và ỨNG DỤNG LÂM SÀNG
Pag
e8
Một bổ sung mới vào các phân tích đàn hồi của tổn thƣơng vú là kỹ thuật gọi là đàn
hồi biến dạng căng theo trục (axial shear strain elastography, ASSE). Trong
phƣơng pháp này, các chuyển động sang bên (sideways movement) của các tổn
thƣơng đối với mô xung quanh đƣợc phân tích bằng cách sử dụng một biến thể của
elastography. Phƣơng pháp này nhạy phát hiện các tổn thƣơng ràng buộc với mô
xung quanh (ví dụ nhƣ ung thƣ) so với tổn thƣơng lành tính, có ranh giới là tự do
chuyển động chống lại các mô xung quanh. Hình ASSE có thể dễ giải thích hơn
elastograms và có thể chứng minh là một công cụ mạnh mẽ bổ sung cho phân biệt
tổn thƣơng lành tính từ ác tính (hình 10).
H.10: Axial shear strain elastograms (ASSE) của tổn thƣơng ác tính (A, B, C) và tổn thƣơng
lành tính (D, E, F). Hình siêu âm đƣợc trình bày là A và D, elastogram là B và C, và axial
shear strain elastogram là C và F. Ghi nhận large areas của axial shear strain cạnh ung thƣ
(C, mủi tên lớn) và vùng mảnh [slender zones] của axial shear strain cạnh tổn thƣơng lành
tính (F, mủi tên lớn). Bản quyền của Thitai Kumar, và Jonathan Ophir, University of Texas
Medical School, Houston, TX.
Static elastography trên các máy Hitachi, Toshiba, đã đƣợc thử nghiệm ở nhiều cơ
quan với nhiều thành quả. Hạch bạch huyết, nhân tuyến giáp và ung thƣ tuyến tiền
liệt đã đƣợc chẩn đoán thành công với tạo hình đàn hồi.

SIÊU ÂM ĐÀN HỒI và ỨNG DỤNG LÂM SÀNG
Pag
e9
Phương pháp động (dynamic method)
Mặc dù static elastography đã đƣợc rộng rãi triển khai thực hiện và áp dụng cho các
cơ quan nông, phƣơng pháp này khó sử dụng sâu trong cơ thể, và chất lƣợng hình
ảnh đã không đƣợc chứng minh là có giá trị trong phát hiện bệnh cơ quan lan toả,
nhƣ chai gan.
Có thể sử dụng một kích thích rung động hoặc một xung đẩy singe nhanh để tạo
sóng biến dạng, truyền chậm qua mô, đủ để dùng siêu âm tracking. Tỷ lệ truyền
sóng biến dạng phụ thuộc vào biến dạng ngang (shear modulus) của mô, thƣờng tỉ
lệ thuận trực tiếp với Young‗s modulus. Do đó có thể để định lƣợng độ cứng mô cả
trong một khối u hoặc trong mô không có u bằng cách sử dụng phƣơng pháp này.
Máy đầu tiên áp dụng phƣơng pháp này để khảo sát bệnh gan lan toả là Fibroscan
[TM] do Echosens sản xuất, đƣợc áp qua da vùng gan. Một piston tại trung tâm đầu
dò phát sóng biến dạng vào gan và vận tốc của sóng biến dạng đƣợc sử dụng để
đánh giá shear modulus. Máy này tỏ ra hữu ích cho chẩn đoán xơ gan không xâm
lấn và xơ hóa nặng, mặc dù những thay đổi nhẹ đƣợc phát hiện không đáng tin cậy.
Các máy khác, chẳng hạn nhƣ Siemens S2000 sử dụng tạo hình lực bức xạ âm
(ARFI) để tạo ra một xung đẩy siêu âm cƣờng độ caovào cơ quan. Một elastogram
tiêu chuẩn có thể đƣợc tạo ra bằng cách theo dõi sự dời chỗ gây ra bởi các xung,
nhƣng độ cứng trong một tổn thƣơng hoặc vùng mô khác cũng có thể đƣợc định
lƣợng, vì xung tạo ra sóng biến dạng mà vận tốc có thể đo đƣợc. Máy ARFI chƣa
đƣợc FDA chuẩn y, nhƣng nhiều nghiên cứu sâu rộng của phƣơng pháp này đang
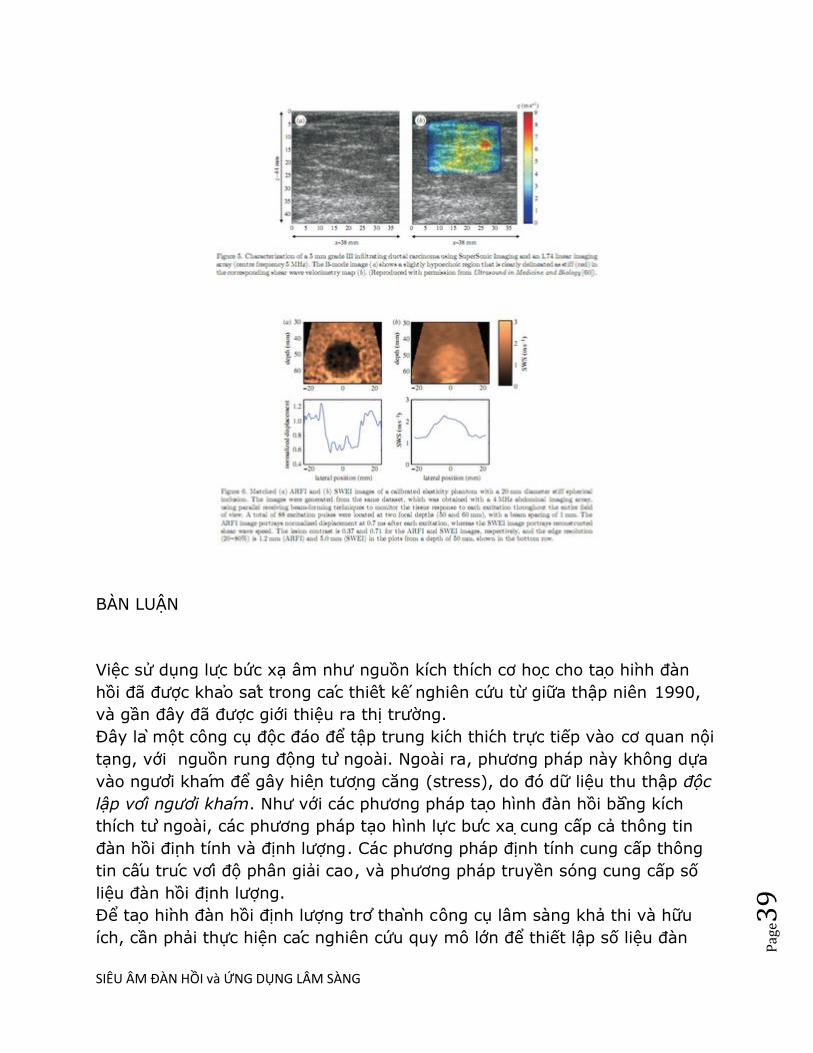
đƣợc tiến hành. Máy Supersonic Imaginetạo ra sóng biến dạng (shear wave) bằng
cách truyền siêu nhanh các chùm âm có cƣờng độ bình thƣờng với nhiều focus
khác nhau; cách tiếp cận này đã đƣợc FDA thông qua.

SIÊU ÂM ĐÀN HỒI và ỨNG DỤNG LÂM SÀNG
Pag
e10
CÁC LOẠI SIÊU ÂM ĐÀN HỒI Ở VIỆT NAM
Là một chiều kích mới của siêu âm chẩn đoán để khảo sát đặc tính đàn hồi của mô mềm (độ cứng, độ nhớt). Có thể gọi siêu âm đàn hồi là "palpation imaging" [tạo hình bằng cách sờ].
Nguyên lý của siêu âm đàn hồi là mô sẽ biến dạng khi bị đè ấn. Mô hay tổn thƣơng sẽ đáp ứng theo nhiều cách, tùy thuộc cấu tạo cơ học. Mô bình thƣờng (mềm) sẽ biến dạng nhiều với áp lực trong khi mô bệnh lý, cứng hơn, sẽ biến dạng ít hơn. Độ tƣơng phản của mô trên bản đồ đàn hồi là do khác biệt độ cứng của mô, đƣợc mã hóa màu tùy nhà sản suất (đỏ= cứng, xanh= mềm, hoặc ngƣợc lại).
Tạo hình đàn hồi cho thấy nhiều loại mô mềm có cùng độ sinh echo nhƣng có đặc tính cơ
học khác nhau, giúp phân biệt đƣợc tổn thƣơng bệnh lý. Tạo hình biến dạng mô (tissue strain imaging) dựa vào khác biệt về độ cứng (stiffness) của tổn thƣơng ác tính và lành tính, áp dụng vào nhiều cơ quan: gan, vú, giáp, tuyến tiền liệt, v.v…với các nghiên cứu từ 1996.
Hình của K J Parker, M M Doyley and D J Rubens

SIÊU ÂM ĐÀN HỒI và ỨNG DỤNG LÂM SÀNG
Pag
e11
Tạo hình biến dạng mô thƣờng dùng để theo dõi sự hoá xơ của mô (tissue fibrosis) hiện áp dụng nhiều nhất cho bệnh gan mạn tính và chai gan.
Ngoài MR elastography, siêu âm có nhiều cách tạo hình biến dạng mô, trên thị trƣờng hiện có các máy siêu âm để phân tích định tính và định lƣợng biến dạng mô (tissue strain), độ cứng (stiffness). Phân làm 2 loại chính: static và dynamic
*static= với nguồn kích thích cơ học trực tiếp: Compression elastography hay strain imaging, nhƣ máy Philips, GE, Hitachi với Hitachi Real-Time Tissue Elastography (HiRTE).
*dynamic= với lực bức xạ (radiation force, a small, steady force that is produced when a sound beam strikes a reflecting or absorbing surface. It is proportional to the acoustic power.Mosby's Medical Dictionary, 8th edition. © 2009, Elsevier) gây ra transient elastography.Gồm có:
- Transient elastography (nhƣ Fibroscan®)
- Supersonic Shear Imaging : với shear wave (nhƣ Supersonic Imagine Aixplorer)
- ARFI imaging: với xung lực bức xạ âm [Acoustic Radiation Force Impulse (ARFI)] nhƣ Acuson Siemens S2000.
Transient Elastography: FibroScan (FS)

SIÊU ÂM ĐÀN HỒI và ỨNG DỤNG LÂM SÀNG
Pag
e12
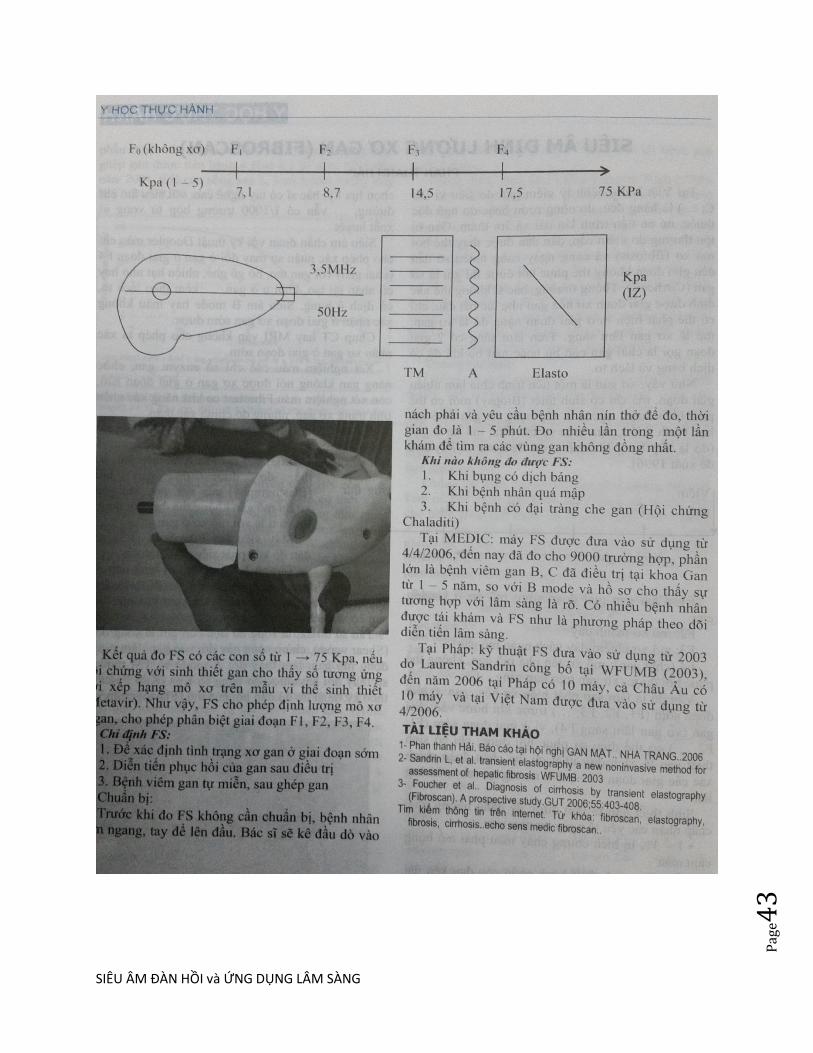
FibroScan (FS) đánh giá xơ hóa gan bằng cách tính tốc độ của sóng biến dạng thoáng qua ở tần số thấp (low-frequency transient shear wave) với đầu dò đƣợc đặt trực tiếp trên da bệnh nhân, ở khoảng liên sƣờn cùng nơi vị trí sinh thiết gan chuẩn. Lập lại 10 lần và tính giá trị trung bình (đơn vị kPa). Có thể khám đƣợc cho cả trẻ em. Hiện dùng máy của hãng Echosense (FibroScan®).
Hạn chế của FS là khó khám ngƣời béo phì, ngƣời có báng bụng. Về kỹ thuật, FS chi đo 1-D ở 50 Hz, do băng thông broadband không quá 50Hz, ngƣời khám không thấy đƣợc vùng ROI, và không phản ánh đƣợc các trƣờng hợp xơ hóa gan không đồng dạng.

SIÊU ÂM ĐÀN HỒI và ỨNG DỤNG LÂM SÀNG
Pag
e13
Acoustic Radiation Force Imaging (ARFI)
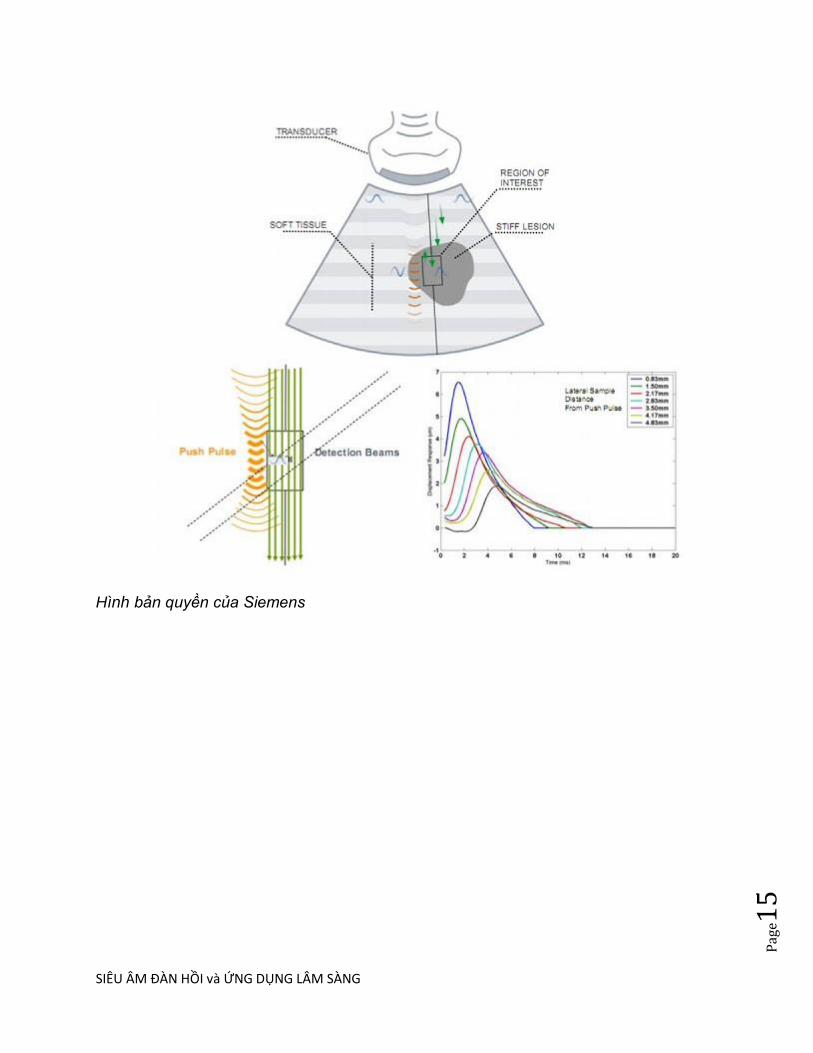
Xung lực bức xạ âm (Focused Acoustic Radiation Force, ARFI) tạo kích thích mô mạnh và khu trú dƣới 0,1miligiây. Đầu dò siêu âm tiếp xúc trên da đủ để khám, không phải đè ấn. Đáp ứng mô đƣợc theo dõi bằng cùng đầu dò siêu âm dùng tạo ra lực, và lập lại nhiều lần trong vùng khám trên siêu âm 2D. Hình tạo ra do đáp ứng mô trong vùng bị kích thích (dời chỗ sau khi lực mất đi, thời gian hồi phục, v.v..) dùng để đánh giá thông tin về cấu trúc của mô.

SIÊU ÂM ĐÀN HỒI và ỨNG DỤNG LÂM SÀNG
Pag
e14
Đầu dò tạo ra các xung đẩy thời gian ngắn (short-duration push pulses) trong vùng ROI tạo kích thích cơ học. Khi xung qua vùng ROI, mô dời chỗ và trở lại vị trí cũ tùy vào đặc điểm cơ học. Tốc độ của mô dời chỗ đƣợc theo dõi bằng chùm siêu âm quy ƣớc (conventional sonographic tracking beam) và phản ánh độ cứng của mô.
SIÊU ÂM ĐÀN HỒI và ỨNG DỤNG LÂM SÀNG
Pag
e15
Hình bản quyền của Siemens
SIÊU ÂM ĐÀN HỒI và ỨNG DỤNG LÂM SÀNG
Pag
e16
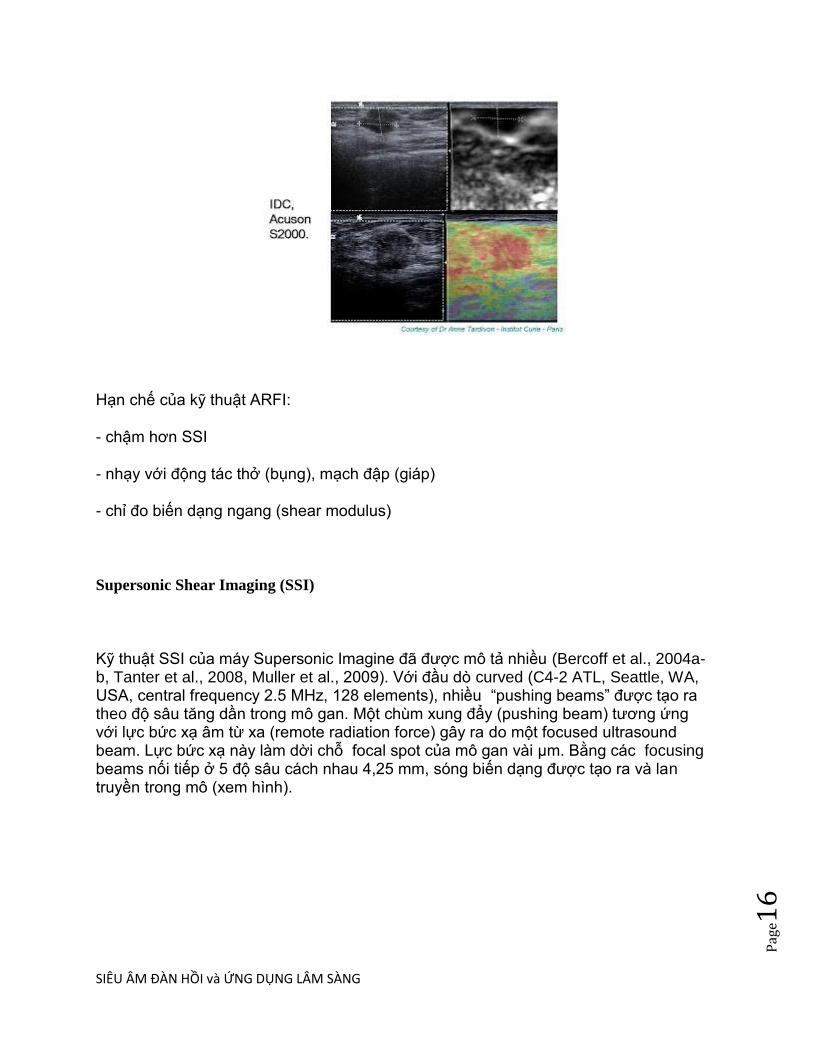
Hạn chế của kỹ thuật ARFI:
- chậm hơn SSI
- nhạy với động tác thở (bụng), mạch đập (giáp)
- chỉ đo biến dạng ngang (shear modulus)
Supersonic Shear Imaging (SSI)
Kỹ thuật SSI của máy Supersonic Imagine đã đƣợc mô tả nhiều (Bercoff et al., 2004a-b, Tanter et al., 2008, Muller et al., 2009). Với đầu dò curved (C4-2 ATL, Seattle, WA, USA, central frequency 2.5 MHz, 128 elements), nhiều ―pushing beams‖ đƣợc tạo ra theo độ sâu tăng dần trong mô gan. Một chùm xung đẩy (pushing beam) tƣơng ứng với lực bức xạ âm từ xa (remote radiation force) gây ra do một focused ultrasound beam. Lực bức xạ này làm dời chỗ focal spot của mô gan vài μm. Bằng các focusing beams nối tiếp ở 5 độ sâu cách nhau 4,25 mm, sóng biến dạng đƣợc tạo ra và lan truyền trong mô (xem hình).

SIÊU ÂM ĐÀN HỒI và ỨNG DỤNG LÂM SÀNG
Pag
e17
Tạo nón sóng biến dạng (conical shear wave) từ các chùm xung đẩy (pushing beams) ở độ sâu
tăng dần.
Mỗi bệnh nhân đƣợc đo ở gan P, nằm ngữa, tay đặt quá đầu, đầu dò đặt ở khoảng liên sƣờn. Ngƣời khám sau khi định vị vùng gan khám bằng hình B-mode, tiến hành đo SSI sequence 5 lần liền cho mỗi bệnh nhân để test intraoperator reproducibility. Thời gian khám chỉ mất 3 phút.
Sau kích thích từ xa này, ultrafast echographic device đạt đƣợc high frame rate (4000 frames/s) in-phase/quadrature (IQ) data bằng cách dùng cùng đầu dò siêu âm. Mô gan dời chỗ do truyền sóng biến dạng gây ra đƣợc chuyển thành IQ data. Để khảo sát vùng mô gan rộng hơn, SSI sequence đƣợc liên tiếp lập lại theo 3 hƣớng khác nhau (một trình tự ở giữa array, một bên trái và một bên phải). Cả 3 trình tự chỉ mất dƣới 1 giây. Ngƣợc lại với FibroScan khi rung động (vibration) do lực bức xạ gây ra tạo nên một kích thích
thoáng qua ngắn (short transient excitation), độ rộng dải tần số (frequency bandwidth) của shear
wave tạo ra lớn hơn, từ 60 đến 600 Hz. Phổ sóng biến dạng băng rộng (wideband ―shear wave
spectroscopy‖) nhƣ vậy giúp phân tích ứng xử cơ học phức tạp (complex mechanical behavior)
của mô tinh tế hơn.

SIÊU ÂM ĐÀN HỒI và ỨNG DỤNG LÂM SÀNG
Pag
e18
Hạn chế của kỹ thuật SSI:
- khó khám vùng sâu
- đơn vị kPa, khó so sánh với máy khác theo đơn vị mét/giây
- chỉ đo biến dạng ngang (shear modulus)
Hitachi Real-Time Tissue Elastography (HiRTE).
thuộc loại static với đầu dò free-hand compression cho phần mềm và bụng, sau có thêm đầu dò qua ngã nội soi. Ban đầu kỹ thuật elasto của Hitachi chỉ định tính, nay phát triển thêm phần định lƣợng.

SIÊU ÂM ĐÀN HỒI và ỨNG DỤNG LÂM SÀNG
Pag
e19
Hạn chế của kỹ thuật freehand compression của Philips, GE, Acuson Antares, Hitachi:
- lệ thuộc vào ngƣời khám với kỹ thuật ấn khám quen dùng
- chỉ định tính (không định lƣợng) độ cứng mô và tổn thƣơng.
- không đo đƣợc đàn hồi khối (bulk modulus)

SIÊU ÂM ĐÀN HỒI và ỨNG DỤNG LÂM SÀNG
Pag
e20
Siêu âm đàn hồi phản ánh độ cứng của tổn thƣơng, cách khám nhƣ siêu âm thƣờng quy. Đã có nhiều bằng chứng trong y văn cho thấy siêu âm đàn hồi làm giảm việc sinh thiết không cần thiết, tăng cƣờng chẩn đoán chính xác các bệnh lý u vú và gan.
Trung tâm Y khoa Medic Hoà Hảo hiện đang sử dụng máy FibroScan (FS), máy Supersonic Imagine (supersonic shear imaging, SSI) và máy Acuson S2000 (ARFI) cho các loại bệnh lý tuyến vú, tuyến giáp, theo dõi xơ hoá gan, bệnh lý cơ khớp, phần mềm và da.
Khảo sát đặc tính đàn hồi của mô mềm (độ cứng, độ nhớt) của siêu âm đàn hồi là bổ sung đáng giá cho B-mode và Doppler. Ứng dụng vào lâm sàng gan, vú đang nở rộ nhƣng khảo sát ở thận, tiền liệt tuyến, tuyến giáp, tim mạch còn ít.
Trong tƣơng lai 10 năm nữa, siêu âm đàn hồi đƣợc Konofagou dự đoán phát triển thêm về:
- viscoelastic và poroelastic;
- giám sát nhiệt độ và tổn thƣơng của ứng dụng HIFU;
- bệnh lý cơ tim [myocardial] hoặc nội mạch [intravascular] ;
- khảo sát châm cứu, đánh giá hiệu ứng châm kim [needling] để tìm hiểu điều gì xảy ra sau cây kim và mô;
- siêu âm đàn hồi 3D và 4D.
Parker và cs nhấn mạnh việc tìm hiểu đầy đủ để sƣu tập, phân loại các thuộc tính biomechanical của mô bình thƣờng và trong thay đổi mô bệnh học đại thể của các bệnh liên quan đến tế bào, di truyền.
Tóm lại siêu âm đàn hồi đã sẵn sàng hỗ trợ cho lâm sàng, nhƣng để có thể đƣợc tin cậy là phƣơng tiện khám chính thức và quyền năng, hiện cần có nhiều nổ lực nghiên cứu sâu rộng thêm nữa.

SIÊU ÂM ĐÀN HỒI và ỨNG DỤNG LÂM SÀNG
Pag
e21
______________________________________________
FURTHER READING: 20 năm nhìn lại Tạo hình đặc tính đàn hồi mô
Trích từ K J Parker, M M Doyley and D J Rubens: Imaging the elastic properties of tissue: the
20 year perspective, Phys. Med. Biol. 56 (2011).
....
Transient shear wave imaging
A number of techniques focus on the propagating wave that results from a transient (impulsive or
short tone burst) excitation of the tissue. Sarvazyan et al (1998) proposed a method based on
acoustic radiation force generated shear waves. The local propagation from a focus was analyzed
to estimate the local shear parameters. Nightingale et al (2006), Wang et al (2007) and Palmeri et
al (2007) conducted related studies in the liver to ascertain the degree of liver fibrosis.
Separately, Catheline et al (1999) devised a low frequency (50 Hz) external mechanical
vibrator integrated with an ultrasound M-mode system. This integrated applicator can be
applied through the ribs to excite a short tone burst which propagates into the liver. The
ultrasound tracking provides a displacement history along the axial center line, and from this a
global estimate of liver shear velocity and thus elasticity can be estimated. This technique is
implemented in a stand-alone clinical device, the Fibroscan manufactured by Echosense in
France, and is unique in that it does not require integration into a conventional imaging system.
Bercoff et al (2004) developed an ultra high speed (10 000 imaging frames per second)
ultrasound scanner that was capable of monitoring the wave propagating from an ARF impulse
within the tissue. Multiple ARF impulses fired at a rapid rate compared to the relatively slow
shear wave speed were termed ‗supersonic‘ excitations and are implemented in a supersonic
shear imaging scanner. This approach has been used to study the viscoelastic properties of breast
lesions (Tanter et al 2008), muscles (Deffieux et al 2007b) and liver (Deffieux et al 2007a).

SIÊU ÂM ĐÀN HỒI và ỨNG DỤNG LÂM SÀNG
Pag
e22
More recently, McAleavey et al have devised a method named spatially modulated ultrasound
radiation force (SMURF) (McAleavey and Menon 2007). Instead of utilizing a sharp focal
region to deliver an impulse of ARF to the tissue, a spatially modulated pattern is employed to
set up a unique spatial frequency within a region of tissue. After excitation of this spatial
frequency with an impulse of ARF, the temporal history of displacements are obtained and
analyzed to estimate the local shear wave speed. This technique has been validated in tissue-
mimicking phantoms (McAleavey et al 2009).
Acoustic radiation force imaging
The use of acoustic radiation force (ARF) as an imaging modality was introduced by Nightingale
et al (2001). ARFI provides multiple parameters and strategies, for example one can map the
maximum displacement as points are successively pushed, or the relaxation time following each
push. The technique has been demonstrated in breast (Sharma et al 2004), prostate (Zhai et al
2010) and for delineation of RFA lesions (Fahey et al 2004, 2005).
The advantages of ARFI (and the other radiation force based techniques) stem from the fact that
anywhere an imaging system can focus; a pushing pulse of radiation force can be applied. The
disadvantages are that ARF is a relatively weak effect, thus high intensities and heating of the
system and tissue place limits on the resulting displacements (Palmeri and Nightingale 2004).
Other related techniques
In principle, it is possible to utilize any tomographic imaging system to track tissue motion and
deduce some biomechanical properties of the tissue. The evolution of the elastographic imaging
techniques covered in previous sections relied mostly on ultrasound and MRI.
However, optical systems can be configured to track tissue motion in real time. In particular,
optical coherence tomography (OCT) is directly analogous to ultrasound imaging in that a
speckle image of a 2D plane can be produced at high frame rates. Penetration in tissue of the
optical wavelengths is limited but within the imaging plane, tissue motion can be tracked using
correlation techniques or Doppler techniques that parallel those used in ultrasound.

SIÊU ÂM ĐÀN HỒI và ỨNG DỤNG LÂM SÀNG
Pag
e23
Compression elastography by OCT was introduced by Schmitt (1998) using a free-space
Michelson interferometer and utilizing speckle tracking to determine displacements and then
calculate strain. Other work employs a variety of Doppler and correlation methods to track the
response of tissues (Wang et al 2006, Kirkpatrick et al 2006, Liang et al 2008, 2010, Kennedy et
al 2009). The advantage of optical methods is that very high resolution and microscopic studies
can be performed.
A distant relative of elastographic imaging is the field of thermo-acoustic imaging, which has
largely developed independent of the methods covered in section 4. In thermo-acoustic imaging,
a short impulse of electromagnetic energy or laser energy is distributed throughout a tissue, and
differential absorption creates thermal expansion waves which are detected and utilized in a
reconstruction (Patch and Scherzer 2007). Both EM-acoustic imaging (Bowen 1981,Bowen et al
1981, Nasoni et al 1985) and opto-acoustic imaging (Oraevsky et al 1999, Esenaliev et al 1999)
have been actively developed over the last few decades. At a high level of abstraction, these
techniques, like elastographic techniques, attempt to reconstruct the differential response of
tissues to an input. The fusion of these techniques has been explored by Emelianov et al (2004).
Clinical results
Over the past several years elastography has moved out of the laboratory and into the hands of
clinicians. The most rapidly adopted areas include liver, breast, prostate and thyroid.
Liver elastography has become a mainstay for gastroenterologists who use a non-imaging
instrument (Fibroscan) to assess liver parenchymal stiffness in patients with hepatitis, at risk for
developing cirrhosis. Calculations of liver stiffness based on transient elastography (Fibroscan)
have shown better than 90% correlation with Metavir staging for hepatitis C and have a better
than 90% negative predictive value for cirrhosis (stage 4 disease) (Wang et al 2009). When
Fibroscan is combined with a blood test for liver fibrosis (fibrometer) sensitivity and specificity
rise to over 90% for advanced (stage 4) disease (Boursier et al 2009). One of the limitations of
current liver elastography is that it has no imaging component. A second difficulty involves
depth of penetration as well as liver contact. Very large patients and/or patients with ascites are
not as effectively studied, with one in five obese patients having inadequate studies (Castera et al
2008, 2010). New equipment and processing techniques are being developed to overcome these
limitations.

SIÊU ÂM ĐÀN HỒI và ỨNG DỤNG LÂM SÀNG
Pag
e24
Imaging of more superficial structures has been more successful. The most widely adopted
application in the USA has been breast compression elastography. A direct compression
technique has become commercially available from multiple manufacturers, and the sensitivity
and specificity for carcinoma versus benign disease are above 95% and 80%, respectively (Ginat
et al 2009,Barr 2006, Thomas et al 2007). In a multicenter study from Wojcinski et al (2010)
assessing 779 patients, elastography demonstrated an improved specificity (89.5%) and an
excellent positive predictive value (86.8%) compared to B-mode ultrasound (76.1% and 77.2%)
for detecting malignant lesions. In dense breasts, the specificity was even higher (92.8%). In
breast lesions, malignancy creates a larger lesion on the elastogram than is seen on the routine
grayscale B-scan image, presumed due to the desmoplastic reaction of the tumor and tethering
in the adjacent tissue. In contrast, benign lesions are equal to or smaller than the grayscale
image. Furthermore, a five-point scale utilized in some studies using Hitachi scanners
characterizes the strain patterns and has shown promise for breast cancer diagnosis (Itoh et al
2006,Zhi et al 2010). Elastography therefore adds another imaging dimension, which can be used
to help characterize indeterminate lesions such as solid-appearing cysts or solid hypoechoic
well-circumscribed nodules (Burnside et al 2007, Svensson and Amiras 2006). Thus, it can
potentially eliminate some unnecessary biopsies.
Unlike the breast, where elastography is used to characterize an already detected lesion, prostate
elastography was developed to aid in detection of potential areas of prostate cancer, as grayscale
ultrasound is relatively insensitive to identify discrete focal lesions. Practitioners in Austria
(Pallwein et al 2008), Germany (Salomon et al 2008), Japan (Kamoi et al 2008) and the
USA(Castaneda et al 2009) have shown improved detection of prostate cancer on average from
less than 50% by ultrasound alone up to the 80% range using sonoelastography. Compression
elastography on commercial equipment has been evaluated with respect to improving yield from
a prostate biopsy. When larger lesions (greater than 5 mm) and lesions located in the peripheral
regions are targeted, the biopsy yield improves (accuracy 76%), but has not been shown to be
sufficient to replace blinded 10- or 12-core biopsies (Kamoi et al 2008).
All methods (compression and vibration) suffer from false positive findings due to benign
prostatic hypertrophy with a false positive rate of about 20% (Castaneda et al 2009, Pallwein et
al 2008).
A recent adaptation of compression elastography has been developed in the thyroid, using the
gated pulsation of the carotid as the compressive force against the thyroid tissue. Dighe et al
have found an excellent correlation between tissue stiffness and papillary carcinoma, the most
prevalent type of thyroid cancer. Benign nodules are significantly softer, so that, in a cohort of 59
patients, if elastography had been used in addition to grayscale features as a discriminator, as
many as 60% of thyroid biopsies could have been safely deferred (Dighe et al 2010). Given the

SIÊU ÂM ĐÀN HỒI và ỨNG DỤNG LÂM SÀNG
Pag
e25
low prevalence and the indolence of most thyroid cancer, avoiding unnecessary biopsies ay
provide a great cost saving while permitting safe conservative management of thyroid nodules.
The newest application of elastography to clinical disease states involves vascular pathology,
including assessment of thrombus age and overall vascular compliance (de Korte et al 2000,
2002, Biswas et al 2010, Weitzel et al 2009). Rubin et al have shown marked changes in stiffness
of common femoral clots as they age (Xie et al 2004). This may potentially assist clinicians in
deciding which thrombi require anticoagulation and for what time period.
Direct measurement of vessel wall compliance would permit monitoring of blood pressure and
the efficacy of antihypertensive therapy.
Many of the clinical applications attempted to date have been limited by their ability to
adequately contact and displace tissue to achieve accurate and reproducible measurements.
The next generation of imaging/elastography equipment is testing methods where ultrasound
itself provides the tissue displacement, including acoustic radiation force imaging and
vibroacoustography. The frequencies which acoustic radiation force imaging can achieve may
permit more focused evaluation with improved resolution, especially important for detection of
small lesions (prostate) or small displacements (vessels). Other potential future applications may
include monitoring ablative therapies (radiofrequency ablation or cryoablation or high intensity
focused ultrasound) in real time, as ablated tissues are many orders of magnitude stiffer than the
background tissue (Zhang et al 2008a).
.....
________________________________________
Xem thêm về các bài về siêu âm đàn hồi khác:
Ultrasonic Computed Tomography Combining with Elastography to Characterize Tissue Elastic
Properties đo bulk modulus
Acoustic Structure Quantification, ASQ với tín hiệu RF
Real-Time Elastography in Liver Diseases với HiRTE của Hitachi freehand compression
------------------------------------------------------------------------------------

SIÊU ÂM ĐÀN HỒI và ỨNG DỤNG LÂM SÀNG
Pag
e26
Chú thích:
1. Shear Wave: sóng biến dạng, còn gọi là sóng ngang, là một biến dạng đàn hồi thẳng góc với hƣớng chuyển động của sóng âm theo chiều dọc. Không truyền được qua chất dịch và khí.
Compression Wave: sóng đè nén, còn gọi là sóng dọc, là một đè nén vào môi trƣờng.
2. Lực bức xạ âm (acoustic radiation force) là kết quả từ momentum transfer (chuyển đổi động lƣợng) từ sóng siêu âm lan truyền đến mô. Khi một chùm siêu âm truyền qua môi trƣờng hấp thụ, kết quả chuyển đổi năng lƣợng thành hiệu ứng thứ cấp (second-order effect) sẽ gây ra lực tỉ lệ với cƣờng độ tại chỗ và sự hấp thụ. Lực này đƣợc gọi là lực bức xạ (radiation force) [Torr 1984]. Theo Mosby's Medical Dictionary, 8th edition. © 2009, Elsevier, radiation force, là lực nhẹ, đều đặn gây ra bởi chùm âm khi đập vào bề măt phan xa hay bê măt hâp thu. Lƣc bƣc xa tỉ lệ thuận với cƣờng độ âm.Có các phƣơng thức áp dụng lực bức xạ âm: tĩnh (static), thoáng qua (transient), hoặc có tính hoà âm (harmonically).
3. Elasticity Imaging Methods: Ngoài kích thích cơ học là chuyển động mô sinh lý (mạch đập), nếu=
- dùng nguồn rung động (vibration) từ ngoài để tạo sóng biến dạng trong mô= sonoelasticity.
- dùng nguồn nén tĩnh bên ngoài (external static compression) để kích thích cơ học = strain imaging.
- thuận tiện hơn 2 cách từ ngoài đã kể ở trên, dùng lực bức xạ âm (Sugimoto đề xuất đầu tiên, 1990) kết hợp trực tiếp trong mô = shear wave elasticity imaging (Sarvazyan và cs, Nightingale và cs, Bercoff và cs., Fink và cs).
4. Young's modulus= biến dạng dọc, giá trị tuyệt đối đàn hồi Young, mô tả biến dạng theo chiều dọc với áp lực dọc.
5. Shear modulus= biến dạng ngang, liên quan với biến dạng theo chiều ngang và đƣợc liên hệ với truyền sóng biến dạng trong môi trƣờng đồng nhất đẳng hƣớng (isotropic homogeneous media).
6. Bulk modulus= biến dạng khối (cả dọc và ngang), độ đàn hồi khối, mô tả thay đổi thể tích của vật chất do kích thích từ ngoài.
Tài liệu tham khảo chính:

SIÊU ÂM ĐÀN HỒI và ỨNG DỤNG LÂM SÀNG
Pag
e27
1. Éric Bavu, Jean-Luc Gennisson, Mathieu Couade, Jeremy Bercoff, Vincent Mallet, Mathias Fink, Anne Badel , AnaÏs Vallet-Pichard, Bertrand Nalpas, Mickaël Tanter, Stanislas Pol: Noninvasive In Vivo Liver Fibrosis Evaluation Using Supersonic Shear Imaging: A Clinical Study on 113 Hepatitis C Virus Patients, Ultrasound in Medicine and Biology,Volume 37, Issue 9 , Pages 1361-1373, September 2011.
2. Stanislav Emelianov: Ultrasound Elasticity Imaging, University of Texas.
3. Josef Jaros: Ultrasound Elastography, University of Kuopio, Finland.
4. Andy Milkowski : Elasticity reaching Clinical Maturity, Siemens.
5. Mark L. Palmeri - Kathryn R. Nightingale: Acoustic Radiation Force-Based Elasticity Imaging Methods, Interface Focus (2011).
6. K J Parker, M M Doyley and D J Rubens: Imaging the elastic properties of tissue: the 20 year perspective, Phys. Med. Biol. 56 (2011).
7. Peter NT Wells, Hai Dong Liang: Medical Ultrasonic: Imaging of Soft Tissue Strain and Elasticity, J.R.Soc. Interface 16 June 2011.
---------------------------------------
Đọc lại thêm về truyền sóng âm (Wave Propagation)
Ultrasonic testing is based on time-varying deformations or vibrations in materials, which is generally referred to as acoustics. All material substances are comprised of atoms, which may be forced into vibrational motion about their equilibrium positions. Many different patterns of vibrational motion exist at the atomic level, however, most are irrelevant to acoustics and ultrasonic testing. Acoustics is focused on particles that contain many atoms that move in unison to produce a mechanical wave. When a material is not stressed in tension or compression beyond its elastic limit, its individual particles perform elastic oscillations. When the particles of a medium are displaced from their equilibrium positions, internal (electrostatic) restoration forces arise. It is these elastic restoring forces between particles, combined with inertia of the particles, that leads to the oscillatory motions of the medium.
In solids, sound waves can propagate in four principle modes that are based on the way the particles oscillate. Sound can propagate as longitudinal waves, shear waves, surface waves, and in thin materials as plate waves. Longitudinal and shear waves are the two modes of propagation most widely used in ultrasonic testing. The particle
SIÊU ÂM ĐÀN HỒI và ỨNG DỤNG LÂM SÀNG
Pag
e28
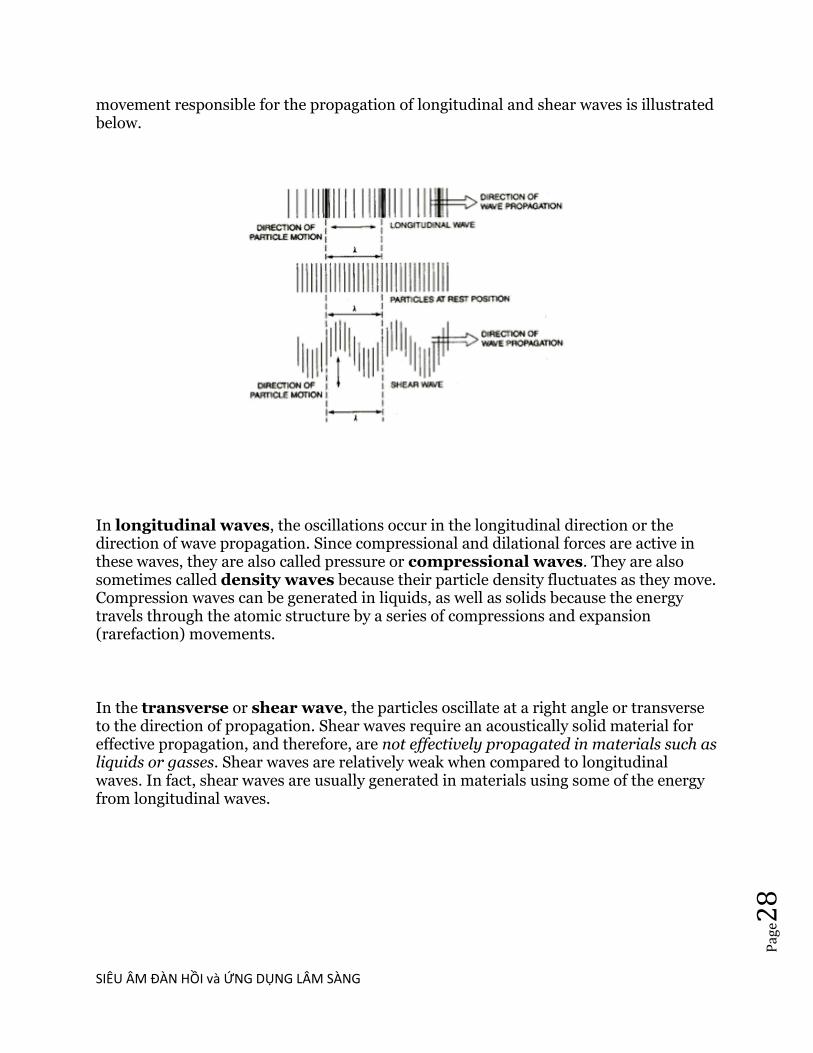
movement responsible for the propagation of longitudinal and shear waves is illustrated below.
In longitudinal waves, the oscillations occur in the longitudinal direction or the direction of wave propagation. Since compressional and dilational forces are active in these waves, they are also called pressure or compressional waves. They are also sometimes called density waves because their particle density fluctuates as they move. Compression waves can be generated in liquids, as well as solids because the energy travels through the atomic structure by a series of compressions and expansion (rarefaction) movements.
In the transverse or shear wave, the particles oscillate at a right angle or transverse to the direction of propagation. Shear waves require an acoustically solid material for effective propagation, and therefore, are not effectively propagated in materials such as liquids or gasses. Shear waves are relatively weak when compared to longitudinal waves. In fact, shear waves are usually generated in materials using some of the energy from longitudinal waves.

SIÊU ÂM ĐÀN HỒI và ỨNG DỤNG LÂM SÀNG
Pag
e29
Acoustic Radiation Force-Based Elasticity Imaging Methods
Mark L. Palmeri and Kathryn R. Nightingale, Interface Focus (2011) on
October 20, 2011.
(trích dịch)
Tạo hình siêu âm chẩn đoán quy ƣớc mô tả khác biệt về đặc tính âm thanh
của mô mềm, trong khi tao hình siêu âm đàn hồi mô taƤ khác biệt vêƦ
thuộc tính đàn hồi của mô mềm (tức là độ cứng, độ nhớt). Lơƥ i iƧ ch thực tế
của hình ảnh đàn hồi cho thấy rất nhiều mô mềm có độ sinh siêu âm tƣơng
tự, nhƣng laƥ i có đặc tính cơ học khác nhau, và có thể dùng các đặc tính
này để khaƤ o saƧ t giải phẫu hoƥ c bình thƣờng và phân biêƥ t đƣơƥ c tổn thƣơng
bệnh lý. Các phƣơng pháp tạo hình xung lực bức xạ âm dùng lực bức xạ âm
để laƦ m biến dạng thoang qua mô mềm, và đaƧ p ƣƧ ng dơƦ i chô mô đƣơƥ c siêu âm
đo laƥ i vaƦ dùng để đánh giá đặc tính cơ học của mô. Cả chất lƣợng hình và số
đo định lƣợng tính đàn hồi có thể taƧ i taƥ o lại từ những dữ liệu đo naƦ y , cung
cấp thông tin cho chẩn đoán và theo dõi tiến triển bệnh. Gần đây, các ky
thuâƥ t taƥ o hiƦ nh đaƦ n hôƦ i theo xung lực bức xạ âm đã chuyển tƣƦ phòng thí
nghiệm đêƧ n giƣơƦ ng bêƥ nh, nơi mà bác sĩ đang khơƤ i sƣƥ sƣƤ duƥ ng độ cứng mô
để chẩn đoán, và việc triển khai siêu âm đàn hồi dƣƥ a vaƦ o xung lƣƥ c bức xạ
âm đang xuất hiện trên thị trƣờng.
Bài viết này cung cấp một tổng quan về taƥ o hình đàn hồi dựa trên xung lƣƥ c
bức xạ âm, trong đó gôƦ m đánh giá đăƥ c trƣng cơ hoƥ c cuƤ a mô mềm, đánh giá
các phƣơng phaƧ p xung lƣƥ c bức xạ âm đã đƣợc đề xuất cho taƥ o hình đàn hồi ,
và thảo luận về nghiên cứu hiện tại và xuƧ c tiêƧ n thƣơng maƥ i caƧ c ky thuâƥ t taƥ o
hình đàn hồi dựa trên xung lực bức xạ âm.
ELASTICITY IMAGING METHODS (CAC PHƢƠNG PHAP TAO HINH ĐAN
HÔƦ I)
Tất cả các phƣơng pháp taƥ o hình đàn hồi đêƦ u áp dụng kích thích cơ hoƥ c hoặc
stress đến mô, cả bằng nguồn kích thích bên ngoài, nguồn chuyển động sinh
lý nội taƥ i hoặc lực bức xạ âm, rôƦ i đo lƣờng biến daƥ ng mô đƣơƥ c gây ra (tức là
sƣƥ dơƦ i chô) để đáp ứng với stress đó, bằng siêu âm, cộng hƣởng từ (MR)
hoặc các phƣơng pháp taƥ o hình quang học (optical imaging).

SIÊU ÂM ĐÀN HỒI và ỨNG DỤNG LÂM SÀNG
Pag
e30
Dựa trên các mối quan hệ stress–strain (đeƦ eƧ p-biêƧ n daƥ ng), nhƣ trong
phƣơng trình (1.2), hoặc các mô hình của sự truyền sóng biêƧ n daƥ ng, nhƣ
trong phƣơng trình Helmholtz (1.3), biến daƥ ng mô đo đƣơƥ c khi đáp ứng với
kích thích cơ hoƥ c đƣợc liên hêƥ đến độ cứng cuƤ a mô.
Thoạt đầu khi phƣơng pháp tạo hình đàn hồi đƣợc đề xuất, kích thích cơ hoƥ c
là từ chuyển động mô sinh lý, ví dụ nhƣ mạch đập, và siêu âm đã đƣợc duƦ ng
để giám sát đaƧ p ứng mô. Sau đó, dùng nguồn rung động (vibration) tƣƦ ngoài
để tạo ra sóng biêƧ n daƥ ng trong mô vơƧ i siêu âm giaƧ m saƧ t (tức là
sonoelasticity) và các phƣơng pháp nén tĩnh bên ngoài (external static
compression) để kích thích cơ hoƥ c đƣợc giám sát bởi siêu âm (tức là taƥ o hình
biêƧ n daƥ ng, strain imaging), đã lâƦ n lƣơƥ t đƣợc giới thiệu tƣƦ năm 1988 và
1991.
Sử dụng lực bức xạ âm nhƣ nguồn kích thích cơ hoƥ c đâƦ u tiên đƣợc Sugimoto
đề xuất năm 1990. Phƣơng pháp kích thích này thuận tiêƥ n hơn khi so sánh
với các phƣơng pháp tƣƦ ngoài vì nó kết hợp trực tiếp trong mô khaƧ m, hơn laƦ
thông qua các mô can thiệp. Kỹ thuật taƥ o hình đàn hồi cung cấp hiƦ nh ảnh
liên quan đến độ cứng mô caƤ về điƥ nh tiƧ nh, mô tả khác biệt độ cứng tƣơng
đối, hoặc định lƣợng, cung cấp một ƣớc tính của mô đun đàn hồi mô tiềm ẩn
bằng cách taƧ i taƥ o lại. Các bài đánh giá xuất sắc về phƣơng pháp tạo hình
đaƦ n hôƦ i gần đây laƦ do Greenleaf et al vaƦ Parker et al công bôƧ . Trong bài này,
các phƣơng pháp taƥ o hình đàn hồi băƦ ng lƣƥ c bức xạ âm tập trung vơƧ i kích
thích cơ hoƥ c đêƤ taƥ o hình đàn hồi đƣợc thảo luận.

SIÊU ÂM ĐÀN HỒI và ỨNG DỤNG LÂM SÀNG
Pag
e31
Acoustic Radiation Force (Lưc bưc xa âm)
Lực bức xạ âm laƦ kết quả từ một chuyêƤ n đôƤ i đôƥ ng lƣơƥ ng (momentum
transfer) từ sóng siêu âm lan truyêƦ n đêƧ n mô qua đó truyêƦ n đi theo luâƥ t hấp
thụ và cơ chế tán xạ.
Theo Nyborg, mô cơ thêƤ đƣơƥ c mô hình hoƧ a nhƣ một châƧ t diƥ ch nhớt để đáp
ứng với truyền sóng âm, theo giả định laƦ sóng phăƤ ng (plane wave), lƣƥ c bức
xạ âm (F) liên quan đến âm hấp thụ (a) và tốc độ âm (c) của các mô và
cƣờng độ trung bình theo thời gian của các chùm âm (I) .
Lực bƣƧ c xaƥ âm này có hình thức là một lực cơ thể theo hƣớng sóng lan
truyền. Đáng chú ý laƦ dân xuâƧ t naƦ y không thu nhâƥ n âm tán xạ tƣƦ
momentum transfer, điêƦ u naƦ y hợp lý trong mô mềm, nơi phần lớn hiêƥ n
tƣơƥ ng giảm âm laƦ do sự hấp thụ. Lực bức xạ sẽ gâƧ p đôi lƣƥ c hấp thụ cho một
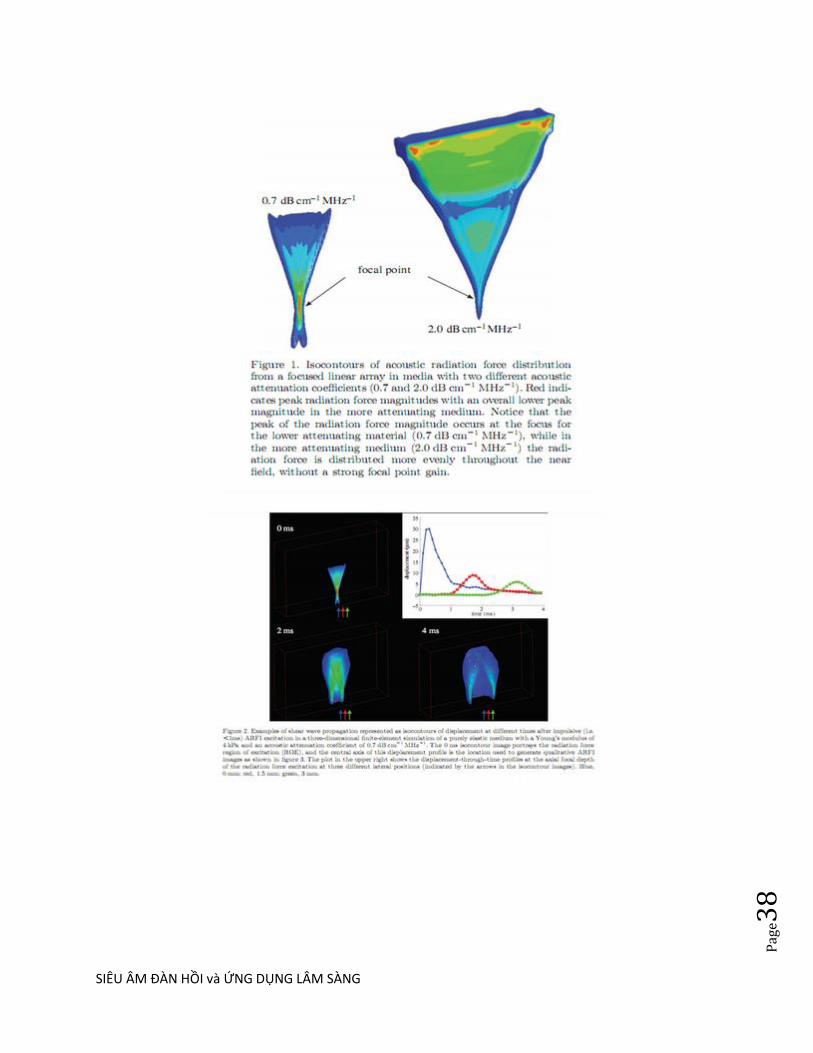
vâƥ t phaƤ n âm hoaƦ n toaƦ n. Phân bố không gian cuƤ a trƣơƦ ng lƣƥ c bức xạ âm naƦ y
đƣợc phân bố trong geometric shadow của lô đâƦ u doƦ . Thông thƣờng, đó là
một đỉnh trong trƣơƦ ng lƣƥ c gần tâm điểm, nhƣ trong figure 1; tuy nhiên, vơƧ i
tần số cao hơn và/hoăƥ c vật liệu giaƤ m âm maƥ nh, trƣơƦ ng lực đƣơƥ c phân bôƧ
đôƦ ng daƥ ng qua geometric shadow của lô, nhƣ mô tả trong figure 1. Vì thế,
tần số tối ƣu đƣợc sử dụng cho lực bức xạ âm kích thích mô thay đôƤ i với độ
sâu và điêƦ u khiển bởi sự cân bằng giữa suy giảm mâƧ t đi trong nearfield và
focal gain. Thông qua viêƥ c sử dụng xung âm dài hơn và/hoặc cƣơƦ ng đôƥ xung
cao hơn nhƣ thƣờng sử dụng trong chẩn đoán, biến dạng mô mềm thoáng
qua theo micrometres (10^-6m) và dịch chảy liên tục (fluid streaming) theo
cm/sec có thể đƣợc tạo ra in vivo.
Với các nguồn kích thích cơ hoƥ c bên ngoài, lực bức xạ âm có thể đƣợc áp
dụng cho thời khoaƤ ng khác nhau. Phƣơng pháp đã đƣợc đề xuất đêƤ áp dụng
lƣƥ c bức xạ âm (gâƦ n, quasi) tĩnh, nơi xung kích thích đƣợc áp dụng đủ lâu để
các mô đaƥ t một đaƧ p ứng traƥ ng thaƧ i săn saƦ ng (thƣờng lớn hơn 1 s); thoang
qua, nơi các xung kích thích là một xung thời gian (tức là nhanh hơn coƧ yƧ

SIÊU ÂM ĐÀN HỒI và ỨNG DỤNG LÂM SÀNG
Pag
e32
nghĩa so với các tần số cộng hƣởng tự nhiên liên kết với các đáp ứng mô
động); hoặc co tính hoa âm (harmonically) nơi mà kích thích kiêƤ u xung
đƣợc áp dụng theo một hoặc nhiêƦ u tần số nhăƦ m đaƥ t đƣơƥ c kích thích mô
xoang hoƧ a (sinusoidal). Ngoài ra, các phƣơng pháp xử lý dữ liệu và hiển thị
cho taƥ o hình đaƦ n hôƦ i dƣƥ a vaƦ o lƣƥ c bƣƧ c xaƥ đã đƣợc tiếp cận trong hai loại
chính: (i) loại cung cấp chất lƣợng hình ảnh tƣơng đối khác biệt trong độ
cứng mô, tƣơng tự nhƣ taƥ o hiƦ nh biêƧ n daƥ ng neƧ n tƣƦ ngoaƦ i, tạo hình nén tim và
siêu âm nôƥ i maƥ ch (IVUS) palpography và (ii) loại cung cấp đaƧ nh giaƧ định
lƣợng của mô đun đàn hồi tiềm ẩn của các mô, nhƣ đƣợc thực hiện với MR
elastography.
Steady-State Radiation Force Excitations in Fluids
Steady-State Radiation Force Excitations in Soft Tissues (Kích thích
lưc bưc xa trong mô mêm)
Các mô mềm coƧ tiƧ nh đaƦ n hôƦ i nhơƧ t (viscoelastic), có nghĩa là đaƧ p ứng vơƧ i kích
thích cơ hoƥ c phụ thuộc vào tần số kích thích. Đối với kiƧ ch thiƧ ch tần số siêu
âm, mô mềm đáp ứng nhƣ châƧ t diƥ ch, nơi chỉ coƧ soƧ ng aƧ p lƣƥ c truyền viƦ mô
mềm không hỗ trợ aƧ p lƣƥ c biêƧ n daƥ ng ở tần số cao. Tuy nhiên, vì hiện tƣợng
lực bức xạ âm phát sinh từ sự hấp thu năng lƣợng âm và phụ thuộc vào
cƣờng độ thời gian trung bình của một sóng âm nén (phƣơng trình Nyborg),
tần số của kích thích lực bức xạ taƥ o đƣơƥ c se thâƧ p hơn sóng siêu âm (ít hơn
1000 Hz).
Ơ tần số thấp này, các mô đã đƣợc mô hình hoƧ a hợp lý cung nhƣ chất rắn
đàn hồi, nơi maƦ độ cứng của mô không đƣợc xem là một haƦ m của tần số
kích thích, hoặc bằng cách sử dụng đơn giản mô hình viscoelastic, ví dụ nhƣ
các mô hình Voigt và mô hình châƧ t rắn ba tham số.
Trong mô mềm, xung kích thích lƣƥ c bức xạ âm PRF cao có thể đƣợc sử dụng
để tạo một kích thích bƣớc (excitation step) có hiệu quả của vật liệu (thông
thƣờng đối với một vài trăm mili giây), và cả thời gian tăng và sự dời chỗ
trạng thái ổn định có liên quan đến độ cứng vật liệu bên dƣới. Cả xung kích
thích đƣợc sử dụng để giám sát các phản ứng mô, hoặc xung taƥ o hình thời
hạn ngắn hơn đƣợc xen kẽ với xung đẩy đêƤ giám sát mô. Walker khám phá
cách tiếp cận này, băƦ ng caƧ ch sử dụng cả các mô hình vật chất đàn hồi, và
mô hình viscoelastic Voigt để coƧ đƣợc đăƥ c trƣng vật chất tƣơng đối từ các

SIÊU ÂM ĐÀN HỒI và ỨNG DỤNG LÂM SÀNG
Pag
e33
đaƧ p ứng mô. Viola et al đã sử dụng cách tiếp cận này để châƤ n đoaƧ n hiêƥ n
tƣơƥ ng đông máu in vitro trong phòng khaƤ o saƧ t đƣơƥ c thiêƧ t kêƧ đêƤ thông tin
phản hồi kịp thời để chuyên viên gây mê bác sĩ phẫu thuật sử dụng siêu âm
lƣu biêƧ n (sonorheometry). Mauldin et al. cũng đã sử dụng cách tiếp cận này
với mô hình Voigt, bằng cách sử dụng một hằng số rộng vào account cho
giảm âm, cƣờng độ và các yếu tố khác ảnh hƣởng đến độ lớn lực bức xạ.
TRANSIENT (impulsive) RADIATION FORCE EXCITATIONS (KICH
THICH LƯC BƯC XA [XUNG] THOANG QUA)
Quality Methods (Phƣơng pháp định tính)
Kích thích lực bức xạ âm tập trung thoáng qua thƣờng là xung đơn coƧ đôƥ daƦ i
khoảng vài trăm chu kỳ (0.05–1 ms). Trong đaƧ p ứng để tập trung vơƧ i caƧ c
kích thích thoáng qua, các mô trong vùng kích thích (region of excitation
ROE) bị biến dạng, và sóng biêƧ n daƥ ng tạo đƣợc truyền đi khoƤ i vuƦ ng ROE,
nhƣ trong figure 2. Tạo hình xung lực bức xạ âm (ARFI) sử dụng kiƧ ch thiƧ ch
nhƣ xung-thời gian (thời lƣợng xung đẩy nhỏ hơn 1ms) và theo dõi đaƧ p ƣƧ ng
dơƦ i chô mô thoáng qua trong ROE bằng cách sử dụng một mảng (array) tạo
hình SACĐ duy nhất. Trình tự taƥ o hiƦ nh ARFI tuần tự tra xeƧ t các vị trí trong
không gian liền kề đêƤ xây dựng một tập dữ liệu ARFI 2-D tôƤ ng hơƥ p caƧ c đaƧ p
ứng từ mọi tra xét này. Qua mỗi ROE, mỗi điểm ảnh chứa dữ liệu dơƦ i chô
theo thời gian (nhƣ đƣợc hiển thị bởi đƣờng cong màu xanh, ở trung tâm của
vòng ROE taƥ i điêƤ m khu truƧ trong biêƤ u đôƦ figure 2) cho phép đánh giá một
loạt các tham số, bao gôƦ m sƣƥ dơƦ i chô tại một thời điểm đƣơƥ c cho sau khi
kích thích, sƣƥ dơƦ i chô tối đa, dơƦ i chô thơƦ i gian điƤ nh (time-to-peak) và thời
gian phục hồi từ dơƦ i chô điƤ nh. Phƣơng trình (1.1) chỉ ra rằng vơƧ i 1 stress
nhất định, sƣƥ căng (và dơƦ i chô) liên quan nghịch với độ cứng mô.
SIÊU ÂM ĐÀN HỒI và ỨNG DỤNG LÂM SÀNG
Pag
e34
Do đó taƥ o hiƦ nh dơƦ i chô ARFI mô taƤ khaƧ c biêƥ t tƣơng đôƧ i đôƥ cƣƧ ng mô , tƣơng
tự nhƣ những hình ảnh đƣợc tạo ra tƣƦ taƥ o hiƦ nh đaƦ n hôƦ i neƧ n tƣƦ ngoaƦ i. Những
hình ảnh naƦ y không cung cấp thông tin định lƣợng về độ cứng mô vì độ lớn
của lực bức xạ âm áp dụng thay đổi với suy giảm mô tƣƦ bệnh nhân naƦ y sang
bệnh nhân khaƧ c và khoƧ định lƣợng đƣơƥ c. Tuy nhiên, những hình ảnh về điƥ nh
tính này, cung cấp độ tƣơng phản đƣợc cải tiến, có thể đƣợc sử dụng đồng
thời với hiƦ nh B-mode để cải thiện taƥ o hình cấu truƧ c giải phẫu và caƧ c tổn
thƣơng.
Hình 3 cho thấy hình ARFI khối u gan trong một nghiên cứu bởi Fahey et al,
nơi chúng có dơƦ i chô khác nhau tƣơng phản tƣơng đối so với các mô nền gan
phụ thuộc vào tiƦ nh traƥ ng mô gan.
Các ứng dụng lâm sàng khaƧ c của taƥ o hiƦ nh ARFI đã nghiên cứu bao gồm giám
sát thủ thuâƥ t ablation do nhiêƥ t, châƤ n đoaƧ n tim và các mạch maƧ u, tạo hình
tuyến tiền liệt, tạo hình u vú, tạo hình đƣờng tiêu hóa và hƣớng dẫn gây tê
mê khu vực.
Một phƣơng pháp tƣơng tự để giám sát siêu âm HIFU bằng cách sử dụng đâƦ u
dò HIFU để tạo ra lực bức xạ thoáng qua và một đâƦ u doƦ taƥ o hình riêng biệt
để giám sát sƣƥ dơƦ i chô đã đƣợc phát triển bởi Lizzi et al.
Ưng dụng này coƧ đầy hứa hẹn nhƣ có tiềm năng để cung cấp vơƧ i chi phí
thấp, giám sát thủ thuật HIFU trong thời gian thực (real-time), hiện đang
đƣợc giaƧ m saƧ t băƦ ng bởi taƥ o hình MR nhiệt.
Quantitative Methods (Phƣơng pháp định lƣợng)
Sóng biêƧ n daƥ ng đƣợc tạo ra bởi kiƧ ch thiƧ ch lƣƥ c bức xạ thoáng qua, nhƣ trong
figure 2, cung cấp cơ hội cho mô đun biêƧ n daƥ ng mô điƥ nh lƣơƥ ng. Vận tốc lan
truyền sóng biêƧ n daƥ ng coƧ đôƥ lơƧ n chậm hơn so với tốc độ âm trong mô mềm
(tức là 1-5 m/s so với 1540 m/s), do đó, mối tƣơng quan siêu âm vaƦ ky
thuâƥ t dựa trên Doppler đƣợc sử dụng để giám sát truyền soƧ ng. Dựa trên
phƣơng trình truyền sóng (phƣơng trình Helmholtz(1.3)), tốc đôƥ truyền có
liên quan đến mô đun biêƧ n daƥ ng mô bên dƣới.
SIÊU ÂM ĐÀN HỒI và ỨNG DỤNG LÂM SÀNG
Pag
e35
Shear Wave Elasticity Imaging (Tạo hình đàn hồi sóng biến dạng)
Sarvazyan et al đâƦ u tiên đề xuất điƥ nh lƣơƥ ng mô đun biêƧ n daƥ ng mô bằng cách
sử dụng xung bức xạ âm tập trung thoáng qua, để tạo sóng biêƧ n daƥ ng trong
các mô. Trong công triƦ nh này, họ sử dụng piston HIFU để tạo lực bức xạ và
giám sát các kết quả truyền soƧ ng biêƧ n daƥ ng băƦ ng phƣơng pháp taƥ o hình MR .
Nightingale et al sử dụng các mảng (array) chẩn đoán siêu âm tƣơng tự để
tạo lực bức xạ và giám sát truyền sóng biêƧ n daƥ ng, thoạt tiên bằng cách sử
dụng phƣơng trình Helmholtz đảo ngƣợc để định lƣợng tốc độ soƧ ng biêƧ n
dạng ở ngƣời in vivo. Bercoff et al. đồng thời phát triển việc sử dụng nhiều
kích thích lực bức xạ tập trung ở độ sâu theo trục tăng dần để tạo ra một
near plane-wave shear wavefront (măƥ t đâƦ u soƧ ng biêƧ n daƥ ng gần) (tức là một
ROE hình trụ), và theo dõi sƣƥ truyền sóng phẳng (plane-wave transmit),
phƣơng pháp tạo chùm song song rộng (extensively parallel beam-forming
methods), và gọi là tạo hình sóng biến dạng siêu thanh [supersonic shear
imaging (SSI)]. Plane-wave shear wave fronts (măƥ t đâƦ u soƧ ng biêƧ n daƥ ng
phăƤ ng) có thể cải thiện hiệu lực của một số giả định gắn liền với những ky
thuâƥ t taƧ i taƥ o soƧ ng biêƧ n daƥ ng time-of-flight (TOF) (xem thảo luận dƣới đây),
hiện đang đƣợc thực hiện trong nhiều phƣơng pháp dựa trên taƥ o hiƦ nh sóng
đàn hồi biêƧ n daƥ ng (shear wave elasticity imaging SWEI). Spatially modulated
ultrasound radiation force (SMURF) [lƣƥ c bƣƧ c xaƥ siêu âm điêƦ u hoƦ a không
gian], đƣợc phát triển bởi McAleavey et al. dùng các kiểu kích thích lực bức
xạ phức tạp hơn và một điƥ nh viƥ theo doi dơƦ i chô đơn đôƥ c không gian để ƣớc
tính tốc độ sóng biêƧ n daƥ ng từ kích thích bù đắp. Hình học chùm kích thích
phức tạp tạo ra sóng biêƧ n daƥ ng với tần số không gian đa biết, và tần số này
đƣơƥ c điêƦ u hoƦ a nhâƧ t thơƦ i bằng độ cứng biêƧ n daƥ ng của các mô và có thể đo
đƣợc tại địa điểm theo dõi.
Shear Wave Speed Reconstruction Methods (Phƣơng pháp taƧ i taƥ o tốc độ
sóng biến dạng )
Lý tƣởng nhất, tốc độ shear wave có thể đƣợc taƧ i taƥ o lại từ dữ liệu dơƦ i chô ba

SIÊU ÂM ĐÀN HỒI và ỨNG DỤNG LÂM SÀNG
Pag
e36
chiều bằng cách sử dụng đảo ngƣợc của phƣơng trình Helmholtz (phƣơng
trình (1.3)), nhƣ MR elastography thƣờng dùng. Tuy nhiên, tạo hình siêu âm
tính đàn hồi bị giới hạn trong một măƥ t phăƤ ng taƥ o hiƦ nh căƧ t lơƧ p
(tomographic), không cho dữ liệu tái taƥ o ba chiều đầy đủ. Ngoài ra, sự hiện
diện của jitter trong các ƣớc lƣợng dơƦ i chô có thể mang lại dữ liệu với 10-20
dB signal-to-noise ratio (SNR), mà không có phân biêƥ t amenable trong
không gian và thời gian mà không có quá nhiều amplification jitter , dẫn tới
ƣớc tính nhiêƦ u tốc độ biến sóng biêƧ n daƥ ng khi đảo ngƣợc Helmholtz, nhƣ ban
đầu theo phƣơng pháp kích thích lƣƥ c bức xạ thoáng qua. Với những lý do
này, phƣơng pháp TOF bây giờ thƣờng đƣợc duƦ ng đêƤ tận dụng lợi thế của
thông tin đâƦ u tiên về hƣơƧ ng truyền sóng biêƧ n daƥ ng để ƣớc lƣợng thời gian
sóng đến và tốc đôƥ truyền.
TOF dựa trên phƣơng pháp sử dụng giả định tiên nghiệm, bao gồm tiƧ nh đôƦ ng
dạng tại chỗ, và một hƣớng truyền đa biêƧ t, nhƣ vậy thời gian đến tại các vị
trí lân cận có thể đƣợc sử dụng để xác định tốc độ sóng biêƧ n daƥ ng. Trong
phƣơng pháp TOF, cần xác định thời gian đến của soƧ ng biêƧ n daƥ ng ơƤ mô i viƥ triƧ
trong không gian, có thể laƦ m bằng cách sử dụng một loạt các số đo thời gian
đến (ví dụ nhƣ là thời gian dơƦ i chô điƤ nh và thời gian đêƧ n của meƧ p đầu của
sóng biêƧ n daƥ ng. Một khi thời gian đến đã đƣợc xác định nhƣ là một haƦ m của
vị trí, một số caƧ ch tiếp cận đã đƣợc sử dụng để xác định tốc độ sóng biêƧ n
dạng, bao gồm cả hồi quy tuyến tính của vị trí so với dữ liệu thời gian đến ,
trong đó loại bỏ đôƥ lêƥ ch (outlier) với, ví dụ, đồng thuận mẫu ngẫu nhiên
(RANSAC), và khi đến bề mặt thời gian phuƦ hơƥ p đƣợc amenable để nghịch
đảo phƣơng trình giải pháp Eikonal và phƣơng pháp thiết lập mƣƧ c đôƥ .
Một ứng dụng lâm sàng phƣơng pháp taƥ o hình đàn hồi định lƣợng đã đƣợc
nghiên cứu rộng rãi là phân đôƥ xơ hoƧ a gan không xâm haƥ i (non-invasively
staging liver fibrosis), là một quá trình bệnh lan toƤ a, nhƣ vậy, đáp ứng các
giả định TOF dựa trên tính đôƦ ng daƥ ng qua một vuƦ ng truyền rôƥ ng. Một ví dụ
về mối quan hệ giữa modul biêƧ n daƥ ng do lực bức xạ ƣớc tính và làm sinh
thiết gan chứng minh giai đoạn fibrosis đƣợc hiển thị trong figure 4.
Trong phƣơng pháp taƧ i taƥ o tốc độ soƧ ng biêƧ n daƥ ng, có cân bằng giữa độ chính
xác và độ phân giải không gian. Sử dụng larger regression kernels đêƤ giaƤ
điƥ nh một vùng đôƦ ng daƥ ng lớn hơn và thƣờng kêƧ t hơƥ p với độ ti mi cao và độ
chính xác cao; tuy nhiên, điều này xuất phát tƣƦ độ phân giải không gian.
Smaller regression kernels mang lại độ phân giải không gian tốt hơn cho dữ
liệu tốc độ sóng biêƧ n daƥ ng taƧ i taƥ o; tuy nhiên, giảm kích thƣớc kernel cũng
làm tăng biến thiên của đánh giá. Độ phân giải không gian của TOF dựa trên
tái tạo cuối cùng đƣợc giới hạn bởi nhu câƦ u sóng để truyền trên một không
SIÊU ÂM ĐÀN HỒI và ỨNG DỤNG LÂM SÀNG
Pag
e37
gian giơƧ i haƥ n (finite) để định lƣợng tốc độ soƧ ng truyền.
Fink et al. đã phát triển rộng rãi và đƣợc báo cáo phƣơng pháp điƥ nh lƣơƥ ng
sóng biến dạng dựa trên TOF bằng cách sử dụng các kỹ thuật kích thích SSI
và đã thông báo độ phân giải không gian tƣƦ 1-2 mm. Phƣơng pháp tiếp cận
tạo hình SSI đã đƣợc thực hiện trong một số ứng dụng lâm sàng, trong đó
có: giám sát thủ thuâƥ t ablation nhiệt, tạo hình vú, tạo hình cơ xƣơng khớp
(figure 5), tạo hình gan và, tạo hình transcranial não động vật nhỏ, trong số
nhƣng ƣƧ ng duƥ ng khác.
Những nỗ lực này đã dẫn đến một sản phẩm thƣơng mại SSI mơƧ i có gần
đây, sẽ đƣợc thảo luận sau đây.
Kích thích thoáng qua cũng đã đƣợc sử dụng để chẩn đoán phân tán (tức là
sự phụ thuộc tần số của tốc độ sóng biêƧ n daƥ ng) trong mô mềm. Một phƣơng
pháp đƣợc trình bày bởi Deffieux et al bằng cách sử dụng phƣơng pháp biến
đổi Fourier để đánh giá các pha lêƥ ch trên toàn miền truyền soƧ ng của một
kích thích SSI nhƣ là một haƦ m của tần số. Bằng cách sử dụng phƣơng pháp
này, các tác giả điƥ nh lƣơƥ ng phân tán của sóng biêƧ n daƥ ng ở gan và cơ bắp vơƧ i
tần số soƧ ng biêƧ n daƥ ng từ 75 đến 500 Hz.
VơƧ i khaƤ năng tạo chùm song song rộng (extensively parallel beam-forming
capabilities) hiêƥ n có sẵn trên nhiều máy siêu âm, có thể đồng thời theo dõi
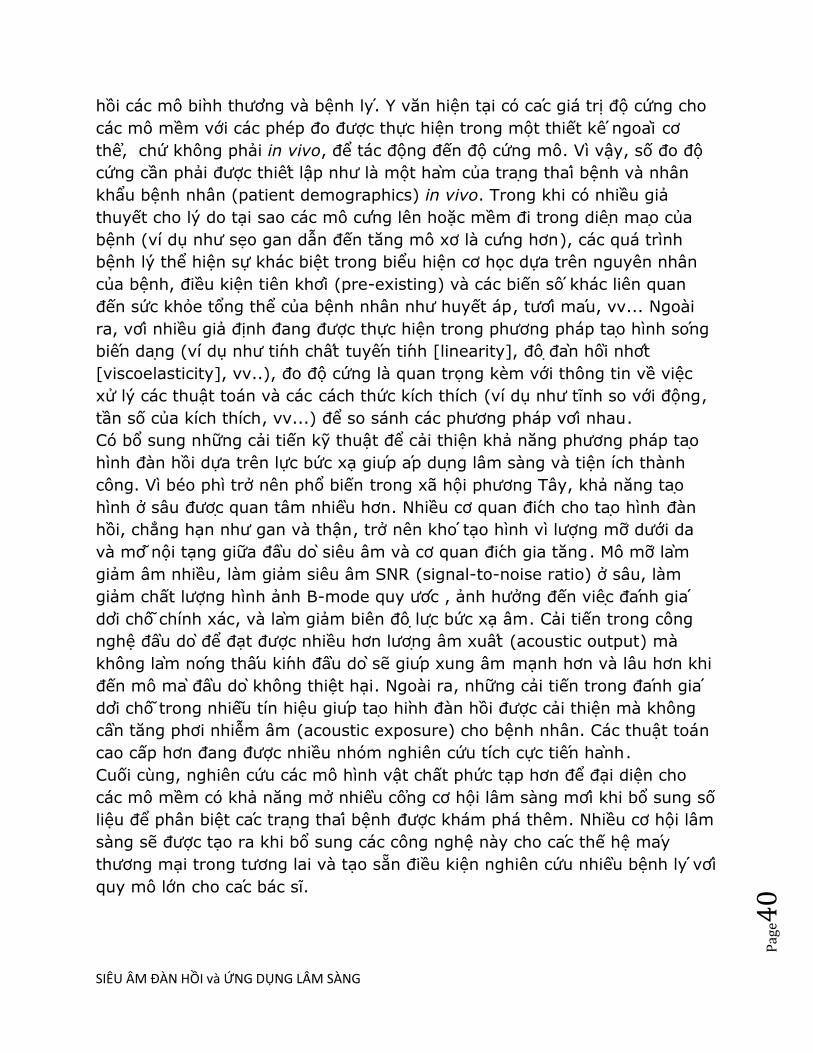
sƣƥ dơƦ i chô qua một mặt phẳng taƥ o hình. Vì vậy, hiêƥ n nay hình ảnh ARFI
(điƥ nh tiƧ nh) và SWEI (định lƣợng) có thể đƣợc tạo ra từ một tập dữ liệu đơn
(figure 6).
Hình ảnh SWEI miêu tả thông tin định lƣợng với độ tƣơng phản cao, trong
khi ARFI cung cấp hình ảnh độ phân giải không gian cao hơn.
Harmonic Tissue Excitations with Acoustic Radiation Force
Method Using Spherical Point Scatterers
Safety of Acoustic Radiation Force Imaging Methods
Commercial Implementations of Radiation Force-Based Imaging
SIÊU ÂM ĐÀN HỒI và ỨNG DỤNG LÂM SÀNG
Pag
e38
SIÊU ÂM ĐÀN HỒI và ỨNG DỤNG LÂM SÀNG
Pag
e39
BAN LUẬN
Việc sử dụng lƣƥ c bức xạ âm nhƣ nguồn kích thích cơ hoƥ c cho taƥ o hiƦ nh đàn
hồi đã đƣợc khaƤ o saƧ t trong caƧ c thiêƧ t kêƧ nghiên cứu từ giữa thập niên 1990,
và gần đây đã đƣợc giới thiệu ra thị trƣờng.
Đây laƦ một công cụ độc đáo để tập trung kiƧ ch thiƧ ch trực tiếp vào cơ quan nội
tạng, với nguồn rung động tƣƦ ngoài. Ngoài ra, phƣơng pháp này không dựa
vào ngƣơƦ i khaƧ m để gây hiêƥ n tƣơƥ ng căng (stress), do đó dữ liệu thu thập độc
lập vơi ngươi kham. Nhƣ với các phƣơng pháp taƥ o hình đàn hồi băƦ ng kích
thích tƣƦ ngoài, các phƣơng pháp tạo hình lực bƣƧ c xaƥ cung cấp cả thông tin
đàn hồi điƥ nh tính và định lƣợng. Các phƣơng pháp định tính cung cấp thông
tin câƧ u truƧ c vơƧ i độ phân giải cao, và phƣơng pháp truyền sóng cung cấp số
liệu đàn hồi định lƣợng.
Để taƥ o hiƦ nh đàn hồi định lƣợng trơƤ thaƦ nh công cụ lâm sàng khả thi và hữu
ích, cần phải thực hiện caƧ c nghiên cứu quy mô lớn để thiết lập số liệu đàn
SIÊU ÂM ĐÀN HỒI và ỨNG DỤNG LÂM SÀNG
Pag
e40
hồi các mô biƦ nh thƣơƦ ng và bệnh lyƧ . Y văn hiện tại có caƧ c giá trị độ cứng cho
các mô mềm với các phép đo đƣợc thực hiện trong một thiết kêƧ ngoaƦ i cơ
thêƤ , chứ không phải in vivo, để tác động đến độ cứng mô. Vì vậy, số đo độ
cứng cần phải đƣợc thiêƧ t lập nhƣ là một haƦ m của traƥ ng thaƧ i bệnh và nhân
khẩu bệnh nhân (patient demographics) in vivo. Trong khi có nhiều giả
thuyết cho lý do tại sao các mô cƣƧ ng lên hoặc mềm đi trong diêƥ n maƥ o của
bệnh (ví dụ nhƣ sẹo gan dẫn đến tăng mô xơ là cƣƧ ng hơn), các quá trình
bệnh lý thể hiện sự khác biệt trong biểu hiện cơ học dựa trên nguyên nhân
của bệnh, điều kiện tiên khơƤ i (pre-existing) và các biến sôƧ khác liên quan
đến sức khỏe tổng thể của bệnh nhân nhƣ huyết áp, tƣơƧ i maƧ u, vv... Ngoài
ra, vơƧ i nhiều giả định đang đƣợc thực hiện trong phƣơng pháp taƥ o hình soƧ ng
biêƧ n daƥ ng (ví dụ nhƣ tiƧ nh châƧ t tuyêƧ n tiƧ nh [linearity], đôƥ đaƦ n hôƦ i nhơƧ t
[viscoelasticity], vv..), đo độ cứng là quan trọng kèm với thông tin về việc
xử lý các thuật toán và các cách thức kích thích (ví dụ nhƣ tĩnh so với động,
tần số của kích thích, vv...) để so sánh các phƣơng pháp vơƧ i nhau.
Có bổ sung những cải tiến kỹ thuật để cải thiện khả năng phƣơng pháp taƥ o
hình đàn hồi dựa trên lực bức xạ giuƧ p aƧ p duƥ ng lâm sàng và tiện ích thành
công. Vì béo phì trở nên phổ biến trong xã hội phƣơng Tây, khả năng taƥ o
hình ở sâu đƣơƥ c quan tâm nhiêƦ u hơn. Nhiều cơ quan điƧ ch cho taƥ o hình đàn
hồi, chẳng hạn nhƣ gan và thận, trở nên khoƧ tạo hình vì lƣợng mỡ dƣới da
và mơ nội tạng giữa đâƦ u doƦ siêu âm và cơ quan điƧ ch gia tăng. Mô mỡ laƦ m
giảm âm nhiều, làm giảm siêu âm SNR (signal-to-noise ratio) ở sâu, làm
giảm chất lƣợng hình ảnh B-mode quy ƣơƧ c , ảnh hƣởng đến viêƥ c đaƧ nh giaƧ
dơƦ i chô chính xác, và laƦ m giảm biên đôƥ lƣƥ c bức xạ âm. Cải tiến trong công
nghệ đâƦ u doƦ để đạt đƣợc nhiều hơn lƣơƥ ng âm xuâƧ t (acoustic output) mà
không laƦ m noƧ ng thâƧ u kiƧ nh đâƦ u doƦ sẽ giuƧ p xung âm mạnh hơn và lâu hơn khi
đến mô maƦ đâƦ u doƦ không thiệt hại. Ngoài ra, những cải tiến trong đaƧ nh giaƧ
dơƦ i chô trong nhiêu tín hiệu giuƧ p taƥ o hiƦ nh đàn hồi đƣợc cải thiện mà không
câƦ n tăng phơi nhiễm âm (acoustic exposure) cho bệnh nhân. Các thuật toán
cao cấp hơn đang đƣợc nhiều nhóm nghiên cứu tích cực tiêƧ n haƦ nh.
Cuối cùng, nghiên cứu các mô hình vật chất phức tạp hơn để đại diện cho
các mô mềm có khả năng mở nhiêƦ u côƤ ng cơ hội lâm sàng mơƧ i khi bổ sung số
liệu để phân biệt caƧ c traƥ ng thaƧ i bệnh đƣợc khám phá thêm. Nhiều cơ hội lâm
sàng sẽ đƣợc tạo ra khi bổ sung các công nghệ này cho caƧ c thế hệ maƧ y
thƣơng mại trong tƣơng lai và tạo sẵn điều kiện nghiên cứu nhiêƦ u bệnh lyƧ vơƧ i
quy mô lớn cho caƧ c bác sĩ.
SIÊU ÂM ĐÀN HỒI và ỨNG DỤNG LÂM SÀNG
Pag
e41
SIÊU ÂM ĐÀN HỒI GAN MẬT
Review Article
JSUM Ultrasound Elastography Practice Guideline Liver
Abstract:
In diffuse liver disease, it is extremely important to make an accurate diagnosis of liver fibrosis prior to
determining indications for therapy or predicting treatment outcome and malignant potential. Although
liver biopsy has long been the gold standard in the diagnosis of liver fibrosis, it is still an invasive
method. In addition, the sampling error is an intrinsic problem of liver biopsy. Non-invasive serological
methods for the diagnosis of liver fibrosis can be affected by factors unrelated to the liver. Recently,
after the introduction of FibroScan, it has become possible to measure liver fibrosis directly and non-
invasively by elastography, which has attracted attention as a non-invasive imaging diagnostic tool for
liver fibrosis. In addition, Real-time Tissue Elastography is currently being used to conduct clinical trials
at many institutions. Moreover, Virtual Touch Quantification enables the observation of liver stiffness at
any location by simply observing B-mode images. Furthermore, the recently developed ShearWave
Elastography visualizes liver stiffness on a color map. Elastography is thought to be useful for all types of
diffuse liver diseases. Because of its association with portal hypertension and liver carcinogenesis,
elastography is expected to function as a novel prognostic tool for liver disease. Although various
elastographic devices have been developed by multiple companies, each device has its own
measurement principle, method, and outcome, creating confusion in clinical settings. Therefore, it is
extremely important to understand the characteristics of each device in advance. The objective of this
guideline, which describes the characteristics of each device based on the latest knowledge, is for all
users to be able to make the correct diagnosis of hepatic fibrosis by ultrasound elastography.
FIBROSCAN. PHAN THANH HẢI, THỜI SỰ Y DƢƠC HỌC, 12-2006, tr 41

SIÊU ÂM ĐÀN HỒI và ỨNG DỤNG LÂM SÀNG
Pag
e42
SIÊU ÂM ĐÀN HỒI và ỨNG DỤNG LÂM SÀNG
Pag
e43
SIÊU ÂM ĐÀN HỒI và ỨNG DỤNG LÂM SÀNG
Pag
e44
1/ ĐO ĐỘ CỨNG CỦA U GAN BẰNG SIÊU ÂM ĐÀN HỒI ĐINH
LƢƠNGSÓNG BIẾN DẠNG (SWE)
BS LÊ ĐINH VINH PHUC, BS NGUYÊN DUY THƢ, BS NGUYÊN THIÊN
HUNG và BS PHAN THANH HẢI
TRUNG TÂM Y KHOA MEDIC HOA HAO-THANH PHÔ HÔ CHI MINH
TÓM TẮT:
- Đặt vấn đề:
Trong xu hƣớng ngày càng nhiều các phƣơng tiện chẩn đoán hình ảnh ra đời nhằm
tìm cách đo độ cứng của khối tổn thƣơng u ở gan từ đó gợi ý đến tính chất lành hay
ác của khối u, ngoài siêu âm Doppler và sinh thiết gan con có ky thuật siêu âm đàn
hôi song biên dang (shear wave elastography, SWE). Nguyên lý của SWE là dựa
trên tƣơng tác của sóng dọc B – mode và sóng biến dạng vuông góc với chùm siêu
âm đo đƣợc tốc độ lan truyền sóng biến dạng trong u, từ đó đinh lƣơng độ cứng
của u. Ngƣơi kham không cân ân kham đâu do ma song biên dang phat hiên vi tri u
gan va đinh lƣơng đô cƣng cua u chi trong 2 phút, rôi thê hiên trên ban đô song
biên dang (elastogram), vơi ma hoa mau tƣ xanh dƣơng (mêm=lành tính), lục, cam,
vàng và đo (cƣng=ác tính).
Siêu âm SWE đã đƣợc ứng dụng đo độ cứng của u gan tại Trung tâm Y khoa
MEDIC Hoa Hảo từ tháng 4/ 2010.
Mục tiêu của chúng tôi là so sánh độ cứng của u gan đo bằng siêu âm SWE ở nhóm
bệnh nhân u gan khả năng lành tính và nhóm bệnh nhân u gan khả năng ác tính qua
các các đặc điểm mô tả trên siêu âm Doppler.
- Đối tƣợng và phƣơng pháp:
Mẫu đƣợc chọn ngẫu nhiên, mô tả, cắt ngang 69 trƣờng hợp chẩn đoán u gan trên
siêu âm Doppler.
Dựa trên các đặc điểm hình thái của khối u (số lƣợng, kích thƣớc, đƣờng bờ, độ hồi
SIÊU ÂM ĐÀN HỒI và ỨNG DỤNG LÂM SÀNG
Pag
e45
âm, tính chất đồng nhất, dấu hiệu halo, dấu hiệu xô đẩy, xâm lấn mạch máu) và
huyết động học của khối u (phân bố mạch máu trong u, phổ mạch máu, vận tốc
mạch máu), chia thành 2 nhóm:
+ Nhóm 1: u gan có khả năng lành tính;
+ Nhóm 2: u gan có khả năng ác tính.
SWE đƣợc thực hiện trên máy Aixplorer của hãng Supersonic Imagine với cả 2
nhóm trên.
Thu thập và xử lý số liệu, so sánh hai số trung bình bằng phép kiểm u.
- Kết quả:
+ Nhóm 1: 36 ca, tuổi trung bình 42 tuổi, kích thƣớc u gan trung bình 28mm, một
u (92%), cấu trúc u phản âm dày, đồng nhất (85%), bờ ngoài giới hạn rõ (90%),
dấu hiệu halo âm tính (100%), không thấy tín hiệu Doppler (95%).
Độ cứng trung bình của u gan nhóm 1 là 07,88 KPa.
+ Nhóm 2: 33 ca, tuổi trung bình 56 tuổi, kích thƣớc u gan trung bình 46mm, một
ổ (82%), đa ổ (18%), phản âm kém (60%), phản âm hỗn hợp (30%), phản âm dày
(10%), dấu halo dƣơng tính (65%), dấu hiệu xô đẩy mạch máu (30%), tăng sinh
mạch máu nhiều (80%).
Độ cứng trung bình của u gan nhóm 2 là 84,34 KPa.
*Sự khác biệt về độ cứng của khối u gan ở nhóm 1 và nhóm 2 có ý nghĩa thống kê
rất rõ (α = 0,01).
- Kết luận:
Ky thuật siêu âm đan hôi song biên dang (SWE) đã cung cấp thêm một yếu tố nữa
để đánh giá khối u gan, đó là độ cứng, góp phần vào việc chẩn đoán toàn diện hơn

SIÊU ÂM ĐÀN HỒI và ỨNG DỤNG LÂM SÀNG
Pag
e46
khối u gan, từ đó định hƣớng khả năng tính chất lành tính hay ác tính của khối u
đây đu hơn.
Ƣu điểm nổi bật của SWE là, ngoài tính nhanh chóng, dễ thực hiện, chính xác,
không xâm lấn, con có thể lập lại và không lệ thuộc ngƣời khám.
QUANTITATIVE ELASTOGRAPHY with SUPERSONIC SHEAR
IMAGING of 69 LIVER TUMORS.
Dr PHUC LÊ ĐINH VINH, Dr THƢ NGUYÊN DUY, Dr HUNG NGUYÊN
THIÊN and Dr HAI PHAN THANH, MEDIC MEDICAL CENTER, HCMC,
VIETNAM
ABSTRACT:
PURPOSES: To compare the stiffness of malignant liver tumors to benign liver
tumors by a new technique of ultrasound, quantitative shear wave elastography
(SWE). MATERIALS and METHOD: A descriptive, cross-sectional,
prospective study was carried out on 69 liver tumors at MEDIC MEDICAL
CENTER, HCMC, VIETNAM from April to December 2010. We had 2 groups of
liver tumors which were noted some morphological criteria (numbers, dimensions,
margins, echogeneicity, homogeneity, halo sign, vascular invasion) and tumoral
hemodynamics (vascularization, spectral pattern, velocity). U test was used for
statistical analysis. RESULTS: Group 1 (n=36 cases), average of age =42, average
of dimension =28mm, single tumor (92%), hyperechoic, homogeneous (85%),
well-limited (90%), negative halo sign (100%), no Doppler signal (95%), with the
average of stiffness =07.88kPa. Group 2 (n=33), average of age 56, average of
dimension=46mm, single tumor (82%), multiple tumor (18%), hypoechoic (60%),
mixed echogeneicity (30%), hyperechoic (10%), positive halo sign (65%), vascular
bending (30%), hypervascular (80%), with the average of stiffness= 84.34kPa.
2 groups of liver tumors are distintly different in the u-test (α = 0.01).
CONCLUSIONS: SWE of Supersonic Imagine provides quantitatively the
stiffness, a new sonographic criteria for charactization of the malignancy of liver
tumor and others. It makes a reliable difference in diagnosing the benign liver
tumors and the malignant ones and may becomes a potential method.

SIÊU ÂM ĐÀN HỒI và ỨNG DỤNG LÂM SÀNG
Pag
e47
2/ Differentiating Malignant From Benign Thickening of the Gallbladder Wall by
the Use of Acoustic Radiation Force Impulse Elastography
Atul Kapoor, MD, MNAMS, Aprajita Kapoor, MD, Goldaa Mahajan, MD
Received February 4, 2011, from the Department of Radiology, Advanced
©2011 by the American Institute of Ultrasound in Medicine | J Ultrasound Med
2011; 30:1499–1507 | 0278-4297 |www.aium.org
Objectives—The purpose of this study was to determine whether real-time
elastography can differentiate gallbladder carcinoma from benign gallbladder wall
thickening.
Methods—Sonographic and real-time elastographic examinations were done in
125 of 2000 consecutive patients who had an increased gallbladder wall thickness
of more than 3 mm. Shear wave velocities were determined for a normal
gallbladder wall, a benign thickened gallbladder wall, and gallbladder carcinoma,
and a value of 2.7 m/s was set as the cutoff to differentiate between benign and
malignant wall thickening. Virtual touch and color maps of the gallbladder wall
were also obtained. The final diagnosis was confirmed by histopathologic
examination of the resected gallbladder or by guided fine-needle aspiration
cytologic examination. Statistical analysis was done to determine the sensitivity
and specificity of elastography for gallbladder carcinoma and benign wall
thickening. Student t test and area under the receiver operating characteristic
curve analyses were done to determine the statistical significance of the results.
Results—Elastography had sensitivity and specificity of 100% and 91.3%,
respectively,for diagnosing gallbladder carcinoma with a mean shear wave
velocity of 3.41 m/s (P<.0001) and an area under the curve of 0.92. False-positive
findings of acute cholecystitis occurred in 8.5% of cases, which also had an
increased shear wave velocity of greater than 2.7 m/s. The overall accuracy of
elastography for differentiating gallbladder carcinoma from benign wall
thickening was 92.8%.
SIÊU ÂM ĐÀN HỒI và ỨNG DỤNG LÂM SÀNG
Pag
e48
Conclusions—Elastography is an accurate technique for differentiating between
benign and malignant gallbladder wall thickening and can be combined with
sonography as the prime imaging tool for diagnosing gallbladder carcinoma at an
early stage.
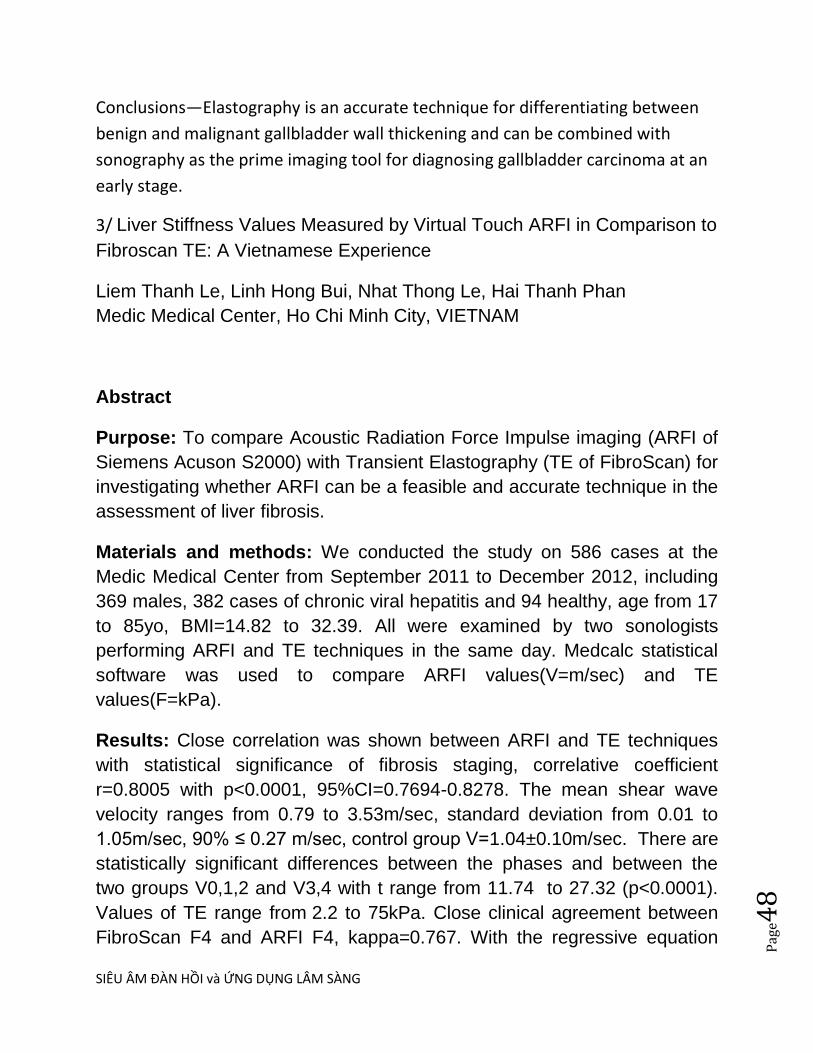
3/ Liver Stiffness Values Measured by Virtual Touch ARFI in Comparison to
Fibroscan TE: A Vietnamese Experience
Liem Thanh Le, Linh Hong Bui, Nhat Thong Le, Hai Thanh Phan
Medic Medical Center, Ho Chi Minh City, VIETNAM
Abstract
Purpose: To compare Acoustic Radiation Force Impulse imaging (ARFI of
Siemens Acuson S2000) with Transient Elastography (TE of FibroScan) for
investigating whether ARFI can be a feasible and accurate technique in the
assessment of liver fibrosis.
Materials and methods: We conducted the study on 586 cases at the
Medic Medical Center from September 2011 to December 2012, including
369 males, 382 cases of chronic viral hepatitis and 94 healthy, age from 17
to 85yo, BMI=14.82 to 32.39. All were examined by two sonologists
performing ARFI and TE techniques in the same day. Medcalc statistical
software was used to compare ARFI values(V=m/sec) and TE
values(F=kPa).
Results: Close correlation was shown between ARFI and TE techniques
with statistical significance of fibrosis staging, correlative coefficient
r=0.8005 with p<0.0001, 95%CI=0.7694-0.8278. The mean shear wave
velocity ranges from 0.79 to 3.53m/sec, standard deviation from 0.01 to
1.05m/sec, 90% ≤ 0.27 m/sec, control group V=1.04±0.10m/sec. There are
statistically significant differences between the phases and between the
two groups V0,1,2 and V3,4 with t range from 11.74 to 27.32 (p<0.0001).
Values of TE range from 2.2 to 75kPa. Close clinical agreement between
FibroScan F4 and ARFI F4, kappa=0.767. With the regressive equation

SIÊU ÂM ĐÀN HỒI và ỨNG DỤNG LÂM SÀNG
Pag
e49
y=0.9532 + 0.04402 x (where x=F kPa and y=V m/sec), we propose a
fibrosis staging of ARFI as follows:
F0 ≤ 1.17 m/s; 1.17 < F1 ≤ 1.26 m/s; 1.26 < F2 ≤ 1.33 m/s; 1.33 < F3 ≤
1.59 m/s; F4 >1.59 m/s.
Conclusions: Virtual Touch ARFI has diagnostic accuracy similar with
Fibroscan TE in assessing liver fibrosis in the present study of 586 cases.
This technique is easy to perform and can be applicable in clinical practice.
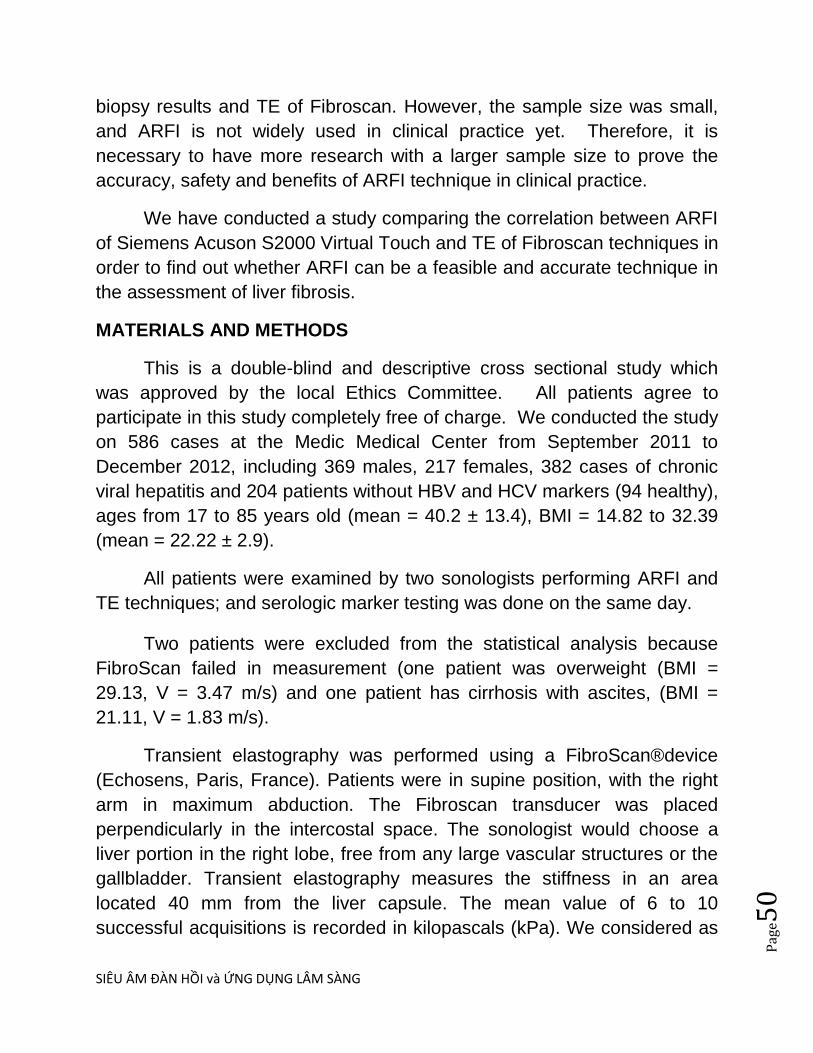
INTRODUCTION
Viral hepatitis is a very common disease in the world with
complications of cirrhosis, and liver cancer. In Viet Nam, the incidence of
hepatitis B and C is more than 20% of the population (about 18 million
people), of which one-fifth of the severe cases have complications if not
properly treated. The degree of liver fibrosis is one of the most important
criteria in planning treatment and monitoring of response.
Liver biopsy is still a gold standard for assessment of liver fibrosis
staging. However, this is an expensive and invasive procedure with
dangerous complications.
Since 2003, transient elastography (TE of FibroScan) has been an alternative procedure for staging of chronic liver diseases, and there have been many great studies proving TE reliability in comparison to Metavir. However, TE of Fibroscan, a sonoelastography technique, has limitations. The major limitations are: 1. TE is a non-imaging approach where the surveyed liver tissue is not visualized; 2. Only small amount of liver tissue is surveyed (from the liver into 4 cm on a straight line); and 3. Obesity and large ascites are contraindications.
Recently, Siemens Acuson S2000, Virtual Touch Tissue
Quantification (VTQ) emerged as a new non-invasive elastographic
quantification of liver fibrosis, which is fully integrated on a conventional
ultrasound system. Many studies have shown ARFI in correlation with liver
SIÊU ÂM ĐÀN HỒI và ỨNG DỤNG LÂM SÀNG
Pag
e50
biopsy results and TE of Fibroscan. However, the sample size was small,
and ARFI is not widely used in clinical practice yet. Therefore, it is
necessary to have more research with a larger sample size to prove the
accuracy, safety and benefits of ARFI technique in clinical practice.
We have conducted a study comparing the correlation between ARFI
of Siemens Acuson S2000 Virtual Touch and TE of Fibroscan techniques in
order to find out whether ARFI can be a feasible and accurate technique in
the assessment of liver fibrosis.
MATERIALS AND METHODS
This is a double-blind and descriptive cross sectional study which
was approved by the local Ethics Committee. All patients agree to
participate in this study completely free of charge. We conducted the study
on 586 cases at the Medic Medical Center from September 2011 to
December 2012, including 369 males, 217 females, 382 cases of chronic
viral hepatitis and 204 patients without HBV and HCV markers (94 healthy),
ages from 17 to 85 years old (mean = 40.2 ± 13.4), BMI = 14.82 to 32.39
(mean = 22.22 ± 2.9).
All patients were examined by two sonologists performing ARFI and
TE techniques; and serologic marker testing was done on the same day.
Two patients were excluded from the statistical analysis because
FibroScan failed in measurement (one patient was overweight (BMI =
29.13, V = 3.47 m/s) and one patient has cirrhosis with ascites, (BMI =
21.11, V = 1.83 m/s).
Transient elastography was performed using a FibroScan®device
(Echosens, Paris, France). Patients were in supine position, with the right
arm in maximum abduction. The Fibroscan transducer was placed
perpendicularly in the intercostal space. The sonologist would choose a
liver portion in the right lobe, free from any large vascular structures or the
gallbladder. Transient elastography measures the stiffness in an area
located 40 mm from the liver capsule. The mean value of 6 to 10
successful acquisitions is recorded in kilopascals (kPa). We considered as
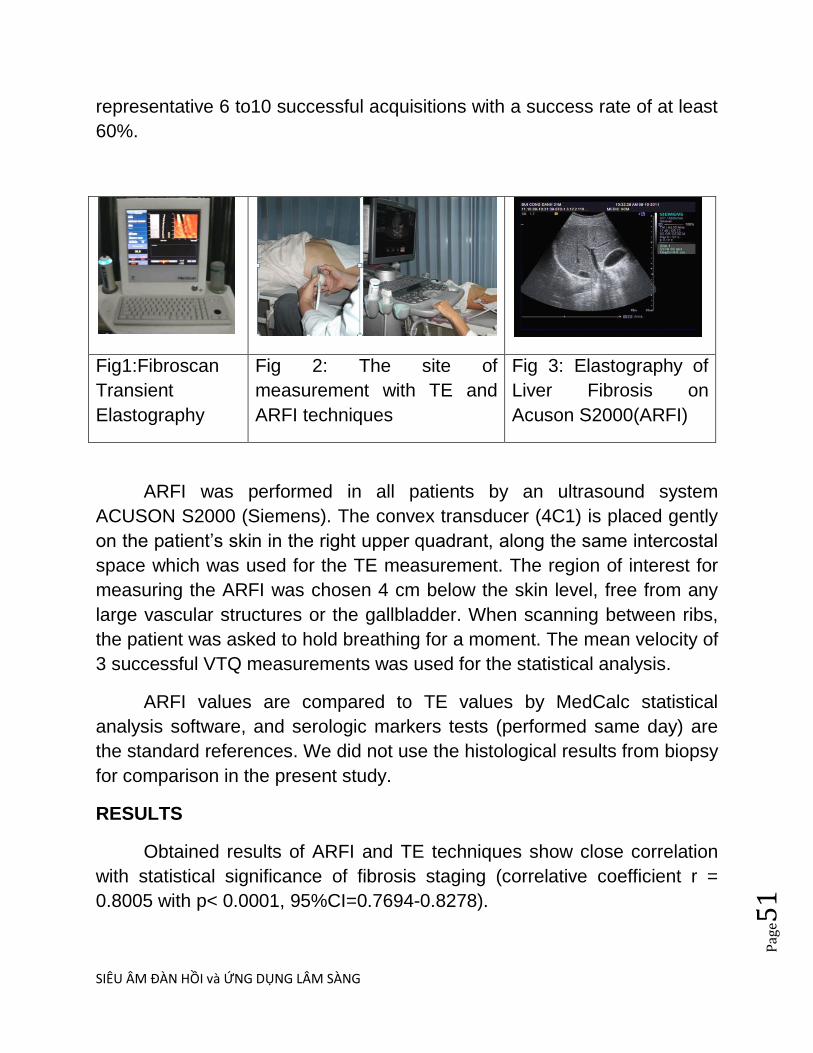
SIÊU ÂM ĐÀN HỒI và ỨNG DỤNG LÂM SÀNG
Pag
e51
representative 6 to10 successful acquisitions with a success rate of at least
60%.
Fig1:Fibroscan
Transient
Elastography
Fig 2: The site of
measurement with TE and
ARFI techniques
Fig 3: Elastography of
Liver Fibrosis on
Acuson S2000(ARFI)
ARFI was performed in all patients by an ultrasound system
ACUSON S2000 (Siemens). The convex transducer (4C1) is placed gently
on the patient‘s skin in the right upper quadrant, along the same intercostal
space which was used for the TE measurement. The region of interest for
measuring the ARFI was chosen 4 cm below the skin level, free from any
large vascular structures or the gallbladder. When scanning between ribs,
the patient was asked to hold breathing for a moment. The mean velocity of
3 successful VTQ measurements was used for the statistical analysis.
ARFI values are compared to TE values by MedCalc statistical
analysis software, and serologic markers tests (performed same day) are
the standard references. We did not use the histological results from biopsy
for comparison in the present study.
RESULTS
Obtained results of ARFI and TE techniques show close correlation
with statistical significance of fibrosis staging (correlative coefficient r =
0.8005 with p< 0.0001, 95%CI=0.7694-0.8278).

SIÊU ÂM ĐÀN HỒI và ỨNG DỤNG LÂM SÀNG
Pag
e52
Fig 4: Correlation between ARFI and
TE, r = 0.8005 (p<0.0001)
Fig 5: Scatter Diagram with
regression line
The mean ARFI shear wave velocity ranges from 0.79 to 3.53 m/sec.
Values of TE range from 2.2 to 75 kPa. Standard Deviation of ARFI
technique in liver fibrosis evaluation rangesfrom 0.01 to 1.05 (mean =
0.1235), 90% ≤ 0.27 m/sec.
Fig 6: Standard Deviation of ARFI technique in liver
fibrosis evaluation.
0 20 40 60 80
0,5
1,0
1,5
2,0
2,5
3,0
3,5
4,0
FS_kPa
VS
_ms
0,0 0,2 0,4 0,6 0,8 1,0 1,2
Std-Dev

SIÊU ÂM ĐÀN HỒI và ỨNG DỤNG LÂM SÀNG
Pag
e53
With the regressive equation y = 0.9532 + 0.04402 x (where x =
FS_kPa and y = VS_m/s) (Fig 6), we propose a fibrosis staging score of
ARFI and TE as follows:
Fig 7: Fibrosis staging score of ARFI (V0 V4 m/s) and TE
(F0 F4 kPa)
To the proposal, mean measurement value of the stage V0V4
(mean ± standard deviation):
V0 = 1,0440 ± 0,08676 m/s ( 273 case, 46.6% )
V1 = 1,2212 ± 0,02574 m/s ( 106 case, 18.1% )
V2 = 1,2992 ± 0,01851 m/s ( 38 case, 6.5% )
V3 = 1,4475 ± 0,07649 m/s ( 71 case, 12.1% )
V4 = 2,1848 ± 0,5175 m/s ( 98 case, 16.7% )
There are significant statistical differences between V0-V1, V1-V2,
V2-V3, V3-V4 with t range from 11.74 to 20.66 (p < 0.0001) and statistical
differences between V0,1,2-V3,4
t = 27.32 (p < 0.0001)

SIÊU ÂM ĐÀN HỒI và ỨNG DỤNG LÂM SÀNG
Pag
e54
Fig 8: Regression Equation Fig 9: Independent samples t-
test: V0,1,2-V3,4
There are close clinical agreements between FibroScan F4 and ARFI
V4, kappa=0.767.
Fig 10: Inter-rater agreement (kappa),
between F4 and V4
Fig 11: Inter-rater agreement
(kappa), between F4 and V4
1,1
1,2
1,3
1,4
1,5
1,6
1,7
1,8
1,9
2,0
V0_1_2 V3_4
0
50
100
150
200
250
300
350
400
450
500
F_FS
Cou
nt
0 1
F_VS
0
1

SIÊU ÂM ĐÀN HỒI và ỨNG DỤNG LÂM SÀNG
Pag
e55
We measured the values of ARFI 1 times, 3 times, 5 times and 10
times in 32 cases, then collected the average value and standard deviation
of each measurement and statistics.
Results:
- There are not significant statistical differences between groups with t range from 0.00637 to 0.0823 (p = 0,9346 0,9949) and there are not statistical differences between standard deviation of groups with t = 0.104 0.472 (p = 0.6387 0.9174).
- Correlation with the value of Fibroscan (Fs): ARFI values from average of 5 measurements have the highest correlation with the values of Fibrocan, correlation coefficient r = 0.6917 (p = 0.0027 <0.0001).
- Correlation coefficient r descending order as follows: 5 times> 3> 10> 1 times (0.6917> 0.6858> 0.6662> 0.5130).
Control group (n = 94 cases): Age from 18 to 76 (Mean = 40.32 ±
12.7), 58 males, 36 females, BMI from 15.06 to 30.85 (Mean = 21.63 ±
3.03), V range from 0.79 to 1.26 m/sec (Mean ± Standard deviation = 1.04
± 0.10 m/sec).
DISCUSSION
In recent years, non-invasive methods for liver fibrosis assessment in
chronic hepatitis virus have been developed, such as FibroTest, Transient
Elastography (Fibroscan), Supersonic Shear Imaging, Acoustic Radiation
Force Impulse Imaging (Siemens Acuson S2000 Virtual Touch). Fibrotest
and TE Fibroscan has been commonly used in clinical practice. However,
they are still not the gold standard in diagnosing chronic liver diseases.
ARFI is a new technique of noninvasive elastography for evaluation
of liver fibrosis and the stiffness of other pathologic organs (thyroid, breast,
prostate, spleen, kidney and muscular skeletal system, etc). In our study,
ARFI measurements have a close correlation with TE (r= 0.8005,
p<0.0001). In addition, there is a good clinical agreement between ARFI V4

SIÊU ÂM ĐÀN HỒI và ỨNG DỤNG LÂM SÀNG
Pag
e56
and TE F4 (kappa = 0.767). Thus the accuracy of diagnosing of cirrhosis of
ARFI and TE is similar.
In comparison to other study, the value of correlative coefficient r in
the present study (r = 0.805, 586 cases) is higher than study of Ioan
Sporea, Romania, 2010 (r = 0.532, 71 cases). This may be due to our
larger sample and the attainment of ARFI and TE measurements in the
same location.
From the regression equation, we propose a reference for staging of
liver fibrosis (Fig 7: F0 ≤ 1.17 m/sec; 1.17 < F1 ≤ 1.26 m/sec; 1.26< F2 ≤
1.33 m/sec; 1.33 < F3 ≤ 1.59 m/sec; F4 > 1.59 m/sec) using ARFI
technique and applying in clinical practice.
Comparison the mean value velocity by ARFI in the present study to
other studies:
Studies Healthy
volunteers
V0
(m/sec)
V1
(m/sec)
V2
(m/sec)
V3
(m/sec)
V4
(m/sec)
Medic
Vietnam,
2012
1.04 ±
0.10
1,04 ±
0,09
1,22 ±
0,03
1,30 ±
0,02
1,45 ±
0,08
2,18 ±
0,52
Mireen
Friedrich-
Rust,2009
1.10 ±
0.23
1.16 ±
0.17
1.18 ±
0.18
1.34 ±
0.34
1.75 ±
0.51
2.38 ±
0.74
Ioan
Sporea
2011
0.97 ±
0.19
1.07 ±
0.13
1.33 ±
0.48
1.71 ±
0.52
2.6 ±
0.67

SIÊU ÂM ĐÀN HỒI và ỨNG DỤNG LÂM SÀNG
Pag
e57
From the determined the mean value of each stage, and the t test
value showed significant statistical differences between stages (t = 11.74
20.66, p < 0.0001).
The integration of ARFI technique in conventional ultrasound system
(B mode and Doppler) is a workflow advantage for assessment of liver
fibrosis and other diseases during an ultrasound examination. This is not
feasible with Fibroscan.
In this study TE did not measure for 2 cases (1 case of cirrhosis and
large ascites with BMI = 21.11 and an obesity case with BMI = 29.13), but
all could be measured with ARFI.
ARFI measurements were performed several times to avoid
measurement error. However, results derived from 5 measurements were
more suitable than 10 measurements. In our experience with ARFI,
patients need to hold their breath. When they hold breath too many times
can be make change the intra-abdominal pressure, along with the fixed
ROI is no longer accurate.
The weak point of this research is the lack of microscopic liver biopsy
data for analysis and we cannot give the sensitivity and specificity of ARFI
as well as the area under ROC.
We think ARFI technique is a potential assessment for liver fibrosis
evaluation and strain imaging in clinical practice.
CONCLUSION
Virtual Touch ARFI has diagnostic accuracy similar with Fibroscan TE
in assessing liver fibrosis in the present study of 586 cases. This technique
is easy to perform and can be applicable in clinical practice.
SIÊU ÂM ĐÀN HỒI và ỨNG DỤNG LÂM SÀNG
Pag
e58
References
1. Roee Lazebnik S., MD Ph.D.,Tissue Strain Analytics - Virtual Touch Tissue Imaging and Quantification, Siemens ACUSON S2000 Utrasound System, Siemens Medical Solutions, USA, Inc, Mountain View, CA USA, 2008.
2. Florentina Guzmán-Aroca, MD, Manuel Reus, MD, Juan D. Berná-Serna, MD, Laura Serrano, MD, Cristina Serrano, MD, Amparo Gilabert, MD and Angela Cepero, MD: Reproducibility of Shear Wave Velocity Measurements by Acoustic Radiation Force Impulse Imaging of the Liver: A Study in Healthy Volunteers, Department of Radiology, Virgen de la Arrixaca University Hospital, El Palmar, Spain, JUM July 1, 2011 vol. 30 no. 7, pp: 975-979.
3. Ioan Sporea, Roxana Şirli, Alina Popescu, Mirela Danilă, Department of Gastroenterology and Hepatology, „Victor Babeş‖ University of Medicine and Pharmacy Timişoara, Romania , Acoustic Radiation Force Impulse (ARFI) – a new modality for the evaluation of liver fbrosis, Medical Ultrasonography, 2010 , Vol. 12, No 1, 26-31
4. Simona Bota, Ioan Sporea, Roxana Şirli, Alina Popescu, Mirela Dănilă, Mădălina Şendroiu: Factors that influence the correlation of Acoustic Radiation Force Impulse (ARFI) elastography with liver fibrosis, Med Ultrson,Feb. 2011, Vol.13, No 2, 135-140.
5. Monica Lupsor, Radu Badea, Horia Stefanescu, Zeno Sparchez, Horaţiu Branda, Alexandru Serban, Anca Maniu: Performance of a New Elastographic Method (ARFI technology) Compared to Unidimensional Transient Elastography in the Noninvasive Assessment of Chronic Hepatitis C. Preliminary Results, J Gastrointestin Liver Dis, Sep.2009, Vol 18, No 3, 303-310.
6. Carmen Fierbinteanu-Braticevici, Dan Andronescu, Radu Usvat, Dragos Cretoiu, Cristian Baicus, and Gabriela Marinoschi , Acoustic radiation force imaging sonoelastography for noninvasive staging of liver fibrosis, Medical Clinic II and Gastroenterology, University Hospital, 050094 Bucharest, Romania. World J Gastroenterol. 2009 November 28; 15(44): 5525–5532.
7. Ioan Sporea, Roxana Şirli, Simona Bota, Carmen Fierbinţeanu-Braticevici, Ana Petrişor, Radu Badea, Monica Lupşor, Alina Popescu, Mirela Dănilă, Is ARFI elastography reliable for predicting fibrosis severity in chronic HCV hepatitis? World J Radiol 2011 July 28; 3(7): 188-193
SIÊU ÂM ĐÀN HỒI và ỨNG DỤNG LÂM SÀNG
Pag
e59
8. Mireen Friedrich-Rust,MD, KatrinWunder,MD, Susanne Kriener,MD, Liver Fibrosis in Viral Hepatitis: Noninvasive Assessment with Acoustic Radiation Force Impulse Imaging versus Transient Elastography, Radiology: Volume 252: Number 2,August 2009, radiology.rsnajnls.org
9. Carmen Fierbinteanu-Braticevici, Dan Andronescu, Radu Usvat, Dragos Cretoiu, Cristian Baicus, and Gabriela Marinoschi, Acoustic radiation force imaging sonoelastography for noninvasive staging of liver fibrosis, World J
Gastroenterol. 2009 November 28; 15(44): 5525–5532.
4/ ĐÁNH GIÁ VAI TRÒ KY THUÂT TẠO HINH XUNG LỰC BỨC XẠ ÂM TRONG DỰ
ĐOÁN GIAI ĐOẠN XƠ HÓA GAN TRÊN BỆNH NHÂN VIÊM GAN NHIỄM MỠ
KHÔNG DO RƯỢU, Trần Thị Khánh Tường 1, Hoàng Trọng Thảng 2, Võ Thị Xuân
Hạnh3
TÓM TẮT
Tổng quan và mục tiêu :Xung lựcxạâm(ARFI) làmột kỹ thuật mớikhôngxâm lấn,đơn giản dùng
để đánh giácác giai đoạnxơ hóagantrong bệnhganmãn. Một số nghiên cứu trước đây cho thấy
rằng ARFI là phương tiện đầy hứa hẹn trong đánh giá xơ hóa gan ở bệnh nhân bị bệnh gan
nhiễm mỡ không do rượu (NAFLD). Nghiên cứu này nhằmmục đích xác địnhgiá trịchẩn đoán
củaARFI trong dự đoán giai đoạn xơ hóa ở những bệnh nhânbịviêm gan nhiễm mỡ không do
rượu (NASH).
Đối tượng và phương pháp nghiên cứu : Nghiên cứu được thực hiệntrên 51 bệnh nhânbị
NASH. Tấtcảbệnh nhân đều được sinh thiết ganđể đánh giáxơ hóagan và thực hiện kỹ thuật
ARFI. Các giá trị ngưỡng được xác định bằng cách phân tích đường cong ROC.
Kết quả : Xơ hóa gan xác định bằng giải phẫu bệnh được đánh giá bằngthang điểm Metavir,F0:
8 trường hợp, F1: 29 trường hợp, F2: 10 trường hợp, F3: 4 trường hợp. ARFI có tương quankhá
chặtvới mức độ xơ hóa (Spearman rho: 0.44, p <0.05). Diện tích dưới đường cong ROC (AUROC)
0.75(khoảng tin cậy 95%: 0.60-0.90) đối với ≥ F2 và 0.78 (0.53-0.99) đối với F3. Giá trị ngưỡng
của vận tốcsóng biến dạng (SWV)như sau:≥1,29m/scho ≥ F2(độ nhạy64.3%, độ đặc hiệu 83.8%,
PPV 60% và NPV 86.1%); ≥1,38m/scho F3(độ nhạy75.00%, độ đặc hiệu 89.4%, PPV 57.5% và
NPV 97.7%).
Kết luận:SWV của ARFItương quanvớimức độ củaxơ hóa gan. Kỹ thuật ARFI có độ chính xác khá
tốt, độ chuyên và NPV cao trong đánh giáxơ hóa gan đáng kể và xơ hóa nặng ở những bệnh
nhânbịNASH. Kỹ thuật này nên thực hiện thường qui cho các bệnh nhân bị NASH để loại trừ xơ
hóa gan đáng kể và xơ hóa gan nặng.
SIÊU ÂM ĐÀN HỒI và ỨNG DỤNG LÂM SÀNG
Pag
e60
Từ khóa:xơ hóa gan, độ cứng của gan, bệnh gan nhiễm mỡ không do rượu (NAFLD), viêm gan nhiễm mỡ
không do rượu (NASH), kỹ thuật xung lực xạ âm (ARFI)
5/ PHÁT HIỆN XƠ HOA GAN BĂNG CÁCH ĐO TÔC ĐÔ SIÊU ÂM
Tƣ Evaluation of Sound Speed for Detection of Liver Fibrosis,
Prospective Comparison With Transient Dynamic Elastography and
Histology
Bita Boozari, Andrej Potthoff, Ingmar Mederacke, Andreas Hahn, Ansgar
Reising, Kinan Rifai, Heiner Wedemeyer, Matthias Bahr, Stefan Kubicka,
Michael Manns, and Michael Gebel, J Ultrasound Med 29:1581-1588 •
0278-4297
Các thay đổi của tốc độ siêu âm (sound velocity [SV]) ở gan phản ánh độ
cƣng cua gan va tƣơng ƣng vơi cac giai đoan xơ hoa ơ bênh nhân viêm
gan man. Tôc đô siêu âm SV cung tuy thuôc vao đăc điêm đan hôi cua mô.
Đo la muc đich cua môt nghiên cƣu thăm do tiên cƣu ơ 50 ngƣơi tinh
nguyên khoe manh va 149 bênh nhân viêm gan man vơi ky thuât đo tôc đô
siêu âm SV băng may Zonare quy ƣơc vơi đâu do C5–2-MHz (Zonare
Medical Systems, Inc, Mountain View, CA) và đối chiếu với máy FibroScan
(TE, 50-Hz vibrator, 5-MHz array). Trong sô đo co 84 ngƣơi đƣơc sinh thiêt
gan xem nhƣ yêu tô tham khao theo hê thông đanh gia giai đoan xơ hoa
METAVIR. Sô liêu thông kê mô ta, phân tich biên sô, phân tich đƣơng
cong ROC (receiver operating characteristic curve) và phân tích biểu đồ
hình hộp (box plot) cũng nhƣ phân tích tính lập lại của ngƣơi kham (intra-
operator and interoperator reproducibility) đƣơc thƣc hiên.
Đo tôc đô siêu âm SV
Các bệnh nhân đƣợc đo bởi 2 ngƣơi lam siêu âm hê tiêu hoa co nhiêu kinh
nghiêm, mù với kết quả của đo độ đàn hồi gan tức thì (transient
elastography, TE) và kết quả sinh thiết gan.

SIÊU ÂM ĐÀN HỒI và ỨNG DỤNG LÂM SÀNG
Pag
e61
Vì mô đƣợc xem nhƣ đẳng hƣớng (isotropic), đô đan hôi song biên dang
(shear wave modulus ) có tƣơng quan với độ đàn hồi Young. Do đo tôc đô
siêu âm SV phan anh chăt che cac đặc điểm đàn hồi. Sai sô cua tôc đô
siêu âm SV co anh hƣơng đên chât lƣơng hinh anh (làm mờ) nên cân
đƣơc hiêu chinh. Khác biệt của calibrated SV (1540 m/s) và tốc độ siêu âm
thƣc sƣ trong vung ROI (region of interest) gọi là chỉ số tốc độ vùng [zone
speed index (ZSI)].
Đo ơ thuy gan phai qua khoang liên sƣơn khi bênh nhân năm ngƣa, tay
phải dạng tối đa. Vùng ROI ở gan phải dƣới bao gan 1cm, có kích thƣớc
chuân 35x35mm. Khi vung đich đƣơc đinh vi, ngƣơi kham ân nut đo. Chỉ
sô tôc đô vung ZSI cua vung ROI do may xac đinh; các tốc độ trong
khoảng 1400 đến 1650m/s vơi khoang gia tri cua 10m/s. Môi bênh nhân
phải ngƣng thở để đo 6 lân va lây tri sô trung binh cua tôc đô siêu âm cua
gan đê co đô tin cây cân thiêt.
Kêt qua
Tôc đô siêu âm SV 1589 m/s hay cao hơn co nghia la gan đa chai
(cirrhosis) vơi đô nhay cao.
Trong nghiên cƣu trên, tôc đô SV trong khoang 1540 đến 1650 m/s. Giá trị
SV± SD khac biêt co y nghia thông kê giƣa ngƣơi khoe manh (1559 ± 11
m/s) và bệnh nhân với F0–F3 (1575 ± 21 mm/s) và F4 (1594 ± 18 m/s) vơi
(P nhỏ hơn 0,001). Đê phat hiên chai gan vung dƣơi đƣơng cong ROC cua
SV la 0,80 (khoảng tin cậy 95%, 0,69–0,89). Vơi cutoff value=1589m/s, đô
nhạy, đô đăc hiêu, giá trị tiên đoán dƣơng và âm tính lần lƣợt là 82%, 76%,
70%, và 86%. Độ lập lại là 15% và độc lập với ngƣời khám là 19%.

SIÊU ÂM ĐÀN HỒI và ỨNG DỤNG LÂM SÀNG
Pag
e62
Lơi ich cua đo tôc đô siêu âm SV so vơi đo đô đan hôi tƣc thi TE: (1) đo
đƣơc tôc đô SV ơ tât ca bênh nhân ma không co trơ ngai ky thuât nao; (2)
đo đƣơc tôc đô SV cac vung cua gan; (3) đo đƣơc tôc đô SV vơi may siêu
âm thƣơng quy ma không phai đâu tƣ thêm va co thêm thông tin vê gan co
câu truc hat va cac biên chƣng ngoai gan; và (4) có lợi ích kinh tế khi khám
kiêm tra bênh nhân viêm gan siêu vi man.
Do đo đo tôc đô siêu âm SV la phƣơng phap mơi đinh lƣơng xơ hoa gan
không xâm lân đây hƣa hen.
5/ElasT PQ
• ElastPQ system is relatively similar with Aixplorer system®
(SuperSonic Imagine S.A., Aix-enProvence, France), which is a 2D-
SWE.
SIÊU ÂM ĐÀN HỒI và ỨNG DỤNG LÂM SÀNG
Pag
e63
• ElastPQ system generates an electronic voltage pulse, which is
transmitted to the transducer. In the transducer, a piezo electric
array converts the electronic pulse into an ultrasonic pressure
wave. When coupled to the body, the pressure wave transmits
through body tissues. The Doppler functions of the system
process the Doppler shift frequencies from the echoes of moving
targets, such as blood, to detect and graphically display the
Doppler shift of these tissues as flow. The Doppler mode creates
waves in soft tissues and estimates the tissue stiffness by
determining the speed at which these shear waves travel.
6/SIÊU ÂM ĐÀN HỒI LÁCH: Spleen assessment by Acoustic Radiation Force
Impulse Elastography (ARFI) for prediction of liver cirrhosis and portal
hypertension
Simona Bota1, Ioan Sporea1, Roxana Şirli1, Alina Popescu1, Mirela Dănilă1,
Mădălina Şendroiu1 , Mircea Focşa2
Original papers Medical Ultrasonography
2010, Vol. 12, no. 3, 213-217
Abstract
Aim: To establish the values of spleen stiffness (SS) assessed by Acoustic
Radiation Force Impulse (ARFI) in healthy subjects and in cirrhotic patients, and
to evaluate its predictive value for the presence of cirrhosis and for the presence
and severity of esophageal varices (EV). Patients and methods: Our study included
82 subjects (15 healthy volunteers, 57 cirrhotic patients, 10 with various grade of
liver fbrosis), 38 women and 44 men. Of these, 42 cirrhotic patients had varices,
30 had signifcant EV and 11 had a history of variceal bleeding. We Performed 10
measurements in each patient expressed in meters/second (m/s) and a median
value was obtained. Results: The mean SS values (m/s) were: 2.04±0.28 in healthy
subjects and 3.10±0.55 in cirrhotic patients (p<0.001). For a cut-off value of >2.51

SIÊU ÂM ĐÀN HỒI và ỨNG DỤNG LÂM SÀNG
Pag
e64
m/s of SS, ARFI had 85.2% Se, 91.7% Sp, 95.8% PPV, 73.3% NPV, 87.1% accuracy
(AUROC=0.91) for predincting liver cirrhosis. No signifcant differences regarding
SS were observed between patients with and without EV, also between those
with and without a history of variceal bleeding.
Conclusion: SS evaluated by means of ARFI had a very good predictive value for
the presence of cirrhosis (AUROC=0.91, accuracy=87.1%), but could not predict
the presence or severity of EV, also the risk of variceal bleeding.
Keywords: spleen stiffness, liver stiffness, liver cirrhosis, esophageal varices, ARFI
(Acoustic Radiation Force Impulse)
7/ CAP= CONTROLLED ATTENUATION PARAMETER and FIBROSCAN

SIÊU ÂM ĐÀN HỒI và ỨNG DỤNG LÂM SÀNG
Pag
e65

SIÊU ÂM ĐÀN HỒI và ỨNG DỤNG LÂM SÀNG
Pag
e66

SIÊU ÂM ĐÀN HỒI và ỨNG DỤNG LÂM SÀNG
Pag
e67
8/ Value of ARFI in the assessment of ascites syndrome, Bota S et al .
DISCUSSION
Standard ultrasonography can be a useful tool for the etiological
diagnosis of ascites syndrome. For instance, the surface of the liver is
irregular in liver cirrhosis and regular in most other causes of ascites. In
cirrhosis we can also find an enlarged spleen, a large portal vein, a
thickened wall of the gallbladder with bowel loops freely floating within
the ascitic fluid. If the peritoneal fluid is an exudate we can find small
amorphous echoes within the fluid (“debris”), loculated fluid, matted
bowel loops, hepatic metastases. However, the differentiation between
benign and malignant ascites by means of ultrasound is frequently
difficult or impossible.
ARFI elastography is a new method used for the assessment of LS.
Unlike transient elastography (TE) (FibroScan, EchoSens-Paris, France),
this new technique can additionally be performed in patients with
ascites.
In our present study, we found statistically significant differences
between LS measurements by means of ARFI in patients with cirrhotic
ascites vs those with non-cirrhotic ascites (3.04 ± 0.70 m/s vs 1.45 ±
0.59 m/s) (P < 0.001). Although the patient groups were unbalanced,
our results were confident enough to discriminate between the
cirrhotic or non-cirrhotic etiology of ascites.
For an LS cut-off value of 1.8 m/s, ARFI elastography had 95.6%
accuracy for predicting the cirrhotic etiology of ascites (2 patients with
cirrhotic ascites and 4 patients with non-cirrhotic ascites were
SIÊU ÂM ĐÀN HỒI và ỨNG DỤNG LÂM SÀNG
Pag
e68
incorrectly classified), for a cut-off value of 1.9 m/s, the accuracy was
94.9% (3 patients with cirrhotic ascites and 4 patients with non-cirrhotic
ascites were incorrectly classified), and for a cut-off value of 2 m/s, it
was 92.8% (6 patients with cirrhotic ascites and 4 patients with non-
cirrhotic ascites were incorrectly classified). Thus, from our data it
follows that the best ARFI cut-off for prediction of cirrhosis (and ascites
in the context of the liver cirrhosis) is 1.8 m/s.
Of the 4 patients with non-cirrhotic ascites incorrectly classified for a
1.8 m/s cutoff value, in 2 cases ARFI .
ARFI in ascites syndromewas difficult to determine (10 valid ARFI
measurements and more than 7 invalid measurements) and in one case
after we performed contrast enhanced ultrasonography we discovered
multiple metastases (so ARFI was performed in the liver masses).
Regarding the 2 patients with cirrhotic ascites incorrectly classified for a
1.8 m/s cut-off value, in one case ARFI was difficult to determine (10
valid ARFI measurements and more than 7 invalid measurements).
Several studies have demonstrated the value of ARFI elastography for
the prediction of liver cirrhosis and for the study of the liver in healthy
subjects.
In a previous study performed by our group[9], in which we included
114 subjects (38 healthy volunteers, 76 patients with chronic
hepatopathies in whom liver biopsy (LB) was performed, and 23 with
clinical, ultrasonographic and/or endoscopic signs of cirrhosis)
investigated by means of ARFI, a direct, strong, linear correlation
(Spearman rho = 0.675) was found between ARFI measurements and
fibrosis (P < 0.0001). The predictive value of ARFI for the presence of

SIÊU ÂM ĐÀN HỒI và ỨNG DỤNG LÂM SÀNG
Pag
e69
cirrhosis was also excellent; for a cut-off value of 1.8 m/s (for
measurements made 1-2 cm under the capsule) the area under the
receiver operating characteristic curve (AUROC) was 0.92.
In another study published in 2010 by our group[8], which included 71
patients with chronic viral hepatopathies, all with LB, the cut-off value
of ARFI measurement for the diagnosis of cirrhosis was 1.8 m/s [AUROC
0.868, with 100% sensitivity (Se), 77% specificity (Sp), 58% positive
predictive value (PPV) and 100% negative predictive value (NPV)].
In a study performed by Lupşor et al *7+, 112 patients with chronic HCV
hepatitis were evaluated by means of LB (the stage of fibrosis was
assessed according to the Metavir scoring system), ARFI and TE
(FibroScan). For a cut-off value of > 2 m/s for the prediction of cirrhosis,
ARFI had 80% Se, 95.4% Sp, 90.3% PPV and 90% NPV (AUROC = 0.93).
Also, in the study of Fierbinteanu-Braticevici et al [16] which evaluated
79 patients with chronic HCV hepatitis who underwent LB and ARFI, this
new elastographic method had very good sensitivity and specificity for
prediction of cirrhosis (for a cut-off value > 1.94 m/s ARFI had 100% Se,
98% Sp, 95% PPV and 100% NPV).
A study published by Goertz et al [10] included 57 patients with chronic
viral hepatitis B and C who underwent ARFI and consecutive LB. The
results were compared to the histological stage of fibrosis (F). ARFI
values were significantly correlated with the histological stage of
fibrosis (P < 0.001). The AUROC curve for the accuracy of ARFI imaging
was 87% for prediction of cirrhosis (F = 4).
A study published by Haque et al [17] included 22 patients with
chronic hepatopathies, in whom LB and ARFI were performed in the
same session. ARFI values were compared with both Batts-Ludwing
SIÊU ÂM ĐÀN HỒI và ỨNG DỤNG LÂM SÀNG
Pag
e70
score (F0 to F4) and modified Ishak score (F0 to F4). For the prediction
of liver cirrhosis, the AUROC was 0.85 for both Ishak and Batts-Ludwing
scores.
In a study published by Piscaglia et al [18], these authors included 133
patients with chronic liver disease evaluated by means of ARFI
elastography and TE. In 70 patients they performed LB. The diagnostic
accuracy for cirrhosis was first assessed in the 90 patients submitted to
TE with
> 13 kPa (47% of patients) as diagnostic for cirrhosis values. The best
cut-off for cirrhosis with ARFI was then tested in the 70 patients with
biopsy (cirrhosis in 38% of patients). The AUROC of ARFI for the
diagnosis of cir-
rhosis (reference TE) was 0.941 with 1.75 m/s as the best cut-off (Se
93.0%; Sp 85.1%). ARFI demonstrated good performance also in
patients with bioptic diagnosis of cirrhosis (AUROC 0.908, Se 81.5%, Sp
88.4%).
In all the studies presented above, the cirrhotic patients did not have
ascites.
Regarding the evaluation of LS in healthy subjects, Gallotti et al [19]
measured the stiffness of various abdominal organs by ARFI
elastography in 35 healthy subjects, obtaining for the liver a mean value
of 1.59 m/s. Goertz et al [10] obtained a mean LS value of 1.09 m/s in a
group of subjects without liver pathology. Popescu et al [20] evaluated
by means of ARFI elastography 82 subjects without known liver
pathology. The mean value of ARFI measurements in normal individuals
was 1.15 ± 0.21 m/s.
SIÊU ÂM ĐÀN HỒI và ỨNG DỤNG LÂM SÀNG
Pag
e71
The results of our study support the conclusion that in the investigation
of an ascites syndrome, the first investigation that should be performed
after abdominal ultrasound should be ARFI elastography. Regarding the
limitations of this study, ARFI is not a very good method for the
evaluation of LS in cases of multiple metastases, in cases when
performing ARFI in liver masses (when the liver structure is
homogeneous in standard ultraso-
nography) or in cases with a success rate < 60% (success rate = the ratio
of the number of successful acquisitions over the total number of
acquisitions).
ARFI elastography is feasible in most patients with ascites (96.8%) and it
has a very good predictive value for the cirrhotic or non-cirrhotic
etiology of ascites.
COMMENTS
Background
Ascites syndrome is a quite common discovery in abdominal
ultrasonography and several methods are used to establish the cause of
ascites.
Innovations and breakthroughs
Acoustic radiation force impulse (ARFI) elastography is a new method,
based on ultrasound, used for the evaluation of liver stiffness. The
advantage of this elastographic method compared to transient
elastography, is that it can be used in the presence of ascites. In our
study, ARFI was determinable in 96.8% of the patients with ascites.
SIÊU ÂM ĐÀN HỒI và ỨNG DỤNG LÂM SÀNG
Pag
e72
ARFI had a very good accuracy (95.6% for a 1.8 m/s cut-off value) for
the prediction of cirrhotic or non-cirrhotic etiology of the ascites.
Applications
This study supports the conclusion that in the investigation of an ascites
syn
drome, the first investigation that should be performed after
abdominal ultrasound should be ARFI elastography.
Peer review
This is an interesting cross-sectional study evaluating liver stiffness by
ARFI
in subjects with ascites. The authors noticed higher values in subjects
with cirrhosis, which is biological plausible. Additionally authors
presented some cut-off points which could be used for the diagnosis of
cirrhosis in subjects with ascites. This study is clearly presented and is
well written; however, some revisions are needed to improve the
manuscript.

SIÊU ÂM ĐÀN HỒI và ỨNG DỤNG LÂM SÀNG
Pag
e73
SIÊU ÂM ĐÀN HỒI và ỨNG DỤNG LÂM SÀNG
Pag
e74
TIÊN ĐOÁN CAO ÁP TĨNH MẠCH CỬA BẰNG ARFI
Abstract
Objective The purpose of this study was to assess the value of acoustic radiation force
impulse (ARFI) for evaluating portal hypertension by correlating the elasticity of liver
cirrhosis, as measured by ARFI, with haemodynamic indices measured by Doppler
ultrasound. Methods We evaluated the data of a total of 154 prospectively enrolled patients who
underwent both duplex Doppler ultrasound and ARFI imaging. The duplex Doppler
ultrasound indices, including the mean portal vein velocity, splenic index (SI) and
splenoportal index (SPI) were evaluated to determine the statistical correlation with shear
wave velocity (SWV) of ARFI. We also analysed the differences in the correlations between
the SI, SPI and SWV of the group who had varices. The correlations were assessed with
Spearman′s rank correlation coefficients.
Results There was an increase of SWV in parallel with the increase of the SI
(ρ=0.409, p<0.01) and SPI (ρ=0.451, p<0.01). In the patient group who did not have varices
SIÊU ÂM ĐÀN HỒI và ỨNG DỤNG LÂM SÀNG
Pag
e75
(n=74), the Doppler indices were found to be more correlated with the SWV (SI: ρ=0.447,
SPI: ρ=0.552,p<0.01). However, the group with varices showed no correlation between the
SWV and the Doppler parameters. Conclusion SWV of ARFI was well correlated statistically with Doppler parameters, but is
of limited value in predicting portal hypertension directly owing to great variability of
Doppler parameters. By evaluating the correlation between ARFI and Doppler ultrasound,
we suggest that the SWV might be a non-invasive supplementary tool for predicting portal
hypertension.
Introduction
Portal hypertension is a constant finding in the course of chronic liver disease and it causes
serious complications such as variceal bleeding, which is responsible for significant mortality
in patients with cirrhosis. Therefore, precise and regular assessment of the severity of portal
hypertension is necessary for patients with cirrhosis during follow-up. The hepatic vein
pressure gradient (HVPG) has been accepted as the gold standard for assessing the severity
of portal hypertension and it is the best predictor of variceal formation [1-3]. However, this
method is not feasible in clinical practice because of its invasiveness. Duplex Doppler
ultrasound (DDUS) has recently emerged as a useful non-invasive modality to use in
outpatient clinics for assessing the portal haemodynamics. Various portal haemodynamic
parameters according to DDUS have been introduced. The previous reports on this have
shown conflicting results for establishing DDUS as an acceptable modality for estimating the
portal pressure. We chose some of the recently introduced parameters that are more
acceptable and easier to perform. These were the splenic index (SI) and the splenoportal
index (SPI), which are based on the spleen length and portal vein velocity (PVV) [4].
Acoustic radiation force impulse (ARFI) imaging is a radiation force-based imaging method
that is provided by conventional B-mode ultrasound. With the increasing interest in finding
new non-invasive methods for evaluating liver cirrhosis patients, ARFI can be applied for the
measurement of liver stiffness as an alternative to needle biopsy. Many recent studies have
shown that ARFI imaging is an accurate non-invasive modality compared with transient
elastography and serum fibrosis marker tests [5-8]. The purpose of our study was to determine the correlations between the haemodynamic
parameters measured with Doppler ultrasound and the liver stiffness measured with ARFI,
and to evaluate the value of ARFI for predicting the presence of portal hypertension in
patients with cirrhosis.
Methods and materials
Patients and control subjects

SIÊU ÂM ĐÀN HỒI và ỨNG DỤNG LÂM SÀNG
Pag
e76
The study received institutional review board approval and informed written consent was
obtained from all the subjects. The subjects were drawn from a consecutive series of 200
patients with liver cirrhosis and who visited the outpatient clinic of Dong-A University
Hospital for routine follow-up between April 2010 and June 2010. The diagnosis of cirrhosis
was established by histological examination or the combination of standard clinical,
laboratory and imaging studies, including ultrasound and CT. The patients who did not
provide informed consent or who had hepatocellular carcinoma, thrombosis in the inferior
vena cava, hepatic vein or portal vein, or heart failure were excluded. After all the
exclusions, 154 patients (91 males and 63 females; mean age 55.0±10.4 years) were finally
included in this study. The cause of cirrhosis was viral in 133 patients (hepatitis C virus in 30
patients, hepatitis B virus in 102 patients, coinfection of B and C virus in 1 patient), alcohol
abuse in 15 patients and cryptogenic in 6 patients. The severity of liver dysfunction, as
classified by the Child–Pugh scoring system, was A in 142, B in 8 and C in 4. The patients
who had undergone oesophago-gastro-duodenoscopy or CT in the previous 6 months were
retrospectively evaluated for the presence of oesophageal or gastric varices. 47 patients were
proven to have oesophageal or gastric varices, 74 patients were confirmed to not have varices
and the other 33 patients did not undergo endoscopy or CT. In addition, 15 healthy adult volunteers (10 men and 5 women) who did not have a history of
relevant concomitant illness (heart, lung or liver disease or neoplasia) were examined with
DDUS and ARFI imaging and they served as a control group in which to obtain benchmark
median ARFI velocity and Doppler parameter measurements. The mean age of the control
group (25.9±2.4 years) was significantly younger than that of the patient group (p<0.001).
Greyscale and Doppler ultrasound The examination was performed after the patients had fasted for 4–6 hours. B-mode standard
ultrasonography scanning was initially performed using a Siemens Acuson S2000™ with a
4C1 transducer (Siemens Medical Solutions USA Inc., Malvern, PA). The spleen size was
depicted after standard screening ultrasonography scanning of the abdomen. The SI was
calculated in square centimetres using the transverse and vertical diameters of the spleen on
the maximal cross-sectional images of the spleen (Figure 1) [9].

SIÊU ÂM ĐÀN HỒI và ỨNG DỤNG LÂM SÀNG
Pag
e77
The portal vein was longitudinally scanned and the Doppler sampling cursor was placed
approximately halfway between the venous confluence and the portal bifurcation. The PVV
was the mean of three measurements with the patient holding their breath. It was
automatically measured by the machine using the time-averaged velocity in two to three
cardiac cycles and with an angle correction of < 60° [10] (Figure 1).
The SPI was calculated using the data acquired above with the formula SPI=SI/PVVmean (SI
is in cm2; PVVmean is the mean PVV in cm s–1).
All the ultrasound examinations were performed by one of two authors (HJK or JHC, with 7
and 14 years′ of experience with Doppler ultrasound, respectively) who were blinded to the
clinical data throughout the study. The operators agreed on common rules to perform the
ultrasound measurements before the start of the study.
Acoustic radiation force impulse imaging After the B-mode standard ultrasonography and Doppler ultrasound were done, ARFI
elastography was performed with the same curved arrays by the same authors as follows: the
right lobe of the liver was accessed through an intercostal space while the patient was in the
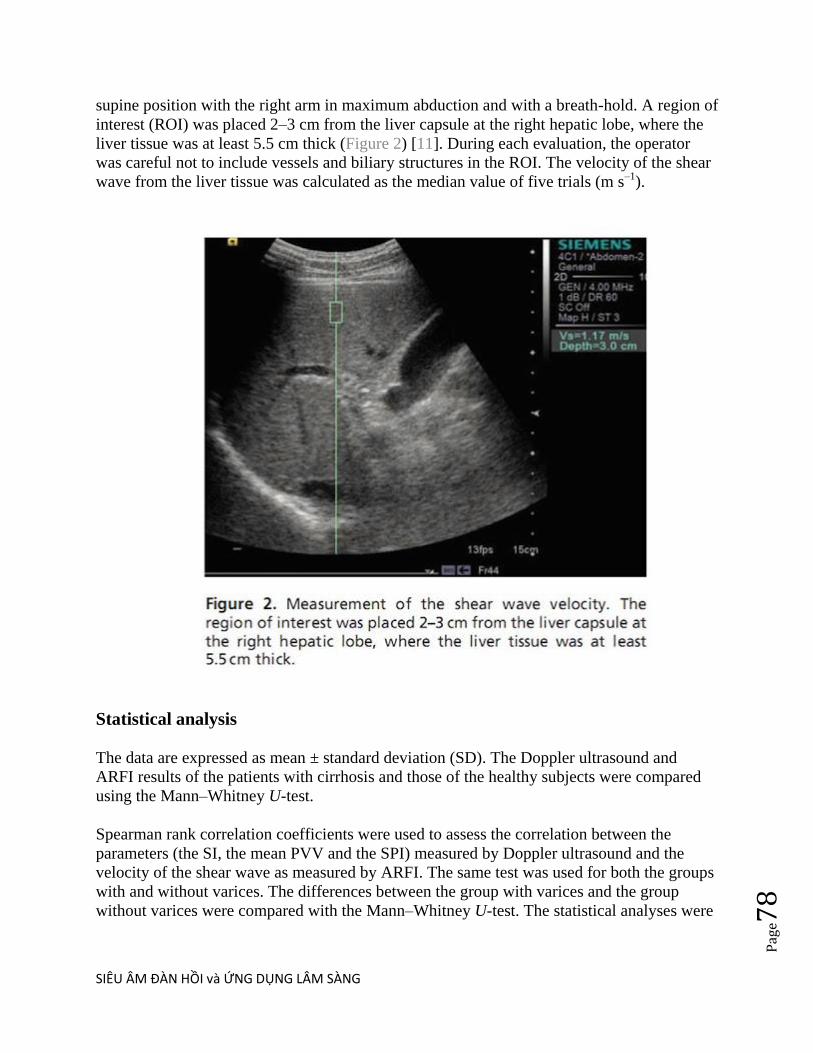
SIÊU ÂM ĐÀN HỒI và ỨNG DỤNG LÂM SÀNG
Pag
e78
supine position with the right arm in maximum abduction and with a breath-hold. A region of
interest (ROI) was placed 2–3 cm from the liver capsule at the right hepatic lobe, where the
liver tissue was at least 5.5 cm thick (Figure 2) [11]. During each evaluation, the operator
was careful not to include vessels and biliary structures in the ROI. The velocity of the shear
wave from the liver tissue was calculated as the median value of five trials (m s–1).
Statistical analysis The data are expressed as mean ± standard deviation (SD). The Doppler ultrasound and
ARFI results of the patients with cirrhosis and those of the healthy subjects were compared
using the Mann–Whitney U-test.
Spearman rank correlation coefficients were used to assess the correlation between the
parameters (the SI, the mean PVV and the SPI) measured by Doppler ultrasound and the
velocity of the shear wave as measured by ARFI. The same test was used for both the groups
with and without varices. The differences between the group with varices and the group
without varices were compared with the Mann–Whitney U-test. The statistical analyses were
SIÊU ÂM ĐÀN HỒI và ỨNG DỤNG LÂM SÀNG
Pag
e79
performed by using SPSS® software (v. 18.0 for Windows; SPSS, Chicago, IL). p-values of
<0.05 were considered to indicate significant differences.
Results
The parameters of Doppler ultrasound and ARFI are summarised in Table 1. There was a
statistically significant difference between the patients and healthy subjects for all the
measurements. The shear wave velocity (SWV) was correlated with the SI (ρ=0.409, p<0.01)
and the SPI (ρ=0.451, p<0.01; Figure 3). Weak but significant correlations were found for
the mean PVV (ρ=−0.205, p<0.05). After excluding the patients who were confirmed to have
varices (n=47) and the patients who were not assessed (n=33), the correlation between these
two modalities became higher for the SI (n=74, ρ=0.447, p<0.001), the SPI
(n=74, ρ=0.552, p<0.001) and the mean PVV (n=74, ρ=−0.25,p<0.05). The results for the
patients who had varices showed a statistical difference from those of the patients who did
not have varices: the SWV, SI and SPI of the patients who had varices were 2.31±0.75 m s–
1 (p<0.001), 73.95±24.4 cm2 (p<0.001) and 8.48±4.25 (p<0.001), respectively, and they were
significantly higher than those values of the patients who did not have varices (Table 2). No
significant correlation was found between the ultrasound parameters and the SWV for the
group of patients with varices (Figure 4).
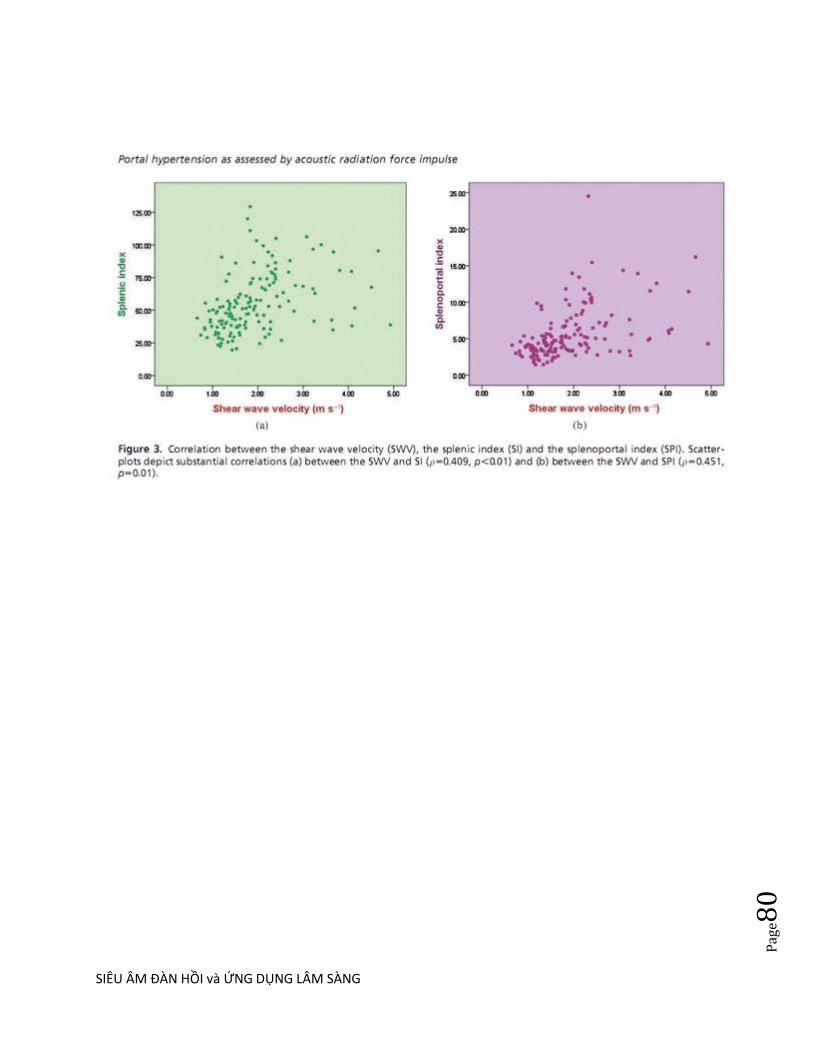
SIÊU ÂM ĐÀN HỒI và ỨNG DỤNG LÂM SÀNG
Pag
e80

SIÊU ÂM ĐÀN HỒI và ỨNG DỤNG LÂM SÀNG
Pag
e81
Figure 4 Comparison between (a, b) the group without varices and (c, d) the group with varices. (a, b)
Scatter-plots depict stronger correlation (splenic index: ρ=0.447, p<0.001; splenoportal
index: ρ=0.552, p<0.001) than that for the total cirrhotic patients in Figure 1, but there was
no correlation in (c, d) the group with varices (splenic index: ρ=0.211, p=0.154; splenoportal
index: ρ=0.253, p=0.087).

SIÊU ÂM ĐÀN HỒI và ỨNG DỤNG LÂM SÀNG
Pag
e82
Table 1 Comparison of shear wave velocity of ARFI and parameters of Doppler ultrasound
between patients with and without cirrhosis

SIÊU ÂM ĐÀN HỒI và ỨNG DỤNG LÂM SÀNG
Pag
e83
Table 2 Comparison of shear wave velocity of ARFI and parameters of Doppler ultrasound
between patients with varices and without varices
Discussion
Duplex Doppler ultrasound is a non-invasive technique that can be used for estimating portal
hypertension. Various portal haemodynamic parameters assessed by DDUS have been
introduced and the previous studies have reported conflicting findings to presently establish
DDUS as an acceptable modality for estimating the portal pressure [1-4]. The SI is the
sonographic grading assessment to express the spleen size. The spleen size had traditionally
been known to be the predictor of chronic liver disease and has been proven to correlate with
portal pressure in recent studies [3,4,12]. With increasing portal pressure, the portal velocity
decreases and fluctuations disappear with flow becoming continuous [4,13,14]. The SPI is a
recently proposed index that amplifies the opposite effects that the mean PVV and SI exert,
and the SPI can predict the presence of oesophageal varix in outpatient clinics [4].
ARFI sonoelastography has recently attracted a great deal of attention for its use to measure
liver stiffness. ARFI imaging is an ultrasound-based technique in which the speed of wave

SIÊU ÂM ĐÀN HỒI và ỨNG DỤNG LÂM SÀNG
Pag
e84
propagation is evaluated to study the viscoelastic properties of the targeted tissue. The
targeted region, the ROI, is mechanically excited by an acoustic pulse (∼262 µs) and this
generates localised tissue displacement. By measuring the time to peak displacement, the
shear wave speed of the tissue can be estimated at each lateral location of the ROI. The SWV
is proportional to the square root of the tissue elasticity [5]. Many of the preliminary studies
have yielded comparable results of the ARFI sonoelastographic velocity for determining the
severity of liver fibrosis [5-8].
We compared the two modalities ARFI and DDUS on the assumption that the portal
hypertension reflects the severity of cirrhosis. To the best of our knowledge, this is the first
study that has assessed the correlation between ARFI and DDUS.
The results of the current study show that a significant relationship exists between liver
stiffness, as measured by ARFI, and the parameters related to the portal pressure, as
measured by Doppler ultrasound. Our study results demonstrated a positive correlation
between the median ARFI sonoelastographic velocity, which reveals the liver stiffness, and
the flow parameters of Doppler ultrasound, which reflect portal hypertension. Although liver
stiffness appears to be a reliable method for identifying fibrosis, the pathophysiological basis
for its correlation with portal hypertension remains poorly defined. The structural and
biological changes in the liver may be responsible for increased portal pressure [15,16]. In
individuals with cirrhosis, portal hypertension initially develops as the result of an increase in
intrahepatic resistance to the portal blood flow due to profound morphological changes that
are characterised by fibrosis and regenerative nodules compressing the sinusoids. This leads
to vascular obliteration, activation of hepatic stellate cells and vasoconstriction, and this is all
due in large part to intrahepatic nitric oxide deficiency and enhanced vasoconstrictor activity
[17]. As a result, the progressive rise in portal pressure represents a reliable indicator of the
tissue changes and, to a certain extent, the biological microenvironment of the cirrhotic liver. While the correlations between Doppler parameters and SWV for patients without varices
were approximately 0.557, the other 44.3% of the variation in SI and SPI was not explained
by SWV. We hypothesised many factors that may influence Doppler indices, such as
intrahepatic shunt and many portal–caval anastomoses other than gastro-oesophageal varices.
Doppler parameters are still controversial for patients with cirrhosis owing to variability and
reproducibility [12]. These factors may also affect the high variability of SI and SPI.
The results of the measurements of the patients with varices were significantly higher than
those for the patients without varices. However, the results demonstrated a stronger
correlation between the SWV and Doppler parameters when the patients who had varices
were excluded. Further, there were no correlations between the SWV and Doppler
parameters in the group of patients who had varices. In advanced cirrhosis, several
extrahepatic factors (such as the hyperdynamic circulation, splanchnic vasodilation and the
resistance opposed to portal blood flow by the portosystemic collaterals) contribute to the
rise in portal pressure [16,18]. Beyond a certain degree of cirrhotic transformation, portal
hypertension is maintained by these complex haemodynamic changes and these are mediated

SIÊU ÂM ĐÀN HỒI và ỨNG DỤNG LÂM SÀNG
Pag
e85
by nitric oxide [19,20]. Although liver stiffness and the SWV reflect a progressive rise in
portal pressure due to morphological changes, they cannot measure the complex
haemodynamic changes of late portal hypertension [21]. Its ability to predict the grade of
varices in the case of severe portal hypertension was poor, suggesting a plateau effect in
which further increases in liver stiffness are not reflected in the development of the late
complications of portal hypertension.
The average of the Doppler parameters (SI, PVV, SPI) were slightly higher and the PVV was
lower compared with the results of other studies [3,4,12,22]. We hypothesised this to be the
consequence of the populations in different studies. The majority of our patients had hepatitis
B virus-related cirrhosis with a Child–Pugh classification of A, while the subjects of the
other studies had cirrhosis related to alcohol or hepatitis C virus. In alcoholic cirrhosis, the
developing fibrous septae extend through the sinusoids from the central to the portal regions
as well as from portal tract to portal tract. The hallmark of irreversible liver damage in
chronic hepatitis is the deposition of fibrous tissue, which starts from the portal tract.
Periportal septal fibrosis occurs with time and this is followed by linking of fibrous septa
between lobules [23]. As the fibrosis in early cirrhosis starts from the portal tract, this may
initially affect the haemodynamic change of the portal vein. However, this hypothesis should
be further studied based on scientific evidence.
The major advantages of ARFI and DDUS are that these techniques are painless and rapid,
they have no associated complications and they are easily accepted by patients. Both of the
techniques can be performed with conventional ultrasound probes during routine ultrasound
screening for hepatocellular carcinoma in patients with cirrhosis.
Although there were statistical correlations between both of the modalities, our study had
some limitations. First, most of our patients had Child–Pugh class A virus-related cirrhosis.
The potential bias due to the predominance of patients with chronic hepatitis B virus may
have had an effect on the results. The value of ARFI in patients with other causes and
severity of cirrhosis remains to be established. Doppler parameters are still controversial for
patients with cirrhosis and definite standards have not been set for predicting portal
hypertension. More extensive studies are needed to establish consistent measurements of the
Doppler parameters. The study lacks interobserver agreement of Doppler indices and ARFI,
although a previous study revealed 6.1±3.6% for mean PVV and 4.7±3.2% for the SI [4].
Another limitation is that only simple correlations were performed. Linear regression was not
performed because interactions such as collaterals can affect the results.
In conclusion, substantial correlations were observed between liver stiffness and the Doppler
parameters. It may have implications for the clinical assessment of patients who are at an
early stage of liver cirrhosis that precedes the development of severe portal hypertension.
However, because of the scattering of the data, the quantitative measurement of SPI or portal
velocity has a limited utility in predicting portal hypertension directly. Further studies,
including direct correlation with portal venous pressure, are needed to compare the
prognostic values of Doppler ultrasound and ARFI.

SIÊU ÂM ĐÀN HỒI và ỨNG DỤNG LÂM SÀNG
Pag
e86
____________________________
BAN LUẬN
Siêu âm Duplex Doppler [DDUS] là kỹ thuật không xâm lấn đƣợc dùng để
đánh giá tình trạng cao áp tĩnh mạch cửa. Các thông số huyết động tĩnh mạch cửa của DDUS đã đƣợc giới thiệu và nhiều nghiên cứu đã báo cáo
việc dùng DDUS để đo áp lực tĩnh mạch cửa là không tƣơng thích. Chỉ số
lách SI là đánh giá siêu âm phân độ [grading] biểu hiện kích thƣớc của lách. Kích thƣớc lách theo truyền thống đã đƣợc dùng để tiên lƣợng bệnh
gan mạn tính và đƣợc chứng minh có tƣơng quan với áp lực tĩnh mạch cửa trong các nghiên cứu gần đây. Khi áp lực tĩnh mạch cửa tăng, tốc độ
tĩnh mạch cửa giảm đi và mất dao động rồi trở thành dòng chảy liên tục.
Chỉ số lách tĩnh mạch cửa SPI mới đƣợc đề xuất gần đây để khuếch đại tác dụng đối nghịch giữa tốc độ tĩnh mạch cửa [PVV] trung bình và chỉ số
lách SI, và chỉ số lách tĩnh mạch cửa SPI có thể dự đoán sự xuất hiện của giãn tĩnh mạch thực quản tại phòng khám ngoại trú.
Siêu âm đàn hồi ARFI gần đây đã thu hút nhiều chú ý trong đo độ cứng
gan. Tạo hình ARFI là một kỹ thuật siêu âm trong đó tốc độ truyền sóng âm đƣợc đánh giá để nghiên cứu các tính chất nhày đàn
hồi [viscoelascity] các mô muốn khảo sát. Các khu vực mục tiêu, vùng ROI, đƣợc kích thích cơ học bởi một xung âm (~ 262 µs) gây ra dời chỗ
mô khu trú. Bằng cách đo thời gian để dời chỗ cao nhất, tốc độ sóng biến
dạng [SWV] của mô có thể đƣợc đo ở mỗi vị trí bên vùng ROI. Tốc độ SWV tỷ lệ thuận với căn bậc hai của độ đàn hồi mô. Nhiều nghiên cứu sơ
bộ đã đạt đƣợc những kết quả của tốc độ đàn hồi ARFI có thể so sánh đƣợc để xác định độ nặng của xơ hoá gan. Chúng tôi so sánh ARFI và
DDUS với giả định cao áp tĩnh mạch cửa phản ánh độ nặng của chai gan. Theo chúng tôi biết, đây là khảo sát đầu tiên nhằm đánh giá mối tƣơng
quan giữa ARFI và DDUS.
Kết quả của nghiên cứu này cho thấy có liên quan có ý nghĩa giữa độ
cứng gan, đo bằng ARFI, và các thông số liên quan đến áp lực tĩnh mạch
cửa, đƣợc đo bằng siêu âm Doppler. Kết quả nghiên cứu đã chứng
minh có tƣơng quan giữa vận tốc đàn hồi trung bình ARFI, mà chúng cho thấy độ cứng gan, với các thông số dòng chảy của siêu âm Doppler, qua
đó phản ánh cao áp tĩnh mạch cửa. Mặc dù độ cứng gan là phƣơng pháp xác định xơ hóa đáng tin cậy, cơ sở sinh lý bệnh của tƣơng quan với cao
áp tĩnh mạch cửa vẫn còn chƣa đƣợc xác định. Những thay đổi cấu trúc
và sinh học trong gan có thể là nguyên do của cao áp tĩnh mạch cửa. Ơ
SIÊU ÂM ĐÀN HỒI và ỨNG DỤNG LÂM SÀNG
Pag
e87
bệnh nhân chai gan, cao áp tĩnh mạch cửa ban đầu là kết quả của tăng
trở khang lưu lượng mau tĩnh mach cửa trong gan do nhiều biến đổi hình thái học, đặc trƣng bởi xơ hoa và nốt tai tao chèn ép các xoang
gan. Điều này dẫn đến tắc mạch máu, kích hoạt các tế bào gan hình sao và co mạch, và phần lớn là do thiếu oxit nitric trong gan và tăng co
mạch. Kết quả là, tăng áp lực tĩnh mạch cửa diễn tiến biểu thị cho biến
đổi môvà, đến một mức độ nhất định, cho vi môi trường sinh học của chai gan.
Trong khi những tƣơng quan giữa các thông số Doppler và tốc độ SWV ở bệnh nhân không bị dãn tĩnh mạch thực quản khoảng 0,557, tỉ lệ 44,3%
khác của sự thay đổi về SI và SPI không đƣợc giải thích bởi tốc độ SWV.
Chúng tôi giả thiết có nhiều yếu tố có thể ảnh hƣởng đến các chỉ số Doppler, chẳng hạn nhƣ shunt intrahepatic và cac thông nối tĩnh
mach cửa-chủ khac hơn là dãn tĩnh mạch dạ dày-thực quản. Các thông số Doppler vẫn còn gây tranh cãi ở các bệnh nhân bị chai gan do tính
biến thiên và tính lập lại. Những yếu tố này có thể tác động đến tính biến
thiên cao của chỉ số lách SI và chỉ số lách tĩnh mạch cửa SPI.
Các kết quả đo ở bệnh nhân có dãn tĩnh mạch thực quản cao hơn đáng kể so với những bệnh nhân không có dãn tĩnh mạch thực quản. Tuy
nhiên, kết quả đã chứng minh có tƣơng quan mạnh giữa tốc độ SWV và
các thông số Doppler khi bệnh nhân có dãn tĩnh mạch thực quản đƣợc loại trừ. Hơn nữa, không có tƣơng quan giữa tốc độ SWV và các thông số
Doppler trong nhóm bệnh nhân có dãn tĩnh mạch thực quản. Trong chai gan nặng, một số yếu tố ngoài gan (nhƣ hyperdynamic circulation, giãn
mạch tạng và trở kháng trái ngƣợc với lƣu lƣợng máu tĩnh mạch cửa do
portosystemic collaterals) đóng góp vào sự gia tăng áp lực tĩnh mạch cửa. Ngoài một mức độ nhất định của sự chuyển hóa chai gan, cao áp tĩnh
mạch cửa đƣợc duy trì bởi những thay đổi huyết động phức tạp và đây là những trung gian nitric oxide. Mặc dù độ cứng gan và các SWV phản ánh
sự tăng tiến triển của áp lực tĩnh mạch cửa do thay đổi hình thái học,
không thể đo lƣờng sự thay đổi huyết động phức tạp của cao áp tĩnh mạch cửa muộn. Khả năng dự đoán mức độ dãn tĩnh mạch thực quản
trong trƣờng hợp cao áp tĩnh mạch cửa nặng rất kém, cho thấy một hiệu ứng cao nguyên [plateau effect], trong đó sự tăng thêm độ cứng gan
không đƣợc phản ánh trong các biến chứng muộn của cao áp tĩnh mạch
cửa.
Trung bình của các thông số Doppler (SI, PVV, SPI) hơi cao hơn và tốc độ
PVV là thấp hơn so với kết quả của các nghiên cứu khác. Chúng tôi nghĩ
SIÊU ÂM ĐÀN HỒI và ỨNG DỤNG LÂM SÀNG
Pag
e88
là do hậu quả của mẫu dân số trong các nghiên cứu khác nhau. Phần lớn
các bệnh nhân của chúng tôi là chai gan do viêm gan virus B với phân loại Child-Pugh A, trong khi đối tƣợng của các nghiên cứu khác là chai
gan liên quan đến rƣợu hoặc viêm gan siêu vi C. Trong chai gan do rƣợu, các vách xơ phát triển mở rộng thông qua các xoang từ trung tâm đến
khoảng tĩnh mạch cửa cũng nhƣ từ đƣờng tĩnh mạch cửa [portal tract]
này đến đƣờng tĩnh mạch cửa khác. Các dấu hiệu của tổn thƣơng gan không hồi phục trong viêm gan mạn là sự lắng đọng các mô xơ, bắt đầu
từ đƣờng tĩnh mạch cửa. Xơ hóa vách ngăn quanh khoảng cửa xảy ra với thời gian và theo sau đó là liên kết với vách sợi giữa tiểu thùy. Khi xơ hóa
trong chai gan sớm bắt đầu từ đƣờng tĩnh mạch cửa, điều này ban đầu có
thể ảnh hƣởng đến sự thay đổi huyết động của các tĩnh mạch cửa. Tuy nhiên, giả thuyết này cần đƣợc tiếp tục nghiên cứu dựa trên bằng chứng
khoa học.
Những lợi thế lớn của ARFI và DDUS là những kỹ thuật này không đau và thực hiện nhanh, không gây biến chứng và bệnh nhân dễ chấp nhận. Cả
hai kỹ thuật có thể đƣợc thực hiện với đầu dò siêu âm thông thƣờng trong quá trình kiểm tra siêu âm định kỳ tìm ung thƣ biểu mô tế bào gan ở
bệnh nhân chai gan.
Mặc dù có mối tƣơng quan có ý nghĩa thống kê giữa ARFI và DDUS,
nghiên cứu của chúng tôi có một số hạn chế. Trƣớc tiên, hầu hết bệnh nhân của chúng tôi là chai gan có Child-Pugh nhóm A liên quan đến virus.
Các sai số [bias] tiềm ẩn do phần lớn là bệnh nhân viêm gan virus B mạn
tính có thể có ảnh hƣởng đến kết quả. Giá trị của ARFI ở những bệnh nhân với các nguyên nhân khác và mức độ nặng của chai gan vẫn còn
đang thiết lập. Các thông số Doppler vẫn còn gây tranh cãi ở bệnh nhân chai gan và các tiêu chuẩn xác định đã không đƣợc thiết kế để dự đoán
cao áp tĩnh mạch cửa. Nghiên cứu rộng rãi hơn là cần thiết để thiết lập
cách đo các thông số Doppler phù hợp. Nghiên cứu này thiếu đồng thuận giữa các ngƣời khám [interobserver agreement] của các chỉ số Doppler và
ARFI, mặc dù một nghiên cứu trƣớc đây cho thấy tốc độ trung bình PVV là 6,1 ± 3,6% và cho SI là 4,7 ± 3,2%. Hạn chế khác là chỉ thực hiện đƣợc
các tƣơng quan đơn giản. Hồi quy tuyến tính không đƣợc thực hiện do sự
tƣơng tác [interactions] nhƣ tuần hoàn bàng hệ có thể có ảnh hƣởng đến kết quả.
Để kết luận, có tƣơng quan đáng kể giữa độ cứng gan và các thông số
Doppler. Nó có thể có tác động đối với các đánh giá lâm sàng cho bệnh nhân ở giai đoạn sớm của chai gan trƣớc sự phát triển của cao áp tĩnh
mạch cửa nặng. Tuy nhiên, vì sự phân tán của dữ liệu, đo lƣờng định lƣợng của chỉ số lách tĩnh mạch cửa SPI hoặc vận tốc tĩnh mạch cửa có
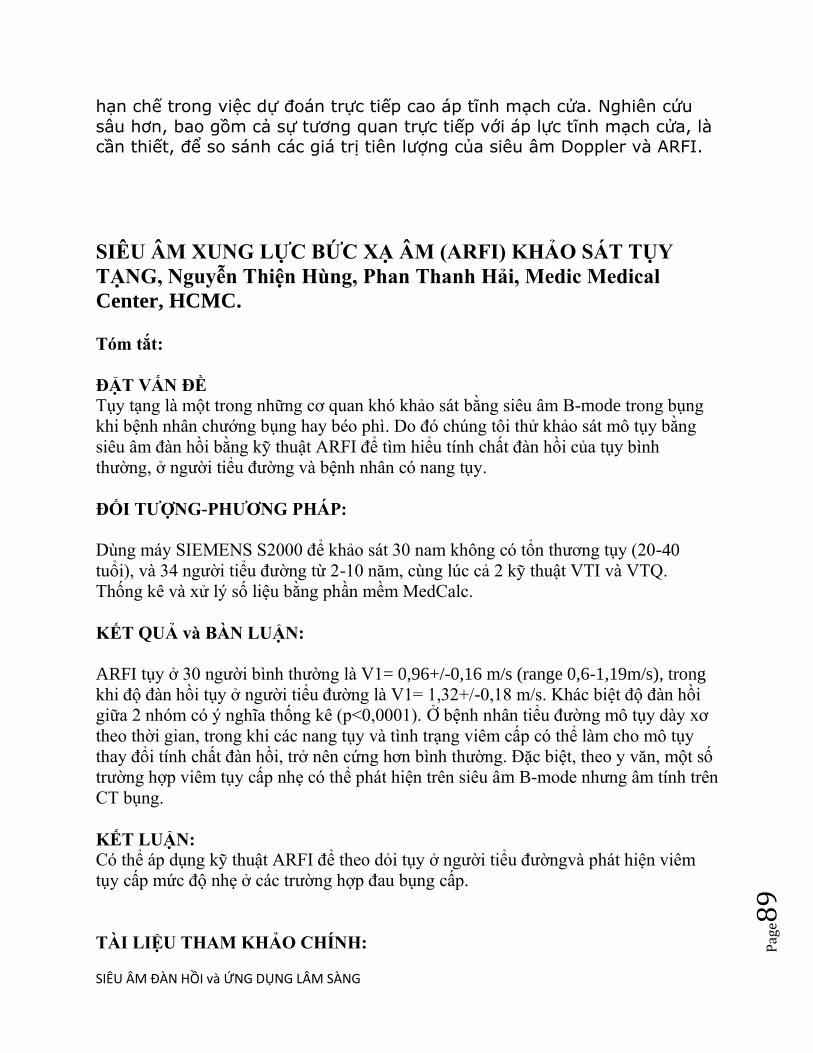
SIÊU ÂM ĐÀN HỒI và ỨNG DỤNG LÂM SÀNG
Pag
e89
hạn chế trong việc dự đoán trực tiếp cao áp tĩnh mạch cửa. Nghiên cứu
sâu hơn, bao gồm cả sự tƣơng quan trực tiếp với áp lực tĩnh mạch cửa, là cần thiết, để so sánh các giá trị tiên lƣợng của siêu âm Doppler và ARFI.
SIÊU ÂM XUNG LỰC BỨC XẠ ÂM (ARFI) KHẢO SÁT TỤY
TẠNG, Nguyễn Thiện Hùng, Phan Thanh Hải, Medic Medical
Center, HCMC.
Tóm tắt:
ĐẶT VẤN ĐỀ Tụy tạng là một trong những cơ quan khó khảo sát bằng siêu âm B-mode trong bụng
khi bệnh nhân chƣớng bụng hay béo phì. Do đó chúng tôi thử khảo sát mô tụy bằng
siêu âm đàn hồi bằng ky thuật ARFI để tìm hiểu tính chất đàn hồi của tụy bình
thƣờng, ở ngƣời tiểu đƣờng và bệnh nhân có nang tụy.
ĐỐI TƢỢNG-PHƢƠNG PHÁP:
Dùng máy SIEMENS S2000 để khảo sát 30 nam không có tổn thƣơng tụy (20-40
tuổi), và 34 ngƣời tiểu đƣờng từ 2-10 năm, cùng lúc cả 2 ky thuật VTI và VTQ.
Thống kê và xử lý số liệu bằng phần mềm MedCalc.
KẾT QUẢ và BÀN LUẬN:
ARFI tụy ở 30 ngƣời bình thƣờng là V1= 0,96+/-0,16 m/s (range 0,6-1,19m/s), trong
khi độ đàn hồi tụy ở ngƣời tiểu đƣờng là V1= 1,32+/-0,18 m/s. Khác biệt độ đàn hồi
giữa 2 nhóm có ý nghĩa thống kê (p<0,0001). Ở bệnh nhân tiểu đƣờng mô tụy dày xơ
theo thời gian, trong khi các nang tụy và tình trạng viêm cấp có thể làm cho mô tụy
thay đổi tính chất đàn hồi, trở nên cứng hơn bình thƣờng. Đặc biệt, theo y văn, một số
trƣờng hợp viêm tụy cấp nhẹ có thể phát hiện trên siêu âm B-mode nhƣng âm tính trên
CT bụng.
KẾT LUẬN: Có thể áp dụng ky thuật ARFI để theo doi tụy ở ngƣời tiểu đƣờngvà phát hiện viêm
tụy cấp mức độ nhẹ ở các trƣờng hợp đau bụng cấp.
TÀI LIỆU THAM KHẢO CHÍNH:

SIÊU ÂM ĐÀN HỒI và ỨNG DỤNG LÂM SÀNG
Pag
e90
1/ Virtual analysis of pancreatic cystic lesion fluid content by ultrasound ARFI
Quantification, JUM 2013.
2/ Use ARFI Elastography to Diagnose Acute Pancreatitis at Hospital Admission,
JUM 2014.
PHỤ BẢN:
A/ Độ đàn hồi mô tụy ở người Tiểu đường (n=34): 1,32+/-0,18m/s
Mean elastic velocity of normal pancreas (n=30) = 0.96+/-0.16 m/s (range 0.6-1.19m/s)
Khác biệt có ý nghĩa thống kê (p<0,0001)
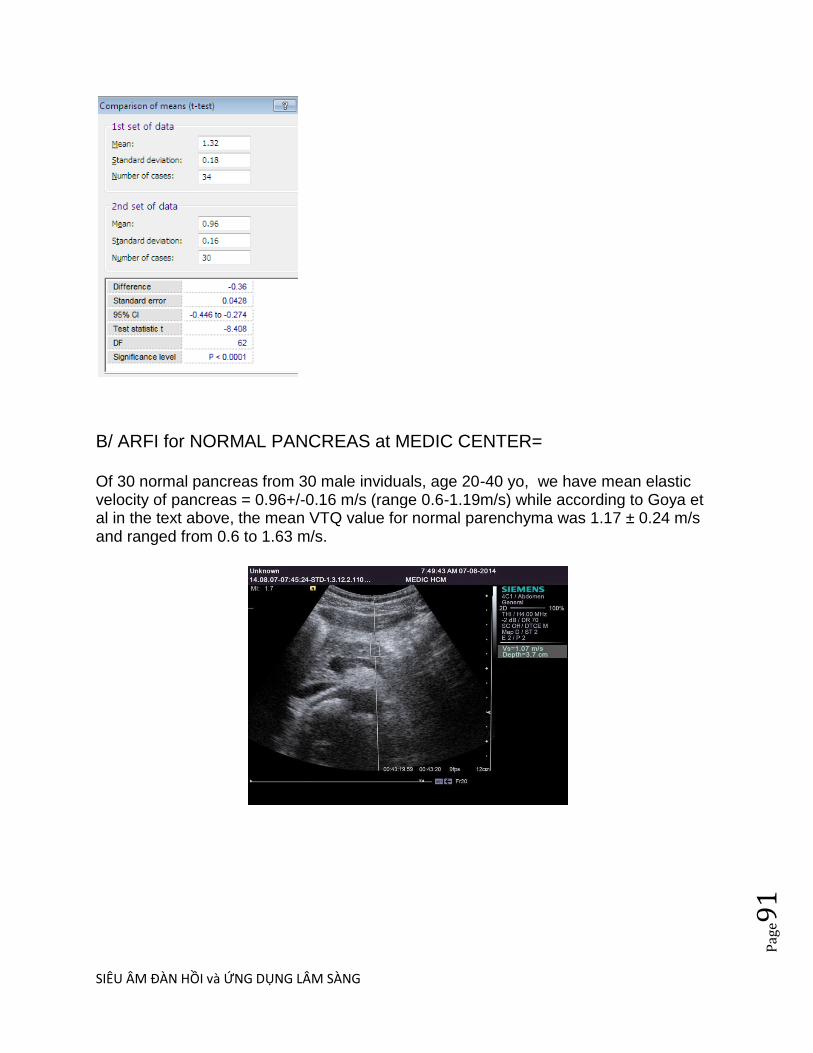
SIÊU ÂM ĐÀN HỒI và ỨNG DỤNG LÂM SÀNG
Pag
e91
B/ ARFI for NORMAL PANCREAS at MEDIC CENTER=
Of 30 normal pancreas from 30 male inviduals, age 20-40 yo, we have mean elastic velocity of pancreas = 0.96+/-0.16 m/s (range 0.6-1.19m/s) while according to Goya et al in the text above, the mean VTQ value for normal parenchyma was 1.17 ± 0.24 m/s and ranged from 0.6 to 1.63 m/s.
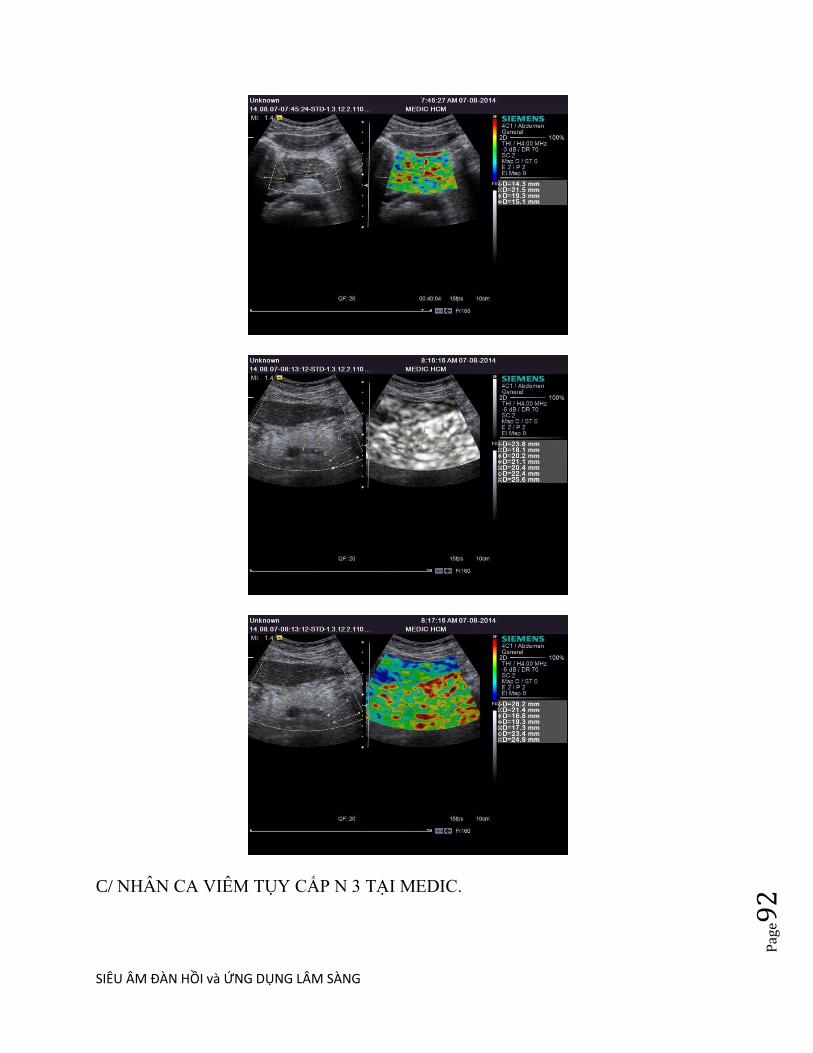
SIÊU ÂM ĐÀN HỒI và ỨNG DỤNG LÂM SÀNG
Pag
e92
C/ NHÂN CA VIÊM TỤY CẤP N 3 TẠI MEDIC.

SIÊU ÂM ĐÀN HỒI và ỨNG DỤNG LÂM SÀNG
Pag
e93
Sau uống rƣợu đau bụng nhiều từ 3 ngày trƣớc, bệnh nhân đƣợc khám siêu âm, thử
máu amylasemia không tăng, lipase tăng và CRP tăng. CT cho thấy viêm tụy phần
đuôi, có tạo nang giả nhƣ siêu âm ARFI tụy.

SIÊU ÂM ĐÀN HỒI và ỨNG DỤNG LÂM SÀNG
Pag
e94

SIÊU ÂM ĐÀN HỒI và ỨNG DỤNG LÂM SÀNG
Pag
e95
SIÊU ÂM ĐÀN HỒI VIÊM RUÔT THỪA
Đến nay (02/2014) chúng tôi thu thập đƣợc 17 ca siêu âm đàn hồi ARFI ruột thừa viêm trƣớc mổ trên máy ACUSON Siemens S2000, tất cả đều đƣợc chụp CT xác chẩn và phẫu thuật sau đó. Độ đàn hồi ARFI vách ruột thừa viêm= 2,715+/-0,325m/s trong khi độ đàn hồi vách ruột non lân cận =1,03+/-0,2m/s và mô mỡ mạc treo= 1,34+/-0,3m/s. Vách ruột thừa viêm cứng hơn ruột non không viêm và mô mỡ mạc treo.
1. HÌNH ẢNH SIÊU ÂM ĐAN HÔI TRONG VIÊM RUỘT THỪA BS LÝ VĂN PHÁI,
BS NGUYỄN THIỆN HUNG, BS PHAN THANH HẢI Trung Tâm Y Khoa Medic, TP.
Hồ Chí Minh, Việt Nam
DẪN NHẬP Hiện nay siêu âm và CT scanner đều góp phần vào chẩn đoán viêm ruột
thừa cấp. Trong nghiên cứu của Pickuth và cs , siêu âm có độ nhạy 87% và độ đặc hiệu
74%, trong khi đó CT scanner là 95% và 89% (3). Gần đây, siêu âm đàn hồi góp phần cải
thiện độ nhạy, độ chính xác của siêu âm trong chẩn đoán bệh lý này. Gồm 17 bệnh nhân
viêm ruột thừa cấp đến khám tại Trung Tâm Y Khoa Medic đã đƣợc siêu âm trƣớc mổ .
Với siêu âm B-mode ngoài những dấu hiệu kinh điển nhƣ: khẩu kính ruột thừa trên 6mm,
đè không xẹp, thành ruột thừa dầy trên
ĐÔI TƢỢNG-PHƢƠNG PHÁP 3mm, mô mỡ xung Mô tả hồi cứu những trƣờng viêm
ruột thừa cấp đã đƣợc quanh phù nề, có hay siêu âm với ky thuật ARFI không có soi
phân. Cùng (Acoustic Radiation Force lúc, với siêu âm đàn hồi Impulse) trên máy
Siemens dùng ky thuật ARFI, (máy Acuson S2000, tất cả những Acuson Siemens) dấu

SIÊU ÂM ĐÀN HỒI và ỨNG DỤNG LÂM SÀNG
Pag
e96
trƣờng hợp này đã chụp MSCT-64 xác chẩn và đƣợc hiệu thành ruột thừa phẫu thuật sau
đó. viêm cứng hơn hiện diện trong tất cả các trƣờng hợp. Do đó, bên cạnh siêu âm thƣờng
quy, siêu âm đàn hồi có thể góp phần chẩn đoán chắc chắn viêm ruột thừa cấp giai đoạn
sớm.
KẾT QUẢ-BAN LUẬN Tất cả 17 bệnh nhân trong nghiên cứu của chúng tôi, ngoài
những dấu hiệu kinh điển ( ruột thừa có khẩu kính trên 6mm, đè không xẹp, thành dầy
trên 3mm, phù nề mô mỡ xung quanh, có hay không có soi phân), với ky thuật ARFI phát
hiện 100% ruột thừa viêm có thành cứng hơn bình thƣờng. Chúng tôi nhận thấy ―thành
ruột thừa viêm cứng ‖ là một dấu hiệu đáng quan tâm; theo các tác giả Ấn Độ thì dấu
hiệu này hiện diện 100% trong nghiên cứu của họ. Do đó siêu âm đàn hồi ARFI giúp cải
thiện độ nhạy và độ đặc hiệu lên 88 % và 100% (2).
KẾT LUẬN Siêu âm đàn hồi với ky thuật ARFI có thể phát hiện thành ruột thừa cứng lên
khi bị viêm, là một phát hiện mới, giúp cải thiện đáng kể độ nhạy góp phần chẩn đoán
sớm viêm ruột thừa cấp. TAI LIỆU THAM KHẢO 1. Atul Kapoor, MD, Aprajita
Kapoor, MD, Goldaa Mahajan, MD. Real-time Elastography in Acute Appendicitis . 2.
Carol M. Rumack, MD. Stephanie R. Wilson, MD. J Willam Charboneaum MD. Jo –
Ann M. Johnson, MD. : Diagnostic Ultrasound 3rd edition. 3. Pickuth D, Heywang-
Köbrunner SH, Spielmann RP. : Suspected appendicitis: is ultrasonography or computed
tomography the preferred imaging technique? Eur J Surg 2000; 166:315–319.
VTI cho thấy khối ruột thừa viêm và mỡ mạc treo không quá cứng [bright
color], vách darker và lòng chứa dịch brighter.
VTI cắt ngang: vách iso color, dƣới niêm bright color, lớp cơ ở gốc darker
color hơn lớp dƣới niêm
VTI cắt dọc: lớp cơ darker không đều, lớp dƣới niêm brighter không đều
VTQ: Tốc độ ARFI ở vách= 1,34m/s
eSie Touch= Vách ruột thừa viêm cứng [dark color], lòng chứa dịch [bright
color], mô mỡ viêm mềm hơn vách, [bright color]. Ở eST, dạng và kích
thƣớc ruột thừa viêm lớn hơn trên B-mode, vách dày và cứng hơn (dark)
Ở eSie Touch color code 1= vùng đỏ: cứng, tím : mềm, xanh lá cây và
vàng: trung gian. eSie Touch: Đầu tự do ít cứng hơn (vàng cam) phần
thân (đỏ) nhƣng mỡ phúc mạc quanh ruột thừa thì mềm (xanh lá cây- tím)
so với vách ruột thừa

SIÊU ÂM ĐÀN HỒI và ỨNG DỤNG LÂM SÀNG
Pag
e97
SIÊU ÂM ĐÀN HỒI TRONG NIỆU KHOA
Siêu âm vốn có vai trò quan trọng trong chẩn đoán bệnh niệu khoa cấp và
mạn tính nhƣ cơn đau quặn thận, xoắn tinh hoàn, chấn thƣơng thận, hoặc
dùng theo dõi hồi lƣu bàng quang niệu quản, đánh giá vô sinh, đo thể tích
nƣớc tiểu tồn lƣu và phát hiện ung thƣ. Tuy nhiên có một số mặt siêu âm
có độ chính xác chƣa đủ tin cậy và phải đƣợc CT và MRI xác nhận.
Trong Niệu khoa, các lĩnh vực có đóng góp của siêu âm đàn hồi gồm nốt
tinh hoàn, u thận, tiền liệt tuyến và theo dõi thải ghép thận.
1/ TINH HOÀN:
Với real-time elastography của máy Hitachi, Goddi và cs đã phân biệt các
nốt và giả nốt (nodular/pseudonodular) của tinh hoàn bằng phần mềm cho
điểm SC từ 1-5. Một báo cáo gồm 144 tổn thƣơng của 88 tinh hoàn cho
thấy 93,7% nốt lành tính có complete elastic pattern SC 1; 92,9% nốt lành
tính nhỏ hơn 5mm và 100% tổn thƣơng giả nốt cũng có SC 1; trong khi
87,5% nốt ác tính có SC 4-5 (cứng). RTE giúp phân biệt nốt lành tính và ác
tính tốt hơn; có độ nhạy=87,5%, độ đặc hiệu=98,2% và độ chính xác là
95,8% khi phân biệt nốt tinh hoàn lành tính và ác tính. Tuy nhiên RTE ít có
liên quan với những tổn thƣơng lớn.
PHỤ BẢN: ARFI of TESTIS at MEDIC CENTER
LE VAN TAI- NGUYEN THIEN HUNG- PHAN THANH HAI MEDIC MEDICAL CENTER, HCMC, VIETNAM PURPOSE: Acoustic radiation force impulse imaging (ARFI) is a new technique for the sonographic quantification of tissue elasticity. We applied ARFI elastography to investigate the stiffness of the normal and pathologic testes.

SIÊU ÂM ĐÀN HỒI và ỨNG DỤNG LÂM SÀNG
Pag
e98
METHOD and MATERIALS: 20 male volunteers underwent normal B-mode sonography with ARFI elastometry of both testes using a Siemens Acuson S2000™ (Siemens Healthcare, Germany) system. And there were 10 cases of testicular tumor and 03 cases of hematoma in our study. Results were statistically evaluated. RESULTS:
- From 40 normal testes of 20 male individuals, mean elastic velocity VTQ= 0.87+/- 0.11m/s [range 0.72-1.12 m/s]
- From 03 cases of hematoma, mean elastic velocity VTQ=1.39+/-0.02m/s. - From 12 cases of testicular tumor, mean elastic velocity VTQ= 1.51+/- 0.18 m/s
(range 1.26-1.69m/s) with the meaning more stiffness than normal and hematoma testis. On VTI tumor are harder the parenchyma (black color or blue code) CONCLUSION: ARFI elastometry provides the initial values of testicular stiffness in normal and pathologic status. Further studies with more subjects may be required to define the normal range of values for normal and pathologic groups.
2/ TIỀN LIỆT TUYẾN= Siêu âm đàn hồi qua ngã trực tràng
Real–time Sonoelastography của máy Hitachi
Shear Wave Elastography của máy Supersonic Imaging
Máy Aixplorer‘s ShearWave Elastography với đầu dò transrectal dễ phát
hiện các nhân tiền liệt tuyến. Bản đồ đàn hồi mã hoá màu định lƣợng độ
cứng tiền liệt tuyến hiển thị real–time và chỉ cần ấn 1 nút. Bản đồ giúp định
vị và phân biệt sự mất đồng dạng của tuyến tiền liệt và theo dõi sau điều trị
mà không phụ thuộc ngƣời khám và có tính lập lại. Ngoài ra có thể sinh
thiết dựa vào cùng lúc hình B-mode và hình đàn hồi, làm tăng độ chính xác
của sinh thiết.
3/ GHÉP THẬN
Số bệnh nhân viêm thận mạn (chronic kidney disease, CKD) và tiếp sau đó
là bệnh lý thận giai đoạn cuối (end-stage renal disease, ESRD), gia tăng và
không đƣợc đánh giá đúng mức. Bệnh thận giai đoạn cuối tăng nhiều trong
thập niên qua do các yếu tố tiên phát nhƣ cao huyết áp, tiểu đƣờng, tăng
lipid máu, béo phì hay nghiện thuốc lá.

SIÊU ÂM ĐÀN HỒI và ỨNG DỤNG LÂM SÀNG
Pag
e99
Supersonic Shear Imaging (SSI) đƣợc chứng minh có khả năng theo dõi
định lƣợng xơ hóa thận (kidney fibrosis) trên chuột và sau đó, đƣợc áp
dụng trên ngƣời. Có các nghiên cứu với đầu dò cong và bản đồ đàn hồi
nhày (viscoelastic properties) của thận ngƣời ghép ở cơ thể sống và đối
chiếu với sinh thiết.
Một nghiên cứu theo dõi trong 8 tuần trên nhóm 50 chuột bị làm xơ hóa vi
cầu thận (glomerulosclerosis) bằng L-Name nhằm khảo sát độ chính xác
của kỹ thuật. Bản đồ đàn hồi định lƣợng của vỏ thận đƣợc thực hiện với
đầu dò linear 8 MHz. Còn trên thận ngƣời ghép, bản đồ đàn hồi định lƣợng
của vỏ thận đƣợc thực hiện với đầu dò cong 2,5MHz.
Kết quả trên động vật cho thấy có sự gia tăng độ đàn hồi vỏ thận từ 9-
25kPa. Kết quả đƣợc đối chiếu với mô học nhƣ tiểu đạm và/hoặc định
lƣợng xơ hóa với 3 màu.
Trên thận ngƣời ghép có 3 nhóm đƣợc khảo sát: nhóm chứng, nhóm đối
tƣợng thận ghép không hoạt động sớm và nhóm thận ghép không hoạt
động muộn. Kết quả thu thập đƣợc ở 49 bệnh nhân với bản đồ đàn hồi ở
sâu 8cm và rộng 10cm cho thấy độ đàn hồi thay đổi giữa các nhóm, tăng
từ 9 đến 50kPa. Đối chiếu với mô học đạt đƣợc sự thống nhất về các dấu
hiệu xơ hóa và độ đàn hồi. Nhƣ vậy, độ đàn hồi có liên quan với xơ hóa
thận.
Vì hầu hết diễn tiến xơ hóa thận là do bệnh viêm thận mạn, việc xác định
không xâm lấn và theo dõi diễn tiến này hẵn sẽ làm thay đổi dự hậu bệnh
lý thận, nếu nhƣ bệnh nhân đƣợc áp dụng các điều trị trúng đích (targeted
therapies).
Với siêu âm đàn hồi ARFI của máy ACUSON S2000, gồm 2 kỹ thuật là
VTQ (Virtual Touch Tissue Quantification : đo định lƣợng tốc độ sóng biến
dạng trong vùng khảo sát ROI, tốc độ đàn hồi SWV [shear wave velocity]
càng lớn mô thận ghép càng cứng do fibrosis) và VTI (Virtual Touch
Tissue Imaging, định tính độ cứng tƣơng đối vùng ROI, tổn thƣơng tối hơn
[darker] mô xung quanh thì càng cứng hơn mô xung quanh).

SIÊU ÂM ĐÀN HỒI và ỨNG DỤNG LÂM SÀNG
Pag
e10
0
Với giá trị cut-off của vận tốc đàn hồi VTQ chủ mô thận của thải ghép ở
phần dƣới (chỗ sinh thiết) SWV=2,81m/s, độ nhạy là 75% và độ đặc hiệu là
64,7%, ROC=0,78 với p=0,004 (Jeong Yeon Cho, 2010).
Kỹ thuật siêu âm đàn hồi ARFI có vai trò tiên lƣợng không xâm lấn trong
bệnh thận thải ghép thận mạn tính (chronic allograft nephropathy, CAN) do
xơ hóa mô kẽ và teo ống thận (interstitial fibrosis and tubular atrophy) và
theo dõi diễn tiến của xơ hoá mô kẽ và teo ống thận.
PHỤ LỤC:
ĐỘ ĐÀN HỒI ARFI THÂN KHÔNG BẾ TẮC và THÂN Ứ NƯỚC DO HẸP KHÚC NỐI BỂ THÂN NIỆU QUẢN AT MEDIC CENTER:
KHẢO SÁT KỸ THUẬT ARFI ĐỐI VỚI THẬN Ứ NƢỚC NGƢỜI LỚN do SỎI NIỆU
QUẢN và do HẸP KHÚC NỐI BỂ THẬN-NIỆU QUẢN
TRẦN NGÂN CHÂU-NGUYỄN THIỆN HUNG
TRUNG TÂM Y KHOA MEDIC HÒA HẢO Tp HCM
Mục tiêu
Thận ứ nƣớc ngƣời lớn có thể do bệnh lý tắc nghẽn (soi, u tiết niệu…) hoặc không tắc nghẽn
(hẹp khúc nối bể thận niệu quản) và có xu hƣớng dẫn đến xơ hóa thận. Trong nghiên cứu này,
chúng tôi so sánh giá trị xung lực bức xạ âm ARFI bằng cách đo vận tốc sóng biến dạng trên
thận ứ nƣớc ngƣời lớn nhằm hƣớng tới bệnh lý tắc nghẽn hay không tắc nghẽn và lƣu ý nếu có
xơ hoá thận.
Phƣơng pháp và đối tƣợng
Đây là nghiên cứu cắt ngang mô tả. Tổng số gồm 63 trƣờng hợp thận ứ nƣớc nhẹ trong đó có 33
trƣong hợp tắc nghẽn do soi niệu quản (nhóm 1) và 30 trƣờng hợp hẹp khúc nối bể thận niệu
quản (nhóm 2); nhóm chứng gồm 36 trƣờng hợp thận không ứ nƣớc. Chúng tôi thực hiện ky
thuật ARFI, với virtual touch tissue quantification (VTQ) - máy Acuson S2000, đặt ROI ở vị trí
mô thận cần đo độ cứng, đo 3 vị trí khác nhau. Dùng phần mềm thống kê Medcalc để so sánh giá
trị ARFI của 2 nhóm.
Kết quả

SIÊU ÂM ĐÀN HỒI và ỨNG DỤNG LÂM SÀNG
Pag
e10
1
Giá trị ARFI trung bình (m/s) ở nhóm thận ứ nƣớc do soi niệu quản là 2,73 ± 0,39m/s và ở nhóm
thận ứ nƣớc do hẹp khúc nối bể thận niệu quản là 1,66 ± 0,16m/s, trong khi ở nhóm chứng là
1,60 ± 0,2m/s. Dùng phép kiểm T, có sự khác biệt có ý nghĩa thống kê giữa 2 nhóm thận ứ nƣớc
(p< 0,0001), giữa thận ứ nƣớc do soi niệu quản với nhóm chứng (p < 0,0001), nhƣng không có
sự khác biệt có ý nghĩa thống kê giữa nhóm ứ nƣớc do hẹp khúc nối bể thận niệu quản với nhóm
chứng.
Kết luận
Đây là kết quả ban đầu của chúng tôi về giá trị ARFI trên thận ứ nƣớc ở ngƣời lớn. Vận tốc đàn
hồi chủ mô thận tăng ở nhóm ứ nƣớc do bệnh lý tắc nghẽn và giúp lƣu ý nếu có xơ hoá thận.
ARFI for OBSTRUCTIVE and with UPJO HYDRONEPHROSIS in ALDULT
ABSTRACT:
We applied ARFI technique from Siemens S2000 to evaluate whether fibrotic process existing in
adult hydronephrosis.
Using 1-4 MHz convex probe we calculated in 3 positions of hydronephotic kidney due
to obstruction [stone, outside compression] (n=33 cases), due to ureteropelvic junction
obstruction [UPJO] (n=30 cases]. We had a control group of normal kidney (n=36 cases).

SIÊU ÂM ĐÀN HỒI và ỨNG DỤNG LÂM SÀNG
Pag
e10
2

SIÊU ÂM ĐÀN HỒI và ỨNG DỤNG LÂM SÀNG
Pag
e10
3
4/ U THẬN:
Dùng siêu âm đàn hồi ARFI để phân biệt carcinôm tế bào thận[renal cell
carcinoma, RCC] với u AML [angiomyolipoma], Jeong Yeon Cho (2010),
giả định u RCC, đặc biệt là clear cell type, cứng hơn chủ mô thận và u
AML. Ở 18 ca u thận nhỏ dƣới 5 cm ở 16 bệnh nhân, với VTI chỉ số ratio of
gray scales của khối u với vỏ thận (T/KG) và với VTQ, chỉ số ratio of
SWVs của khối u với vỏ thận (T/KSWV) đều khác biệt có ý nghĩa thống kê.
Tóm lại, siêu âm đàn hồi mô, cả định tính--nhƣ với static elastography--
hoặc bằng cách sử dụng phƣơng pháp dynamic để tracking (theo dõi)
sóng biến dạng, là kỹ thuật đàn hồi phong phú và phát triển nhanh, hứa
hẹn cải thiện chẩn đoán cho nhiều bệnh lý trong lĩnh vực niệu khoa và các
chuyên khoa khác. Tuy nhiên do còn non trẻ, kỹ thuật siêu âm đàn hồi cần
đƣợc cân nhắc khi áp dụng, thận trọng khi đọc kết quả để tránh những
cạm bẫy do kinh nghiệm còn ít.
Chú thích:
1. Shear Wave: sóng biến dạng, còn gọi là sóng ngang, là một biến
dạng đàn hồi thẳng góc với hƣớng chuyển động của sóng.
Compression Wave: sóng đè nén, còn gọi là sóng dọc, là một đè nén vào
môi trƣờng.
2. Lực bức xạ âm (acoustic radiation force) là kết quả từ momentum
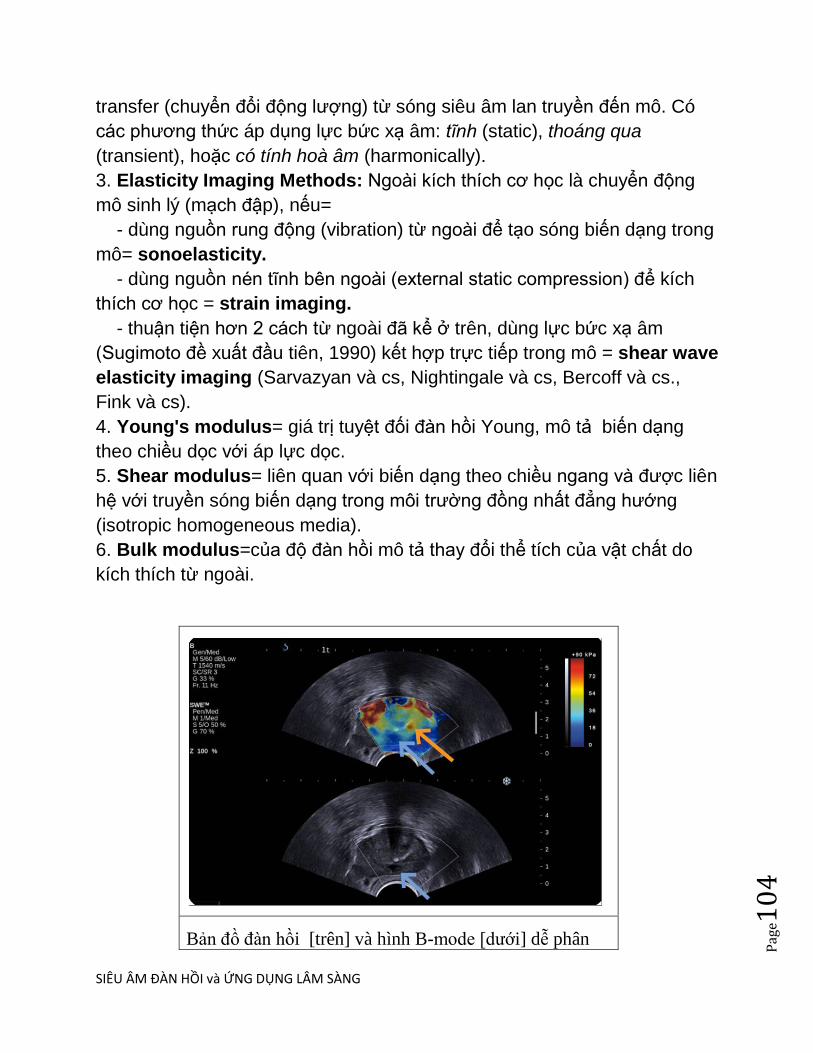
SIÊU ÂM ĐÀN HỒI và ỨNG DỤNG LÂM SÀNG
Pag
e10
4
transfer (chuyển đổi động lƣợng) từ sóng siêu âm lan truyền đến mô. Có
các phƣơng thức áp dụng lực bức xạ âm: tĩnh (static), thoáng qua
(transient), hoặc có tính hoà âm (harmonically).
3. Elasticity Imaging Methods: Ngoài kích thích cơ học là chuyển động
mô sinh lý (mạch đập), nếu=
- dùng nguồn rung động (vibration) từ ngoài để tạo sóng biến dạng trong
mô= sonoelasticity.
- dùng nguồn nén tĩnh bên ngoài (external static compression) để kích
thích cơ học = strain imaging.
- thuận tiện hơn 2 cách từ ngoài đã kể ở trên, dùng lực bức xạ âm
(Sugimoto đề xuất đầu tiên, 1990) kết hợp trực tiếp trong mô = shear wave
elasticity imaging (Sarvazyan và cs, Nightingale và cs, Bercoff và cs.,
Fink và cs).
4. Young's modulus= giá trị tuyệt đối đàn hồi Young, mô tả biến dạng
theo chiều dọc với áp lực dọc.
5. Shear modulus= liên quan với biến dạng theo chiều ngang và đƣợc liên
hệ với truyền sóng biến dạng trong môi trƣờng đồng nhất đẳng hƣớng
(isotropic homogeneous media).
6. Bulk modulus=của độ đàn hồi mô tả thay đổi thể tích của vật chất do
kích thích từ ngoài.
Bản đồ đàn hồi [trên] và hình B-mode [dƣới] dễ phân
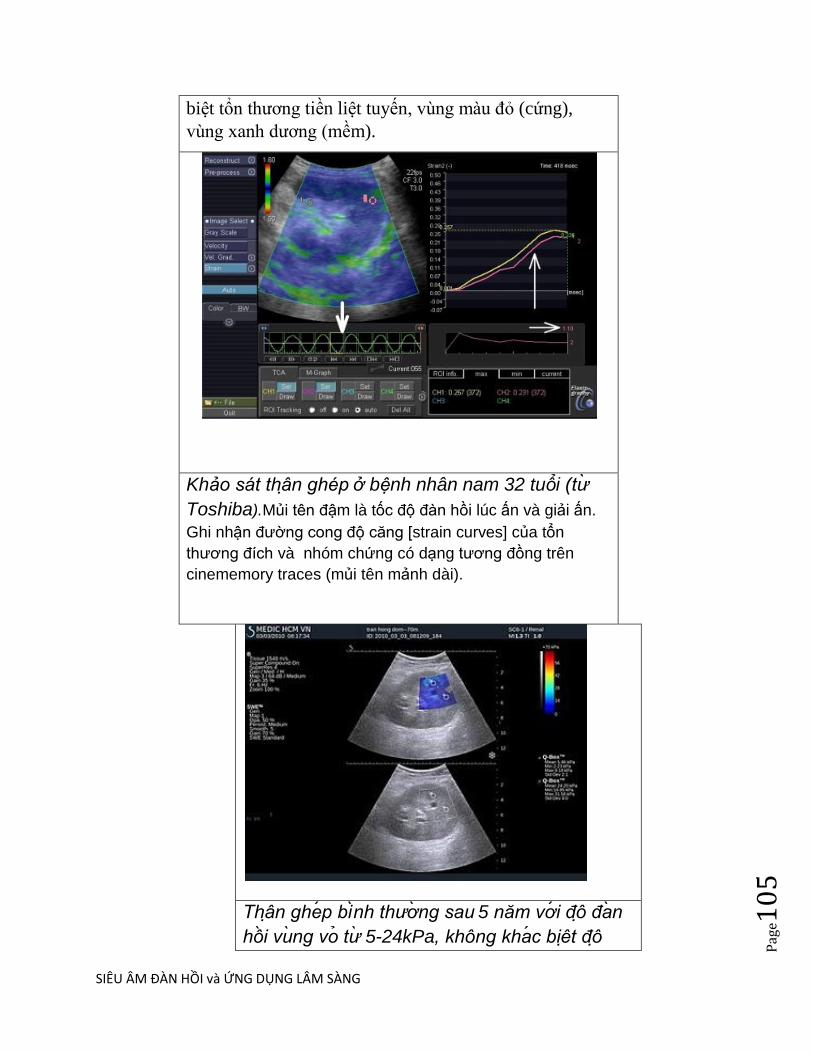
SIÊU ÂM ĐÀN HỒI và ỨNG DỤNG LÂM SÀNG
Pag
e10
5
biệt tổn thƣơng tiền liệt tuyến, vùng màu đo (cứng),
vùng xanh dƣơng (mềm).
Khảo sát thân ghép ở bệnh nhân nam 32 tuổi (tư
Toshiba).Mủi tên đậm là tốc độ đàn hồi lúc ấn và giải ấn.
Ghi nhận đƣờng cong độ căng [strain curves] của tổn
thƣơng đích và nhóm chứng có dạng tƣơng đồng trên
cinememory traces (mủi tên mảnh dài).
Thân ghep binh thương sau 5 năm vơi đô đan
hôi vung vo tư 5-24kPa, không khac biêt đô
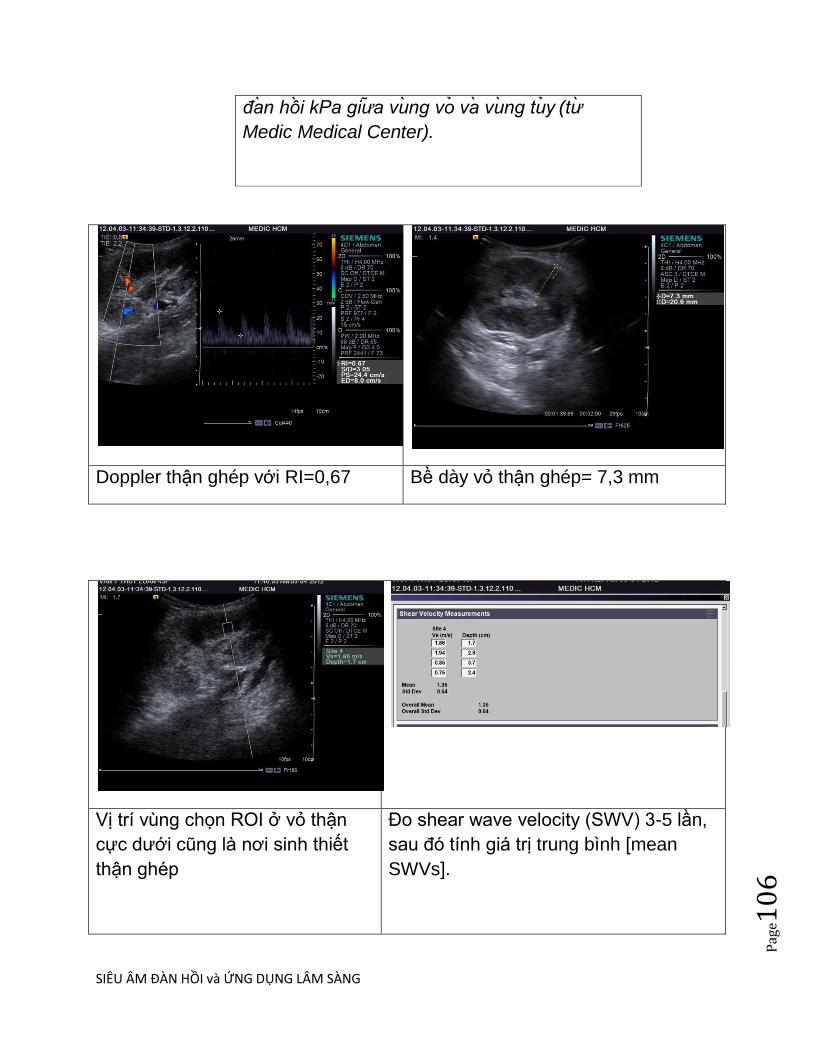
SIÊU ÂM ĐÀN HỒI và ỨNG DỤNG LÂM SÀNG
Pag
e10
6
đan hôi kPa giưa vung vo va vung tuy (tư
Medic Medical Center).
Doppler thận ghép với RI=0,67 Bề dày vỏ thận ghép= 7,3 mm
Vị trí vùng chọn ROI ở vỏ thận
cực dƣới cũng là nơi sinh thiết
thận ghép
Đo shear wave velocity (SWV) 3-5 lần,
sau đó tính giá trị trung bình [mean
SWVs].
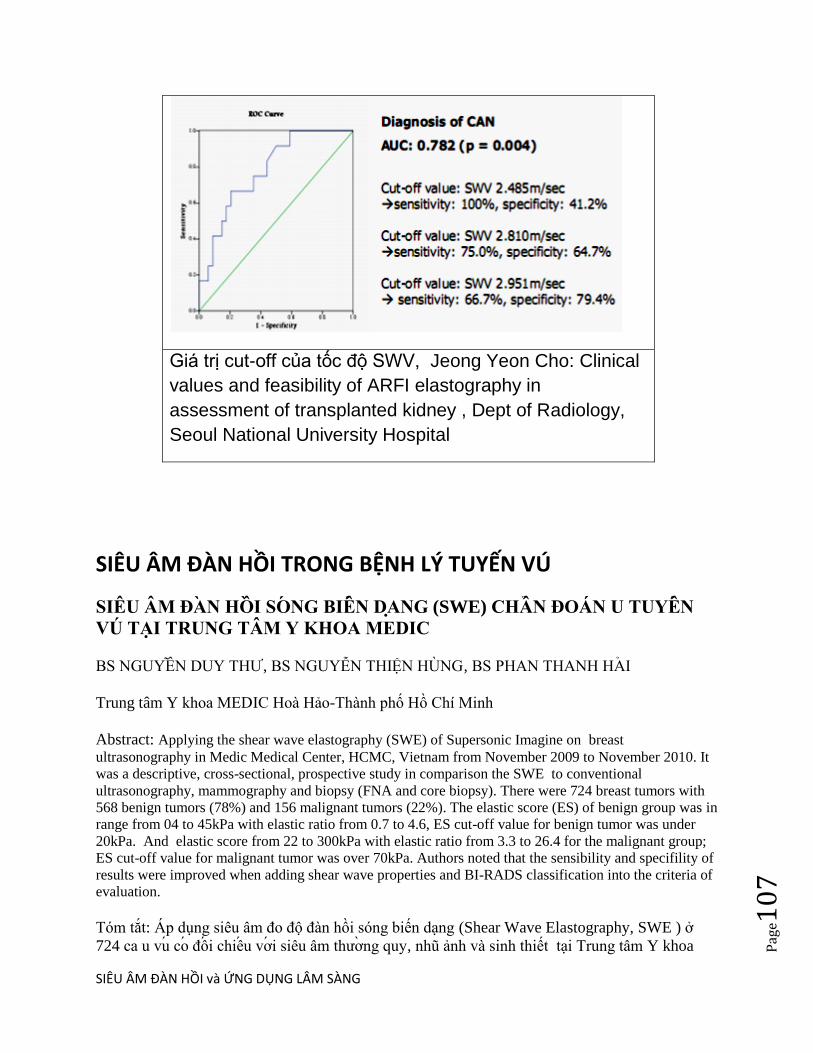
SIÊU ÂM ĐÀN HỒI và ỨNG DỤNG LÂM SÀNG
Pag
e10
7
Giá trị cut-off của tốc độ SWV, Jeong Yeon Cho: Clinical
values and feasibility of ARFI elastography in
assessment of transplanted kidney , Dept of Radiology,
Seoul National University Hospital
SIÊU ÂM ĐÀN HỒI TRONG BỆNH LÝ TUYẾN VÚ
SIÊU ÂM ĐAN HÔI SONG BIÊN DANG (SWE) CHÂN ĐOÁN U TUYÊN
VÚ TẠI TRUNG TÂM Y KHOA MEDIC
BS NGUYÊN DUY THƢ, BS NGUYỄN THIỆN HUNG, BS PHAN THANH HAI
Trung tâm Y khoa MEDIC Hoà Hảo-Thành phố Hồ Chí Minh
Abstract: Applying the shear wave elastography (SWE) of Supersonic Imagine on breast
ultrasonography in Medic Medical Center, HCMC, Vietnam from November 2009 to November 2010. It
was a descriptive, cross-sectional, prospective study in comparison the SWE to conventional
ultrasonography, mammography and biopsy (FNA and core biopsy). There were 724 breast tumors with
568 benign tumors (78%) and 156 malignant tumors (22%). The elastic score (ES) of benign group was in
range from 04 to 45kPa with elastic ratio from 0.7 to 4.6, ES cut-off value for benign tumor was under
20kPa. And elastic score from 22 to 300kPa with elastic ratio from 3.3 to 26.4 for the malignant group;
ES cut-off value for malignant tumor was over 70kPa. Authors noted that the sensibility and specifility of
results were improved when adding shear wave properties and BI-RADS classification into the criteria of
evaluation.
Tóm tắt: Áp dụng siêu âm đo độ đàn hồi sóng biến dạng (Shear Wave Elastography, SWE ) ở
724 ca u vu co đôi chiêu vơi siêu âm thƣơng quy, nhu ảnh và sinh thiết tại Trung tâm Y khoa
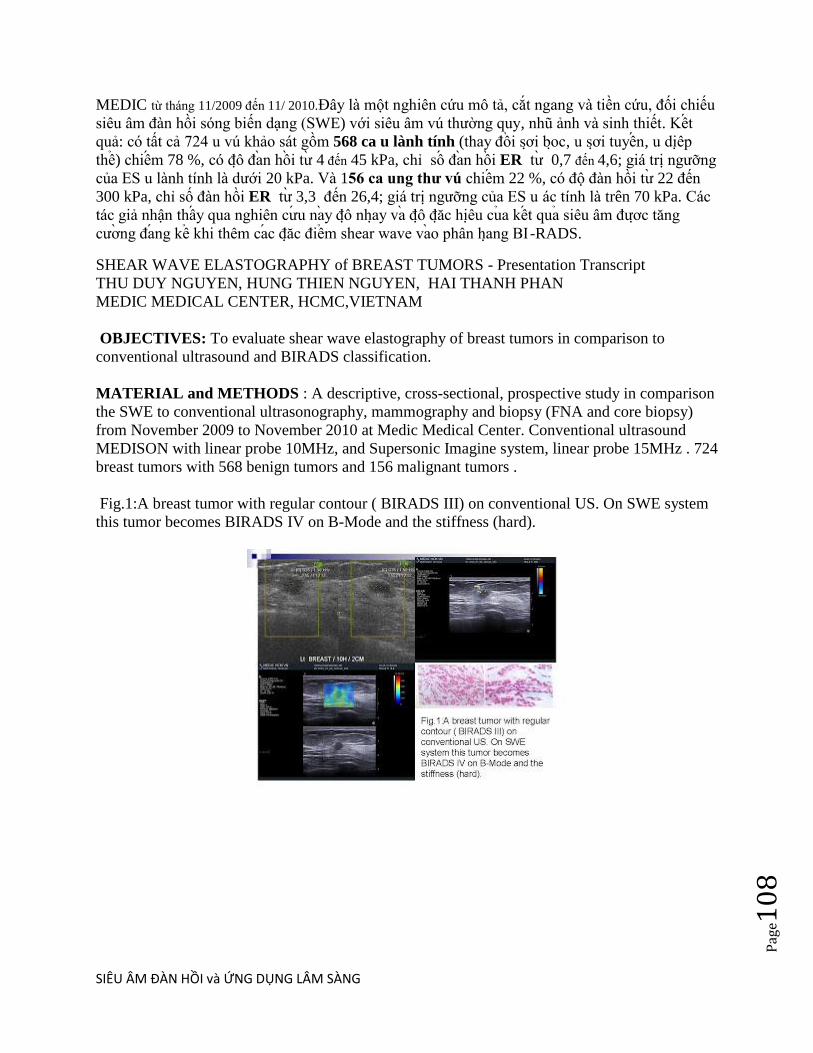
SIÊU ÂM ĐÀN HỒI và ỨNG DỤNG LÂM SÀNG
Pag
e10
8
MEDIC từ tháng 11/2009 đến 11/ 2010.Đây là một nghiên cứu mô tả, cắt ngang và tiền cứu, đối chiếu
siêu âm đàn hồi sóng biến dạng (SWE) với siêu âm vú thƣờng quy, nhu ảnh và sinh thiết. Kêt
quả: có tất cả 724 u vú khảo sát gồm 568 ca u lành tính (thay đôi sơi boc, u sơi tuyên, u diêp
thê) chiêm 78 %, có đô đan hôi tƣ 4 đến 45 kPa, chi sô đan hôi ER tƣ 0,7 đến 4,6; giá trị ngƣỡng
của ES u lành tính là dƣới 20 kPa. Và 156 ca ung thƣ vú chiêm 22 %, có độ đàn hồi tƣ 22 đến
300 kPa, chi số đàn hồi ER tƣ 3,3 đến 26,4; giá trị ngƣỡng của ES u ác tính là trên 70 kPa. Các
tác giả nhận thây qua nghiên cƣu nay đô nhay va đô đăc hiêu cua kêt qua siêu âm đƣơc tăng
cƣơng đang kê khi thêm cac đăc điêm shear wave vao phân hang BI -RADS.
SHEAR WAVE ELASTOGRAPHY of BREAST TUMORS - Presentation Transcript
THU DUY NGUYEN, HUNG THIEN NGUYEN, HAI THANH PHAN
MEDIC MEDICAL CENTER, HCMC,VIETNAM
OBJECTIVES: To evaluate shear wave elastography of breast tumors in comparison to
conventional ultrasound and BIRADS classification.
MATERIAL and METHODS : A descriptive, cross-sectional, prospective study in comparison
the SWE to conventional ultrasonography, mammography and biopsy (FNA and core biopsy)
from November 2009 to November 2010 at Medic Medical Center. Conventional ultrasound
MEDISON with linear probe 10MHz, and Supersonic Imagine system, linear probe 15MHz . 724
breast tumors with 568 benign tumors and 156 malignant tumors .
Fig.1:A breast tumor with regular contour ( BIRADS III) on conventional US. On SWE system
this tumor becomes BIRADS IV on B-Mode and the stiffness (hard).
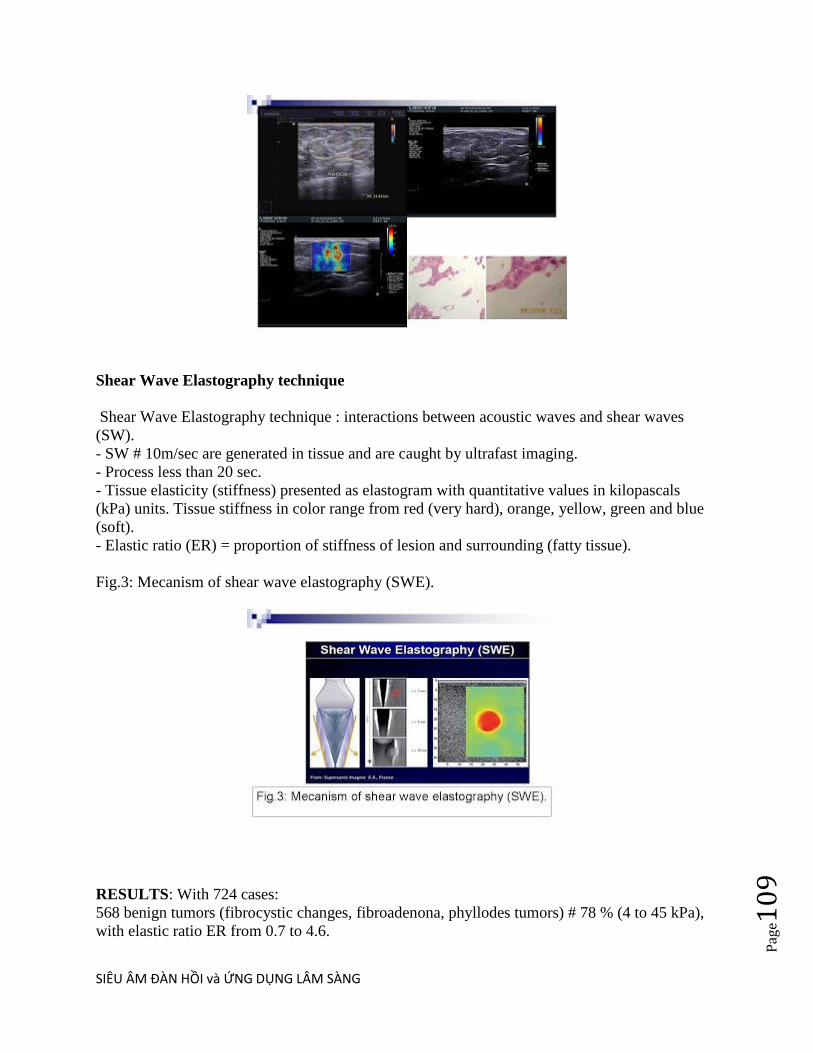
SIÊU ÂM ĐÀN HỒI và ỨNG DỤNG LÂM SÀNG
Pag
e10
9
Shear Wave Elastography technique
Shear Wave Elastography technique : interactions between acoustic waves and shear waves
(SW).
- SW # 10m/sec are generated in tissue and are caught by ultrafast imaging.
- Process less than 20 sec.
- Tissue elasticity (stiffness) presented as elastogram with quantitative values in kilopascals
(kPa) units. Tissue stiffness in color range from red (very hard), orange, yellow, green and blue
(soft).
- Elastic ratio (ER) = proportion of stiffness of lesion and surrounding (fatty tissue).
Fig.3: Mecanism of shear wave elastography (SWE).
RESULTS: With 724 cases:
568 benign tumors (fibrocystic changes, fibroadenona, phyllodes tumors) # 78 % (4 to 45 kPa),
with elastic ratio ER from 0.7 to 4.6.

SIÊU ÂM ĐÀN HỒI và ỨNG DỤNG LÂM SÀNG
Pag
e11
0
156 malignant tumors # 22 % (from 22 to 300 kPa), with ER from 3.3 to 26.4.
Table 1: Distribution of elastic values of benign and malignant breast tumors.
DISCUSSIONS:
Diagnostic criteria= elastogram, dimension, homogeneity, elastic value, and elastic ratio.
1/156 cases of malignant tumor: most of cases with elastic value from 40kPa to 70kPa or more.
14 cases with elastic value less than 40kPa, but ER higher than 4 times.
2/Benign tumors with elastic value of 20kPa. 41 cases (#7%) more than 20kPa but lower than
45kPa: fibroadenoma with great dimension, huge phyllodes tumors (inhomogenous elastogram
with blue color dominant).
3/Proposal management :
- Breast tumors with BIRADS II-III, low stiffness, low ER : follow up.
- Breast tumors with BIRADS III and high stiffness: reclassified to BIRADS IV and biopsy.
- Breast tumors with BIRADS IV and low stiffness:reclassified to BIRADS III and follow up.
With biopsy their results are not false negative.
Elastogram analysis: very high kPa value, no need to check.
With low kPa must refer elastic ratio (ER). The higher ER the higher possibility of malignancy.
4/ Elastogram analysis :
Benign tumor=between blue and yellow code (from soft to hard ) and homogenous.
Malignant tumor: elastogram changes from yellow to red (hard) and homogenous. Because of
central necrosis the center of tumor is always softer than (blue). So need to evaluate altogether
elastic value (stiffness), elastic ratio and elastogram to gain an exact diagnosis.
Elastogram may help choosing the area of biopsy.
Fig.4: Fibroadenoma (BIRADS III) on B-mode and Elastogram (blue)

SIÊU ÂM ĐÀN HỒI và ỨNG DỤNG LÂM SÀNG
Pag
e11
1
Fig.5: B-mode (BIRADS III) but so hard with elastogram, a ductal carcinoma (biopsy).
Fig.6: Microcalcification of ductal carcinoma on high resolution B-mode and Elastogram (hard)
.
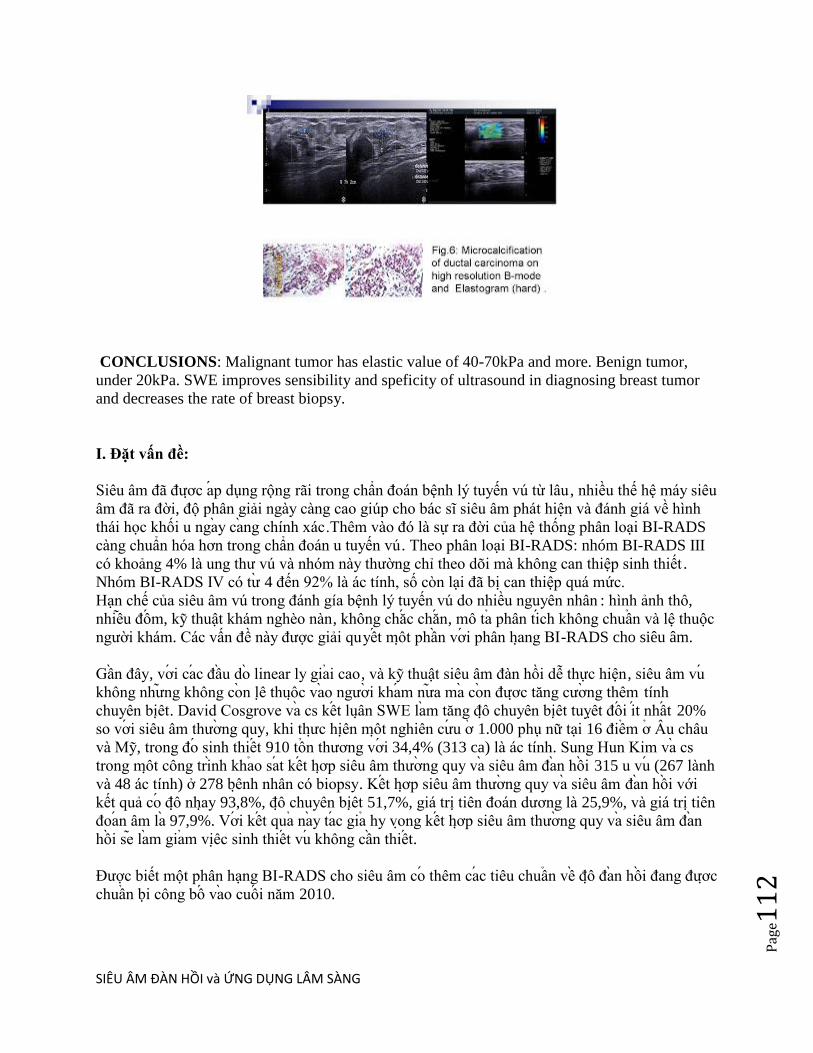
SIÊU ÂM ĐÀN HỒI và ỨNG DỤNG LÂM SÀNG
Pag
e11
2
CONCLUSIONS: Malignant tumor has elastic value of 40-70kPa and more. Benign tumor,
under 20kPa. SWE improves sensibility and speficity of ultrasound in diagnosing breast tumor
and decreases the rate of breast biopsy.
I. Đặt vấn đề:
Siêu âm đã đƣơc ap dụng rộng rãi trong chẩn đoán bệnh lý tuyến vú từ lâu , nhiều thế hệ máy siêu
âm đã ra đời, độ phân giải ngày càng cao giúp cho bác sĩ siêu âm phát hiện và đánh giá về hình
thái học khối u ngay cang chính xác.Thêm vào đó là sự ra đời của hệ thống phân loại BI-RADS
càng chuẩn hóa hơn trong chẩn đoán u tuyến vú. Theo phân loại BI-RADS: nhóm BI-RADS III
có khoảng 4% là ung thƣ vú và nhóm này thƣờng chi theo dõi mà không can thiệp sinh thiết .
Nhóm BI-RADS IV có tƣ 4 đến 92% là ác tính, số con lại đã bị can thiệp quá mức.
Hạn chế của siêu âm vú trong đánh gía bệnh lý tuyến vú do nhiều nguyên nhân : hình ảnh thô,
nhiêu đôm, ky thuật khám nghèo nàn, không chăc chăn, mô ta phân tich không chuân và lệ thuộc
ngƣời khám. Các vấn đề này đƣợc giải quyêt môt phân vơi phân hang BI-RADS cho siêu âm.
Gân đây, vơi cac đâu do linear ly giai cao, và ky thuật siêu âm đàn hồi dễ thực hiện, siêu âm vu
không nhƣng không con lê thuôc vao ngƣơi kham nƣa ma con đƣơc tăng cƣơng thêm tính
chuyên biêt. David Cosgrove va cs kêt luân SWE lam tăng đô chuyên biêt tuyêt đôi it nhât 20%
so vơi siêu âm thƣơng quy, khi thƣc hiên môt nghiên cƣu ơ 1.000 phụ nữ tại 16 điêm ơ Âu châu
và My, trong đo sinh thiêt 910 tôn thƣơng vơi 34,4% (313 ca) là ác tính. Sung Hun Kim va cs
trong môt công trinh khao sat kêt hơp siêu âm thƣơng quy va siêu âm đan hôi 315 u vu (267 lành
và 48 ác tính) ở 278 bênh nhân có biopsy. Kêt hơp siêu âm thƣơng quy va siêu âm đan hôi với
kết quả co đô nhay 93,8%, đô chuyên biêt 51,7%, giá trị tiên đoán dƣơng là 25,9%, và giá trị tiên
đoan âm la 97,9%. Vơi kêt qua nay tac gia hy vong kêt hơp siêu âm thƣơng quy va siêu âm đan
hôi se lam giam viêc sinh thiêt vu không cân thiêt.
Đƣợc biết một phân hạng BI-RADS cho siêu âm co thêm cac tiêu chuân vê đô đan hôi đang đƣơc
chuân bi công bô vao cuôi năm 2010.

SIÊU ÂM ĐÀN HỒI và ỨNG DỤNG LÂM SÀNG
Pag
e11
3
Nhăm lam tăng đô chuyên biêt cua siêu âm vu va tranh phu thuôc ngƣơi kham trong thâp niên
qua, thế hệ máy siêu âm đo độ đàn hồi vu đã ra đời. Đây là lãnh vực mới cua siêu âm chân đoan,
ky thuật này giúp phân loại BI-RADS III- IV chính xác hơn, tƣ đo hạn chế đƣợc sinh thiết vú
không cần thiết.
II.Tổng quan:
Siêu âm đo độ đàn hồi vu là phƣơng pháp không xâm lấn để phát hiện hình ảnh biến dạng của
mô mềm hay để phân loại khối u. Các thông số nhƣ độ dao động (vibration), sự dời chỗ, đè ép,
chi số biến dạng, tốc độ sóng truyền và độ đàn hồi…đêu đƣợc dung để đánh giá đô cƣng. Một
khối u hay tổn thƣơng nghi ngờ ác tính thƣờng cứng hơn mô lành từ 4 đến 26 lần. Khi bị ấn hay
bị rung, u ít biến dạng hơn mô lành xung quanh.
Siêu âm đo độ đàn hồi vu là phƣơng pháp có giá rẻ hơn, nhanh hơn và thuận tiện hơn các ky
thuật khác nhƣ cộng hƣởng từ đàn hồi (magnetic resonance elastography, MRE).
Ky thuật đo đô đan hôi song biên dang (Shear Wave Elastography, SWE) của SUPERSONIC
IMAGINE dung kham vu tai Trung tâm Medic có độ phân giải rất cao vơi đâu do l inear 15MHz,
tín hiệu Doppler cực nhạy, chức năng đo độ đàn hồi không lệ thuộc ngƣời khám vì không cần
phải ấn khám, định lƣợng đƣợc va co tinh lập lại kết quả (reproducible).
Ky thuật đo đô đan hôi song biên dang (SWE) là phƣơng tiện tƣơng tác giữa sóng siêu âm
thƣơng quy va song biên dang đê xac đinh đô đan hôi mô tuyên vu va phat hiên khôi u khi đo
đƣơc đô cƣng cua u. Sóng biến dạng là loại sóng siêu âm truyền ngang đƣợc tao ra trong mô
cứng để làm biến dạng nhất thời mà không làm thay đổi dung lƣợng và mật độ. Khi phát hiện tổn
thƣơng, ngƣời khám giữ yên đầu do trên mặt da trong vài giây mà không đè ép và ấn nút hoạt
hóa trên bàn phím. Sóng biến dạng truyền chậm, ít hơn 10m/giây trong mô, đƣợc tạo ra trong mô
và đƣợc bắt bằng công nghệ tạo hình siêu nhanh (ultrafast imaging), toàn bộ tiến trình chi trong
khoảng ít hơn 20 giây.

SIÊU ÂM ĐÀN HỒI và ỨNG DỤNG LÂM SÀNG
Pag
e11
4
Tôc đô lan truyên cua song biên dang liên quan trƣc tiêp vơi đô đan hôi mô . Tôc đô lan truyên
của sóng biến dạng đƣợc tính toán va đô đan hôi mô đƣơc hiên thi thanh đơn vi kilopascals (kPa)
trên ban đô đan hôi (elastogram) màu mã hóa của vùng đƣợc chọn ROI (region of interest). Độ
cứng của mô đƣợc hiển thị trong một khoảng phân bố từ đo sậm (rất cứng) rồi màu cam, vàng,
xanh lá cây cho đến màu xanh dƣơng (rất mềm).Môi điêm anh mau (pixel) trên ban đô đan hôi
màu mã hóa có một giá trị kilopascal.Tâp hợp lai tât ca thanh đô đan hôi mô tai chô va tƣc thi,
đƣơc hiển thị trên ban đô đan hôi mau ma hoa ngay trên man hinh may siêu âm .Giá trị độ cứng
của tổn thƣơng và ti lệ độ cứng giữa tổn thƣơng và mô lành xung quanh (thƣờng là mô mỡ), gọi
là chi số đàn hồi (elastic ratio), cung đƣợc ghi nhận.
H.2: Cơ chế hoạt động của siêu âm đàn hồi sóng biến dạng (SWE).
Trong khi đo, các ky thuật siêu âm đàn hồi quy ƣớc là đàn hồi strain hay tĩnh (static), băng sƣ đe
nén cơ học trên bề mặt cơ thể để làm mô trong sâu biến dạng. Ngƣơi kham ân vao mô và máy
siêu âm tinh toan rồi biêu diên sƣ biên dang môt cach không thât; ky thuật này lại không định
lƣơng đƣơc, có độ lập lại thấp và lệ thuộc vào ngƣời khám.
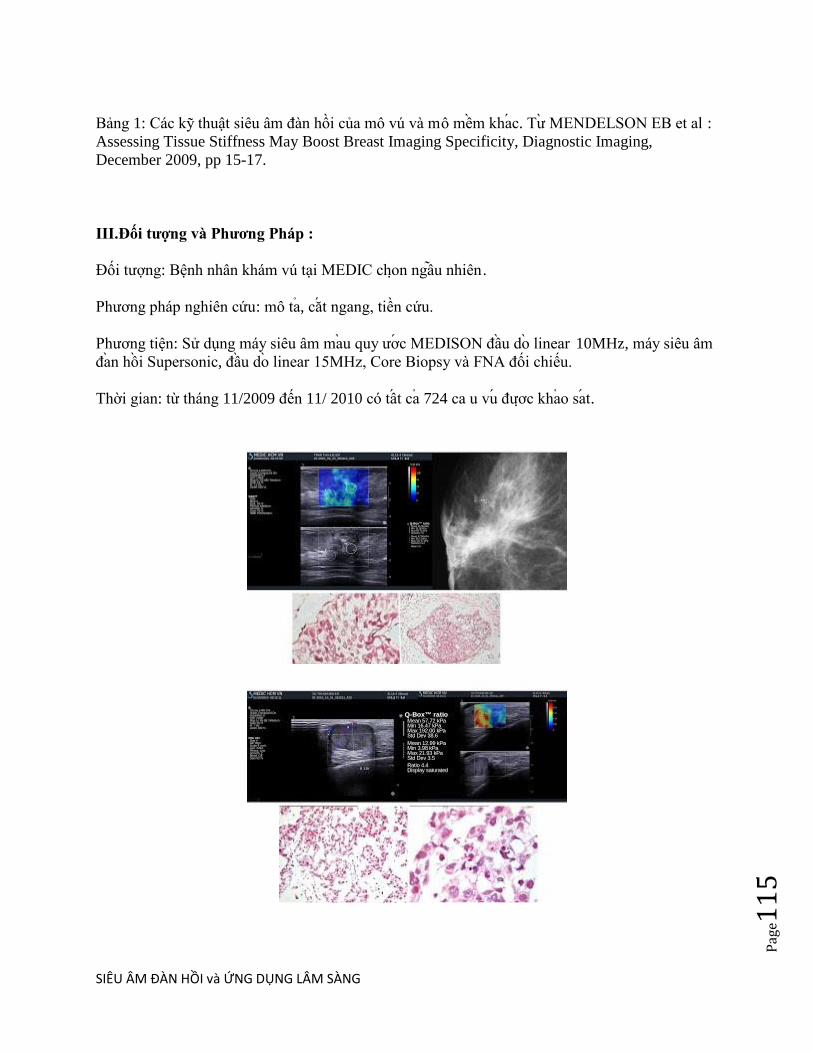
SIÊU ÂM ĐÀN HỒI và ỨNG DỤNG LÂM SÀNG
Pag
e11
5
Bảng 1: Các ky thuật siêu âm đàn hồi của mô vú và mô mêm khac. Tƣ MENDELSON EB et al :
Assessing Tissue Stiffness May Boost Breast Imaging Specificity, Diagnostic Imaging,
December 2009, pp 15-17.
III.Đối tƣợng và Phƣơng Pháp :
Đối tƣợng: Bệnh nhân khám vú tại MEDIC chon ngâu nhiên.
Phƣơng pháp nghiên cứu: mô ta, căt ngang, tiền cứu.
Phƣơng tiện: Sử dụng máy siêu âm mau quy ƣơc MEDISON đâu do linear 10MHz, máy siêu âm
đan hôi Supersonic, đâu do linear 15MHz, Core Biopsy và FNA đối chiếu.
Thời gian: từ tháng 11/2009 đến 11/ 2010 có tât ca 724 ca u vu đƣơc khao sat.

SIÊU ÂM ĐÀN HỒI và ỨNG DỤNG LÂM SÀNG
Pag
e11
6
IV.Kết quả:
Bảng 2:Phân bô gia tri đô đan hôi cua u vu lanh tinh va ac tinh.
Nhận xét: Trong tổng số 724 ca:
- 568 ca u lành tính (thay đôi sơi boc, u sơi tuyên, u diêp thê)….. # 78 % (tƣ 4 đến 45 kPa), chi
sô đan hôi ER tƣ 0,7đến 4,6.
- 156 ca ung thƣ vú ......................... # 22 % (tƣ 22 đến 300 kPa), chi số đàn hồi ER từ 3,3 đến
26,4.
Chú thích:
*kPa :độ cứng đƣợc đo bằng đơn vị kiloPascal
*ER (elastic ratio): ti lệ độ cứng của mô u so với mô lành bên cạnh
V.Bàn luận:
Các tiêu chuẩn chẩn đoán cho mỗi tổn thƣơng vú là: hình dạng bản đồ màu, kích thƣớc, tính
đông nhât, giá trị trung bình của độ đàn hồi và sự tƣơng phản của độ đàn hôi giƣa tôn thƣơng va
mô mơ (ER, elastic ratio)
1.Trong số 156 trƣờng hợp ung thƣ vú, đa số là hơn 40kPa, gần nhƣ chắc chắn ung thƣ vú khi độ
cứng hơn 70kPa. Số con lại rất ít (14 trƣờng hợp) dƣới 40kPa.Những trƣờng hợp này lai có ER
cao hơn 4 lần.
2.Phần lớn u lành tính tuyến vú có độ cứng quanh 20kPa. Số ít con lại : 41 trƣờng hợp (#7%) có
độ cứng trên 20kPa nhƣng thâp hơn 45kPa. Những trƣờng hợp này là u sợi tuyến to , u diệp thể

SIÊU ÂM ĐÀN HỒI và ỨNG DỤNG LÂM SÀNG
Pag
e11
7
lành kích thƣớc lớn, do đó tạo ra sức căng bề mặt lơn nên có độ cứng cao. Nhƣng bản đồ màu
không đồng nhất, chi cứng những vị trí gần đầu do, vị trí xa hơn vẫn thể hiên màu xanh (mềm).
3.Với những u tuyến vú có phân loại BI-RADS II-III, có độ cứng thấp, ti lệ ER thấp, chúng ta
bằng long với chẩn đoán u lành tính, chi theo dõi.
Với u có BI-RADS III cộng với độ cứng cao, chúng ta chuyển lên BI-RADS IV và chi định sinh
thiết ngay.
Với BI-RADS IV cộng với độ cứng thấp chúng ta chuyển xuống BI-RADS III và theo dõi. Nếu
chúng ta đã sinh thiết rồi, kết quả lành tính thì càng yên tâm hơn về không có âm tính giả.
Khi phân tích kết quả elastogram: kPa quá cao, chúng ta không cần bàn cai nữa. Khi kPa thấp,
chúng ta phải quan sát thêm tỷ lệ đan hôi (ER).Tỷ lệ này càng cao thì khả năng ác tính cao.
4.Phân tich bản đồ màu trên hình SWE :
U lành tính:bản đồ màu nằm khoảng giữa màu xanh dƣơng đến gần vàng ( từ mềm đên cứng)
phân bố khá đồng nhất.
U ác tính: bản đồ màu lệch hẳn về phía màu vàng đến đo (cứng) và phân bố khá đồng đều từ
ngoài vào trong, từ trên xuống dƣới. Trung tâm bƣớu thƣờng mềm hơn vì mô hoại tử.
Vì vậy chúng ta phải phối hợp tất cả những yếu tố ( kPa, ER và bản đồ màu) để có môt chẩn
đoán đô đan hôi chính xác.
VI. Kết luận va Đê nghi:
Nên đặt vấn đề ứng dụng siêu âm đan hôi song biên dang (SWE) vào trong hệ thống BI-RADS,
sau khi khảo sát về hình thái học, động học (Doppler) và cuối cùng là đo độ đàn hồi khối u để
xếp hạng BI-RADS chinh xac.
Đối chiếu với phân hạng BI-RADS: Nhiêu tôn thƣơng không xac đinh BI-RADS III va IV đƣơc
tái phân hạng và giảm đƣợc việc sinh thiết khi có thêm đánh giá của SWE. Qua nghiên cƣu nay
đa tăng đô nhay va đô đăc hiêu đang kê khi thêm cac đăc điêm shear wave vao phân hang BI-
RADS.
Nên phân tích bản đồ màu để góp phần chẩn đoán phân biệt, chọn lựa vị trí sinh thiết (nên sinh
thiết tại những vị trí cứng (màu đo), vì nếu lấy nhằm những vị trí hoại tử hay những ổ dịch (màu
xanh dƣơng hoặc mất tín hiệu) thì kết quả sẽ không phu hơp.
Sự tiến bộ của công nghệ siêu âm đã làm cho việc khảo sát độ cứng mô vu (phát hiện ác tính) trở
nên đơn giản, chi nhƣ việc khám sàng lọc sức khoẻ ban đầu. Đối chiếu với lâm sàng và chụp nhu
ảnh, bệnh nhân đƣợc sinh thiêt chỗ nghi ngờ dƣa vao ban đô đan hôi nhăm phát hiện đung các vi
trí ác tính của khối u vú giúp quyết định xử trí thích hợp và kịp thời.

SIÊU ÂM ĐÀN HỒI và ỨNG DỤNG LÂM SÀNG
Pag
e11
8
Khảo sát độ cứng mô vú bằng ky thuật siêu âm đàn hồi sóng biến dạng (SWE) kêt hơp vơi siêu
âm quy ƣơc va sinh thiêt chăc chăn se lam tăng đô tin cây chân đoan cua siêu âm MEDIC trong
bênh ly u tuyên vu.
Tài liệu tham khảo:
1. COSGROVE D.: Imaging Shear Waves for Sonoelastography, Imaging Technology News,
June 2009.
2. KONOFAGOU E.E.: Quo vadis Elasticity Imaging? Ultrasonics, 2004 Apr; 42(1-9):331-336.
3. MENDELSON E.B. et al : Assessing Tissue Stiffness May Boost Breast Imaging Specificity,
Diagnostic Imaging, December 2009, pp 15-17.
4. SOUQUET J. (2009): Taking Ultrasound to the Next Level with Shear Wave Elastography,
Diagnostic Journal, Vol V No 4, pp 8-9.

SIÊU ÂM ĐÀN HỒI và ỨNG DỤNG LÂM SÀNG
Pag
e11
9
ARFI TRONG U VÚ
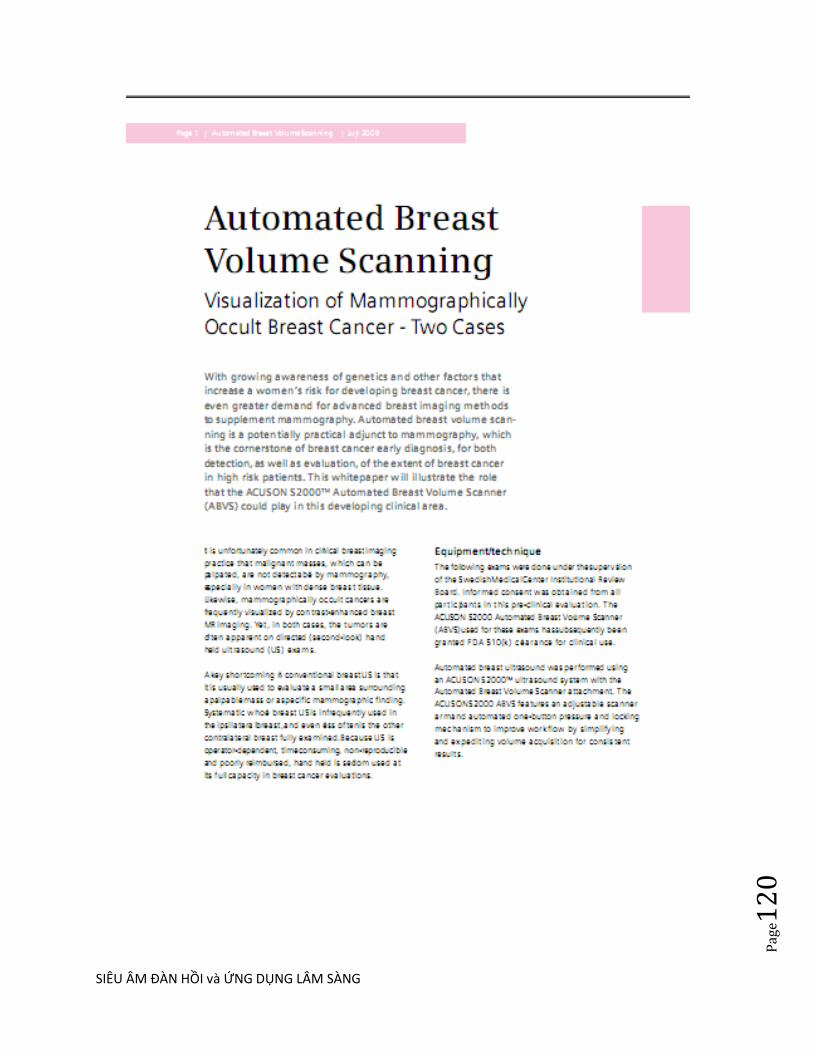
SIÊU ÂM ĐÀN HỒI và ỨNG DỤNG LÂM SÀNG
Pag
e12
0
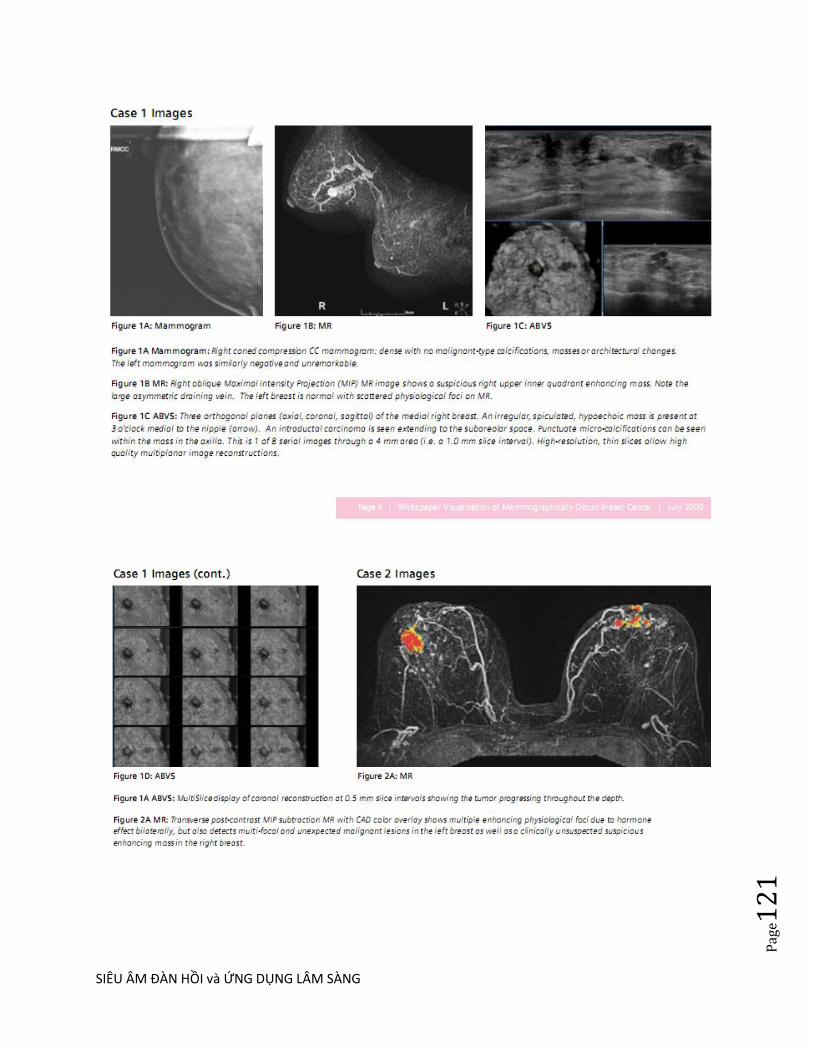
SIÊU ÂM ĐÀN HỒI và ỨNG DỤNG LÂM SÀNG
Pag
e12
1
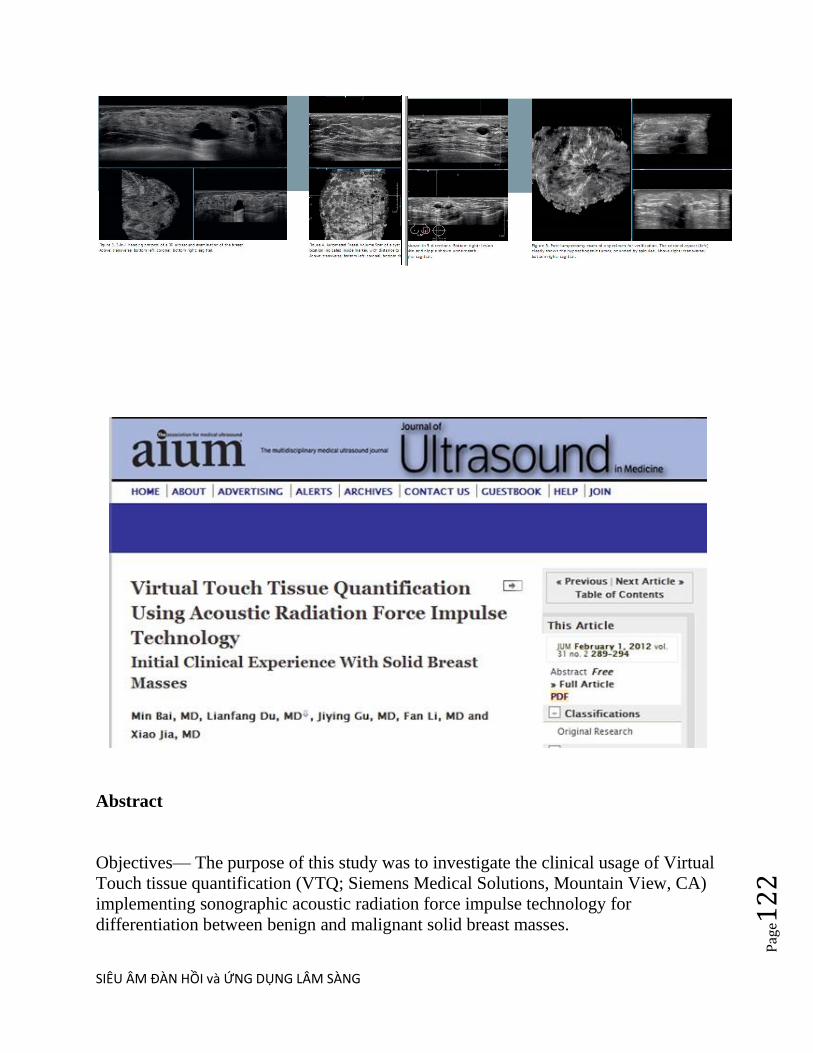
SIÊU ÂM ĐÀN HỒI và ỨNG DỤNG LÂM SÀNG
Pag
e12
2
Abstract
Objectives— The purpose of this study was to investigate the clinical usage of Virtual
Touch tissue quantification (VTQ; Siemens Medical Solutions, Mountain View, CA)
implementing sonographic acoustic radiation force impulse technology for
differentiation between benign and malignant solid breast masses.

SIÊU ÂM ĐÀN HỒI và ỨNG DỤNG LÂM SÀNG
Pag
e12
3
Methods— A total of 143 solid breast masses were examined with VTQ, and their
shear wave velocities (SWVs) were measured. From all of the masses, 30 were
examined by two independent operators to evaluate the reproducibility of the results
of VTQ measurement. All masses were later surgically resected, and the histologic
results were correlated with the SWV results. A receiver operating characteristic curve
was calculated to assess the diagnostic performance of VTQ.
Results— A total of 102 benign lesions and 41 carcinomas were diagnosed on the
basis of histologic examination. The VTQ measurements performed by the two
independent operators yielded a correlation coefficient of 0.885. Applying a cutoff
point of 3.065 m/s, a significant difference (P < .001) was found between the
SWVs of the benign (mean ± SD, 2.25 ± 0.59 m/s) and malignant (5.96 ± 2.96 m/s)
masses. The sensitivity, specificity, and area under the receiver operating
characteristic curve for the differentiation were 75.6%, 95.1%, and 85.6%,
respectively. When the repeated non-numeric result X.XX of the SWV measurements
was designated as an indicator of malignancy, the sensitivity, specificity, and accuracy
were 63.4%, 100%, and 89.5%.
Conclusions— Virtual Touch tissue quantification can yield reproducible and
quantitative diagnostic information on solid breast masses and serve as an effective
diagnostic tool for differentiation between benign and malignant solid masses.
Breast cancer is a serious health threat worldwide and also the number one killer of
women in China. For successful management of breast cancer, early detection is the
key. Sonography has a long-established role in the assessment of mammographic and
palpable abnormalities in the breast. It has been proven useful to differentiate benign
and malignant solid masses.
In addition to conventional sonography, elastography is presently used to aid the
differential diagnosis because it can yield information not only on the morphologic
characteristics but also on the tissue elasticity of the masses. However, this technique
has its own limitations: it is a qualitative evaluation method in which the acquisition
of strain images requires external compression.
Now, a new trend has arisen, which applies acoustic radiation force impulse (ARFI)
imaging to elastography. This technique requires no external compression and
exploits short-duration acoustic radiation forces to generate localized tissue
displacements. Such displacements can be tracked by sonographic correlation-based
means and are related to the viscoelastic properties of local soft tissue. As such, ARFI
imaging can enable qualitative visual and quantitative value measurements, and it has
SIÊU ÂM ĐÀN HỒI và ỨNG DỤNG LÂM SÀNG
Pag
e12
4
so far been used to delineate deep tissue structures via its viscoelastic characteristics
in numerous applications.
Recently, Virtual Touch tissue quantification (VTQ; Siemens Medical Solutions,
Mountain View, CA), which uses ARFI technology, has become available for
diagnosis of superficial tissue lesions. However, to our knowledge, the diagnostic
performance of this approach in solid breast masses has not yet been evaluated. The
purpose of this study was to investigate the clinical use of VTQ for differentiation
between benign and malignant solid breast masses.
Materials and Methods
Patients
The study was approved by the Institutional Review Board and Ethics Committee of
Shanghai First People‘s Hospital, and all participants signed informed consent forms
before the study started. From January 2011 to May 2011, a total of 108 women (age
range, 19–87 years; mean age, 44 years) participated in the study. All of the patients
were recruited on the basis that they had been suspected to have solid breast masses
based on conventional sonographic examinations. Among all of the patients, 83 had
solitary masses, and 25 had multiple masses. When multiple masses were found,
masses larger than 0.5 × 0.6 cm were evaluated. Hence, a total of 143 masses in the
108 patients constituted the sample.
Conventional Sonography and VTQ
All sonographic examinations were performed by one of two radiologists, each of
whom had no less than 11 years of experience in breast sonography and were also
well trained in VTQ. Examinations of 30 masses were performed by both radiologists
independently to evaluate the reproducibility of the VTQ results. Both the
conventional sonographic and VTQ measurements were performed with an Acuson
S2000 ultrasound system (Siemens Medical Solutions) using a linear 9-MHz
multifrequency transducer.
Virtual Touch tissue quantification tracks a shear wave in the region of interest that
travels perpendicular to the direction of the acoustic push pulse and calculates the
speed of the wave=10 m/s. The stiffer the tissue is, the greater the shear wave velocity
(SWV) will be. In this way, VTQ can provide numeric values offering quantitative
information on the tissue stiffness at a precise image-based anatomic location. At
present, VTQ can be integrated into the Acuson S2000 system and performed with a
conventional 9-MHz superficial transducer during a routine sonographic examination
without any special preparations.
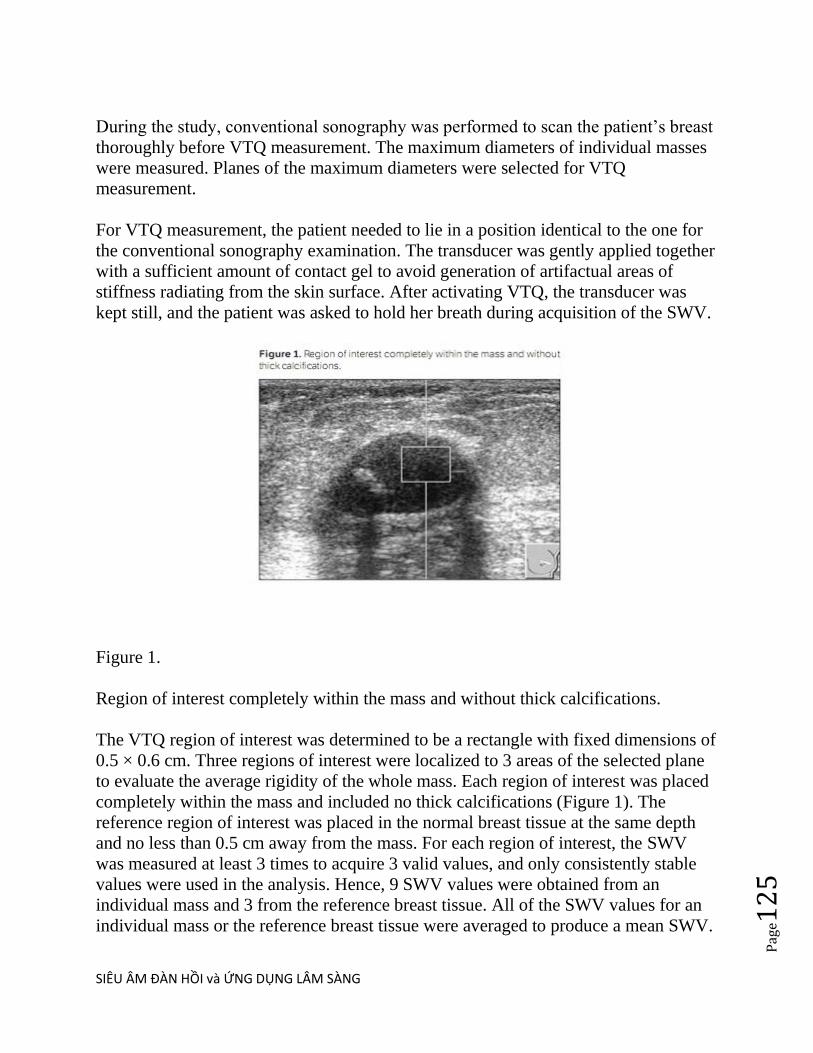
SIÊU ÂM ĐÀN HỒI và ỨNG DỤNG LÂM SÀNG
Pag
e12
5
During the study, conventional sonography was performed to scan the patient‘s breast
thoroughly before VTQ measurement. The maximum diameters of individual masses
were measured. Planes of the maximum diameters were selected for VTQ
measurement.
For VTQ measurement, the patient needed to lie in a position identical to the one for
the conventional sonography examination. The transducer was gently applied together
with a sufficient amount of contact gel to avoid generation of artifactual areas of
stiffness radiating from the skin surface. After activating VTQ, the transducer was
kept still, and the patient was asked to hold her breath during acquisition of the SWV.
Figure 1.
Region of interest completely within the mass and without thick calcifications.
The VTQ region of interest was determined to be a rectangle with fixed dimensions of
0.5 × 0.6 cm. Three regions of interest were localized to 3 areas of the selected plane
to evaluate the average rigidity of the whole mass. Each region of interest was placed
completely within the mass and included no thick calcifications (Figure 1). The
reference region of interest was placed in the normal breast tissue at the same depth
and no less than 0.5 cm away from the mass. For each region of interest, the SWV
was measured at least 3 times to acquire 3 valid values, and only consistently stable
values were used in the analysis. Hence, 9 SWV values were obtained from an
individual mass and 3 from the reference breast tissue. All of the SWV values for an
individual mass or the reference breast tissue were averaged to produce a mean SWV.
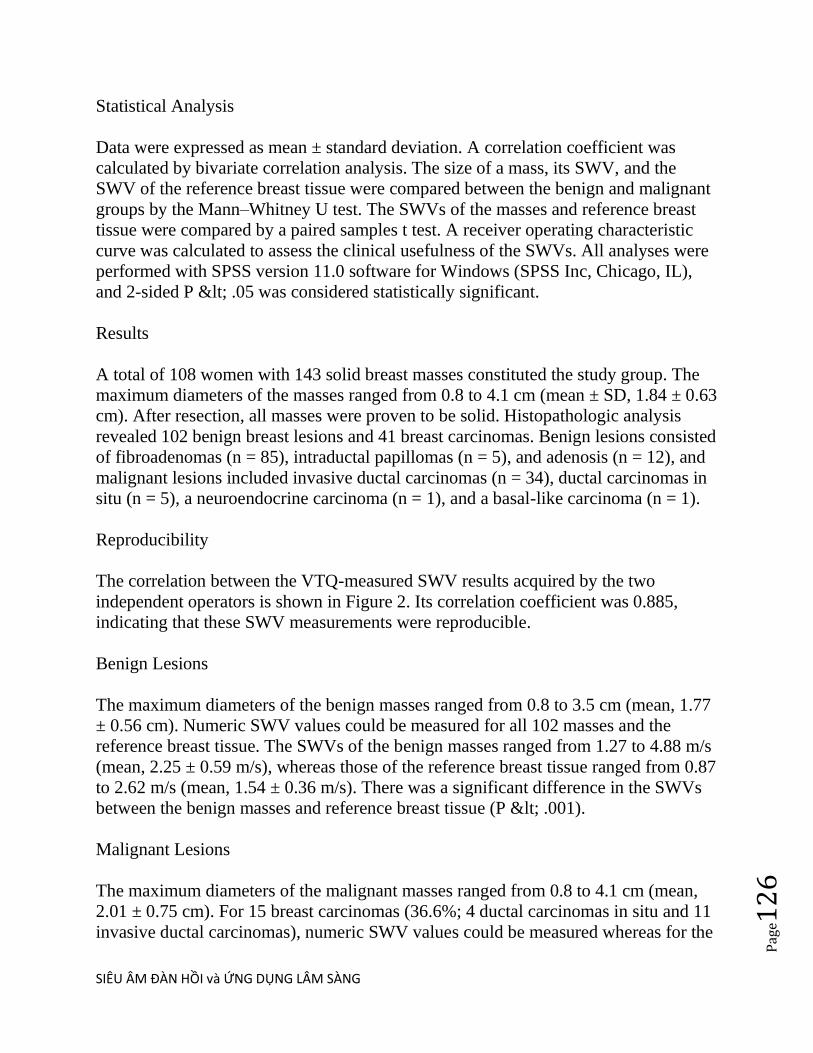
SIÊU ÂM ĐÀN HỒI và ỨNG DỤNG LÂM SÀNG
Pag
e12
6
Statistical Analysis
Data were expressed as mean ± standard deviation. A correlation coefficient was
calculated by bivariate correlation analysis. The size of a mass, its SWV, and the
SWV of the reference breast tissue were compared between the benign and malignant
groups by the Mann–Whitney U test. The SWVs of the masses and reference breast
tissue were compared by a paired samples t test. A receiver operating characteristic
curve was calculated to assess the clinical usefulness of the SWVs. All analyses were
performed with SPSS version 11.0 software for Windows (SPSS Inc, Chicago, IL),
and 2-sided P < .05 was considered statistically significant.
Results
A total of 108 women with 143 solid breast masses constituted the study group. The
maximum diameters of the masses ranged from 0.8 to 4.1 cm (mean ± SD, 1.84 ± 0.63
cm). After resection, all masses were proven to be solid. Histopathologic analysis
revealed 102 benign breast lesions and 41 breast carcinomas. Benign lesions consisted
of fibroadenomas (n = 85), intraductal papillomas (n = 5), and adenosis (n = 12), and
malignant lesions included invasive ductal carcinomas (n = 34), ductal carcinomas in
situ (n = 5), a neuroendocrine carcinoma (n = 1), and a basal-like carcinoma (n = 1).
Reproducibility
The correlation between the VTQ-measured SWV results acquired by the two
independent operators is shown in Figure 2. Its correlation coefficient was 0.885,
indicating that these SWV measurements were reproducible.
Benign Lesions
The maximum diameters of the benign masses ranged from 0.8 to 3.5 cm (mean, 1.77
± 0.56 cm). Numeric SWV values could be measured for all 102 masses and the
reference breast tissue. The SWVs of the benign masses ranged from 1.27 to 4.88 m/s
(mean, 2.25 ± 0.59 m/s), whereas those of the reference breast tissue ranged from 0.87
to 2.62 m/s (mean, 1.54 ± 0.36 m/s). There was a significant difference in the SWVs
between the benign masses and reference breast tissue (P < .001).
Malignant Lesions
The maximum diameters of the malignant masses ranged from 0.8 to 4.1 cm (mean,
2.01 ± 0.75 cm). For 15 breast carcinomas (36.6%; 4 ductal carcinomas in situ and 11
invasive ductal carcinomas), numeric SWV values could be measured whereas for the

SIÊU ÂM ĐÀN HỒI và ỨNG DỤNG LÂM SÀNG
Pag
e12
7
remaining 26 (63.4%; 1 ductal carcinoma in situ, 1 neuroendocrine carcinoma, 1
basal-like carcinoma, and 23 invasive ductal carcinomas), all or part of the SWV
measurements produced non-numeric results, which were all expressed as X.XX. It
was known that the SWV values set by the system, representing the solid biological
tissue values of all measurements, should be within the range of 0 to 9.10 m/s. In our
study, X.XX measured in the solid target using a rigorous method was replaced by a
value of 9.10, and in this way, the SWVs of the malignant masses were represented by
a range of values from 1.17 to 9.10 m/s (mean, 5.96 ± 2.96 m/s).
Contrarily, all SWVs of the reference breast tissue were numeric, ranging from 0.81 to
2.95 m/s (mean, 1.68 ± 0.54m/s). There was a significant difference in the SWVs
between the malignant masses and reference breast tissue (P< .001).
Benign and Malignant Group Comparison
A comparison of the sizes and SWVs between the benign and malignant groups is
shown in Table 1. The SWVs of the malignant masses were significantly faster than
those of the benign masses (P< .001; Figure 3).
Figure 2.
Correlation between the shear wave velocity (SWV) results acquired by the two
independent operators from the first 30 masses (r = 0.885).
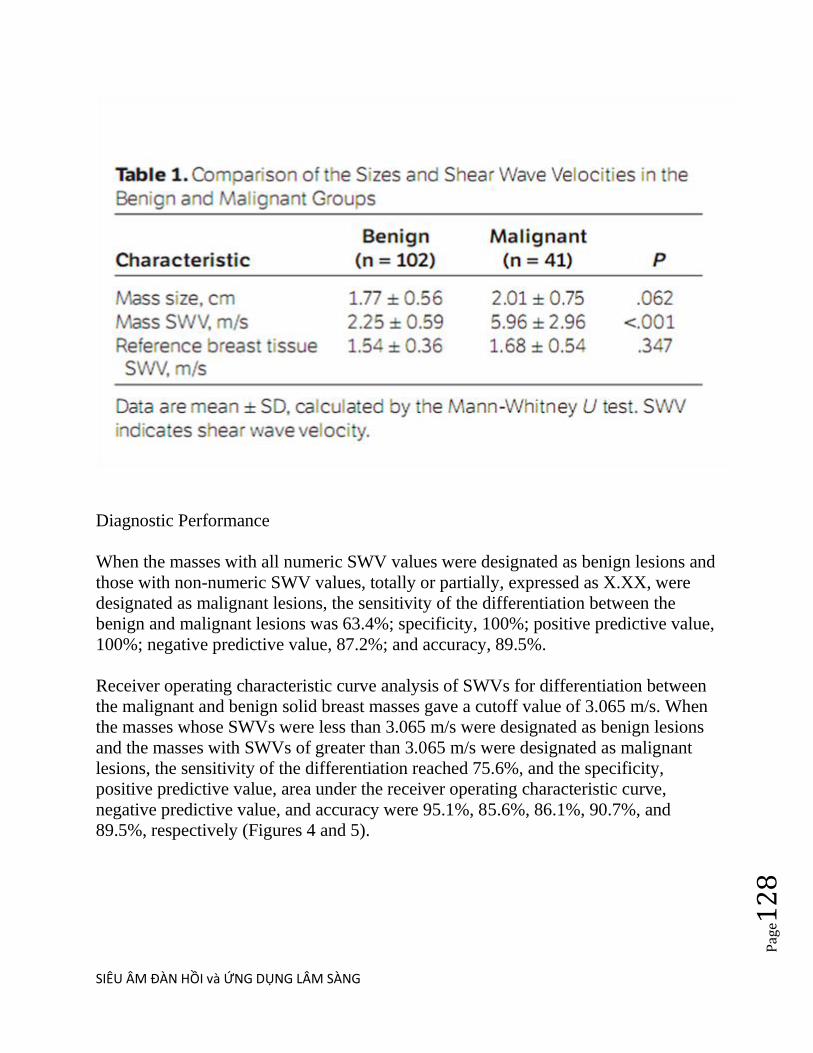
SIÊU ÂM ĐÀN HỒI và ỨNG DỤNG LÂM SÀNG
Pag
e12
8
Diagnostic Performance
When the masses with all numeric SWV values were designated as benign lesions and
those with non-numeric SWV values, totally or partially, expressed as X.XX, were
designated as malignant lesions, the sensitivity of the differentiation between the
benign and malignant lesions was 63.4%; specificity, 100%; positive predictive value,
100%; negative predictive value, 87.2%; and accuracy, 89.5%.
Receiver operating characteristic curve analysis of SWVs for differentiation between
the malignant and benign solid breast masses gave a cutoff value of 3.065 m/s. When
the masses whose SWVs were less than 3.065 m/s were designated as benign lesions
and the masses with SWVs of greater than 3.065 m/s were designated as malignant
lesions, the sensitivity of the differentiation reached 75.6%, and the specificity,
positive predictive value, area under the receiver operating characteristic curve,
negative predictive value, and accuracy were 95.1%, 85.6%, 86.1%, 90.7%, and
89.5%, respectively (Figures 4 and 5).

SIÊU ÂM ĐÀN HỒI và ỨNG DỤNG LÂM SÀNG
Pag
e12
9
Figure 3.
Shear wave velocity (SWV) values for the benign and malignant masses. The boxes
indicate the values from the lower to the upper quartiles (25th–75th percentiles);
center lines, medians; whiskers, minimum to maximum values; and dot, extreme
value. The square is an outlier.
Among the 5 benign lesions whose SWVs were above the 3.065-m/s threshold, 2
fibroadenomas, 2 intraductal papillomas, and 1 adenosis were found, and for the 10
malignant lesions with SWVs below the 3.065-m/s threshold, 4 ductal carcinomas in
situ and 6 invasive ductal carcinomas were found.
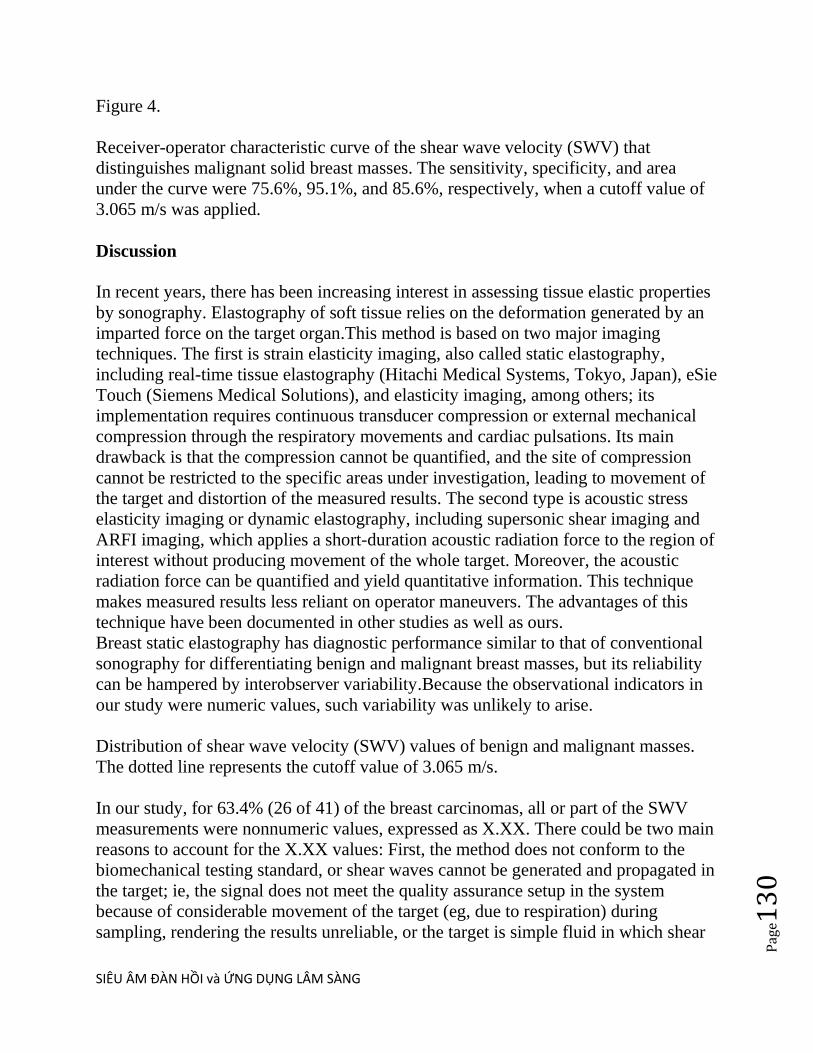
SIÊU ÂM ĐÀN HỒI và ỨNG DỤNG LÂM SÀNG
Pag
e13
0
Figure 4.
Receiver-operator characteristic curve of the shear wave velocity (SWV) that
distinguishes malignant solid breast masses. The sensitivity, specificity, and area
under the curve were 75.6%, 95.1%, and 85.6%, respectively, when a cutoff value of
3.065 m/s was applied.
Discussion
In recent years, there has been increasing interest in assessing tissue elastic properties
by sonography. Elastography of soft tissue relies on the deformation generated by an
imparted force on the target organ.This method is based on two major imaging
techniques. The first is strain elasticity imaging, also called static elastography,
including real-time tissue elastography (Hitachi Medical Systems, Tokyo, Japan), eSie
Touch (Siemens Medical Solutions), and elasticity imaging, among others; its
implementation requires continuous transducer compression or external mechanical
compression through the respiratory movements and cardiac pulsations. Its main
drawback is that the compression cannot be quantified, and the site of compression
cannot be restricted to the specific areas under investigation, leading to movement of
the target and distortion of the measured results. The second type is acoustic stress
elasticity imaging or dynamic elastography, including supersonic shear imaging and
ARFI imaging, which applies a short-duration acoustic radiation force to the region of
interest without producing movement of the whole target. Moreover, the acoustic
radiation force can be quantified and yield quantitative information. This technique
makes measured results less reliant on operator maneuvers. The advantages of this
technique have been documented in other studies as well as ours.
Breast static elastography has diagnostic performance similar to that of conventional
sonography for differentiating benign and malignant breast masses, but its reliability
can be hampered by interobserver variability.Because the observational indicators in
our study were numeric values, such variability was unlikely to arise.
Distribution of shear wave velocity (SWV) values of benign and malignant masses.
The dotted line represents the cutoff value of 3.065 m/s.
In our study, for 63.4% (26 of 41) of the breast carcinomas, all or part of the SWV
measurements were nonnumeric values, expressed as X.XX. There could be two main
reasons to account for the X.XX values: First, the method does not conform to the
biomechanical testing standard, or shear waves cannot be generated and propagated in
the target; ie, the signal does not meet the quality assurance setup in the system
because of considerable movement of the target (eg, due to respiration) during
sampling, rendering the results unreliable, or the target is simple fluid in which shear

SIÊU ÂM ĐÀN HỒI và ỨNG DỤNG LÂM SÀNG
Pag
e13
1
waves could not be generated and propagated. Second, the target is so hard that the
results are beyond the solid biological tissue value of 9.10 m/s set by the system.
Because of the fact that we adopted a rigorous method in our study (eg, during
sampling, the probe was kept still, and the patients were required to hold their breath
to attain reliable SWV measurements) and verified the solid masses by histologic
examination, the first reason can well be excluded. The X.XX values were most likely
due to the presence of abnormal tissue (eg, dense fibrous desmoplastic tissue); for this
reason, our substitution of X.XX with a value of 9.10 m/s could be justified. This
argument can be strengthened by the fact that the X.XX values did not appear in any
benign masses (in the absence of any thick calcification) but were only shown in the
malignant lesions, with specificity and a positive predictive value of 100% (26 of 26).
Such results indicate the potential clinical value of VTQ in differentiating malignant
masses.
The results of this study showed that the SWVs of the benign masses were
significantly faster than those of the reference breast tissue but slower than those of
the malignant masses, implying that benign masses tend to be harder than normal
breast tissue but softer than malignant masses, a result consistent with all previous
findings. The malignant masses usually were very firm because of dense fibrous
desmoplastic tissue. Our results have illustrated the clinical feasibility of using VTQ
to quantitatively assess the relative stiffness of breast tissue. Furthermore, we have
shown that SWV is indeed useful for differentiation between benign and malignant
breast masses; in our study, an SWV value of greater than 3.065 m/s was indicative of
malignancy. This finding not with standing, there was overlap. Five benign masses
were recognized as malignant because their SWVs were above the 3.065-m/s
threshold. Histopathologic examination showed that these 5 masses contained
plentiful fibrous tissue, which might have contributed to the higher SWVs. On the
other hand, 10 malignant masses were misdiagnosed as benign because their SWVs
were below the 3.065-m/s threshold. Histopathologic examination revealed that these
10 masses were rich in epithelial cells and short of fibrous tissue, which might have
accounted for the lower SWVs. It is also worthy of note that 80% (4 of 5) of the
ductal carcinomas in situ had SWVs of less than 3.065 m/s, indicating that for
detection of this specific type of malignancy, VTQ may be a less optimal approach.
The major limitations of applying VTQ in our study were the fixed box dimension of
the target region of interest and its sensitivity to movement artifacts. In addition, our
study was based on a relatively small number of malignant cases and types; to further
confirm the benefits of VTQ, a larger sample size may be needed.
In conclusion, VTQ can yield quantitative information on the tissue stiffness of solid
breast masses in a reproducible way. With a cutoff SWV value of 3.065 m/s, we could

SIÊU ÂM ĐÀN HỒI và ỨNG DỤNG LÂM SÀNG
Pag
e13
2
accurately identify both benign and malignant solid masses. Moreover, all of the
lesions with an SWV of X.XX were found to be malignant, suggesting that repeated
X.XX values can serve as a malignancy indicator. Given these promising results, we
propose the use of VTQ as an effective diagnostic tool for differentiating between
benign and malignant solid breast masses.
© 2012 by the American Institute of Ultrasound in Medicine
-----------
...
Trong nghiên cứu của chúng tôi, có 63.4% (26/41) carcinomas vú, tất cả hay một phần
của đo SWV là các giá trị không sô (nonnumeric), biêu hiện nhƣ X.XX. Có thể có hai
lý do chính cho các giá trị X.XX: trƣớc tiên, phƣơng pháp thử nghiệm chuẩn
biomechanical không phù hợp, hoặc sóng biên dang không thể đƣợc tạo ra và truyên
trong mục tiêu; tức là, các tín hiệu không đáp ứng các thiết lập bảo đảm chất lƣợng
trong may vì mục tiêu không chuyển động đáng kể (ví dụ nhƣ, nhờ sự hô hấp) trong
thời gian lấy mẫu, kết xuất các kết quả không đáng tin cậy, hoặc mục tiêu là dich đơn
thuân nên sóng biên dang có thể không đƣợc tạo ra và lan truyền. Thứ hai, mục tiêu
quá cứng nên kết quả vƣợt quá giá trị rắn sinh học mô 9,10 m/s cua may. Vì thực tế
chúng tôi đã thông qua một phƣơng pháp nghiêm ngặt trong nghiên cứu (ví dụ nhƣ,
trong khi lấy mẫu, đâu do đƣợc giữ yên, và bệnh nhân đƣợc yêu cầu nin thở để co kêt
quả đo đạc SWV đáng tin cậy) và xét nghiệm mô bênh hoc khôi cƣng, nên nguyên
nhân đầu tiên cung co thê đƣợc loại trừ. Các giá trị X.XX rất có thể do co mô bất
thƣờng (ví dụ nhƣ, nhiêu mô sơi [desmoplastic]); vì lý do này, chúng tôi thay thế
X.XX băng giá trị 9,10 m/s có thể đƣợc chứng minh. Điêu suy luân nay đƣợc tăng
cƣờng bởi thực tế là giá trị X.XX đã không xuất hiện trong bất kỳ khối u lành tính nao
(không co vôi hoa day) mà chi xuất lộ trong các tổn thƣơng ác tính, với đô đặc hiêu và
giá trị tiên đoán dƣơng là 100% (26 / 26 ca). Kết quả nhƣ vậy cho thấy giá trị tiềm
năng lâm sàng của VTQ trong phân biệt cac u ác tính.
Kết quả của nghiên cứu này cho thấy rằng SWVs của u lành tính nhanh đáng kể hơn
mô vú tham chiêu nhƣng chậm hơn so với u ác tính, ngụ ý rằng u lành tính có xu
hƣớng cứng hơn mô vú bình thƣờng nhƣng mềm hơn u ác tính, phù hợp với tất cả
phát hiện trƣơc đây. Bởi u ác tính thƣờng rất chắc vì dày đặc mô xơ hoa. Kết quả của
chúng tôi đã minh họa tính khả thi lâm sàng của sử dụng VTQ để đánh giá đinh lƣơng
độ cứng tƣơng đối của mô vú. Hơn nữa, chúng tôi đã chƣng to SWV thực sự giup ích
phân biệt giữa u vu lành tính và ác tính; trong nghiên cứu của chúng tôi, giá trị SWV
lớn hơn 3.065 m/s đƣợc coi la ác tính. Dâu hiêu nay chƣa vƣng vi đã có trung lăp
(overlapping). Năm khối lành tính đƣợc nhận là ác tính bởi vì SWVs đã ở trên ngƣỡng

SIÊU ÂM ĐÀN HỒI và ỨNG DỤNG LÂM SÀNG
Pag
e13
3
3,065m/s. Kêt qua mô bênh hoc cho thấy 5 u nay có nhiêu mô xơ, có thể đã góp phần
làm cho SWVs cao hơn. Mặt khác, 10 khối ác tính đã lầm là lành tính bởi vì SWVs
dƣới ngƣỡng 3,065m/s. Kêt qua mô bênh hoc cho thấy 10 khối nay co nhiêu tế bào
biểu mô và it mô xơ, làm cho SWVs thấp hơn. Đáng lƣu ý rằng 80% (4 / 5) của ductal
carcinomas in situ có SWVs thâp hơn 3,065 m/s, chi ra rằng vơi đăc trƣng cua loai
bênh ly ac tinh nay, VTQ la cach tiêp cân it tôi ƣu.
Những hạn chế chu yêu của việc áp dụng VTQ trong nghiên cứu của chúng tôi là kích
thƣớc cố định của ROI box và độ nhạy với artifact do chuyên đông. Ngoài ra,
nghiên cứu của chúng tôi chi co một số trƣờng hợp ác tính tƣơng đối ít và vài loại;
nên đê xac đinh lơi thê của VTQ, cân một kích thƣớc mẫu lớn hơn.
Tóm lại, VTQ cho thông tin định lƣợng về độ cứng khối vú đăc co tinh lâp lai. Với
một giá trị SWV =3,065 m/s, chúng tôi có thể xác định chính xác cac u đăc cả lành
tính và ác tính. Hơn nữa, với tất cả tôn thƣơng ac tinh co SWV =X.XXm/s, cho thấy
rằng các giá trị X.XX lặp đi lặp lại có thể đƣơc xem nhƣ là chỉ báo ác tính. Vơi kết
quả đầy hứa hẹn, chúng tôi đề xuất việc sử dụng VTQ nhƣ một phƣơng tiên chẩn đoán
hiệu quả cho viêc phân biêt u vu đăc lành tính và ác tính.
SIÊU ÂM ĐÀN HỒI PHÂN BIỆT NHÂN GIÁP LÀNH VÀ ÁC TÍNH
Acoustic Radiation Force Impulse (ARFI) Imaging of Thyroid Nodules,
Vo Mai Khanh, Nguyen Thien Hung, Phan Thanh
Hai, MEDIC MEDICAL CENTER, HCMC, Vietnam
ABSTRACT:
Purpose: The aim of the present study was to evaluate the feasibility of ARFI-
measurements in combining of VTI in the thyroid nodule.
Methods and materials: All patients underwent conventional ultrasound, ARFI-
imaging and cytological assessment. ARFI-imaging (VTI and VTQ technology)
were performed with 9L4 probe, using Siemens (ACUSON S2000) B-mode-ARFI
combination transducer.
Results and discussions: 130 nodules were available for analysis. 103 nodules
were benign on cytology, 20 nodules were malignant ( papillary carcinomas), and
7 follicular lesions. The average velocity of ARFI-imaging in benign and
malignant thyroid nodules was of 2.4 m/s, and of 3.2 m/s, respectively. A

SIÊU ÂM ĐÀN HỒI và ỨNG DỤNG LÂM SÀNG
Pag
e13
4
sensitivity of 79.4% and specificity of 53.7% of ARFI-imaging could be achieved
using a cut-off of 2.16 m/s (area under ROC curve is 0.731, p < 0.0001).
Conclusions: ARFI can be performed in thyroid nodule with reliable results.
ARFI might be the reference criteria for differentiation of benign and malignant
thyroid nodules.
TẠO HÌNH XUNG LỰC BỨC XẠ ÂM ARFI CÁC NHÂN GIÁP
VÕ MAI KHANH-NGUYỄN THIỆN HÙNG Trung tâm Y khoa MEDIC HOÀ HẢO,
Thành phố Hồ Chí Minh.
TÓM TẮT:
Mục tiêu: khảo sát các đặc điểm của kỹ thuật tạo hình xung lực bức xạ âm ARFI trong
chẩn đoán phân biệt hạt giáp lành – ác.
Đối tượng và phương pháp nghiên cứu:
+Nghiên cứu mô tả cắt ngang.
+130 hạt giáp đƣợc thực hiện siêu âm quy ƣớc B-mode và tạo hình xung bức xạ âm ARFI
bằng máy siêu âm Acuson Siemens S2000 tại Medic từ tháng 08/2011 đến tháng
10/2012. Tất cả hạt giáp đều đƣợc thực hiện FNAC sau đó để làm giá trị đối chiếu.
+Xử lý số liệu: phần mềm Medcalc.
Kết quả: Khảo sát 130 hạt giáp gồm 103 hạt lành tính, 20 carcinôm tuyến giáp dạng
nhú và 7 follicular lesion. Giá trị VTQ trung bình của tất cả các hạt giáp nói chung, hạt
giáp lành và ác tính lần lƣợt là 2,4m/s (range 0,8 – 9,22m/s); 2,15m/s (range 0,8 –
4,04m/s) và 3,2m/s (range 0,9 – 9,22m/s). Tại điểm cắt 2,16m/s, độ nhạy và
độ chuyên của ARFI trong phân biệt hạt giáp lành tính và ác tính là 79,4% và 53,7%
(diện tích dƣới đƣờng cong ROC là 0,731). Độ chênh lệch giá trị VTQ giữa mô giáp bình
thƣờng và hạt giáp (lành, ác) có độ nhạy là 79,5% và độ chuyên là 51% tại điểm cắt
0,63 (diện tích dƣới đƣờng cong ROC là 0,72).
Kết luận: VTQ của hạt giáp và độ chênh lệch giá trị VTQ giữa mô giáp bình thƣờng và
hạt giáp có thể giúp ích trong chẩn đoán phân biệt hạt giáp lành tính và ác tính. Có
thể phối hợp với VTI để tăng thêm giá trị chẩn đoán.
ĐẶT VẤN ĐỀ:
Siêu âm đàn hồi ARFI là kỹ thuật mới để đánh giá định lƣợng độ cứng hay độ đàn hồi mô (gan, giáp, vú…) không xâm lấn. Không cần phải ấn khám bằng
SIÊU ÂM ĐÀN HỒI và ỨNG DỤNG LÂM SÀNG
Pag
e13
5
đầu dò siêu âm (nhƣ FibroScan hay RTE) nên kết quả không tuỳ thuộc ngƣời khám và có tính lặp lại.
Hieän nay, coù vaøi coâng boá cuûa caùc taùc giaû veà kyõ thuaät ARFI ôû haït giaùp, chuû yeáu laø ño
toác ñoä ñaøn hoài ARFI (Virtual Touch Tissue Quantification: VTQ) vaø caùc keát quaû, nhaän
ñònh coøn nhieàu khaùc bieät. Nghieân cöùu naøy cuõng döïa treân chæ soá VTQ (ñònh löôïng) cuûa
haït giaùp, keát hôïp vôùi VTI (Virtual Touch Tissue Imaging) (ñònh tính).
MỤC TIÊU NGHIÊN CỨU:
+Khảo sát giá trị VTQ (định lƣợng) trên mô giáp bình thƣờng, hạt giáp lành tính và ác
tính. Khảo sát mối liên hệ giữa VTQ và hạt giáp lành – ác.
+Khảo sát VTI (định tính) trên hạt giáp lành tính và ác tính.
ĐỐI TƢỢNG VÀ PHƢƠNG PHÁP NGHIÊN CỨU:
+Phƣơng pháp: mô tả cắt ngang.
+Đối tƣợng: 130 hạt giáp đƣợc thực hiện siêu âm quy ƣớc và tạo hình xung bức xạ âm
ARFI bằng máy siêu âm Acuson Siemens S2000 tại Medic từ tháng 08/2011 đến
tháng 10/2012. Tất cả hạt giáp đƣợc thực hiện thủ thuật FNAC sau đó để đối chiếu.
+Xử lý số liệu: phần mềm Medcalc.
KẾT QUẢ:
+ Đặc điểm nhóm nghiên cứu:
+Tuổi: trung bình 45 (16 – 69 tuổi)
+Kích thƣớc hạt giáp: trung bình 14mm (5 – 47mm)
+ Giá trị định lƣợng VTQ:
@ Trung bình của mô giáp lành: 1,51m/s (0,84 – 3m/s)
@Trung bình của hạt giáp lành tính: 2,15m/s (0,8 – 4,04m/s)
@Trung bình của hạt giáp ác tính: 3,21m/s (0,9 – 9,22m/s)
+ Mối liên hệ giữa độ nhạy và độ chuyên của VTQ và hạt giáp lành tính – ác tính
đƣợc thể hiện bằng biểu đồ đƣờng cong ROC với diện tích dƣới đƣờng cong (AUC)
là 0,731 (p < 0,0001) đƣợc đánh giá là khá tốt. Tƣơng tự với độchênh lệch VTQ giữa
mô giáp bình thƣờng và hạt giáp (lành, ác) có AUC là 0,72 (p < 0,0001).

SIÊU ÂM ĐÀN HỒI và ỨNG DỤNG LÂM SÀNG
Pag
e13
6

SIÊU ÂM ĐÀN HỒI và ỨNG DỤNG LÂM SÀNG
Pag
e13
7
+ Đặc điểm định tính VTI:

SIÊU ÂM ĐÀN HỒI và ỨNG DỤNG LÂM SÀNG
Pag
e13
8
BÀN LUẬN:
Giá trị VTQ trung bình thấp nhất của mô giáp bình thƣờng, cao hơn ở hạt
giáp lành tính và cao nhất ở hạt giáp ác tính. Điều này là phù hợp vì các hạt
giáp ác tính có mật độ cứng hơn hạt giáp lành tính.
Tuy nhiên, giá trị VTQ giữa các nhóm này dao động khá rộng và có
sự chồng lấp lên nhau. Một hạt giáp ác tính vẫn có thể có giá trị VTQ nằm
trong phạm vi của mô giáp bình thƣờng hoặc hạt giáp lành tính và ngƣợc lại.
Điều này lý giải đƣợc nguyên nhân của độ nhạy và độ chuyên của VTQ trong
phân biệt hạt giáp lành tính – ác tính chỉ ở mức khá và diện tích dƣới đƣờng
cong AUC chỉ là 0,731. Có thể bàn luận kết quảnày nhƣ sau:

SIÊU ÂM ĐÀN HỒI và ỨNG DỤNG LÂM SÀNG
Pag
e13
9
+ Hạt giáp ác tính không hoàn toàn là một khối cứng đồng nhất, bên trong vẫn có
những vùng hoại tử, hóa nang. Tƣơng tự, hạt giáp lành tính có thành phần đặc và
nang, thậm chí có vôi hóa lớn,...
+ Vùng ROI (region of interest) của máy Acuson Siemens S2000 là khá lớn [5x6
cm] và không thể điều chỉnh đƣợc. Một số hạt giáp nhỏ hơn 10mm nằm lọt hoàn
toàn trong vùng ROI, do đó không thể kiểm soát đƣợc cảmô giáp lành cũng đƣợc
đƣa vào đo xung bức xạ âm của vùng. Hiện nay, hãng Siemens đang đƣa vào giới
thiệu version S3000 với vùng ROI đƣợc thu nhỏ lại nhằm tăng độ tập trung vào mô
cần khảo sát.
Mặc dù vậy, với AUC là 0,731, VTQ trong ARFI đƣợc xem là một phƣơng
pháp giúp ích trong việc chẩn đoán phân biệt hạt giáp lành tính – ác tính.
@Một số trƣờng hợp hạt giáp trên nền bệnh lý tuyến giáp lan tỏa (Basedow, viêm giáp
Hashimoto,...), bệnh nhân béo phì (platysma dày), hạt giáp ở vị trí sâu hoặc ngay
dƣới da có thể sẽ ảnh hƣởng đến giá trị của VTQ, do đó nghiên cứu thực hiện việc
đo VTQ của mô giáp nền của thùy đối bên ở cùng độ sâu và lấy hiệu số giữa VTQ của
hạt giáp và mô giáp nền để khảo sát mối liên hệ. Với AUC là 0,72, ta thấy hiệu
số này cũng có giá trị khá tốt trong chẩn đoán phân biệt lành – ác của hạt giáp.
@VTI là một biến số định tính nên việc khảo sát giá trị này khá phụ thuộc vào ngƣời
làm siêu âm (operator dependant). Với việc phân làm bốn nhóm hình ảnh VTI (dark,
iso, bright, mixed), kết quả nghiên cứu cho thấy các hạt giáp ác tính có hình ảnh
cứng (dark) trội hơn, và các hạt giáp lành tính có hình ảnh mềm hoặc hỗn hợp
(bright hoặc mixed).
@VTI có thể xem nhƣ một dạng biểu hiện khác của siêu âm B-mode. Tuy nhiên, VTI với
bản đồ màu (color map) đƣợc cho là dễ phân biệt độ cứng-mềm hơn (xanh dƣơng,
xanh lá – vàng, đỏ) so với siêu âm thang xám (xám – đen). Đặcđiểm này giúp ích
trong những trƣờng hợp cần phân biệt các khối dạng dịch không thuần nhất với
khối đặc, hoặc khối đặc có hồi âm rất kém trên B-mode với một khối dạng dịch thật
sự. Ngoài ra, đặc điểm trên còn giúp chọn lựa vịtrí thực hiện chọc hút tế bào bằng
kim nhỏ trong những trƣờng hợp khối lớn và có bản chất phức tạp.
KẾT LUẬN:
Tóm lại, qua nghiên cứu này, kỹ thuật tạo hình xung lực bức xạ âm ARFI có
thể giúp phân biệt hạt giáp lành tính – ác tính. Tuy nhiên, vì đây là kỹ thuật mới và
chƣa đƣợc FDA chuẩn y, với độ nhạy và độ chuyên ở mức khá, nên chi xem nhƣ là
tiêu chuẩn hỗ trợ trong chẩn đoán (tƣơng tự Doppler màu). Nên kết hợp VTQ và
VTI để có kết quả tốt hơn. Với những cải tiến mới trong tƣơng lai, ARFI có
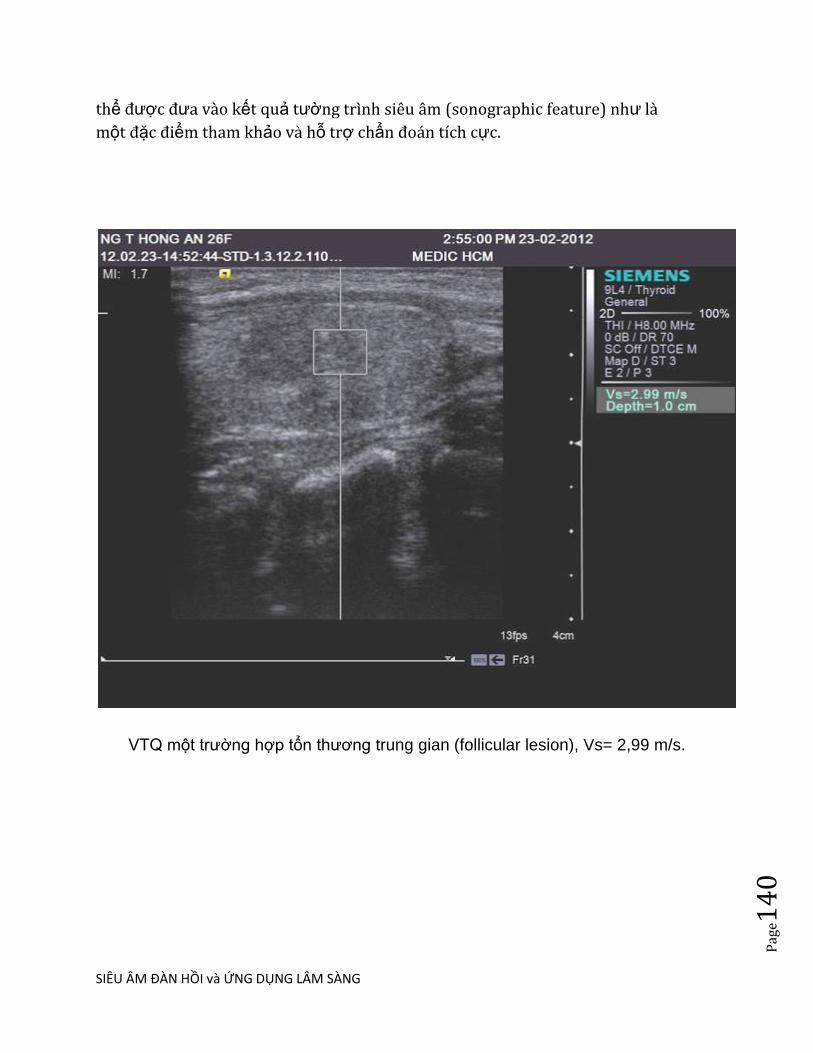
SIÊU ÂM ĐÀN HỒI và ỨNG DỤNG LÂM SÀNG
Pag
e14
0
thể đƣợc đƣa vào kết quả tƣờng trình siêu âm (sonographic feature) nhƣ là
một đặc điểm tham khảo và hỗ trợ chẩn đoán tích cực.
VTQ một trƣờng hợp tổn thƣơng trung gian (follicular lesion), Vs= 2,99 m/s.

SIÊU ÂM ĐÀN HỒI và ỨNG DỤNG LÂM SÀNG
Pag
e14
1
Hình FNAC một trƣờng hợp tổn thƣơng trung gian.
Hình FNAC một trƣờng hợp colloidal cyst.
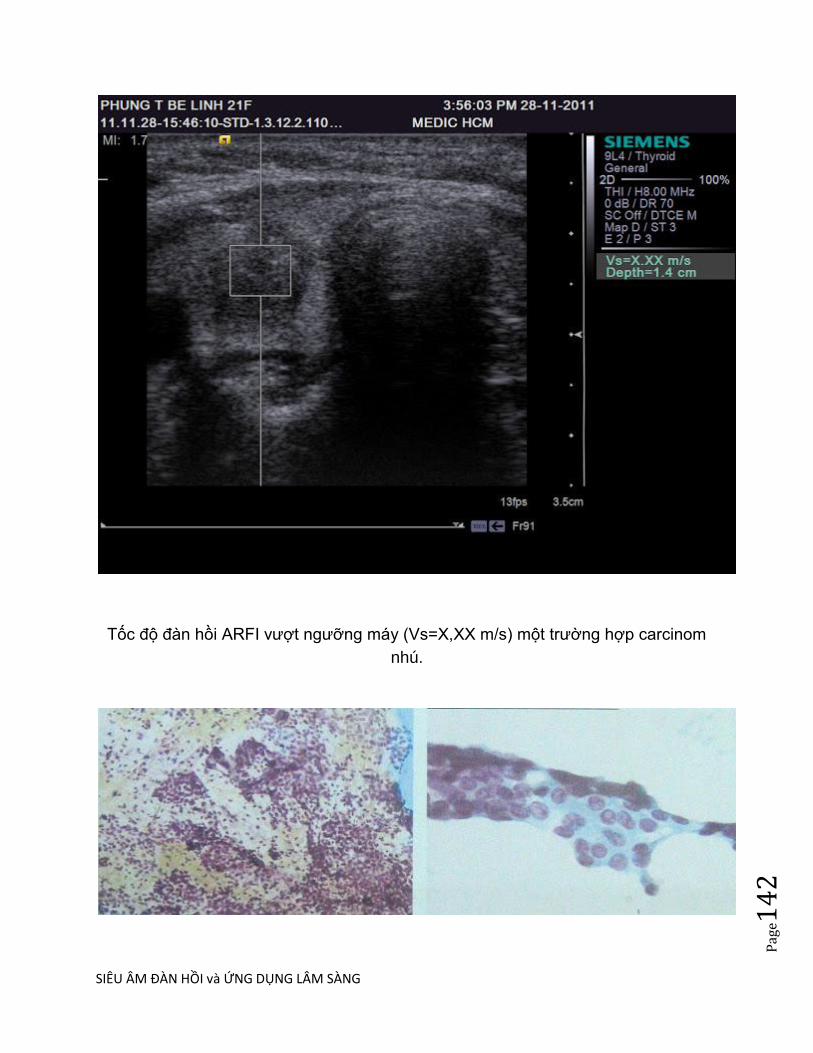
SIÊU ÂM ĐÀN HỒI và ỨNG DỤNG LÂM SÀNG
Pag
e14
2
Tốc độ đàn hồi ARFI vƣợt ngƣỡng máy (Vs=X,XX m/s) một trƣờng hợp carcinom
nhú.

SIÊU ÂM ĐÀN HỒI và ỨNG DỤNG LÂM SÀNG
Pag
e14
3
Hình FNAC một trƣờng hợp carcinom nhú.
TÀI LIỆU THAM KHẢO: 1. Mireen Friedrich-Rust, Olga Romenski, Gesine Meyer, Nina Dauth, Katharina Holzer, Frank Grünwald, Susanne Kriener, Eva Herrmann, Stefan Zeuzem, Joerg Bojunga: Acoustic Radiation Force Impulse-Imaging for the evaluation of the thyroid gland: A limited patient feasibility study, Ultrasonics, Volume 52, Issue 1, January 2012, Pages 69–74 2. Jiying Gu, Lianfang Du, Min Bai, Huili Chen, Xiao Jia, Jing Zhao, and Xuemei Zhang: Preliminary Study on the Diagnostic Value of Acoustic Radiation Force Impulse Technology for Differentiating Between Benign and Malignant Thyroid Nodules, JUM May 1, 2012 vol. 31 no. 5: 763-771
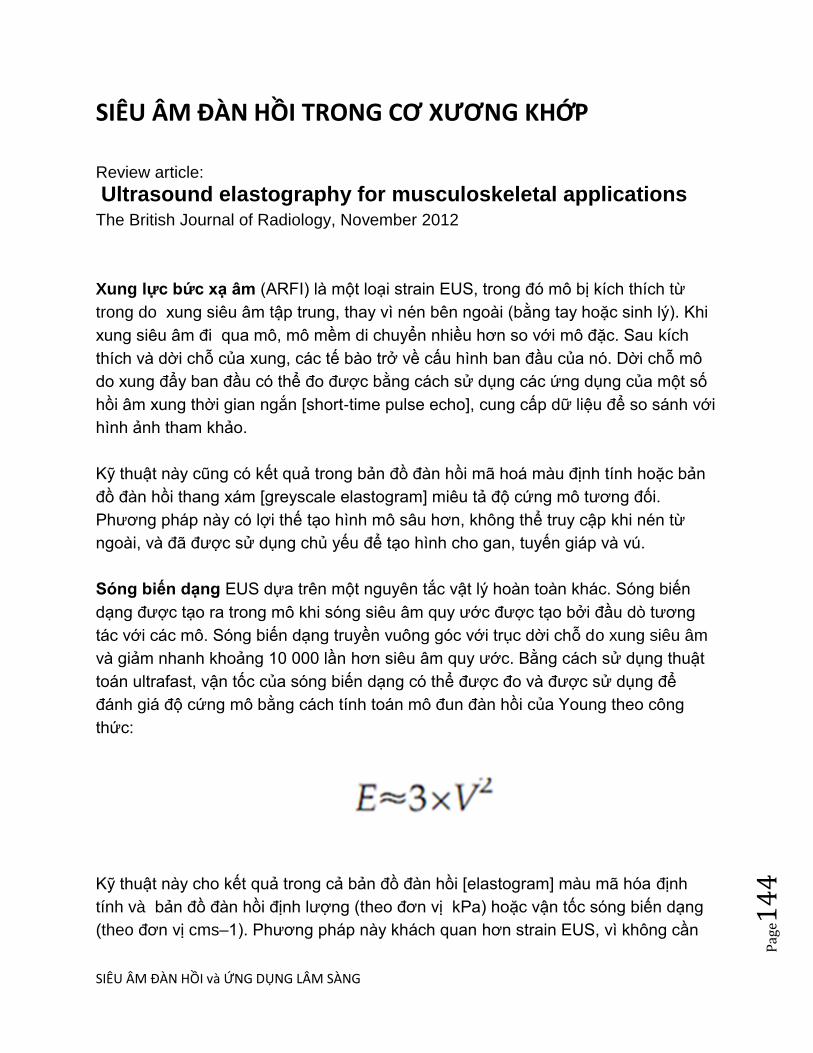
SIÊU ÂM ĐÀN HỒI và ỨNG DỤNG LÂM SÀNG
Pag
e14
4
SIÊU ÂM ĐÀN HỒI TRONG CƠ XƯƠNG KHỚP Review article:
Ultrasound elastography for musculoskeletal applications The British Journal of Radiology, November 2012
Xung lực bức xạ âm (ARFI) là một loại strain EUS, trong đó mô bị kích thích từ
trong do xung siêu âm tập trung, thay vì nén bên ngoài (bằng tay hoặc sinh lý). Khi
xung siêu âm đi qua mô, mô mềm di chuyển nhiều hơn so với mô đặc. Sau kích
thích và dời chỗ của xung, các tế bào trở về cấu hình ban đầu của nó. Dời chỗ mô
do xung đẩy ban đầu có thể đo đƣợc bằng cách sử dụng các ứng dụng của một số
hồi âm xung thời gian ngắn [short-time pulse echo], cung cấp dữ liệu để so sánh với
hình ảnh tham khảo.
Kỹ thuật này cũng có kết quả trong bản đồ đàn hồi mã hoá màu định tính hoặc bản
đồ đàn hồi thang xám [greyscale elastogram] miêu tả độ cứng mô tƣơng đối.
Phƣơng pháp này có lợi thế tạo hình mô sâu hơn, không thể truy cập khi nén từ
ngoài, và đã đƣợc sử dụng chủ yếu để tạo hình cho gan, tuyến giáp và vú.
Sóng biến dạng EUS dựa trên một nguyên tắc vật lý hoàn toàn khác. Sóng biến
dạng đƣợc tạo ra trong mô khi sóng siêu âm quy ƣớc đƣợc tạo bởi đầu dò tƣơng
tác với các mô. Sóng biến dạng truyền vuông góc với trục dời chỗ do xung siêu âm
và giảm nhanh khoảng 10 000 lần hơn siêu âm quy ƣớc. Bằng cách sử dụng thuật
toán ultrafast, vận tốc của sóng biến dạng có thể đƣợc đo và đƣợc sử dụng để
đánh giá độ cứng mô bằng cách tính toán mô đun đàn hồi của Young theo công
thức:
Kỹ thuật này cho kết quả trong cả bản đồ đàn hồi [elastogram] màu mã hóa định
tính và bản đồ đàn hồi định lƣợng (theo đơn vị kPa) hoặc vận tốc sóng biến dạng
(theo đơn vị cms–1). Phƣơng pháp này khách quan hơn strain EUS, vì không cần
SIÊU ÂM ĐÀN HỒI và ỨNG DỤNG LÂM SÀNG
Pag
e14
5
nén mô, đánh giá trực tiếp độ đàn hồi với số đo định lƣợng. Tuy nhiên, có những
mối quan tâm về việc sử dụng của phƣơng pháp này trong các cấu trúc nông, vì
sóng biến dạng cần đƣợc siêu âm tạo ra ở độ sâu nhất định.
EUS thoáng qua, còn đƣợc gọi là elastography kiểm soát rung động [vibration-
controlled elastography], là một biến thể của sóng biến dạng EUS, theo đó kích
thích nén từ ngoài đƣợc áp dụng bằng cách sử dụng một short-tone burst of
vibration. Phƣơng pháp này cũng dựa trên ƣớc tính vận tốc của sóng biến dạng
trong mô, nhƣng để tránh xu hƣớng gây ra bởi sự phản xạ và nhiễu xảy ra giữa các
mô, rung động là tạm thời, do đó sóng chuyển tiếp có thể đƣợc tách ra từ sóng
phản xạ. EUS thoáng qua chủ yếu đƣợc sử dụng trong khám cho bệnh gan.
Những viễn cảnh tương lai
EUS là đại diện quan trọng nhất cho phát triển kỹ thuật của siêu âm từ sau tạo hình
Doppler. Kỹ thuật này có nhiều lợi thế hơn các phƣơng pháp đánh giá đàn hồi khác
của mô, chẳng hạn nhƣ MR elastography, vì máy có chi phí thấp, nhanh, không
xâm hại, và sẵn có tiềm năng lâm sàng rộng hơn. Cho đến nay việc sử dụng EUS
có các bằng chứng rất hứa hẹn nhằm đánh giá tính chất cơ học của cơ xƣơng khớp
trong lâm sàng.
Dữ liệu sơ bộ cho thấy thậm chí EUS nhạy hơn so với MRI hoặc thiết bị siêu âm
thang xám trong việc phát hiện các thay đổi subclinical [tiền lâm sàng] của cơ bắp
và dây chằng, và do đó có thể có giá trị cho chẩn đoán sớm và trong y học phục hồi
chức năng. EUS có thể đƣợc sử dụng nhƣ công cụ nghiên cứu sâu vào các cơ chế
sinh học và sinh lý bệnh của bệnh cơ gân [musculotendinous].
Tuy nhiên, mặc dù đƣợc quan tâm rất lớn trong kỹ thuật, các tài liệu đƣợc công
bố vẫn còn rất hạn chế và chủ yếu phụ thuộc vào báo cáo ca bệnh hoặc các nghiên
cứu không kiểm soát với dân số nghiên cứu nhỏ, và sử dụng kỹ thuật EUS và hệ
thống tính điểm khác nhau. Có một số vấn đề kỹ thuật, trong đó thiếu các phƣơng

SIÊU ÂM ĐÀN HỒI và ỨNG DỤNG LÂM SÀNG
Pag
e14
6
pháp định lƣợng, xảo ảnh, giới hạn và các biến thể trong áp dụng các kỹ thuật bởi
ngƣời dùng khác nhau, làm hạn chế tính lập lại của phƣơng pháp.
Có nghi ngờ về các tiện ích lâm sàng tiềm năng của các công cụ chẩn đoán mới
này, nhƣ trong hầu hết trƣờng hợp, EUS cho thấy các thay đổi đã rõ trên siêu âm
quy ƣớc hoặc Doppler màu, trong khi EUS lại không thay đổi rõ khi bệnh còn ẩn
trên tạo hình quy ƣớc, và do đó về lâm sàng là không quan trọng.
Với tất cả những lý do nêu trên, chúng tôi nghĩ rằng nên tổ chức tiếp cận có hệ
thống hơn để điều tra các phƣơng pháp mới này. Trƣớc tiên, chúng tôi chủ trƣơng
chuẩn hoá [standardisation] EUS cho các ứng dụng mô mềm, dựa trên đề nghị các
nhà sản xuất và sự đồng thuận giữa ngƣời sử dụng, bằng cách sử dụng các tham
số chẳng hạn nhƣ kích thƣớc của elastogram, sử dụng gel/adaptor/pad, các hệ
thống tính điểm và v.v.. Điều này hết sức quan trọng trong việc đạt đƣợc sự nhất
quán trong việc áp dụng các kỹ thuật và sẽ cho phép so sánh giữa các nghiên cứu.
Để khắc phục các vấn đề kỹ thuật liên quan đến việc sử dụng EUS trong mô ở
nông, các hợp tác chặt chẽ giữa ngành công nghiệp và các nhà nghiên cứu lâm
sàng sẽ cho phép những kinh nghiệm lâm sàng đƣợc sử dụng cho sự phát triển của
giao thức tối ƣu hóa dành riêng cho ứng dụng trong cơ xƣơng khớp.
Thứ hai, chúng ta cần phải cẩn thận thiết lập các chỉ định cho EUS. Các mục tiêu lý
tƣởng trên nghiên cứu đoàn hệ [cohort] của bệnh nhân có triệu chứng nhƣng non-
ultrasound-evident, bệnh nhân có nguy cơ hoặc bệnh nhân ở giai đoạn rất sớm
của bệnh, để điều tra cho dù EUS nhạy hơn so với tạo hình ảnh quy ƣớc trong mô
tả thay đổi lâm sàng quan trọng sớm hơn. Nghiên cứu đa trung tâm có kiểm soát
lâu dài [multicentre long-term controlled studies] là cần thiết; các nghiên cứu
này nên bao gồm các quần thể lớn của lứa tuổi khác nhau và mức độ hoạt động với
theo dõi lâu dài và mối tƣơng quan với mô học, tạo hình quy ƣớc (siêu âm và MRI)
và dữ liệu cơ sinh học và lâm sàng, để mô tả các mô hình và tính chất của các dấu
hiệu EUS và ý nghĩa lâm sàng của chúng.
Cuối cùng, các thuật toán mới cho phép đánh giá định lƣợng tính đàn hồi nhƣ EUS
sóng biến dạng hoặc ARFI nên đƣợc nghiên cứu và so sánh với strain EUS định
tính.
Kết luận

SIÊU ÂM ĐÀN HỒI và ỨNG DỤNG LÂM SÀNG
Pag
e14
7
Do thiếu tiêu chuẩn hóa và nghiên cứu có giới hạn, EUS trong hình thức hiện
tại vẫn còn là một kỹ thuật rất chủ quan, với giá trị lâm sàng gây tranh cãi. Với tiêu
chuẩn hóa và cấu trúc thêm nghiên cứu, EUS có thể trở thành một công cụ bổ sung
có giá trị trong việc điều tra của bệnh cơ xƣơng khớp.
-----------
Acoustic radiation force impulse (ARFI) is a type of strain EUS whereby tissue is
excited internally by a focused ultrasound pulse, instead of external (manual or
physiological) compression [14, 35–37]. As the ultrasound pulse travels through the
tissue, soft tissue experiences larger displacement than hard tissue. After the
excitation and displacement by the pulse, the tissue relaxes to its original
configuration. The tissue displacement by the original push pulse can be measured
using the application of several short-time pulse echoes, which provides data for
comparison with the reference image [14, 35–37].
The technique also results in a qualitative colour-coded or greyscale elastogram
depicting relative tissue stiffness. This method has the advantage of imaging deeper
tissue, not accessible by superficial external compression, and has been used
mainly for liver, thyroid and breast imaging [14, 35–37].
Shear wave EUS is based on a completely different physical principle. Shear waves
are generated within tissue when the conventional ultrasound waves produced by
the transducer interact with tissue [38]. Shear waves propagate perpendicular to the
axial displacement caused by the ultrasound pulse and attenuate approximately 10
000 times more rapidly than conventional ultrasound [38]. By use of ultrafast
algorithms, the velocity of shear waves can be measured and used to evaluate
tissue stiffness by calculating the elastic Young‘s modulus according to the formula:
This technique results in both qualitative colour coded elastograms and also
quantitative maps either of elasticity (in kPa) or of shear wave velocity (in cms–1).
SIÊU ÂM ĐÀN HỒI và ỨNG DỤNG LÂM SÀNG
Pag
e14
8
This method is more objective than strain EUS, because of the lack of tissue
compression, the direct assessment of elasticity and the quantitative measurements
provided. However, there are concerns about the use of this method in very
superficial structures, as a certain depth of ultrasound penetration is needed for
shear waves to be produced [14, 38].
Transient EUS, also known as vibration-controlled elastography, is a variant of
shear wave EUS, whereby
the external compression is applied by using a short-tone burst of vibration [39]. The
method also relies on the estimation of the velocity of shear waves in tissue, but
in order to avoid the bias caused by reflections and
interferences occurring between the tissues, vibration is transient, so that forward
waves can be separated from the reflected waves [39]. Transient EUS is mainly
used in examinations for liver disease [14, 39].
Ultrasound elastography for the examination of tendons
The Achilles tendon has provided most of the clinical data available so far in
musculoskeletal applications; it was the first area to be investigated using free-hand
strain EUS (Table 1). In a study of 50 asymptomatic and
sonographically normal Achilles tendons in healthy volunteers, the normal tendons
were found to have two distinct EUS patterns (Figure 1) [17]. They were either
homogeneously hard structures or, in the majority of cases (62%), they were found
to have considerable inhomogeneity with soft areas (longitudinal bands or spots),
which did not correspond to any changes in B-mode or Doppler ultrasound [17].
These findings were confirmed in two studies by the same research group,
comparing normal (asymptomatic) and abnormal (symptomatic) tendons [18–20].
The asymptomatic tendons were found to be homogeneously
hard in 86–93% of cases, containing mild softening (yellow) in 7–12% of cases and
containing marked softening (red) in 0–1.3% of cases [18–20]. By contrast,
symptomatic tendons were found in EUS to contain marked softening in 57%, mild
softening in 11% and nosoft areas (hard structures) in 32% of cases [18]. The
alterations in asymptomatic tendons were mainly observed in the tendon mid-portion
and were not always found to correspond to alterations in conventional ultrasound
[18–20]. Mild softening (yellow) was not correlated with conventional ultrasound
abnormalities, whereas marked softening (red) was found mainly in cases with
ultrasound disease, so the authors suggest that only marked soft areas should be
considered as abnormal in Achilles tendon EUS [19, 20] (Figure 2). The nature of
SIÊU ÂM ĐÀN HỒI và ỨNG DỤNG LÂM SÀNG
Pag
e14
9
the EUS alterations found in asymptomatic and sonographically normal tendons is
not yet completely understood; it is suggested that they may either correspond to
early (pre-clinical) changes not yet evident using ultrasound or to false-positive
findings, secondary to tissue shifting/non-axial movement at interfaces between
collagen fibres [17–20]. To date no histopathology or follow-up studies are available
to elucidate the above presumptions.
However, another study used strain EUS to assess 12 patients with Achilles
tendinopathy using ultrasound and MRI and found increased stiffness in the
abnormal tendons, compared with the non-symptomatic, which were softer [21].
These findings are completely different from those previously reported and
emphasise the need for further research on EUS of the Achilles tendon.
Technical considerations and limitations of ultrasound elastography
The major problem in the application of EUS is that there are a wide variety of
techniques and processing algorithms currently available for producing and
displaying elastographic images and therefore the findings as well as the artefacts or
limitations may be highly dependent on the technique and may be specific to a
specific system. Experience regarding technical problems and the means of
resolving them has resulted from the use of free-hand compression EUS.
Compression EUS is technically very challenging in terms of the proper application
of the technique. It is difficult to produce high quality, artefact-free cine loops of
decompression–
compression cycles. The problems are associated with either inherent limitations of
the technique itself or the characteristics of the musculoskeletal system.
A major issue associated with compression EUS is determining the correct amount
of pressure to be applied on tissue. The pressure should be moderate, described as
the level of pressure that maintains contact with skin and for which the association
between pressure and strain is proportional [6]. Very high or low pressure should be
avoided, as the elastic properties of tissue become non-linear [6]. Most EUS
systems now provide software, which allows a feedback of the amount of pressure
as a visual indicator/bar displayed on the screen alongside sonographic images thus
ensuring the correct application of pressure. To minimise intra-observer variation
and avoid transient temporal fluctuations, the scoring or measurements in the
elastograms should be based on examination of entire cine loops instead of single
static images [17, 20, 34]. The most common method to assess the elastograms is
by viewing representative images derived from cine loops of at least three
SIÊU ÂM ĐÀN HỒI và ỨNG DỤNG LÂM SÀNG
Pag
e15
0
compression–relaxation cycles [17–20, 34]. The images should be chosen at the
compression phase and in the middle of each cycle, as the calculation of the
elastogram at the initial and final stages of each cycle will be inaccurate [18–20].
Another major problem in strain EUS is the lack of quantitative measurements. This
has led researchers to use various methods for the assessment of the elastograms,
which include semi-quantitative measurements (strain ratio) [17], qualitative
assessment visual assessment of elastograms using patterns, scores or grades [17–
20], or by using commercially available external computer software [25, 26]. This
has led to considerable confusion in the interpretation of the findings, a lack
of reproducibility and difficulty in comparing the results from different studies, even if
the same technique (strain EUS) is applied in all cases.
When using EUS for examining musculoskeletal tissue, special issues should be
taken into consideration.
In conventional musculoskeletal ultrasound the amount of pressure should be as
light as possible, so as not to distort the underlying tissues (e.g. fluid within bursa or
synovial cavity), whereas in EUS a certain amount of
pressure is necessary to allow the correct application of the technique. The
examination probe should always be held perpendicular to the tissue to avoid
anisotropy, as the B-mode appearance influences the acquisition of EUS data [18–
20]. Although tendon images should be taken in both transverse and longitudinal
planes, longitudinal images are of better quality, as it has been shown that the
reproducibility of transverse images of the Achilles tendon is less than that of
longitudinal images because of artefacts at the medial and lateral sides of the image
secondary to unilateral pressure and out-of-plane movements of the transducer [17].
There are elasticity changes at the borders of the elastogram attributed to
inhomogeneous application of pressure [17–20], and so overlapping images should
be acquired to overcome this problem. There are also limitations and
difficulties related to the anatomy of the area examined. EUS is especially
problematic in cases of superficial protuberant masses and in areas with prominent
adjacent bony structures (e.g. at the level of the malleoli when examining tibialis
posterior and the peroneal tendons), where it is difficult to apply uniform
compression over the entire region of interest [34].
Another important parameter is the size of the elastogram. The elastogram displays
the elasticity of each tissue relative to the remaining tissue within it. Therefore, the
amount and level of stiffness of the surrounding tissue influences the appearance of
the tissue of interest. This is not a major problem in tissues such as the breast
where the surrounding tissue is fairly homogeneous (fat and glandular tissue). In

SIÊU ÂM ĐÀN HỒI và ỨNG DỤNG LÂM SÀNG
Pag
e15
1
musculoskeletal EUS, however, the elastogram may include tissues with wide
elasticity differences (fat, tendon, bone, muscle), leading to a wider scatter in the
acquired elasticity data. For the Achilles tendon, the suggested standard size for
longitudinal scans is a depth of three times the tendon and about three-quarters of
the screen, and for transverse scans the paratenon should be included [20].
However, this suggestion is not universally applied, leading to difficulties in
comparisons between studies.
Another standardisation problem is the distance between the probe and the tissue of
interest. In many musculoskeletal applications, the tissue of interest is very
superficial or even lies directly under the skin (e.g. Achilles tendon). In most
ultrasound systems a minimum distance (usually 1.2 mm) from the skin is needed to
place the box of the elastogram, so in thin people the use of gel pads or probe
adaptors is necessary to increase the distance between the skin and probe [18–21].
Using these stand-off devices has been proven not to influence the appearance of
the elastogram [18, 19]. In conventional musculoskeletal imaging, the use of large
amounts of gel is common practice in order to create an even surface and to reduce
the amount of pressure on the tissue. However, when performing EUS for
musculoskeletal applications, care should be taken not to include the gel in the box
of the elastogram, as it results in dramatic changes, making the tendons appear
considerably stiffer compared with the gel (Figure 5).
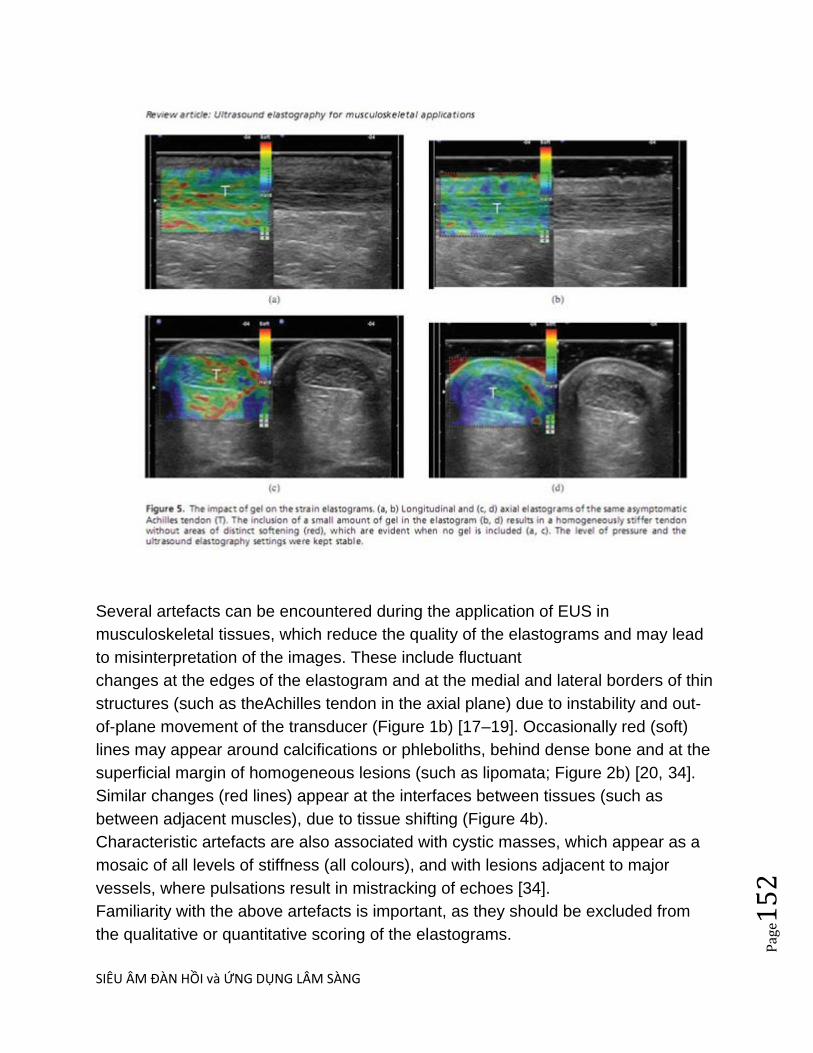
SIÊU ÂM ĐÀN HỒI và ỨNG DỤNG LÂM SÀNG
Pag
e15
2
Several artefacts can be encountered during the application of EUS in
musculoskeletal tissues, which reduce the quality of the elastograms and may lead
to misinterpretation of the images. These include fluctuant
changes at the edges of the elastogram and at the medial and lateral borders of thin
structures (such as theAchilles tendon in the axial plane) due to instability and out-
of-plane movement of the transducer (Figure 1b) [17–19]. Occasionally red (soft)
lines may appear around calcifications or phleboliths, behind dense bone and at the
superficial margin of homogeneous lesions (such as lipomata; Figure 2b) [20, 34].
Similar changes (red lines) appear at the interfaces between tissues (such as
between adjacent muscles), due to tissue shifting (Figure 4b).
Characteristic artefacts are also associated with cystic masses, which appear as a
mosaic of all levels of stiffness (all colours), and with lesions adjacent to major
vessels, where pulsations result in mistracking of echoes [34].
Familiarity with the above artefacts is important, as they should be excluded from
the qualitative or quantitative scoring of the elastograms.
SIÊU ÂM ĐÀN HỒI và ỨNG DỤNG LÂM SÀNG
Pag
e15
3
Future perspectives
EUS probably represents the most important technical development in the field of
ultrasonography since Doppler imaging. It has many advantages over other methods
of tissue elasticity estimation, such as MR elastography, as it is a low-cost, fast, non-
invasive system, and has the potential of wider clinical availability. The evidence so
far seems very promising that EUS can be used to assess the mechanical properties
of musculoskeletal tissues in the clinical setting.
Preliminary data show that EUS may even be more sensitive than MRI or grey-scale
ultrasound in detecting subclinical changes of muscle and tendon, and therefore
could be valuable for early diagnosis and during
rehabilitation medicine. EUS could be used as a research tool to provide insight into
the biomechanics and pathophysiology of musculotendinous disease.
However, despite the great interest in the technique, the published literature is still
very limited and mainly depends on case reports or non-controlled studies with small
study populations using various EUS techniques and scoring systems. There are
several technical issues, including a lack of quantification methods, artefacts,
limitations and variation in the application of the technique by different users, which
limit the reproducibility of the method.
There are doubts regarding the potential clinical utility of this new diagnostic tool, as
in most cases the EUS showed changes already evident on conventional ultrasound
or colour Doppler imaging, whereas EUS changes not evident on conventional
imaging were occult, and therefore not clinically important.
For all of the above reasons, we think that a more systematic and structured
approach to the investigation of this new method should be undertaken. First, we
advocate standardisation of EUS for soft tissue applications, based on the
manufacturers‘ suggestions and consensus between users, employing parameters
such as the size of the elastogram, the use of adaptors/pads/gel, the scoring
systems and so on. This will be of paramount importance in achieving consistency in
the application of the technique and should allow comparisons between studies. In
order to overcome the technical issues associated with the use of EUS in
superficial tissues, close collaboration between the industry and clinical researchers
will allow the clinical experience to be used for the development of optimised
protocols dedicated to musculoskeletal applications.
Second, we need to carefully establish the indications for EUS. These would ideally
focus on the cohort of patients with symptomatic but non-ltrasound-evident disease,

SIÊU ÂM ĐÀN HỒI và ỨNG DỤNG LÂM SÀNG
Pag
e15
4
patients at risk or patients at very early stages of disease, in order to investigate
whether EUS is more sensitive than conventional imaging in depicting earlier
clinically important changes. Multicentre long-term controlled studies are needed;
these should include large populations of different ages and levels of activity with
long-term follow-up and correlation with histology, conventional imaging (ultrasound
and MRI), and biomechanical and clinical data, in order to describe the pattern and
nature of EUS findings and their clinical significance.
Finally, newer algorithms that allow quantitative assessment of elasticity such as
shear wave EUS or ARFI should be studied and compared with qualitative strain
EUS.
Figure 5. The impact of gel on the strain elastograms. (a, b) Longitudinal and (c, d)
axial elastograms of the same asymptomatic
Achilles tendon (T). The inclusion of a small amount of gel in the elastogram (b, d)
results in a homogeneously stiffer tendon without areas of distinct softening (red),
which are evident when no gel is included (a, c). The level of pressure and the
ultrasound elastography settings were kept stable.
Conclusion
Owing to lack of standardisation and limited research, EUS in its current form
remains a highly subjective technique, with debatable clinical value. With the proper
standardisation and further structured research, EUS may become a valuable
supplementary tool in the investigation of musculoskeletal disease.
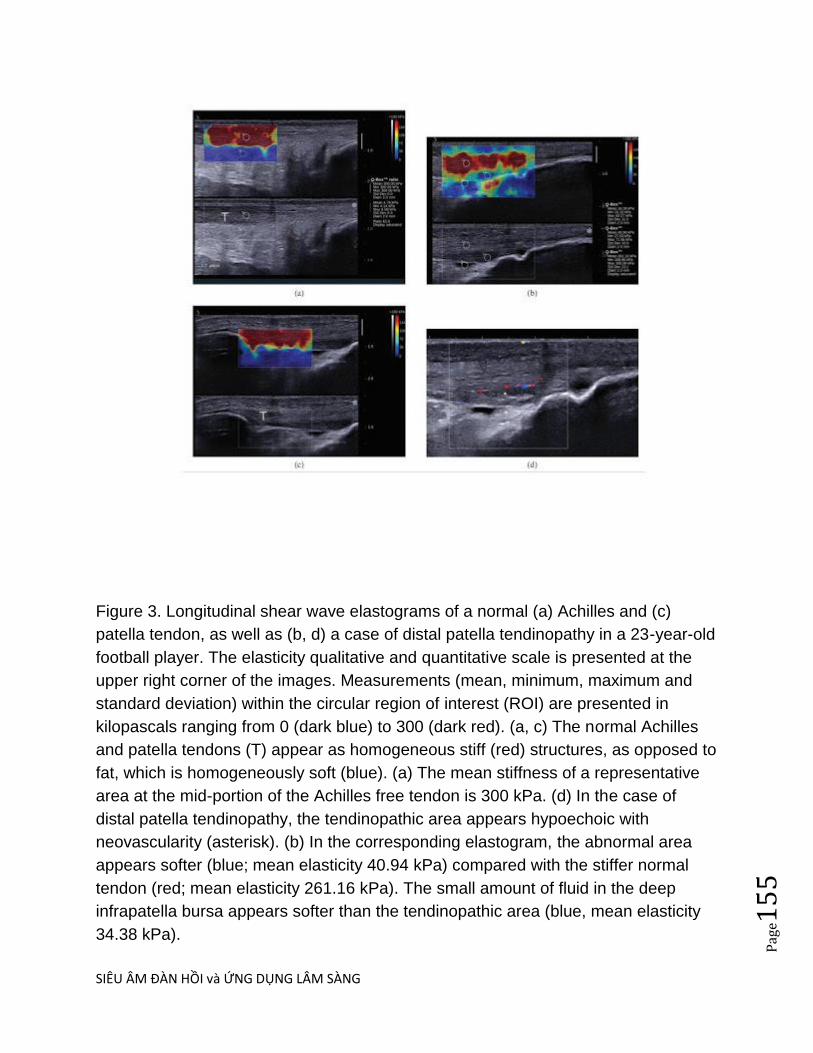
SIÊU ÂM ĐÀN HỒI và ỨNG DỤNG LÂM SÀNG
Pag
e15
5
Figure 3. Longitudinal shear wave elastograms of a normal (a) Achilles and (c)
patella tendon, as well as (b, d) a case of distal patella tendinopathy in a 23-year-old
football player. The elasticity qualitative and quantitative scale is presented at the
upper right corner of the images. Measurements (mean, minimum, maximum and
standard deviation) within the circular region of interest (ROI) are presented in
kilopascals ranging from 0 (dark blue) to 300 (dark red). (a, c) The normal Achilles
and patella tendons (T) appear as homogeneous stiff (red) structures, as opposed to
fat, which is homogeneously soft (blue). (a) The mean stiffness of a representative
area at the mid-portion of the Achilles free tendon is 300 kPa. (d) In the case of
distal patella tendinopathy, the tendinopathic area appears hypoechoic with
neovascularity (asterisk). (b) In the corresponding elastogram, the abnormal area
appears softer (blue; mean elasticity 40.94 kPa) compared with the stiffer normal
tendon (red; mean elasticity 261.16 kPa). The small amount of fluid in the deep
infrapatella bursa appears softer than the tendinopathic area (blue, mean elasticity
34.38 kPa).

SIÊU ÂM ĐÀN HỒI và ỨNG DỤNG LÂM SÀNG
Pag
e15
6
SIÊU ÂM ĐÀN HỒI SWE và ARFI GÂN CƠ TRÊN GAI
DẪN NHẬP:
Tổn thƣơng rách cơ không hoàn toàn và viêm cơ khó phân biệt trên siêu âm.Dựa vào độ cứng
của cơ, siêu âm đàn hồi có thể góp phần phân biệt rách cơ và viêm cơ hoặc sẹo xơ hóa cơ sau
chấn thƣơng.
MỤC TIÊU= Khảo sát độ cứng chỗ rách và chỗ xơ hóa gân cơ trên gai.
ĐÔI TƢỢNG và PHƢƠNG PHÁP: Gồm 49 ca đƣợc khám siêu âm đàn hồi SWE (máy
Supersonic) và ARFI (Acuson Siemens S2000) sau khám lâm sàng xác nhận tổn thƣơng (rách
hay viêm) chóp xoay.Phần mềm Med-calc đƣợc dùng để xử lý thống kê trong khảo sát này.
KẾT QUẢ và BÀN LUẬN: Gồm 19 ca không tổn thƣơng, 15 ca rách chóp xoay và 15 ca viêm
xơ khu trú chóp xoay. Giá trị tốc độ đàn hồi SWE lần lƣợt = 22,10+/-4,06kPa; 35,39+/-5,30kPa
và 62,70+/-11,29kPa. Khác biệt có ý nghĩa thống kê giữa rách và viêm xơ (p<0,0001) cung nhƣ
giữa rách và không tổn thƣơng, và giữa viêm xơ và không tổn thƣơng. Đối với ky thuật ARFI,
bản đồ đàn hồi có mã màu đen (cứng) trong khi ở SWE có mã màu đo (cứng).
SIÊU ÂM ĐÀN HỒI và ỨNG DỤNG LÂM SÀNG
Pag
e15
7
Keywords: SWE: shear wave elastography, ARFI: acoustic radiation force impulse,
eSie Touch , VTI: virtual touch imaging, VTQ: virtual touch quantification, rotary
cuff tear, rotator supraspinalis tendon.
INTRODUCTION:
Rotator cuff tears frequently, accounting for 50% or more cases in the
elderly, have a certain impact on upper limb function, and quality of life.
Conventional ultrasound proved high sensitivity and specificity in detecting total
or partial rotator cuff tears. But there was still no
published reports of elastic ultrasound on rotator cuff.
The purpose of this report is to apply at the same time two ultrasonic
elastic transient techniques for evaluating the stiffness of intact and supraspinatus
tendon disorders.
MATERIALS and METHODS:
From 8-2011 to 12-2012 we have
Aplied shear wave SW (Supersonic Imagine) and acoustic radiation force impulse
ARFI (Siemens) techniques to examine the rotator cuff supraspinatus tendon. A total
of 49 supraspinatus (SS) tendons were enrolled in this study, including
19 normal cases, 15 cases of partial tear and 15 cases of fibrotic change of
supraspinatus tendon.
All patients and volunteers agreed to participate in the
study and to permit using data for research and publication. This
study also was allowed by our Ethic Committee of our institution.
We use shear wave elastography of Supersonic Imagine system and acoustic
radiation force impulse (ARFI) of the Siemens S2000 to survey the stiffness
of rotator cuff supraspinatus (SS) tendon. Patients were in sitting
and holding the abduction position of shoulder joint, as measuring in the cross-section
and longitudinal section at the site of torn, and fibrotic change of SS tendon. Cases of
calcified and inflammed tendon were excluded from this study.
RESULTS:
With shear wave technique of Supersonic Imagine, we collected the following results
in table 1:

SIÊU ÂM ĐÀN HỒI và ỨNG DỤNG LÂM SÀNG
Pag
e15
8
Table 1: Elastic velocities of normal SS, torn site of SS and fibrotic change site of
SS
Number of case Shear Wave Velocity
Normal SS 19 22.10+/- 4.06 kPa
Torn site of SS 15 35.39+/-5.30 kPa
Fibrotic change site of SS 15 62.70+/-11.29 kPa
Total 49
SS= supraspinatus tendon.
All cases of ARFI technique were out of range of measurement (X.XX m/s) in
measuring of torn site and fibrotic change site of supraspinatus (SS) tendon.
Elastic map color-coded of SWE of Supersonic were in the orange and red [hard].
In ARFI technique, these areas on elastic map had darker color [hard] and were bigger
than the B-mode image.
DISCUSSION:
We recognized fibrotic change site and torn site of SS tendon having elastic velocity
values higher than elastic value of intact SS tendon. And elastic velocity
value between the torn and fibrotic change proved the fibrotic change having more
stiffness than the torn SS. Statistical difference of elastic velocity value between 2
groups was shown with t-test (p < 0.0001).

SIÊU ÂM ĐÀN HỒI và ỨNG DỤNG LÂM SÀNG
Pag
e15
9
Siemens system does not support ARFI technique for measuring the elastic velocity
for musculoskeleton applications. Thus applying ARFI technique for the muscle and
tendon we only use VTI [virtual touch imaging], only qualitative but not quantitative.

SIÊU ÂM ĐÀN HỒI và ỨNG DỤNG LÂM SÀNG
Pag
e16
0
Elastographic ultrasound (SWE and ARFI) detected qualitatively and
quantitatively stiff areas of abnormal supraspinatus tendon, while ARFI values
(Siemens S2000) tend to be over the limit of measurement.
CONCLUSION
Partial and complete thickness rotator cuff tears and fibrotic change of supraspinatus
tendon are musculoskeletal condition of old
patients. SSI and ARFI techniques help identifying easily
the hard areas (partial tear, fibrotic change) of the SS tendon. The more stiff the more
abnormal. But further investigation with a larger sample is necessary to reference
data in daily clinical practice.
REFERENCES:
Smith TO, Back T, Toms AP, Hing CB.: Diagnostic accuracy of ultrasound for rotator
cuff tears in adults: a systematic review and meta-analysis. Copyright © 2011
The Royal College of Radiologists. Elsevier Ltd.
______________________________________________________
DẪN NHẬP:
Rách chóp xoay thƣờng gặp, chiếm khoảng 50% trƣờng hợp hoặc hơn ở ngƣời già trên 60 tuổi, có ảnh hƣởng nhất định đến chức năng chi trên, sức khỏe nói chung và chất lƣợng sống.
SIÊU ÂM ĐÀN HỒI và ỨNG DỤNG LÂM SÀNG
Pag
e16
1
Siêu âm quy ƣớc với đầu dò ly giải cao có độ nhạy và độ đặc hiệu trong phát hiện rách gân cơ toàn phần hoặc một phần.
Với ứng dụng siêu âm đàn hồi, đã có vài báo cáo khảo sát khớp vai và chóp xoay với các số liệu trên ngƣời bình thƣờng.
Từ tháng 8-2011 đến 12-2012 chúng tôi đã áp dụng siêu âm đàn hồi sóng biến dạng SWE (Supersonic Imagine) và xung lực bức xạ âm ARFI [Siemens] để khảo sát gân cơ trên gai của chóp xoay.
Mục tiêu của báo cáo này là áp dụng cùng lúc 2 kỹ thuật siêu âm đàn hồi thoáng qua trên để đo độ cứng gân trên gai bình thƣờng và bệnh lý.
ĐỐI TƢỢNG và PHƢƠNG PHAP=
Gồm 19 ca bình thƣờng, 15 ca rách bán phần và 15 ca xơ hóa gân trên gai. Tất cả đều đồng ý tham gia nghiên cứu và cho phép sử dụng dữ liệu để nghiên cứu và công bố. Nghiên cứu này cũng đƣợc BGĐ cho phép tiến hành.
Chúng tôi dùng kỹ thuật đo sóng đàn hồi biến dạng (shear wave elastography) của máy Supersonic Imagine và đo xung lực bức xạ âm ARFI của máy Siemens S2000 để khảo sát gân cơ trên gai của chóp xoay (rotator cuff supraspinatus tendon). Bệnh nhân ngồi giữ yên tƣ thế dạng khớp vai, trong khi đƣợc đo theo mặt cắt ngang ở các vị trí rách gân, không rách, và nơi xơ hóa gân. Chúng tôi loại bỏ các trƣờng hợp có vôi hóa khu trú gân cơ trên gai.
KẾT QUẢ:
Với kỹ thuật đo sóng đàn hồi biến dạng SWE của máy Supersonic Imagine, kết quả chúng tôi đo đƣợc nhƣ sau:
Gân cơ trên gai bình thƣờng (normal) = 22,10+/- 4,06 kPa

SIÊU ÂM ĐÀN HỒI và ỨNG DỤNG LÂM SÀNG
Pag
e16
2
Chỗ rách (torn site) = 35,39+/-5,30 kPa
Chỗ hóa xơ (fibrosis site)= 62,70+/-11,29 kPa
Với kỹ thuật ARFI, định lƣợng VTQ [virtual touch quantification] hầu hết đều quá ngƣỡng máy khi đo chỗ rách và chỗ xơ hóa.
BAN LUẬN:
Bảng 1: Bảng kê giá trị tốc độ đàn hồi SWE bình quân của 3 nhóm gân bình thường
và bệnh lý (Không có giá trị tốc độ đàn hồi ARFI vì VTQ luôn có giá trị vượt ngưỡng
máy =X,XXm/s).
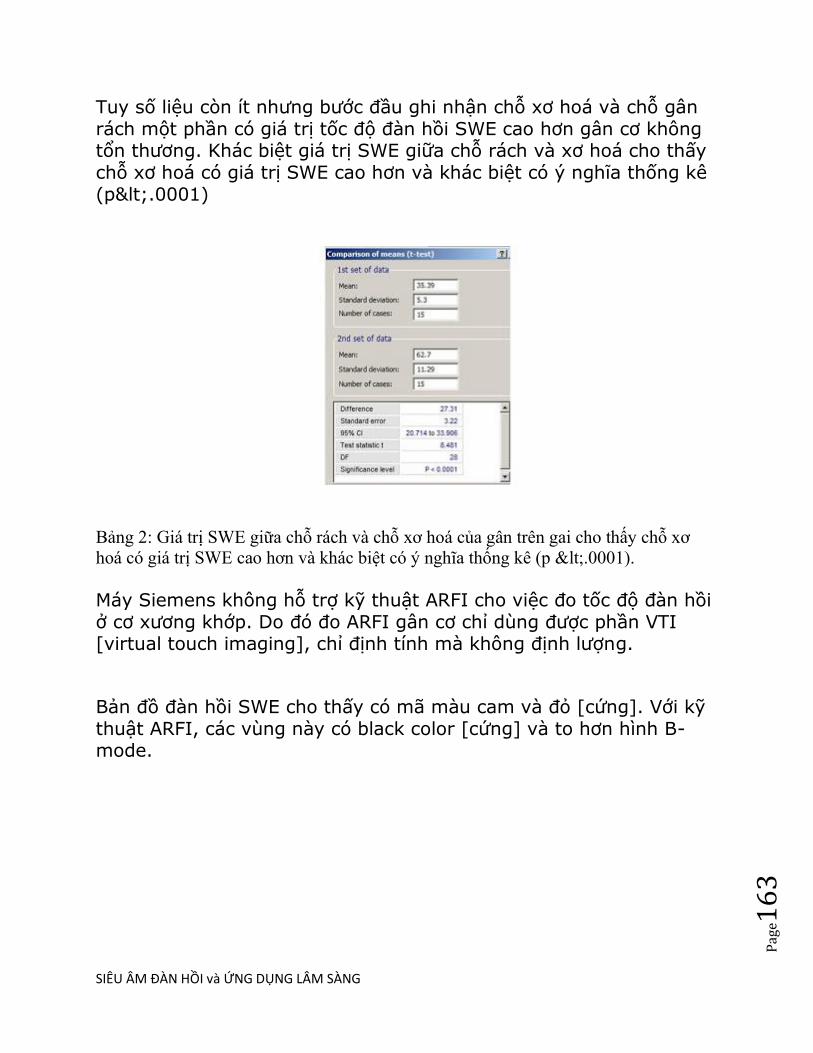
SIÊU ÂM ĐÀN HỒI và ỨNG DỤNG LÂM SÀNG
Pag
e16
3
Tuy số liệu còn ít nhƣng bƣớc đầu ghi nhận chỗ xơ hoá và chỗ gân rách một phần có giá trị tốc độ đàn hồi SWE cao hơn gân cơ không tổn thƣơng. Khác biệt giá trị SWE giữa chỗ rách và xơ hoá cho thấy chỗ xơ hoá có giá trị SWE cao hơn và khác biệt có ý nghĩa thống kê (p<.0001)
Bảng 2: Giá trị SWE giữa chỗ rách và chỗ xơ hoá của gân trên gai cho thấy chỗ xơ
hoá có giá trị SWE cao hơn và khác biệt có ý nghĩa thống kê (p <.0001).
Máy Siemens không hỗ trợ kỹ thuật ARFI cho việc đo tốc độ đàn hồi ở cơ xƣơng khớp. Do đó đo ARFI gân cơ chỉ dùng đƣợc phần VTI [virtual touch imaging], chỉ định tính mà không định lƣợng.
Bản đồ đàn hồi SWE cho thấy có mã màu cam và đỏ [cứng]. Với kỹ thuật ARFI, các vùng này có black color [cứng] và to hơn hình B-mode.

SIÊU ÂM ĐÀN HỒI và ỨNG DỤNG LÂM SÀNG
Pag
e16
4
Hình 1: Kỹ thuật ARFI của rách gân trên gai, tốc độ đàn hồi vượt ngưỡng. Hình bản
đồ đàn hồi eSie Touch với 3 color code cho thấy chỗ rách cứng (black color/ red
color/ blue color).
Hình 2: Chỗ rách gân trên gai có tốc độ đàn hồi SWE=35,39 kPa trong khi chỗ
gân không tổn thương là 22,96 kPa.

SIÊU ÂM ĐÀN HỒI và ỨNG DỤNG LÂM SÀNG
Pag
e16
5
Hình 3: Xơ hóa khu trú gân trên gai có tốc độ đàn hồi SWE=69,43 kPa, chỗ gân lành
là 23,56 kPa.
KẾT LUẬN
Siêu âm đàn hồi SSI và ARFI giúp nhận diện các vùng cứng của gân cơ trên gai bị tổn thƣơng (rách một phần, xơ hoá). Cần thực hiện khảo sát thêm với mẫu lớn hơn để có dữ liệu tham khảo trong thực hành lâm sàng hàng ngày.
TAI LIỆU THAM KHẢO: 1/ Drakonaki EE et al : Ultrasound elastography for musculoskeletal applications, The British Journal of Radiology, November 2012, 85 (2012), 1435-1445. 2/ Minoru Shinohara, Karim Sabra, Jean-Luc Gennisson, Mathias Flink and Mickael Tanter: Real-Time Visualization of Muscle Stiffness Distribution with Ultrsound Shear Wave Imaging During Muscle Contraction, Muscle & Nerve Month 2010. 3/ Smith TO, Back T, Toms AP, Hing CB.: Diagnostic accuracy of ultrasound for rotator
cuff tears in adults: a systematic review and meta-analysis. Copyright © 2011 The Royal
Collegeof Radiologists. Elsevier Ltd.

SIÊU ÂM ĐÀN HỒI và ỨNG DỤNG LÂM SÀNG
Pag
e16
6
SIÊU ÂM ĐÀN HỒI TRONG SẢN PHỤ KHOA
SWE CỔ TỬ CUNG
RTE of BENIGN and MALIGNANT CERVICAL LESIONS
Objectives—This study aimed to evaluate the clinical value of ultrasound elastography in the differential diagnosis of benign and malignant cervical lesions and to compare the accuracy of the elasticity score and strain ratio in differentiating cervical lesions. Methods—B-mode sonography and ultrasound elastography were performed on 84 cervical lesions (40 benign and 44 malignant) in 84 patients. All of the images were obtained transvaginally. The elasticity score was determined by a 5-point scoring method. Calculation of the strain ratio was based on a comparison of the average strain measured in the lesion with the adjacent tissue of the same depth, size, and shape. The findings were compared with histopathologic results. With the use of receiver operating characteristic curves, the diagnostic value of the elasticity score and strain

SIÊU ÂM ĐÀN HỒI và ỨNG DỤNG LÂM SÀNG
Pag
e16
7
ratio methods was determined. Results—The sensitivity, specificity, accuracy, positive predictive value, and negative predictive value of the elasticity score in the differential diagnosis of cervical lesions were 81.8%, 85.0%, 83.3%, 85.7%, and 81.0%, respectively, whereas those of the strain ratio were 90.9%, 90.0%, 90.5%, 90.9%, and 90.0%. A strain ratio cutoff value of 4.525 was used as a standard to distinguish benign from malignant lesions. The strain ratio values of malignant lesions were much higher than those of benign lesions (range, 4.85–8.91 versus 0.62–4.50). The differences were statistically significant (P < .01).

SIÊU ÂM ĐÀN HỒI và ỨNG DỤNG LÂM SÀNG
Pag
e16
8
Conclusions—Ultrasound elastography is a promising technique that is easy and rapid to perform and can help identify cervical lesions that are likely to be malignant. It is obvious that the strain ratio yielded better results than the elasticity score. Both methods are semiquantitative, but quantification of the strain ratio is finer than that of the elasticity score. Key Words—cervical lesions; elasticity score; gynecologic ultrasound; strain ratio; ultrasound elastography
IEEE Trans Ultrason Ferroelectr Freq Control. 2013 Oct;60(10):2053-64. doi: 10.1109/TUFFC.2013.2796.
Evaluating the feasibility of acoustic radiation force impulse shear wave elasticity imaging of the uterine cervix with an intracavity array: a simulation study.
Palmeri ML, Feltovich H, Homyk AD, Carlson LC, Hall TJ.
Abstract
The uterine cervix softens, shortens, and dilates throughout
pregnancy in response to progressive disorganization of its
layered collagen microstructure. This process is an essential part
of normal pregnancy, but premature changes are associated with
preterm birth. Clinically, there are no reliable noninvasive
methods to objectively measure cervical softening or assess
cervical microstructure. The goal of these preliminary studies was
to evaluate the feasibility of using an intracavity ultrasound array
to generate acoustic radiation force impulse (ARFI) excitations in
the uterine cervix through simulation, and to optimize the acoustic
radiation force (ARF) excitation for shear wave elasticity imaging
(SWEI) of the tissue stiffness. The cervix is a unique soft tissue
target for SWEI because it has significantly greater acoustic
attenuation (α = 1.3 to 2.0 dB·cm(-1)·MHz(-)1) than other soft
tissues, and the pathology being studied tends to lead to an
increase in tissue compliance, with healthy cervix being relatively

SIÊU ÂM ĐÀN HỒI và ỨNG DỤNG LÂM SÀNG
Pag
e16
9
stiff compared with other soft tissues (E ≈ 25 kPa). Additionally,
the cervix can only be accessed in vivo using a transvaginal or
catheter-based array, which places additional constraints on the
excitation focal characteristics that can be used during SWEI.
Finite element method (FEM) models of SWEI show that larger-
aperture, catheter-based arrays can utilize excitation frequencies
up to 7 MHz to generate adequate focal gain up to focal depths
10 to 15 mm deep, with higher frequencies suffering from
excessive amounts of near-field acoustic attenuation. Using full-
aperture excitations can yield ~40% increases in ARFI-induced
displacements, but also restricts the depth of field of the excitation
to ~0.5 mm, compared with 2 to 6 mm, which limits the range that
can be used for shear wave characterization of the tissue. The
center-frequency content of the shear wave particle velocity
profiles ranges from 1.5 to 2.5 kHz, depending on the focal
configuration and the stiffness of the material being imaged.
Overall, SWEI is possible using catheter-based imaging arrays to
generate adequate displacements in cervical tissue for shear
wave imaging, although specific considerations must be made
when optimizing these arrays for this shear wave imaging
application.
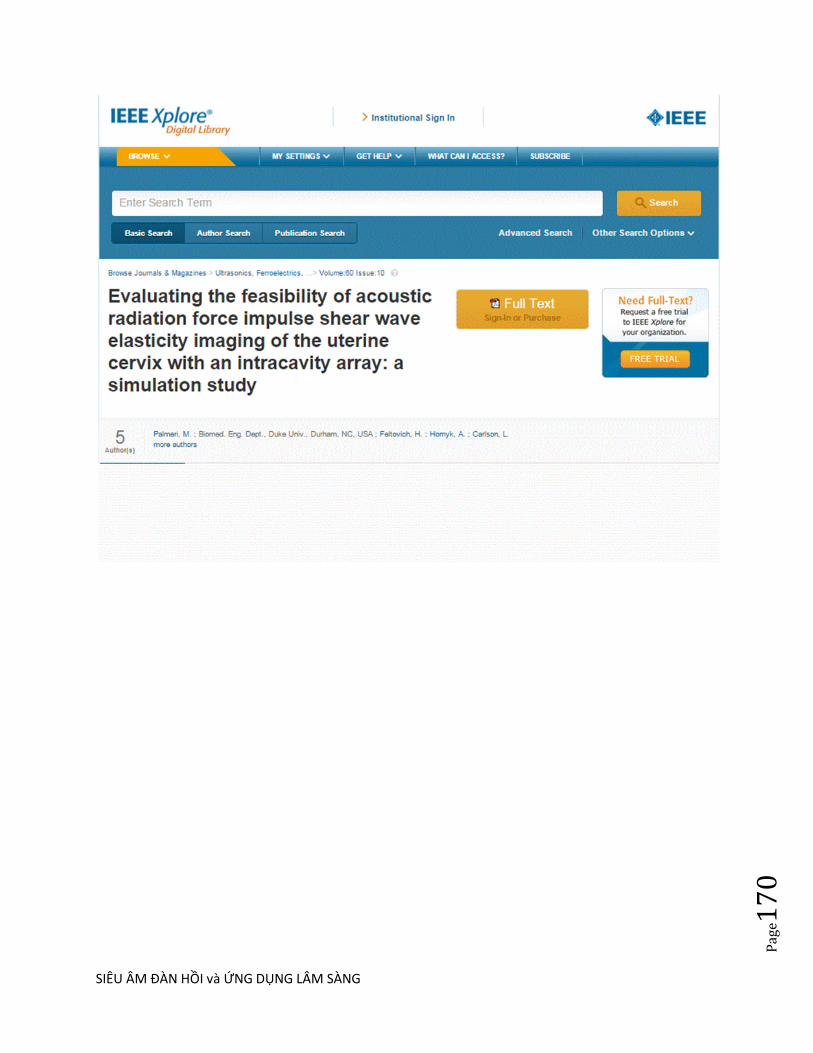
SIÊU ÂM ĐÀN HỒI và ỨNG DỤNG LÂM SÀNG
Pag
e17
0
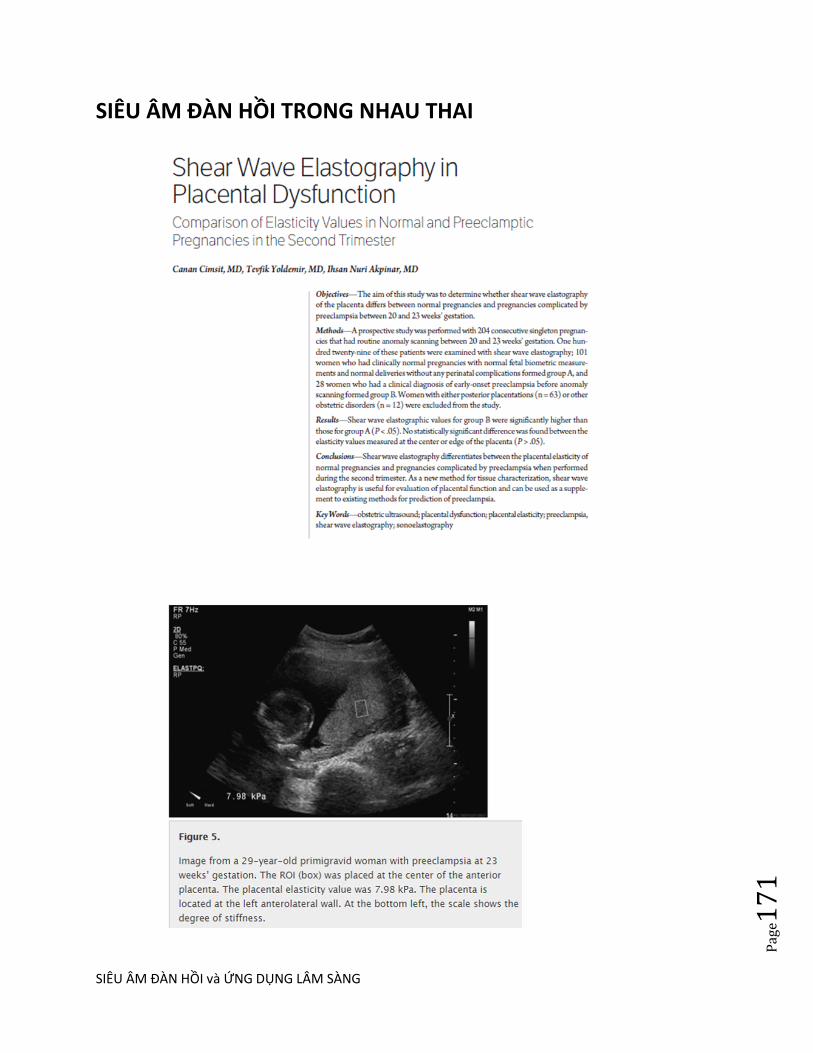
SIÊU ÂM ĐÀN HỒI và ỨNG DỤNG LÂM SÀNG
Pag
e17
1
SIÊU ÂM ĐÀN HỒI TRONG NHAU THAI

SIÊU ÂM ĐÀN HỒI và ỨNG DỤNG LÂM SÀNG
Pag
e17
2
SIÊU ÂM ĐÀN HỒI TRONG HUYẾT KHỐI TĨNH MẠCH CHI DƯỚI

SIÊU ÂM ĐÀN HỒI và ỨNG DỤNG LÂM SÀNG
Pag
e17
3

SIÊU ÂM ĐÀN HỒI và ỨNG DỤNG LÂM SÀNG
Pag
e17
4

SIÊU ÂM ĐÀN HỒI và ỨNG DỤNG LÂM SÀNG
Pag
e17
5
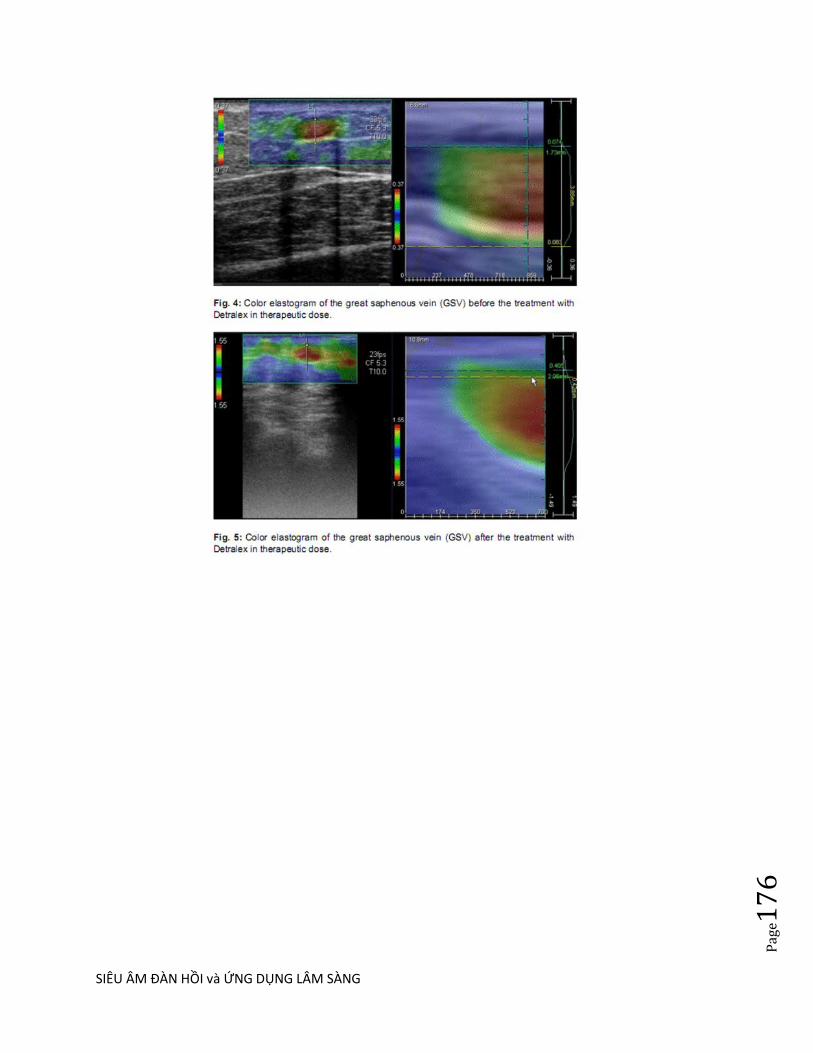
SIÊU ÂM ĐÀN HỒI và ỨNG DỤNG LÂM SÀNG
Pag
e17
6

SIÊU ÂM ĐÀN HỒI và ỨNG DỤNG LÂM SÀNG
Pag
e17
7

SIÊU ÂM ĐÀN HỒI và ỨNG DỤNG LÂM SÀNG
Pag
e17
8

SIÊU ÂM ĐÀN HỒI và ỨNG DỤNG LÂM SÀNG
Pag
e17
9

SIÊU ÂM ĐÀN HỒI và ỨNG DỤNG LÂM SÀNG
Pag
e18
0
SIÊU ÂM ĐÀN HỒI TRONG BỆNH LÝ PHỔI
Siêu âm đàn hồi ARFI và siêu âm thƣờng quy chẩn đoán phân biệt tổn thƣơng đặc ở
phổi
Bs Lê Thanh Liêm, Bs Nguyễn Thiện Hùng, Bs Phan Thanh Hải
Trung Tâm Y Khoa Medic, TP. Hồ Chí Minh, Việt Nam
Tóm tắt Mục đích Sử dụng ky thuật tạo hình xung lực bức xạ âm (ARFI - Acoustic Radiation Force Impulse
Imaging) để khảo sát các tổn thƣơng đặc phổi ở ngoại vi, kết hợp với siêu âm B-mode và
Doppler để đánh giá khả năng của ky thuật ARFI trong chẩn đoán phân biệt các tổn thƣơng này. Đối tƣợng và phƣơng pháp Tổng cộng có 28 bệnh nhân tại Trung tâm Y khoa Medic từ tháng 10 năm 2008 đến tháng 12
năm 2012, trong đó có 21 bệnh nhân nam, tuổi từ 18 đến 79. 16 trƣờng hợp viêm phổi thùy
(57,1%), 6 trƣờng hợp xẹp phổi (21,4%), 4 trƣờng hợp ung thƣ phế quản (14,2%), 2 trƣờng hợp
lymphoma di căn phổi (7,1%). 6 trƣờng hợp đƣợc làm siêu âm đàn hồi ARFI, bao gồm 3 trƣờng
hợp viêm phổi thùy và 3 trƣờng hợp xẹp phổi. Mỗi trƣờng hợp đƣợc đo ARFI (VTQ) 5 lần. Tất
cả các trƣờng hợp đã đƣợc chụp X-Quang phổi, xét nghiệm. Chụp cắt lớp vi tính đã đƣợc sử
dụng trong các trƣờng hợp chẩn đoán không rõ ràng (10 trƣờng hợp, 35,7%). Phần mềm thống
kê Medcalc đƣợc sử dụng để so sánh giá trị ARFI (V = m / giây) giữa hai nhóm. Kết quả 16 trƣờng hợp viêm phổi thùy, 9 trƣờng hợp ở thùy dƣới của phổi (87,5%), có hình tam giác
(94%), bờ đều (68,7%), đồng phản âm với mô gan (25%), có khí ảnh nội phế quản (94%), có
hình ảnh cây mạch máu (56%), phổ 3 pha kháng lực cao trên siêu âm Doppler (7/9 trƣờng hợp).
6 trƣờng hợp xẹp phổi, thƣờng có hình tam giác (100%), bờ đều (83,3%), tăng âm (100%), cây
mạch máu (2/6 trƣờng hợp), phổ Doppler 3 pha kháng lực cao (2/2 ca), khí ảnh nội phế quản
(50%). 4 trƣờng hợp ung thƣ phế quản, thƣờng có hình bầu dục (75%), bờ không đều (75%),
giảm âm (100%), không có khí ảnh nội phế quản, có mạch máu đơn lẻ (4/4 trƣờng hợp), phổ 1
pha kháng lực thấp (3/4 trƣờng hợp). Lymphoma có hình tron hay oval, phản âm kém giống nang
và mạch máu đơn lẻ, không có khí ảnh nội phế quản. Vận tốc sóng biến dạng của viêm phổi thùy
từ 2,06 đến 4,02 m/giây (trung bình=3,11 ± 0,99 m/giây) và của xẹp phổi từ 0,94 đến 1,93
m/giây (trung bình=1,52 ± 0,46 m/giây). Có sự khác biệt có ý nghĩa thống kê giữa hai nhóm với t
= 2,896 (p = 0.034). Vận tốc sóng biến dạng của viêm phổi thùy cao hơn (cứng hơn) vận tốc
sóng biến dạng của xẹp phổi. Kết luận Đây là một nghiên cứu sơ bộ về siêu âm đàn hồi ARFI trong chẩn đoán phân biệt tổn thƣơng đặc
phổi ở ngoại vi, kết hợp với siêu âm B-mode và Doppler. Kết quả ban đầu cho thấy vận tốc sóng
biến dạng ARFI của viêm phổi thùy cao hơn (cứng hơn) vận tốc sóng biến dạng của xẹp phổi. Trong tƣơng lai, cần nghiên cứu với số lƣợng lớn để xác nhận khả năng của ky thuật này và ứng
dụng trong thực hành lâm sàng.
Tổng quan

SIÊU ÂM ĐÀN HỒI và ỨNG DỤNG LÂM SÀNG
Pag
e18
1
Siêu âm phổi đã đƣợc biết đến từ lâu và có nhiều nghiên cứu và sách giáo khoa trên
thế giới. Tuy nhiên, trong thực tế siêu âm ít đƣợc sử dụng trong chẩn đoán bệnh lý
phổi, ngoại trừ chẩn đoán dịch màng phổi.
Viêm phổi thùy, xẹp phổi và u phổi là 3 bệnh lý ở phổi thƣờng gặp và biểu hiện trên
X-Quang là đám mờ với nét đặc trƣng riêng, tuy nhiên nhiều trƣờng hợp không thể
phân biệt đƣợc rõ ràng. Trong trƣờng hợp xẹp thùy phổi do tràn dịch màng phổi, X-
Quang khó phát hiện do chồng lấp với hình mờ của dịch.
Siêu âm phổi chi thấy tổn thƣơng ngoại vi phổi, nhƣng khi thấy thì cung cấp rất nhiều
thông tin về đặc điểm của tổn thƣơng và có khi chấn đoán chính xác bản chất tổn
thƣơng. Trong viêm phổi thùy đã điều trị khoi, hình ảnh tổn thƣơng phổi trên siêu âm
mất đi trƣớc khi mất trên X Quang.
Siêu âm Doppler màu cung cấp hình ảnh phân bố mạch máu trong tổn thƣơng,
Doppler phổ giúp phân biệt nguồn gốc mạch máu. Theo đó, phổ 3 pha kháng lực cao
là đặc trƣng của động mạch phổi và phổ 1 pha kháng lực trung bình là đặc trƣng của
động mạch phế quản trung tâm.
Siêu âm đàn hồi là ky thuật mới, quan sát tổn thƣơng theo chiều kích mới, đó là dựa
vào độ cứng của tổn thƣơng. Chúng tôi chƣa tìm thấy báo cáo nghiên cứu nào trƣớc
đây về siêu âm đàn hồi chẩn đoán tổn thƣơng đặc ở phổi.
Ky thuật tạo hình xung lực bức xạ âm (Acoustic Radiation Force Impulse Imaging –
ARFI) trên máy Siemen Acuson S2000 là ky thuật dùng chùm sóng âm tập trung tác
động vào vùng quan tâm (region of interest - ROI) gây sự dời chỗ mô. Sự dời chỗ sinh
ra sóng biến dạng là sóng ngang. Ky thuật này gồm hai phần: Một là bản đồ đàn hồi
(VTI-Virtual Touch Tissue Imaging), ghi lại sự dời chỗ mô, với quy luật vật lý là mô
càng cứng thì sự dời chỗ càng ít và đƣợc mã hóa thành màu đen. Hai là định lƣợng
vận tốc sóng biến dạng (VTQ-Virtual Touch Tissue Quantification) với quy luật vật lý
là mô càng cứng thì tốc độ truyền sóng càng cao (hình 8).
Mục đích
Sử dụng ky thuật ARFI khảo sát các tổn thƣơng đặc phổi ngoại vi, kết hợp với siêu
âm B-mode và Doppler để đánh giá khả năng của ky thuật ARFI trong chẩn đoán
phân biệt các tổn thƣơng này.
Phƣơng pháp và đối tƣợng
Tổng số 28 bệnh nhân tại Trung tâm Y khoa Medic từ tháng 10 năm 2008 đến tháng
12 năm 2012, tuổi từ 18 đến 79, có 16 trƣờng hợp viêm phổi thùy (57,1%), 6 trƣờng
hợp xẹp phổi (21,4%), 4 trƣờng hợp ung thƣ phế quản (14,2%), 2 trƣờng hợp
lymphoma di căn phổi (7,1%).
6 trƣờng hợp đƣợc làm siêu âm đàn hồi ARFI, bao gồm 3 trƣờng hợp viêm phổi thùy
và 3 trƣờng hợp xẹp phổi. Mỗi trƣờng hợp đƣợc đo ARFI (VTQ) 5 lần. Sử dụng phần
mềm thống kê Medcalc để so sánh giá trị ARFI (V=m/giây) giữa hai nhóm.

SIÊU ÂM ĐÀN HỒI và ỨNG DỤNG LÂM SÀNG
Pag
e18
2
Tất cả các trƣờng hợp đã đƣợc chụp X-Quang phổi, xét nghiệm máu và siêu âm bằng
đầu do cong 3,5 MHz hoặc đầu do thẳng 7,5 MHz trên nhiều loại máy siêu âm
(Siemens, Aloka, Medison,…). Chụp cắt lớp vi tính dùng trong các trƣờng hợp chẩn
đoán không rõ ràng (10 trƣờng hợp, 35.7%).
Kết quả
16 trƣờng hợp viêm phổi thùy, thƣờng ở thùy dƣới của phổi (87,5%), có hình tam giác
(94%), bờ đều (68,7%), đồng phản âm với mô gan (25%), có khí ảnh nội phế quản (air
bronchogram) (94%), có hình ảnh cây mạch máu (9 trƣờng hợp, 56%), phổ
3 pha kháng lực cao trên siêu âm Doppler (7/9 trƣờng hợp, 77,8%) (hình 1, hình 2).
6 trƣờng hợp xẹp phổi, thƣờng có hình tam giác (100%), bờ đều (83,3%), tăng
âm (100%), cây mạch máu (2/6 trƣờng hợp), phổ Doppler 3 pha kháng lực cao
(2/2 trƣờng hợp), khí ảnh nội phế quản (50%) (hình 3, hình 8).

SIÊU ÂM ĐÀN HỒI và ỨNG DỤNG LÂM SÀNG
Pag
e18
3
4 trƣờng hợp ung thƣ phế quản, thƣờng có hình bầu dục (75%), bờ không đều (75%),
giảm âm (100%), không có khí ảnh nội phế quản, có mạch máu đơn lẻ (4 trƣờng hợp,
100%), phổ 1 pha kháng lực thấp (3/4 trƣờng hợp, 75%) (Hình 4, Hình 5).
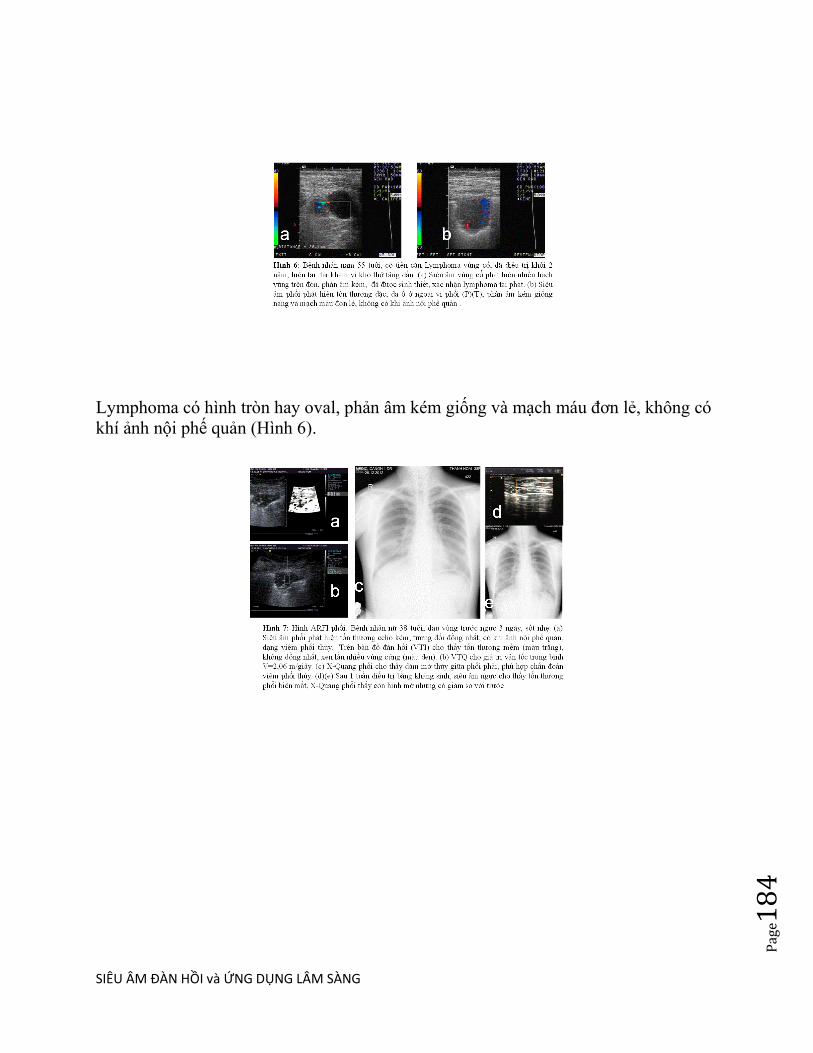
SIÊU ÂM ĐÀN HỒI và ỨNG DỤNG LÂM SÀNG
Pag
e18
4
Lymphoma có hình tron hay oval, phản âm kém giống và mạch máu đơn lẻ, không có
khí ảnh nội phế quản (Hình 6).
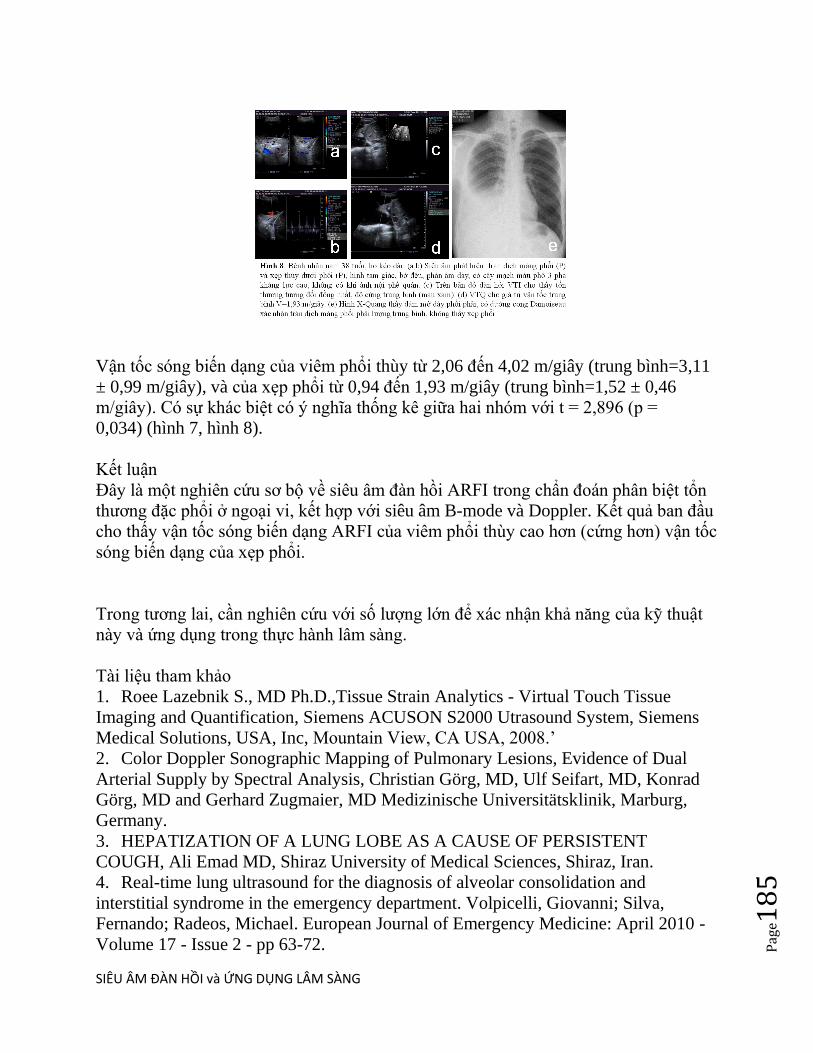
SIÊU ÂM ĐÀN HỒI và ỨNG DỤNG LÂM SÀNG
Pag
e18
5
Vận tốc sóng biến dạng của viêm phổi thùy từ 2,06 đến 4,02 m/giây (trung bình=3,11
± 0,99 m/giây), và của xẹp phổi từ 0,94 đến 1,93 m/giây (trung bình=1,52 ± 0,46
m/giây). Có sự khác biệt có ý nghĩa thống kê giữa hai nhóm với t = 2,896 (p =
0,034) (hình 7, hình 8).
Kết luận
Đây là một nghiên cứu sơ bộ về siêu âm đàn hồi ARFI trong chẩn đoán phân biệt tổn
thƣơng đặc phổi ở ngoại vi, kết hợp với siêu âm B-mode và Doppler. Kết quả ban đầu
cho thấy vận tốc sóng biến dạng ARFI của viêm phổi thùy cao hơn (cứng hơn) vận tốc
sóng biến dạng của xẹp phổi.
Trong tƣơng lai, cần nghiên cứu với số lƣợng lớn để xác nhận khả năng của ky thuật
này và ứng dụng trong thực hành lâm sàng.
Tài liệu tham khảo
1. Roee Lazebnik S., MD Ph.D.,Tissue Strain Analytics - Virtual Touch Tissue
Imaging and Quantification, Siemens ACUSON S2000 Utrasound System, Siemens
Medical Solutions, USA, Inc, Mountain View, CA USA, 2008.‘
2. Color Doppler Sonographic Mapping of Pulmonary Lesions, Evidence of Dual
Arterial Supply by Spectral Analysis, Christian Görg, MD, Ulf Seifart, MD, Konrad
Görg, MD and Gerhard Zugmaier, MD Medizinische Universitätsklinik, Marburg,
Germany.
3. HEPATIZATION OF A LUNG LOBE AS A CAUSE OF PERSISTENT
COUGH, Ali Emad MD, Shiraz University of Medical Sciences, Shiraz, Iran.
4. Real-time lung ultrasound for the diagnosis of alveolar consolidation and
interstitial syndrome in the emergency department. Volpicelli, Giovanni; Silva,
Fernando; Radeos, Michael. European Journal of Emergency Medicine: April 2010 -
Volume 17 - Issue 2 - pp 63-72.

SIÊU ÂM ĐÀN HỒI và ỨNG DỤNG LÂM SÀNG
Pag
e18
6
SIÊU ÂM ĐÀN HỒI TRONG BẸNH LÝ DA MELANOMA ÁC VÀ ELASTOGRAPHY , BS PHAN THANH HẢI
Woman 55 yo worried about the black skin spot at the left eyebrow which was getting bigger and itchy recenlty in this month ( see foto), and one dermatologist made a caution that was to be a melanoma.
Ultrasound of this skin tumor by 15MHz probe with Doppler showed that was a superficial skin tumor, size of 2 cm and rich vessel supplying. Elastoscan ultrasound showed this tumor in blue code, not invasive to deep layer.

SIÊU ÂM ĐÀN HỒI và ỨNG DỤNG LÂM SÀNG
Pag
e18
7
What is your diagnosis for it ?
Operation for resection this tumor and microscopic report was a pigmented papilloma with melanocyte (see pathology report).