Short-term effects of defoliation on herbage productivity and … · 2019-11-10 · Contents II...
139
Aus dem Institut für Pflanzenbau und Pflanzenzüchtung -Grünland und Futterbau/Ökologischer Landbau- der Christian-Albrechts-Universität zu Kiel Short-term effects of defoliation on herbage productivity and herbage quality in a semi-arid grassland ecosystem of Inner Mongolia, P.R. China Dissertation zur Erlangung des Doktorgrades der Agrar- und Ernährungswissenschaftlichen Fakultät der Christian-Albrechts-Universität zu Kiel vorgelegt von Dipl.-Ing. agr. Anne Kathrin Schiborra aus Lengerich/Westf. Kiel, 2007
Transcript of Short-term effects of defoliation on herbage productivity and … · 2019-11-10 · Contents II...
Aus dem Institut für Pflanzenbau und Pflanzenzüchtung
-Grünland und Futterbau/Ökologischer Landbau-
der Christian-Albrechts-Universität zu Kiel
Short-term effects of defoliation on herbage productivity and
herbage quality in a semi-arid grassland ecosystem of
Inner Mongolia, P.R. China
Dissertation
zur Erlangung des Doktorgrades
der Agrar- und Ernährungswissenschaftlichen Fakultät
der Christian-Albrechts-Universität zu Kiel
vorgelegt von
Dipl.-Ing. agr. Anne Kathrin Schiborra
aus Lengerich/Westf.
Kiel, 2007
Gedruckt mit Genehmigung der Agrarwissenschaftlichen Fakultät
der Christian-Albrechts-Universität zu Kiel
Dekan: Prof. Dr. Joachim Krieter
1. Berichterstatter: Prof. Dr. Friedhelm Taube
2. Berichterstatter: Prof. Dr. Andreas Susenbeth
Tag der mündlichen Prüfung: 8. November 2007
Das MAGIM-Projekt (Forschergruppe 536) wurde von der Deutschen Forschungs-
gemeinschaft (DFG) gefördert.
Contents I
Contents
Contents I
Tables IV
Figures V
Chapter 1 Introduction 1
1. The Problem of Grassland Degradation in Inner Mongolia,
P.R. China 2
2. MAGIM-Project 5
2.1 Study area 6
3. Objectives and Outline of the thesis 8
3.1 Scientific background 8
3.2 Experiments 9
4. References 11
Chapter 2 Short-term responses to defoliation stress of a semi-
arid grassland sward in Inner Mongolia, China.
1. Plant growth analysis 15
Abstract 16
1. Introduction 17
2. Material and Methods 19
2.1 Study site 19
2.2 Experimental design and field measurements 20
2.3 Laboratory measurements 22
2.4 Statistical analysis 23
3. Results 24
3.1 Above- and belowground productivity 24
3.2 Specific leaf area, leaf area index and leaf weight ratio 25
3.3 Species composition and tiller density 28
4. Discussion 30
4.1 Above- and belowground productivity 30
4.2 Specific leaf area, leaf area index and leaf weight ratio 35
4.3 Species composition and tiller density 37
5. Conclusions 38
6. References 39
Contents II
Chapter 3 Short-term responses to defoliation stress of a semi-
arid grassland sward in Inner Mongolia, China.
2. Herbage quality 47
Abstract 48
1. Introduction 49
2. Material and Methods 50
2.1 Study area, experimental design and herbage sampling 50
2.2 Herbage quality analysis 52
2.3 Statistical analysis 54
3. Results 54
4. Discussion 62
5. Conclusions 69
6. References 70
Appendix 77
Chapter 4 Comparing in vivo and in vitro determined organic
matter digestibility in a grazing experiment conducted
in the natural grasslands of Inner Mongolia, China 81
Abstract 82
1. Introduction 83
2. Material and Methods 85
2.1 Study site, experimental design and conditions 85
2.2 Herbage sampling and analysis 86
2.3 Digestibility of herbage ingested 87
2.4 Digestibility of herbage on offer 87
2.5 Statistical analysis 88
3. Results 89
3.1 Herbage on offer 89
3.2 Digestibility estimation 91
4. Discussion 94
5. Conclusions 100
6. References 101
Contents III
Chapter 5 General discussion 108
1. Introduction and summary of results 109
2. Cutting vs. grazing – is herbage productivity stimulated by
grazing in the short-term? 111
3. The influence of precipitation on semi-arid grasslands 115
4. Relationships to other MAGIM sub-projects 118
5. References 120
Chapter 6 Summary 124
6.1 Summary 125
6.2 Zusammenfassung 127
Contents IV
Tables
Chapter 2
Table 1: Herbage sampling and cutting dates 2004 and 2005 21
Table 2: Cumulative DM-yield (cDMY) and N-yield (cNY), N-content of herbage in 2004 and 2005 24
Table 3: Root mass, C- and N-content and total non-structural carbohydrate (TNC)-content and TNC-pool in root OM in 2004 and 2005 25
Table 4: Analysis of variance for specific leaf area (SLA), leaf area index (LAI) and leaf weight ratio (LWR) in 2004/2005 on the mutual sampling dates1 (day 156/161), 4 (day 204/203) and 7 (day 245/249). 28
Table 5: Mean tiller density 2004 and 2005 (live tillers/m²) 29
Table 6: Rain-use-efficiency (RUE) for mean annual and mean seasonal precipitation in 2004 and 2005 33
Chapter 3 Table 1: Temperature (°C) and precipitation (mm) as mean of 20-years
and during the growing seasons of 2004 and 2005 51
Table 2: Calibration and validation statistics of the NIRS-prediction of herbage quality parameters 52
Table 3: Quality of the green biomass, Stipa grandis and Leymus chinensis in 2004 56
Table 4: Quality of the green biomass, Stipa grandis and Leymus chinensis in 2005 57
Table 5: Leaf weight ratio of S. grandis and L. chinensis in 2004 and 2005 64
Chapter 4 Table 1: Mean temperature (°C) and mean precipitation (mm) on a
yearly basis and for the growing season as 20-year mean, 2004 and 2005 85Fehler! Textmarke nicht definiert.
Table 2: Herbage on offer and proportion of green herbage at sampling periods in July, August and September 2005 90
Table 3: Quality of herbage on offer in July, August and September 2005 90
Table 4: Digestibility estimated by faecal-N (FDOM), Cellulase-technique (CDOM) and Hohenheim gas test (GDOM) (%) in July, August and September 2005 92
Table 5: Statistical analysis of differences estimated by faecal-N method (FDOM), Cellulase-technique (CDOM) and Hohenheim gas test (GDOM) tested against zero 94
Table 6: Quality of Stipa grandis’ and Leymus chinensis’ vertical layers in July 2005 97
Contents V
Figures
Chapter 1 Figure 1: Map of the People’s Republic of China 2
Figure 2: Spatially interpolated map of average rainfall (mm) in Inner Mongolia, 1982-1991 (Yu et al., 2004) 3
Figure 3: Average rainfall-based carrying capacity (RBK, kg km-2) and actual livestock density (kg km-2) for rural counties in the Inner Mongolia Autonomous Region, 1982-1991 (Yu et al., 2004) 4
Figure 4: Map of the Xilin River Basin, Inner Mongolia (Tong et al., 2004) 6
Figure 5: Mean monthly precipitation (mm) and temperature (°C) measured at IMGERS between 1982 and 2003 6
Figure 6: Vegetation map of Inner Mongolia (Yu et al., 2004) 7
Chapter 2
Figure 1: Mean temperature and mean precipitation per month averaged over 20 years (1983-2003) and for 2004 and 2005 measured at IMGERS, Inner Mongolia, China 19
Figure 2: Specific leaf area (SLA), leaf area index (LAI) and leaf weight ratio (LWR) of Stipa grandis and Leymus chinensis in 2004 and 2005 27
Figure 3: Species composition in July 2004 and 2005 29
Figure 4: Relationship between DM-yield and leaf area index for Stipa grandis and Leymus chinensis in 2004 and 2005 36
Chapter 3
Figure 1: Development of crude protein (CP), total non-structural carbohydrates (TNC) and in vitro digestibility (IVDOM) of the green biomass across the growing seasons of 2004 and 2005 60
Figure 2: Development of neutral detergent fibre (NDF), hemicellulose, cellulose and acid detergent lignin (ADL) of the green biomass across the growing seasons of 2004 and 2005 61
Figure 3: Relationship between IVDOM and ADL content in the green biomass in 2004 and 2005 66
Figure I-1: Development of crude protein (CP), total non-structural carbo-hydrates (TNC) and in vitro digestibility (IVDOM) of Stipa gran-dis across the growing seasons of 2004 and 2005 77
Figure I-2: Development of neutral detergent fibre (NDF), hemicellulose, cellulose and acid detergent lignin (ADL) of Stipa grandis across the growing seasons of 2004 and 2005 78
Contents VI
Figure II-1: Development of crude protein (CP), total non-structural carbo-hydrates (TNC) and in vitro digestibility (IVDOM) of Leymus chinensis across the growing seasons of 2004 and 2005 79
Figure II-2: Development of neutral detergent fibre (NDF), hemicellulose, cellulose and acid detergent lignin (ADL) of Leymus chinensis across the growing seasons of 2004 and 2005 80
Chapter 4
Figure 1: Digestibility estimated for the different grazing intensities by faecal-N (FDOM), Cellulase-technique (CDOM) and Hohenheim gas test (GDOM) at sampling periods in July (a), August (b) and September (c) 2005 93
Chapter 5
Figure 1: Cumulative DM-yield (cDMY) of grazing and hay making paddocks in the slope block of the grazing experiment in 2005 114
Figure 2: A conceptual model of the relative effects of grazing, fire and climate on above-ground net primary productivity along a gradient of precipitation (Oesterheld et al., 1999) 116

Chapter 1
Introduction
Introduction 2
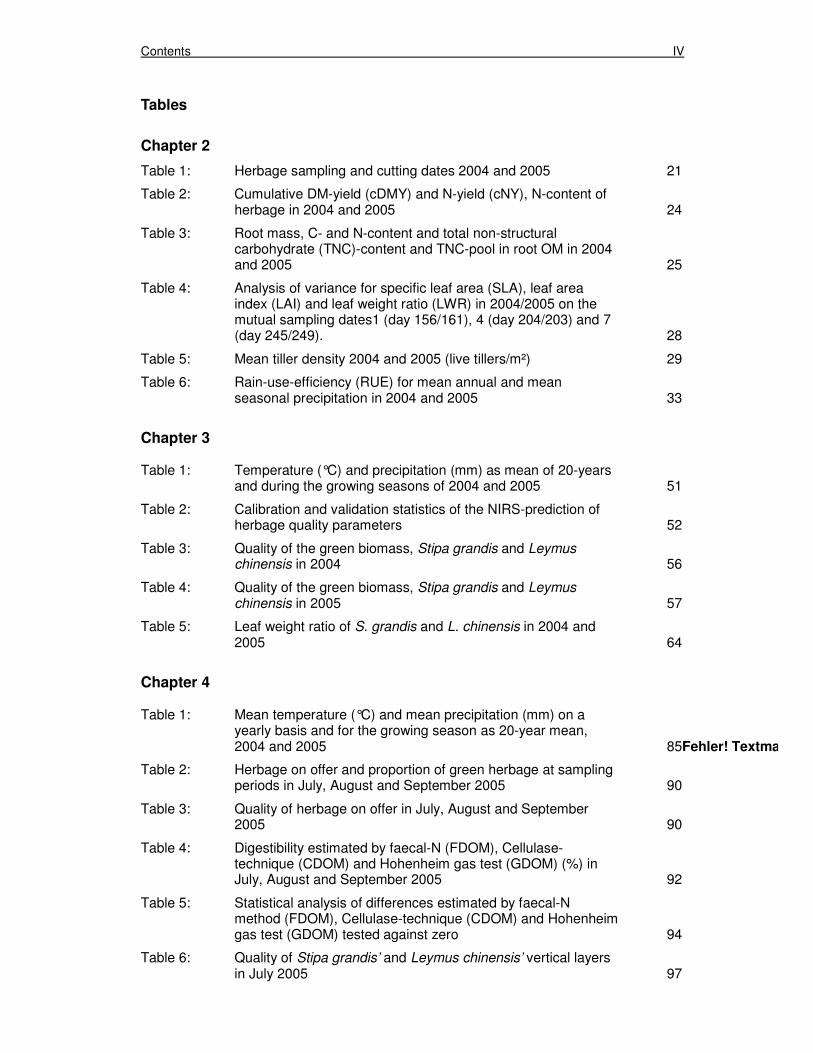
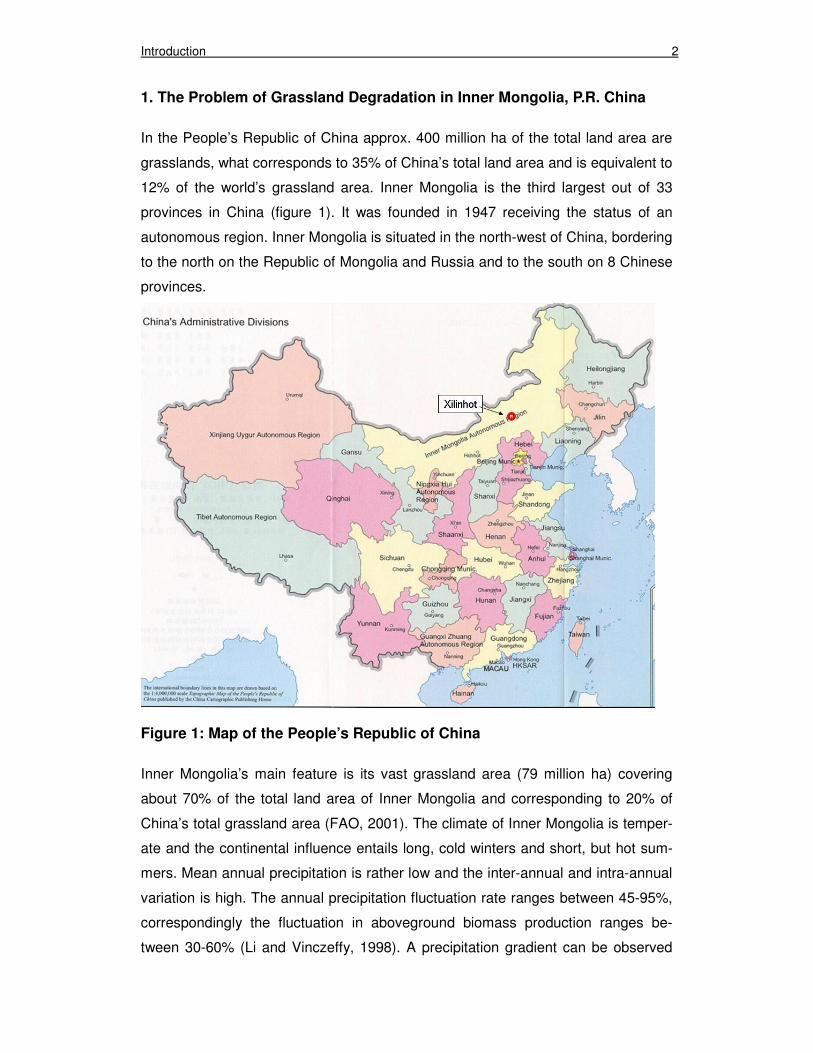
1. The Problem of Grassland Degradation in Inner Mongolia, P.R. China
In the People’s Republic of China approx. 400 million ha of the total land area are
grasslands, what corresponds to 35% of China’s total land area and is equivalent to
12% of the world’s grassland area. Inner Mongolia is the third largest out of 33
provinces in China (figure 1). It was founded in 1947 receiving the status of an
autonomous region. Inner Mongolia is situated in the north-west of China, bordering
to the north on the Republic of Mongolia and Russia and to the south on 8 Chinese
provinces.
Figure 1: Map of the People’s Republic of China
Inner Mongolia’s main feature is its vast grassland area (79 million ha) covering
about 70% of the total land area of Inner Mongolia and corresponding to 20% of
China’s total grassland area (FAO, 2001). The climate of Inner Mongolia is temper-
ate and the continental influence entails long, cold winters and short, but hot sum-
mers. Mean annual precipitation is rather low and the inter-annual and intra-annual
variation is high. The annual precipitation fluctuation rate ranges between 45-95%,
correspondingly the fluctuation in aboveground biomass production ranges be-
tween 30-60% (Li and Vinczeffy, 1998). A precipitation gradient can be observed
Introduction 3
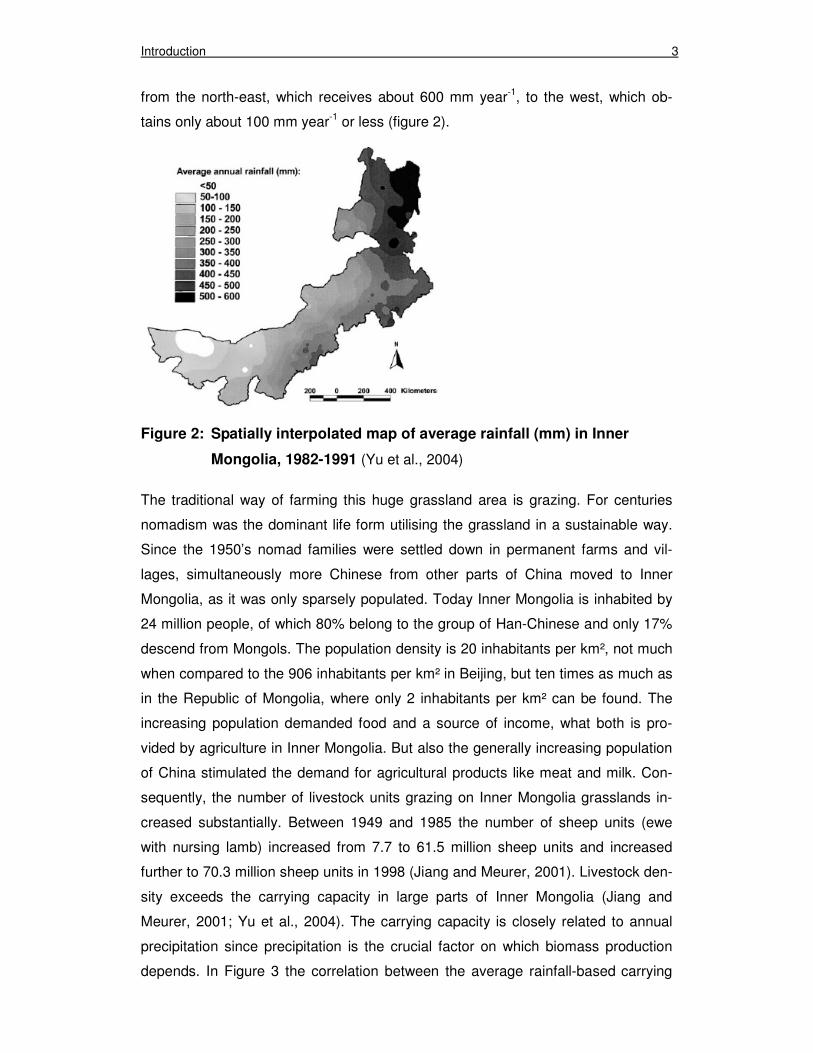
from the north-east, which receives about 600 mm year-1, to the west, which ob-
tains only about 100 mm year-1 or less (figure 2).
Figure 2: Spatially interpolated map of average rainfall (mm) in Inner
Mongolia, 1982-1991 (Yu et al., 2004)
The traditional way of farming this huge grassland area is grazing. For centuries
nomadism was the dominant life form utilising the grassland in a sustainable way.
Since the 1950’s nomad families were settled down in permanent farms and vil-
lages, simultaneously more Chinese from other parts of China moved to Inner
Mongolia, as it was only sparsely populated. Today Inner Mongolia is inhabited by
24 million people, of which 80% belong to the group of Han-Chinese and only 17%
descend from Mongols. The population density is 20 inhabitants per km², not much
when compared to the 906 inhabitants per km² in Beijing, but ten times as much as
in the Republic of Mongolia, where only 2 inhabitants per km² can be found. The
increasing population demanded food and a source of income, what both is pro-
vided by agriculture in Inner Mongolia. But also the generally increasing population
of China stimulated the demand for agricultural products like meat and milk. Con-
sequently, the number of livestock units grazing on Inner Mongolia grasslands in-
creased substantially. Between 1949 and 1985 the number of sheep units (ewe
with nursing lamb) increased from 7.7 to 61.5 million sheep units and increased
further to 70.3 million sheep units in 1998 (Jiang and Meurer, 2001). Livestock den-
sity exceeds the carrying capacity in large parts of Inner Mongolia (Jiang and
Meurer, 2001; Yu et al., 2004). The carrying capacity is closely related to annual
precipitation since precipitation is the crucial factor on which biomass production
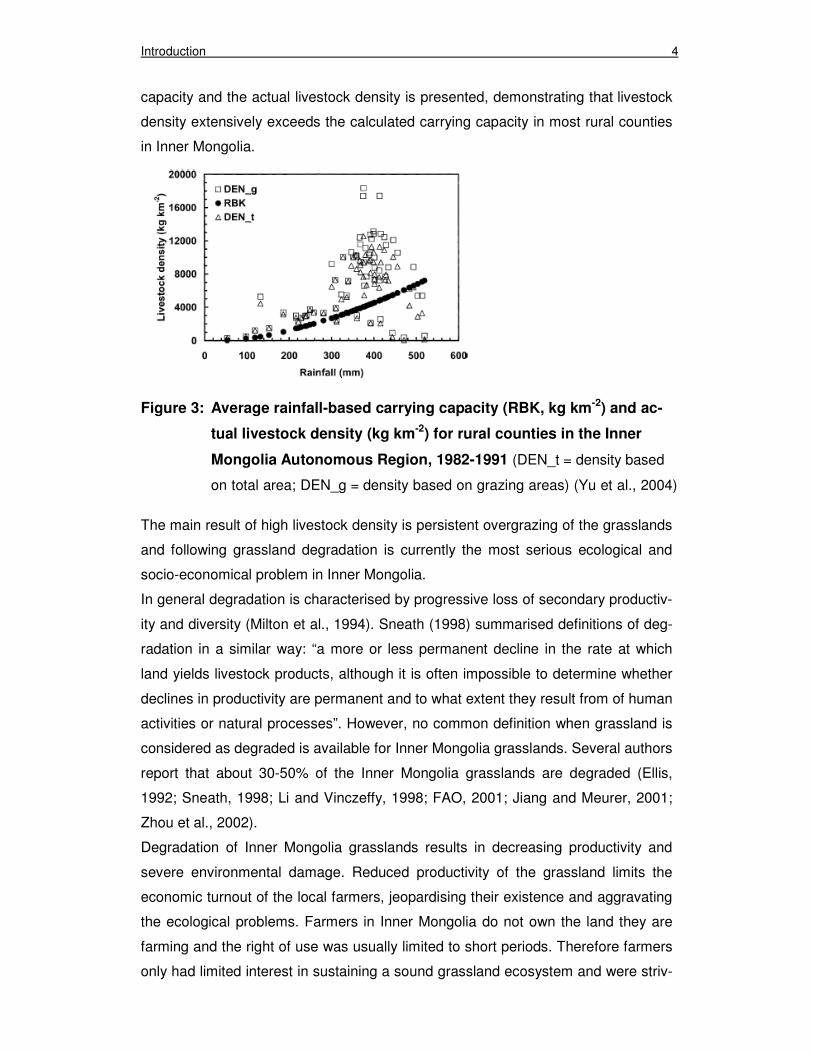
depends. In Figure 3 the correlation between the average rainfall-based carrying
Introduction 4
capacity and the actual livestock density is presented, demonstrating that livestock
density extensively exceeds the calculated carrying capacity in most rural counties
in Inner Mongolia.
Figure 3: Average rainfall-based carrying capacity (RBK, kg km-2) and ac-
tual livestock density (kg km-2) for rural counties in the Inner
Mongolia Autonomous Region, 1982-1991 (DEN_t = density based
on total area; DEN_g = density based on grazing areas) (Yu et al., 2004)
The main result of high livestock density is persistent overgrazing of the grasslands
and following grassland degradation is currently the most serious ecological and
socio-economical problem in Inner Mongolia.
In general degradation is characterised by progressive loss of secondary productiv-
ity and diversity (Milton et al., 1994). Sneath (1998) summarised definitions of deg-
radation in a similar way: “a more or less permanent decline in the rate at which
land yields livestock products, although it is often impossible to determine whether
declines in productivity are permanent and to what extent they result from of human
activities or natural processes”. However, no common definition when grassland is
considered as degraded is available for Inner Mongolia grasslands. Several authors
report that about 30-50% of the Inner Mongolia grasslands are degraded (Ellis,
1992; Sneath, 1998; Li and Vinczeffy, 1998; FAO, 2001; Jiang and Meurer, 2001;
Zhou et al., 2002).
Degradation of Inner Mongolia grasslands results in decreasing productivity and
severe environmental damage. Reduced productivity of the grassland limits the
economic turnout of the local farmers, jeopardising their existence and aggravating
the ecological problems. Farmers in Inner Mongolia do not own the land they are
farming and the right of use was usually limited to short periods. Therefore farmers
only had limited interest in sustaining a sound grassland ecosystem and were striv-
Introduction 5
ing for the highest short-term output from the area. In short-term high grazing inten-
sities provide higher economical return (Wang et al., 1999a). This policy was
changed in recent years and farmers can lease farm land for longer periods (~ 30
years, personal communication). This change is connected with the hope that the
farmers take better care of their farm land, when they have a long-term perspective.
However, overgrazing was common practice for decades resulting in severe eco-
logical problems like wind and water erosion, which cause loss of high amounts of
fertile soil material. Special attention has been driven to dust and sand storms,
which are a natural phenomenon in this part of the world, however increasing in
severity and number in recent years (Wang et al., 2004). In this context also the
risk to turn the Inner Mongolia grasslands from a carbon sink into a carbon source
need to be considered, especially against the background of global change. Carbon
loss due to erosion and reduced carbon input resulting from decreasing below-
ground biomass productivity could contribute to such changes in the carbon cycle
of grasslands (Cui et al., 2005).
2. MAGIM-Project
This thesis is the result of research activities conducted in the framework of the
MAGIM project. MAGIM is the abbreviation of Matter Fluxes in Grasslands of Inner
Mongolia as influenced by Stocking Rate. MAGIM is a sino-german research group
funded by the Deutsche Forschungsgemeinschaft (DFG 536) that especially em-
phasizes the scientific exchange between Chinese and German scientists. Against
the background of the above described degradation problem in Inner Mongolia
grasslands the complex plant-soil-animal interactions of this ecosystem are ad-
dressed by the MAGIM project. 9 sub-projects out of several scientific fields (soil
science and geology, plant nutrition, grassland science, animal nutrition, meteorol-
ogy and climatology, hydrology) are involved in the MAGIM project focusing on the
evaluation and assessment of the impact of different land-use practices on above-
and belowground biomass productivity and composition, local and regional water,
carbon and nitrogen budgets, soil erosion, and animal productivity. The sub-project
providing the basis for the present work is focusing on the influence of grazing
management on grassland productivity, herbage quality and in the long-term on
persistence of the steppe grasslands. Further details are given in section 3 of this
chapter.
Introduction 6
2.1 Study area
The present study was carried out in the experimental area of the Inner Mongolia
Ecosystem Research Station (IMGERS). IMGERS is situated about 60 km south-
east of Xilinhot, which is the regional capital of the Xilin Gol league. Xilinhot is
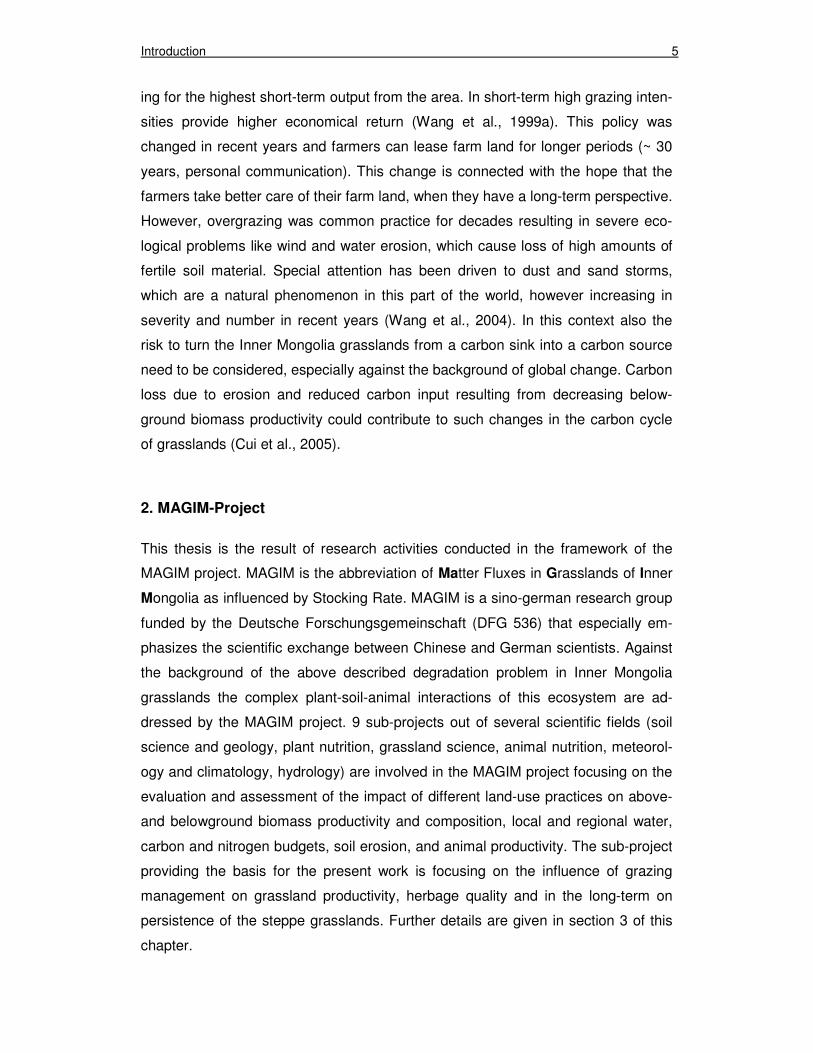
about 500 km (in linear distance) north of Beijing (figure 1). IMGERS is located in
the southern part of the Xilin River Basin, which was selected as the main research
area of the whole MAGIM-project (figure 4).
Figure 4: Map of the Xilin River Basin, Inner Mongolia (Tong et al., 2004)
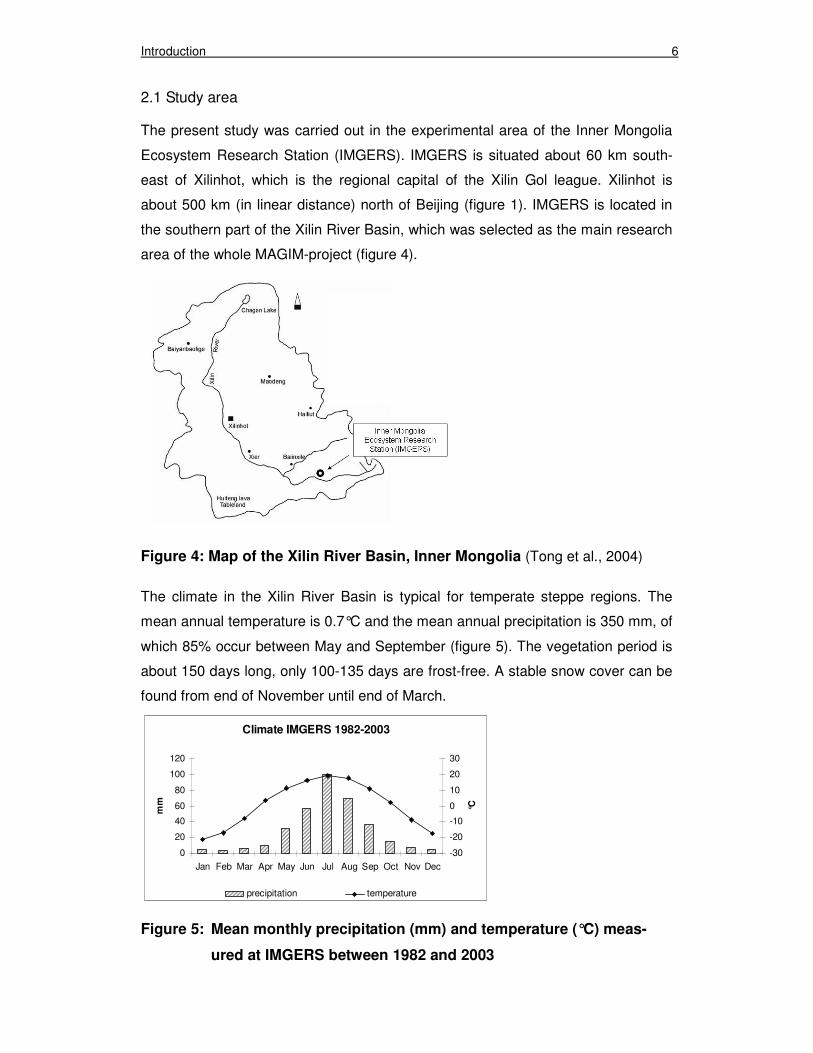
The climate in the Xilin River Basin is typical for temperate steppe regions. The
mean annual temperature is 0.7°C and the mean annual precipitation is 350 mm, of
which 85% occur between May and September (figure 5). The vegetation period is
about 150 days long, only 100-135 days are frost-free. A stable snow cover can be
found from end of November until end of March.
Climate IMGERS 1982-2003
0
20
40
60
80
100
120
Jan Feb Mar Apr May Jun Jul Aug Sep Oct Nov Dec
mm
-30
-20
-10
0
10
20
30
°C
precipitation temperature
Figure 5: Mean monthly precipitation (mm) and temperature (°C) meas-
ured at IMGERS between 1982 and 2003
Introduction 7
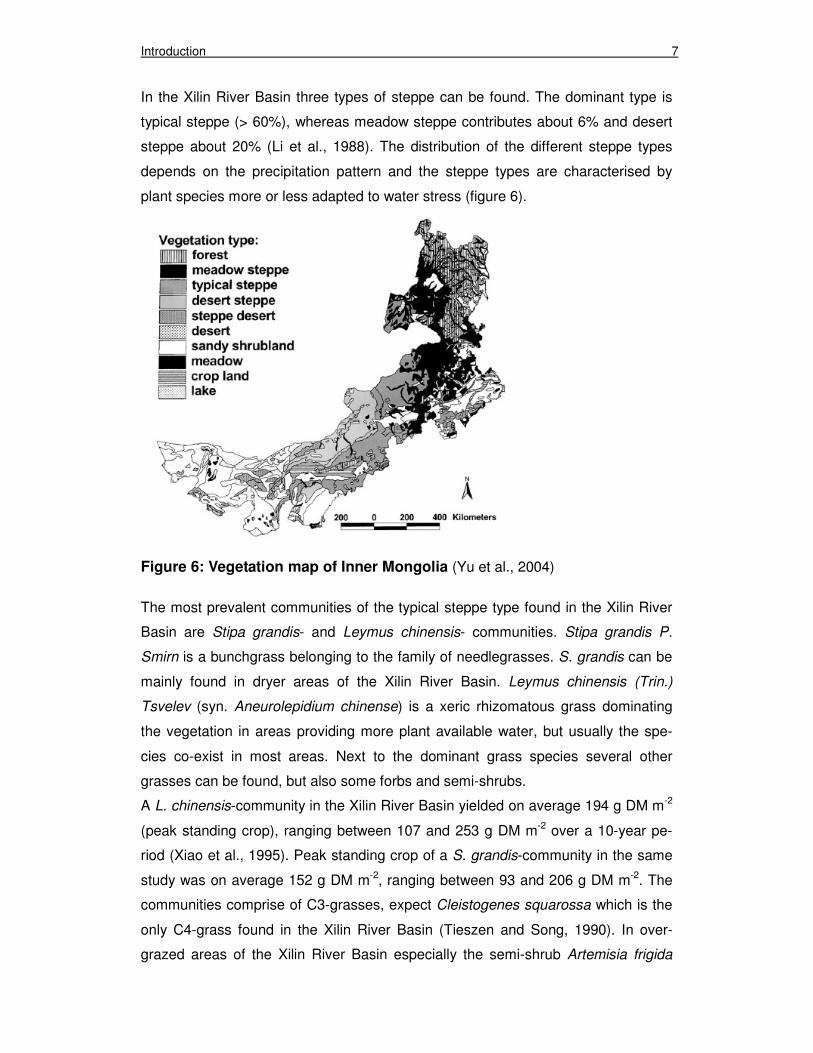
In the Xilin River Basin three types of steppe can be found. The dominant type is
typical steppe (> 60%), whereas meadow steppe contributes about 6% and desert
steppe about 20% (Li et al., 1988). The distribution of the different steppe types
depends on the precipitation pattern and the steppe types are characterised by
plant species more or less adapted to water stress (figure 6).
Figure 6: Vegetation map of Inner Mongolia (Yu et al., 2004)
The most prevalent communities of the typical steppe type found in the Xilin River
Basin are Stipa grandis- and Leymus chinensis- communities. Stipa grandis P.
Smirn is a bunchgrass belonging to the family of needlegrasses. S. grandis can be
mainly found in dryer areas of the Xilin River Basin. Leymus chinensis (Trin.)
Tsvelev (syn. Aneurolepidium chinense) is a xeric rhizomatous grass dominating
the vegetation in areas providing more plant available water, but usually the spe-
cies co-exist in most areas. Next to the dominant grass species several other
grasses can be found, but also some forbs and semi-shrubs.
A L. chinensis-community in the Xilin River Basin yielded on average 194 g DM m-2
(peak standing crop), ranging between 107 and 253 g DM m-2 over a 10-year pe-
riod (Xiao et al., 1995). Peak standing crop of a S. grandis-community in the same
study was on average 152 g DM m-2, ranging between 93 and 206 g DM m-2. The
communities comprise of C3-grasses, expect Cleistogenes squarossa which is the
only C4-grass found in the Xilin River Basin (Tieszen and Song, 1990). In over-
grazed areas of the Xilin River Basin especially the semi-shrub Artemisia frigida
Introduction 8
and the forbs Potentilla spp., as well as primary shrubs like Carragana microphylla,
emerge and grasses like S. grandis and L. chinensis decrease (Li, 1989; Christen-
sen et al., 2003; Barger et al., 2004; Tong et al., 2004; Xie and Wittig, 2007). The
soils in the study area are mostly Calcic Chernozems. The thickness of the Ah-
horizon varies between 20 and 100 cm, depending on the topography (Zhao et al.,
2007).
3. Objectives and Outline of the Thesis
The MAGIM sub-project 3 is the basis of this thesis and entitled as follows: “Impact
of grazing management on yield performance, herbage quality and persistence of
grassland ecosystems of Inner Mongolia”. The main objective of this sub-project is
to provide a data base for scenario analysis, which may contribute to the develop-
ment of sustainable management strategies for the Inner Mongolia grasslands. To
achieve this objective the first approach is to study the formation process of degra-
dation and the involved mechanisms.
3.1 Scientific background
Only few studies are available that have examined the degradation process in its
formation. The majority of studies dealing with the degradation problem of Inner
Mongolia grasslands are retrospective, examining grasslands of different degrees
of already developed degradation in end-point evaluations. A commonly used
method to investigate different states of degradation is the definition of grazing gra-
dients in increasing distance from villages or watering points. Status of degradation
and/or definition of the grazing intensity the grassland is subjected to are assessed
by e.g. the proportion of biomass consumed by grazers (Wang, 2004), plant height
(Wang et al., 2002), monitoring of existing data about livestock densities by inter-
viewing officials and local farmers (Xie and Wittig, 2003, 2007) or plant biomass
production and plant cover (Tong et al., 2004). Only a few studies were carried out
under controlled conditions, like the grazing experiments described by Wang et al.
(1999 a, b), Zhang et al. (2004) and Zhao et al. (2005).
The main result of the retrospective studies is that aboveground- and belowground
biomass are much lower under moderate to heavy grazing intensities, whereas it is
seldom defined what moderate or heavy grazing intensities are (Li, 1989; Wang
and Ripley, 1997; Xie and Wittig, 2003, 2007; Wang, 2004; Yi et al., 2004).
Introduction 9
Changes in species composition were judged as the most important indicators for
the degree of degradation in typical steppe grasslands (Tong et al., 2004). Climax
grassland communities are dominated by grasses, but when the grassland is sub-
jected to high grazing intensity the palatable species (e.g. S. grandis and L. chine-
sis) are reduced and less valuable (e.g. Artemisia frigida) and unpalatable species
(e.g. Potentilla spp. and Carragana microphylla) become dominant (Li, 1989; Wang
and Ripley, 1997; Zhang, 1998; Wang et al., 2002; Barger et al., 2004; Zhao et al.,
2005).
Declining productivity and changing species composition were used as diagnostic
instruments to assess the degradation status of an already degraded grassland
sward, but the actual degradation process was not yet directly documented, though
the degradation process was simulated in a modelling approach (Christensen et al.,
2003).
The assessment of the degradation status of a grassland area after degradation
has become apparent does not allow counteracting this degradation, but restoration
is then the only way to re-establish productive and diverse grassland swards. Man-
agement strategies that enable livestock farmers to subsist themselves and sustain
the grasslands as a productive and ecologically sound environment are urgently
needed and were demanded by several authors (Li and Vinczeffy, 1998; Tong et al.,
2004; Yu et al., 2004; Nan, 2005). However, management strategies developed on
the basis of scientific results are rare. Grazing studies (Wang et al., 1999a, b;
Zhang et al. 2004; Zhao et al., 2005) provide suggestions for appropriate grazing
intensities for the investigated grasslands, but alternative management systems
were not proposed. Management strategies that would help to avoid grassland deg-
radation were suggested by several authors (Li and Vinczeffy, 1998; Jiang et al.,
2003; Yu et al., 2004; Yi et al., 2004; Tong et al., 2004), but commonly the pro-
posed strategies were not tested.
3.2 Experiments
Cutting-frequency experiment
A cutting-frequency experiment, based on an orthogonal experimental design, was
initiated in June 2004 that aimed at the description of short-term changes in a typi-
cal Stipa grandis/Leymus chinensis community subjected to different defoliation
intensities, concentrating on the effects on the dominant species S. grandis and L.
chinensis. Parameters of classical growth analysis (chapter 2) as well as herbage
Introduction 10
quality parameters (chapter 3) were used to evaluate and assess short-term re-
sponses of the grassland sward and the dominant species to different defoliation
intensities in the course of the vegetation periods of 2004 and 2005. Further details
about the design and implementation of the cutting-frequency experiment are given
in chapter 2 and 3.
Grazing experiment
The central experiment of sub-project 3 within the MAGIM project is a grazing ex-
periment that will provide detailed information about the degradation process when
the grassland is subjected to different grazing intensities. This experiment com-
menced in June 2005 and is carried out in close cooperation with the MAGIM sub-
project 4, which is conducted by the Institute of Animal Nutrition and Physiology,
University Kiel (Glindemann, 2007; Wang, 2007). Six grazing intensities (1.5, 3.0,
4.5, 6.0, 7.5 and 9.0 sheep ha-1) and an ungrazed control are examined in 2 repli-
cations. Two management strategies are compared: one is the traditional man-
agement system that permanently uses grassland areas either only for grazing or
only for hay making. Usually areas in the vicinity of farms and villages are grazed
and more distant areas are used for hay making only. The alternative tested in this
experiment is the so called mixed system, which means that the utilization of grass-
land areas is changed between grazing and hay making every year. The advan-
tages and disadvantages of the two compared management strategies can be
summarised as follows:
Traditional system:
- soil nutrients are depleted in haymaking areas by constant biomass removal
- the grazing pressure is high in grazing areas, especially on palatable species,
so that
plant reserves can not be replenished
- plants are limited in seed production
Mixed System:
- in haymaking years plants are released from grazing stress and can seed and
replenish their reserves
- in grazing years nutrients are recycled to the system via animal faeces
Introduction 11
but,
- the infrastructure needed for this system, like fences in remote areas from
where sheep can not return to the farm every evening, is yet not available.
The structure of the grazing experiment will be not further described as it is not the
main subject of this thesis. The grazing experiment is a long-term experiment and
has to be interpreted as such in the next years. Nevertheless, the data obtained
from the grazing experiment in 2005 could be used to address an additional ques-
tion. In Chapter 4 a comparison of in vivo and in vitro obtained digestibility of or-
ganic matter is presented. The in vivo digestibility was determined by the Institute
of Animal Nutrition and Physiology (Glindemann, 2007; Wang, 2007) for all grazing
intensities in the mixed system and is compared to the in vitro digestibility of the
corresponding herbage samples. The aim of this comparison is to test to what ex-
tend the quality of herbage ingested corresponds to the quality of herbage on offer
across the different grazing intensities and whether those differences can be used
as an index for the selectivity of grazing sheep.
4. References
Barger, N.N., Ojima, D.S., Belnap, J., Wang, S.P., Wang, Y.F., Chen, Z.Z., 2004.
Changes in plant functional groups, litter quality, and soil carbon and nitrogen
mineralization with sheep grazing in an Inner Mongolian grassland. Journal of
Range Management 57, 613-619.
Christensen, L., Coughenour, M.B., Ellis, J.E., Chen, Z., 2003. Sustainability of In-
ner Mongolian Grasslands: Application of the Savanna Model. Journal of
Range Management 56, 319-327.
Cui, X.Y., Wang, Y.F., Niu, H.S., Wu, J., Wang, S.P., Schnug, E., Rogasik, J.,
Fleckenstein, J., Tang, Y.H., 2005. Effect of long-term grazing on soil organic
carbon content in semi-arid steppes in Inner Mongolia. Ecological Research
20, 519-527.
Ellis, J.E., 1992. The grazing lands of northern China: ecology, society, and land
use. In: Ellis, J.E. (ed.), Grasslands and grassland sciences in northern China.
National Academy Press, Washington D.C..
FAO, 2001. http://www.fao.org/ag/agp/agpc/doc/counprof/china/China1.htm
(04.08.2007)
Introduction 12
Glindemann, T., 2007. Effect of grazing intensity on feed intake and productivity of
sheep in the Inner Mongolian steppe. PhD-Thesis, University of Kiel.
Jiang, G.M., Liu, M.Z., Han, N.Y., Zhang, Q., Li, W.J., 2003. Potential for restora-
tion of degraded steppe in the Xilingol biosphere reserve through urbanization.
Environmental Conservation 30, 304-310.
Jiang, Y., Meurer, M., 2001. Die Steppen Nordchinas und ihre Belastung durch
weide- und landwirtschaftliche Landnutzung. Geographische Rundschau 53,
48-52.
Li, B., Yong, S., Li, Z., 1988. Vegetation of the Xilin River Basin and its utilization. In:
Inner Mongolia Grassland Ecosystem Research Station (ed.), Research on
Grassland Ecosystems 3, 84-183.
Li, B., Vinczeffy, I., 1998. The grassland resources of China and their management
strategies. In: Nagy, G., Peto, K. (eds.), Ecological aspects of grassland man-
agement. EGF – Grassland Science in Europe 3, 449-452.
Li, Y.H., 1989. Impact of grazing on Aneurolepidium chinense steppe and Stipa
grandis steppe. Acta Oecologica/Oecologia Applicata 10, 31-46.
Milton, S.J., Dean, W.R.J., Du Plessis, M.A., Siegfried, W.R., 1994. A conceptual
model of arid rangeland degradation - the escalating cost of declining produc-
tivity. BioScience 44, 70-76.
Nan, Z.H., 2005. The grassland farming system and sustainable agricultural devel-
opment in China. Grassland Science 51, 15-19.
Sneath, D., 1998. State policy and pasture degradation in Inner Asia. Science 281,
1147-1148.
Tieszen, L.L., Song, B.Y., 1990. Stable carbon isotopic variation among plants of
the Inner Mongolian grasslands. In: Jiang, S., Chen, Z.Z., Xiao, X.M. (eds.),
Reports from the Inner Mongolia Grassland Ecosystem Research Station of
Academia Sinica (1979-1988). Science Press, Beijing.
Tong, C., Wu, J., Yong, S., Yang, J., Yong, W., 2004. A landscape-scale assess-
ment of steppe degradation in the Xilin River Basin, Inner Mongolia, China.
Journal of Arid Environments 59, 133-149.
Wang, C., 2007. Development and Application of a method to estimate feed di-
gestibility in sheep grazing differently managed grasslands in Inner Mongolia,
China. PhD-Thesis, University of Kiel.
Introduction 13
Wang, R.Z., 2004. Responses of Leymus chinensis (Poaceae) to long-term grazing
disturbance in the Songnen grasslands of north-eastern China. Grass and
Forage Science 59, 191-195.
Wang, R.Z., Ripley, E.A., 1997. Effects of grazing on a Leymus chinensis grassland
on the Songnen plain of north-eastern China. Journal of Arid Environments 36,
307-318.
Wang, S.P., Li, Y.H., Chen Z.Z., 1999a. The optimal stocking rates on grazing sys-
tem in Inner Mongolia steppe. I. Based on analysis of liveweight gain per ani-
mal and hectare and benefit. Acta Agrestia Sinica 7, 183-191. (in Chinese,
with English abstract)
Wang, S.P., Li, Y.H., Chen, Z.Z., 1999b. The optimal stocking rate on grazing sys-
tem in Inner Mongolia steppe. II. Based on relationship between stocking rate
and aboveground net primary productivity. Acta Agrestia Sinica 7, 192-197.
(in Chinese, with English abstract)
Wang, X.M., Dong, Z.B., Zhang, J.W., Liu, L.C., 2004. Modern dust storms in China:
an overview. Journal of Arid Environments 58, 559-574.
Wang, Y.S., Shiyomi, M., Tsuiki, M., Tsutsumi, M., Yu, X.R., Yi, R.H., 2002. Spatial
heterogeneity of vegetation under different grazing intensities in the North-
west Heilongjiang steppe of China. Agriculture, Ecosystems and Environment
90, 217-229.
Xiao, X.M., Wang, Y.F., Jiang, S., Ojima, D.S., Bonham, C.D., 1995. Interannual
variation in the climate and above-ground biomass of Leymus chinensis
steppe and Stipa grandis steppe in the Xilin River basin, Inner Mongolia,
China. Journal of Arid Environments 31, 283-299.
Xie, Y.Z., Wittig, R., 2003. Growth parameters of characteristic species of Stipa
steppes in Northern China as indicators of the grazing intensity. Journal of
Applied Botany 77, 68-74.
Xie, Y.Z., Wittig, R., 2007. Biomass and grazing potential of the Stipa loess steppes
in Ningxia (northern China) in relation to grazing intensity. Journal of Applied
Botany and Food Quality 81, 15-20.
Yi, R.H., Hayashi, I., Nakamura, T., Shiyomi, M., 2004. Relationship between bo-
tanical composition and grazing intensities in Xilingoule grasslands, Inner
Mongolia. Ecologic Science 23, 12-15.
Introduction 14
Yu, M., Ellis, J.E., Epstein, H.E., 2004. Regional analysis of climate, primary pro-
duction, and livestock density in Inner Mongolia. Journal of Environmental
Quality 33, 1675-1681.
Zhang, W., 1998. Changes in species diversity and canopy cover in steppe vegeta-
tion in Inner Mongolia under protection from grazing. Biodiversity and Conser-
vation 7, 1365-1381.
Zhang, T.H., Zhao, H.L., Li, S.G., Zhou, R.L., 2004. Grassland changes under graz-
ing stress in Horqin sandy grassland in Inner Mongolia, China. New Zealand
Journal of Agricultural Research 47, 307-312.
Zhao, H.L., Zhao, X.Y., Zhou, R.L., Zhang, T.H., Drake, S., 2005. Desertification
process due to heavy grazing in sandy rangeland, Inner Mongolia. Journal of
Arid Environments 62, 309-319.
Zhao, Y., Peth, S., Krümmelbein, J., Horn, R., Wang, Z.Y., Steffens, M., Hoffmann,
C., Peng, X.H., 2007. Spatial variability of soil properties affected by grazing
intensity in Inner Mongolia grassland. Ecological Modelling 205, 241-254.
Zhou, G., Wang, Y., Wang, S., 2002. Responses of grassland ecosystems to pre-
cipitation and land use along the Northeast China Transect. Journal of Vege-
tation Science 13, 361-368.
Chapter 2
Short-term responses to defoliation stress of a semi-arid grass-
land sward in Inner Mongolia, China.
1. Plant growth analysis
Plant growth analysis 16
Abstract
Grassland degradation due to overgrazing and the economical and ecological con-
sequences are the major problems that have to be faced in the semi-arid grass-
lands of Inner Mongolia, P.R. China. For the development of sustainable manage-
ment systems, a basal knowledge of the degradation process is required. Much
information is available regarding the long-term effects of grazing stress in Inner
Mongolia grasslands, but information about the short-term responses is rare. A cut-
ting-frequency experiment was carried out in the typical steppe grassland of the
Xilin River Basin, Inner Mongolia. The natural grassland was subjected to low,
moderate and high defoliation stress and several plant related parameters were
examined over the vegetation periods of 2004 and 2005, in order to identify the
short-term responses to defoliation on plant and community level.
The cumulative dry matter yield increased with increasing defoliation frequency
from 204 to 277 g DM m-2 in 2004 and from 87 to 158 g DM m-2 in 2005. The low
biomass productivity in 2005 is based on the low precipitation rate in this year. The
positive effect of defoliation on productivity was also confirmed by the nitrogen yield
that increased from 2.9 g N m-2 to 6 g N m-2 in the more frequently defoliated treat-
ments in 2004 and from 1.2 g N m-2 to 2.8 g N m-2 in 2005. Specific leaf area was
determined for the dominant species S. grandis and L. chinensis in 2004 and in-
creased from about 100 to 160 cm² g leaf DM in S. grandis and from 40 to 140 cm²
g leaf DM in L. chinensis after frequent defoliation. The leaf area index of the two
dominant species was low, but significantly influenced by defoliation, nonetheless
the leaf area index never exceeding 0.6 in S. grandis and 0.4 in L. chinensis. The
root mass ranged between 815 and 1006 g OM m-2 (0-15 cm) and was not signifi-
cantly affected by defoliation in both years. This is also true for the root carbohy-
drate reserves that ranged on a low level between 1.3 and 1.6% of root OM. Spe-
cies composition and tiller density did as well not indicate significant short-term ef-
fects of frequent defoliation.
It can be concluded that in the short-term defoliation stress stimulates productivity
and N uptake, whereas significantly negative effects were not observed. This im-
plies that the steppe grassland is resistant to short-term defoliation stress and that
degradation processes are the result of mid- and/or long-term dynamics of defolia-
tion or grazing stress, respectively. Furthermore the key role of annual precipitation
in this grassland ecosystem became apparent.
Plant growth analysis 17
1. Introduction
In Inner Mongolia, P.R. China, about 70% of the country’s total area is native grass-
land (FAO, 2001). One third (Sneath, 1998; Zhou et al., 2002) of this grassland has
been degraded during the last century, mainly as a consequence of overgrazing as
the number of animals was multiplied tenfold in Inner Mongolia in the last 60 years
(Jiang and Meurer, 2001). Overgrazing has been identified as the main reason for
the degradation of the steppe grasslands (Wang and Ripley, 1997; Liu et al., 1998;
Verburg and Van Keulen, 1999).
Decreasing grassland productivity and ecological threats like wind and water ero-
sion are the main attributes of grassland degradation. Management strategies that
prevent the grazing areas from degradation and provide sustainable production
systems that still enable the farmers to make their livings are urgently needed
(Zhou et al., 2002, Tong et al., 2004). More research activity has been demanded
by several authors to understand the different abiotic and biotic factors influencing
the grassland ecosystem and therewith the degradation process, (e.g. Wang et al.,
2002, Tong et al., 2004). Various ecological and phytological studies have been
conducted in Inner Mongolia grassland steppes examining degradation in a retro-
spective way (e.g. Li, 1989; Xiao et al., 1996; Wang and Ripley, 1997; Wang et al.,
2002; Yi et al., 2004; Bai et al., 2004). Only a few studies have investigated the
degradation process in its formation under grazing stress to provide information
that can be used to support management decisions (Wang et al., 1999; Zhang et al.,
2004; Zhao et al., 2005). Christensen et al. (2003) have tested the applicability of
the Savanna ecosystem model, originally developed for East-African savannas
(Coughenour, 1993), to the situation in Inner Mongolia grasslands. The Savanna
ecosystem model simulates ecosystem processes including vegetation and live-
stock production. Modelling was carried out on data from studies conducted in the
Xilin River Basin, one of the most representative geographic areas in Inner Mongo-
lia (Tong et al., 2004). They predict a steep decline in above and below ground
biomass, as well as a shift from grass to shrub vegetation types, when the grass-
land is subjected to heavy grazing intensities (> 3 sheep ha-1 year-1). Especially
when heavy grazing coincides with low precipitation, dramatic changes in the
steppe vegetation were expected, what was confirmed by the results of Yu et al.
(2004), who analysed the relationship between rainfall and aboveground productiv-
ity in Inner Mongolia grasslands. Although these studies provide valuable informa-
Plant growth analysis 18
tion about the grassland degradation process, they do not regard to short-term ef-
fects of grazing stress and their role in the formation process of degradation.
However, the development of management systems that prevent the grassland
from degradation, require a broad knowledge about the degradation process as a
whole. It has to be clarified what the major driving forces are, how they affect the
grassland ecosystem and whether or not a threshold can be defined that indicate
imminent degradation in an early, reversible state. To answer such questions ex-
periments under controlled conditions are needed to separate the factors influenc-
ing the grassland ecosystem from each other and to assess their involvement in the
degradation process.
The present study is a first approach in assessing the degradation process in its
formation and development. The objective is to identify short-term effects of defolia-
tion stress in a grassland sward in the typical steppe area of the Xilin River Basin,
Inner Mongolia. Plant related parameters, known from the classical plant growth
analysis (Hunt, 1978), are used to characterise short-term responses of the grass-
land sward to defoliation stress on plant and community level.
The results of a cutting-frequency experiment are presented, which was carried out
in 2004 and 2005, comprising 3 different cutting frequencies to constitute low,
moderate and high defoliation stress. The parameters dry matter- and nitrogen
yield, root mass and root carbohydrate reserves are analysed mainly on community
level, whereas the specific leaf area, leaf area index and leaf weight ratio are exam-
ined for the dominant species Stipa grandis and Leymus chinensis, which account
together for approx. two thirds of the grassland sward. The species composition is
also analysed, as it is the most frequently used parameter in the above cited stud-
ies to describe changes in grassland communities due to degradation. Additionally,
the tiller density of S. grandis and L. chinensis is determined, as the two dominant
species were classified as “decreaser”-species which are highly sensitive to grazing
stress (Li, 1989; Wang and Ripley, 1997). However, short-term responses are not
expected for species composition and tiller density, as changes in species compo-
sition usually take more than two experimental years (Jones et al., 1995).
Plant growth analysis 19
2. Material and Methods
2.1 Study site
The presented study was carried out in the framework of the sino-german MAGIM-
project (Matter fluxes of grasslands in Inner Mongolia as influenced by stocking
rate). The cutting-frequency experiment was conducted near the Inner Mongolia
Ecosystem Research Station (IMGERS) operated by the Institute of Botany, Chi-
nese Academy of Sciences, Beijing. IMGERS is located in the Xilin River Basin,
Inner Mongolia Autonomous Region, P.R. China (116°42’ E, 43°38’ N) at an alti-
tude of approximately 1200 m. The climate is semi-arid, characterised by significant
seasonal and inter-annual variability. The mean annual (1982-2003) temperature is
0.7°C and the mean annual precipitation 346 mm, of which 85% are occurring from
May through September (figure 1). The vegetation period is about 150 days long,
with only 100 to 135 frost-free days.
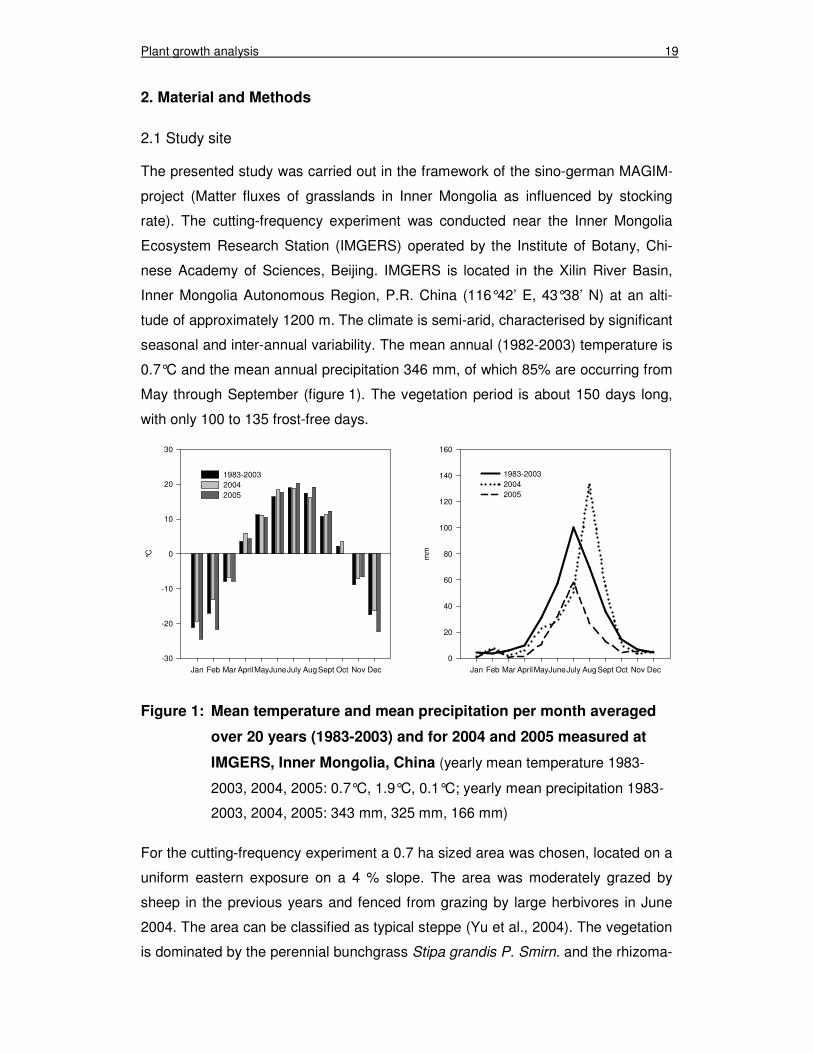
Figure 1: Mean temperature and mean precipitation per month averaged
over 20 years (1983-2003) and for 2004 and 2005 measured at
IMGERS, Inner Mongolia, China (yearly mean temperature 1983-
2003, 2004, 2005: 0.7°C, 1.9°C, 0.1°C; yearly mean precipitation 1983-
2003, 2004, 2005: 343 mm, 325 mm, 166 mm)
For the cutting-frequency experiment a 0.7 ha sized area was chosen, located on a
uniform eastern exposure on a 4 % slope. The area was moderately grazed by
sheep in the previous years and fenced from grazing by large herbivores in June
2004. The area can be classified as typical steppe (Yu et al., 2004). The vegetation
is dominated by the perennial bunchgrass Stipa grandis P. Smirn. and the rhizoma-
Jan Feb Mar AprilMayJuneJuly AugSept Oct Nov Dec
mm
0
20
40
60
80
100
120
140
160
1983-200320042005
Jan Feb Mar AprilMayJuneJuly AugSept Oct Nov Dec
°C
-30
-20
-10
0
10
20
30
1983-200320042005
Plant growth analysis 20
tous Leymus chinensis (Trin.) Tsvelev, both grasses belong to the C3 photosynthe-
sis type. This vegetation type can be considered as representative for large parts of
the Xilin River Basin (Bai et al., 2004). Soils of the experimental area were classi-
fied as Calcic Chernozems (IUSS Working Group WRB, 2006) derived from aeolian
sediments. Topsoils (0-15 cm) exhibited a loam to sandy loam texture, an organic
carbon content of 21 mg g-1 and a C/N-ratio of 10.
2.2 Experimental design and field measurements
Three treatments were tested in a randomised block-design with 4 replications. The
treatments differed in cutting frequency: treatment I (T I) resembled the local prac-
tice of haymaking, which is cutting once a year between end of August and early
September. The hay cut was performed by a bar mower used by local farmers, cut-
ting height was approx. 8 cm above soil surface. Treatment II (T II) was cut every 6
weeks representing moderate defoliation intensity and treatment III (T III) was cut
every 3 weeks representing high defoliation intensity. Cutting was carried out with a
conventional lawn mower to 2.5 cm stubble height, to simulate intensive grazing by
sheep. Each replication plot measured about 200 m² (~ 12 x 16 m).
The herbage sampling intervals partially differed from the cutting intervals. In 2004
T I and T II were sampled every 2 weeks, but T I was cut only once in September
and T II was cut every 6 weeks, respectively. In T III cutting dates correspond to
sampling dates, as T III was sampled every 3 weeks, right before each cut. In 2005
the herbage sampling interval of T I and T II was reduced to 6 weeks (adjusted to
the cutting frequency of T II), T III was furthermore sampled every 3 weeks right
before each cut. All herbage sampling and cutting dates are summarized in table 1.
At the sampling dates herbage was clipped to 1cm stubble height in 4 randomly
distributed 0.25-m² sampling quadrates within each plot. The clipping height of 1
cm represents the theoretically available biomass to sheep. The clipped herbage of
the 4 quadrates was pooled and transferred to the laboratory in a cooling box. The
pooled herbage sample was separated into 4 fractions: the dominant species S.
grandis and L. chinensis, all remaining species combined and the standing necrotic
material. Litter (necrotic material spread on the ground) was removed before clip-
ping by gentle combing with a wool comb and not included into the herbage sample.
The samples were dried at 60°C for 24 h in a forced-air drying-oven and weighted
to derive the dry matter (DM)-yield of each fraction. The total DM-yield of the sward
was determined by adding up the DM-yields of the 4 fractions.
Plant growth analysis 21
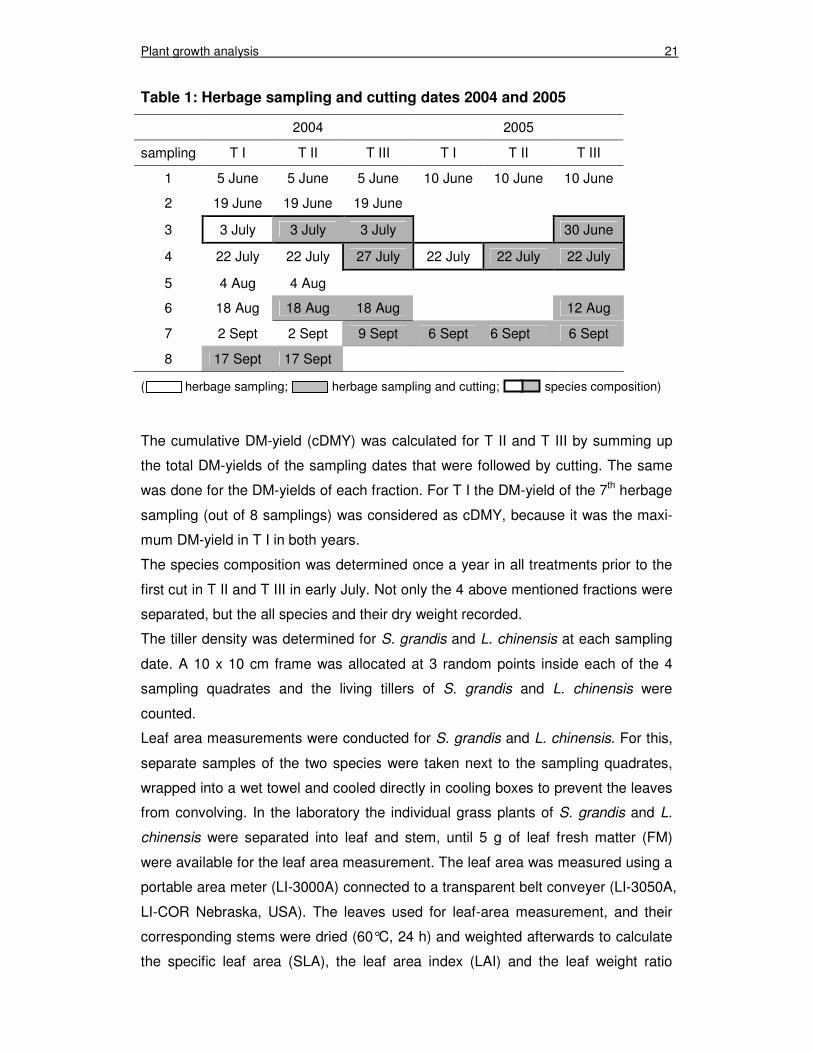
Table 1: Herbage sampling and cutting dates 2004 and 2005
2004 2005
sampling T I T II T III T I T II T III
1 5 June 5 June 5 June 10 June 10 June 10 June
2 19 June 19 June 19 June
3 3 July 3 July 3 July 30 June
4 22 July 22 July 27 July 22 July 22 July 22 July
5 4 Aug 4 Aug
6 18 Aug 18 Aug 18 Aug 12 Aug
7 2 Sept 2 Sept 9 Sept 6 Sept 6 Sept 6 Sept
8 17 Sept 17 Sept
( herbage sampling; herbage sampling and cutting; species composition)
The cumulative DM-yield (cDMY) was calculated for T II and T III by summing up
the total DM-yields of the sampling dates that were followed by cutting. The same
was done for the DM-yields of each fraction. For T I the DM-yield of the 7th herbage
sampling (out of 8 samplings) was considered as cDMY, because it was the maxi-
mum DM-yield in T I in both years.
The species composition was determined once a year in all treatments prior to the
first cut in T II and T III in early July. Not only the 4 above mentioned fractions were
separated, but the all species and their dry weight recorded.
The tiller density was determined for S. grandis and L. chinensis at each sampling
date. A 10 x 10 cm frame was allocated at 3 random points inside each of the 4
sampling quadrates and the living tillers of S. grandis and L. chinensis were
counted.
Leaf area measurements were conducted for S. grandis and L. chinensis. For this,
separate samples of the two species were taken next to the sampling quadrates,
wrapped into a wet towel and cooled directly in cooling boxes to prevent the leaves
from convolving. In the laboratory the individual grass plants of S. grandis and L.
chinensis were separated into leaf and stem, until 5 g of leaf fresh matter (FM)
were available for the leaf area measurement. The leaf area was measured using a
portable area meter (LI-3000A) connected to a transparent belt conveyer (LI-3050A,
LI-COR Nebraska, USA). The leaves used for leaf-area measurement, and their
corresponding stems were dried (60°C, 24 h) and weighted afterwards to calculate
the specific leaf area (SLA), the leaf area index (LAI) and the leaf weight ratio
Plant growth analysis 22
(LWR). The calculations for S. grandis took into account its needlegrass morphol-
ogy and therefore doubled the measured leaf area for the calculation of SLA and
LAI. In 2005 leaf area measurements were carried out only in T I.
After the last herbage sampling in mid September, root samples were taken with a
cylindrical corer (15 cm depth, 10 cm diameter). On each plot 10 samples were
taken randomly and soil was washed out right after sampling. Finally, root samples
were drained using a conventional spin-drier and immediately frozen at -20°C. The
samples were transported to Germany and meanwhile protected from thawing by
using an insulated bag. Subsequently the samples were freeze-dried (Benchtop
Series, VirTis, Gardiner, NY, USA) and weighted.
2.3 Laboratory measurements
The dried herbage and freeze-dried root samples were ground with a cyclotec mill
(Tecator, Germany) to pass a 1 mm sieve. All samples were scanned with a NIR-
Systems 5000 monochromator (Perstrop Analytical Inc., Silver Spring, MD, USA)
with 2 replications over a wavelength range from 1100 to 2500 nm in 2 nm intervals.
The software NIRS 2 by Infrasoft International® (ISI, Port Mathilda, PA, USA) was
used for scanning, mathematical processing, calibration and statistical analysis of
the spectra data. The laboratory analyses were carried out on calibration and vali-
dation sub-sets of herbage and root samples, which were chosen by the software
NIRS 2.
The N-content of herbage sub-set samples and both C- and N-content of root sub-
set samples were measured using a C/N-Analyzer (vario Max CN, Elementar Ana-
lysensysteme, Hanau, Germany) which is based upon the DUMAS combustion
method.
The total non-structural carbohydrates (TNC) in roots were measured by high pres-
sure anion exchange chromatography with pulsed amperometric detection
(HPAEC-PAD) modified after Chatterton et al. (1989) and Shiomi et al. (1991). Prior
to analysis the dried root samples were ground again with a ball mill to a particle
size of 10 µm. To extract the TNC, 40 mg of the lyophilised and ground material
were agitated with 2 ml deionised cold water for 60 minutes. After centrifugation
(3600 rpm) the supernatant was purified with 67 µl Chloroform. The supernatant
was separated from the pellet. The pellet was dried in a vacuum-dryer for 1 h at
55°C and stored at -20°C for starch analysis. The supernatant was diluted 1:5 in
deionised water and 2 ml of the dilution were filtrated through a C18-cartridge
Plant growth analysis 23
(Strata C18-E, Phenomenex Inc., Torrance, CA, USA). The filtrate was hydrolysed
in 2N HCl for 2 h at 80°C to split fructans into glucose and fructose, but naturally
also sucrose was split up. For starch analysis the frozen pellet was defrosted at
room-temperature for 30 minutes. 2 ml enzyme solution, containing amyloglucosi-
dase from Aspergillus niger (14U/mg, Roche Diagnostics) and Sodium-Acetate-
Buffer (pH: 4.8) at a ratio of 1:13.6 were added and vortexed intensively for 20 sec-
onds. The mixture was incubated over night (~ 14 h) at 37°C and afterwards ex-
tracted in the same way as described above. Because it was not always possible to
measure the carbohydrates right after extraction, the extracts were stored at -20°C
until analysis.
To quantify the carbohydrates in the extracts, glucose and fructose were separated
on an Ion Chromatography system (DX-300, Dionex Corp., Sunnyvale, CA, USA)
using a CarboPac PA 100 column (4 x 250 mm). The carbohydrates were eluted
with NaOH (200 mmol l-1) in deionisied H2O, with a NaOH gradient that increased
from 28% at 0 minutes to 35% at 8 minutes and further to 50% at 9 minutes. To
rinse the column, a further increase to 80% at 11 minutes was included, from which
the gradient returned to 28% NaOH until the end of the program at 18.5 minutes.
Flow rate through the system was 1.0 ml min-1. A standard solution was prepared
with equal proportions of chemically pure glucose, fructose and sucrose, with con-
centrations ranging from 10 mg l-1 to 150 mg l-1.
2.4 Statistical analysis
Data were subjected to analysis of variance separately for the two experimental
years using the mixed procedure of the software package SAS®9 (SAS Institute
Inc., Cary, NC, USA). Experimental factors were ‘replication’ and ‘treatment’, as
well as ‘sampling date’ (mutual sampling dates 1, 4 and 7) for tiller density, SLA,
LAI and LWR, which was considered as repeated measurement. Means with sig-
nificant F-value were tested with Student’s t-test and probabilities were corrected
by the Bonferroni-Holm test (Horn and Vollandt, 1995). The level of significance of
P<0.05 was chosen.
Plant growth analysis 24
3. Results
3.1 Above- and belowground productivity
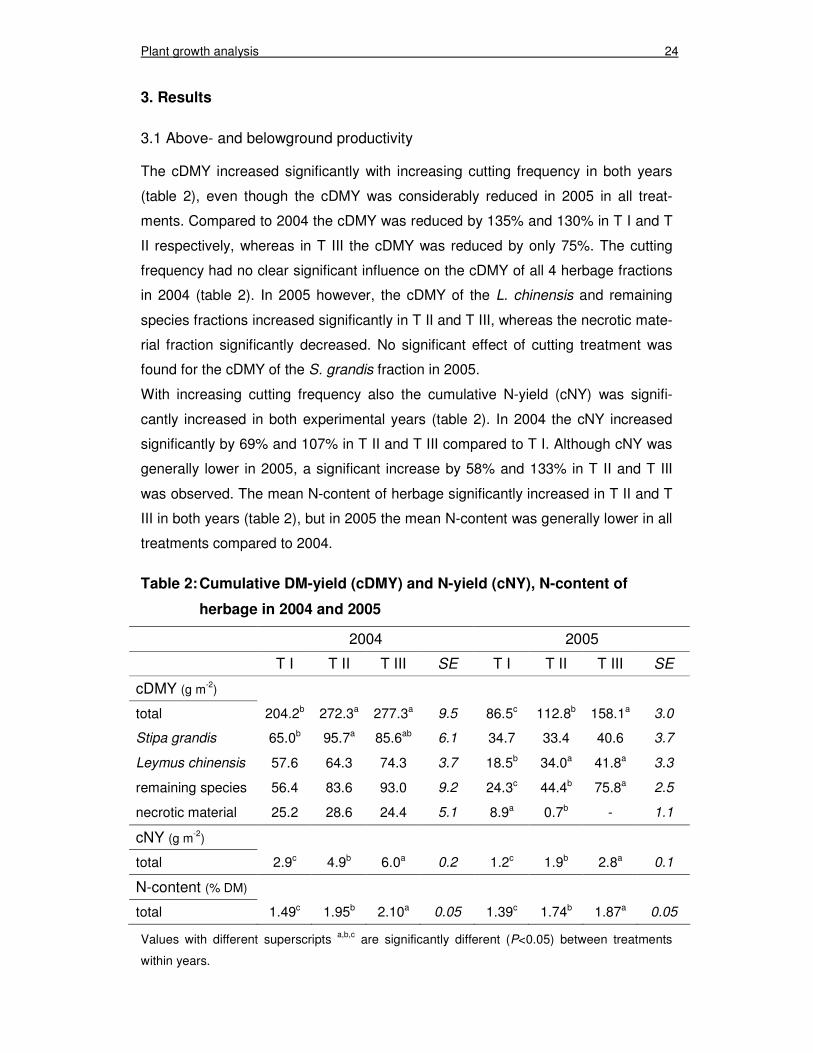
The cDMY increased significantly with increasing cutting frequency in both years
(table 2), even though the cDMY was considerably reduced in 2005 in all treat-
ments. Compared to 2004 the cDMY was reduced by 135% and 130% in T I and T
II respectively, whereas in T III the cDMY was reduced by only 75%. The cutting
frequency had no clear significant influence on the cDMY of all 4 herbage fractions
in 2004 (table 2). In 2005 however, the cDMY of the L. chinensis and remaining
species fractions increased significantly in T II and T III, whereas the necrotic mate-
rial fraction significantly decreased. No significant effect of cutting treatment was
found for the cDMY of the S. grandis fraction in 2005.
With increasing cutting frequency also the cumulative N-yield (cNY) was signifi-
cantly increased in both experimental years (table 2). In 2004 the cNY increased
significantly by 69% and 107% in T II and T III compared to T I. Although cNY was
generally lower in 2005, a significant increase by 58% and 133% in T II and T III
was observed. The mean N-content of herbage significantly increased in T II and T
III in both years (table 2), but in 2005 the mean N-content was generally lower in all
treatments compared to 2004.
Table 2: Cumulative DM-yield (cDMY) and N-yield (cNY), N-content of
herbage in 2004 and 2005
2004 2005
T I T II T III SE T I T II T III SE
cDMY (g m-2)
total 204.2b 272.3a 277.3a 9.5 86.5c 112.8b 158.1a 3.0
Stipa grandis 65.0b 95.7a 85.6ab 6.1 34.7 33.4 40.6 3.7
Leymus chinensis 57.6 64.3 74.3 3.7 18.5b 34.0a 41.8a 3.3
remaining species 56.4 83.6 93.0 9.2 24.3c 44.4b 75.8a 2.5
necrotic material 25.2 28.6 24.4 5.1 8.9a 0.7b - 1.1
cNY (g m-2)
total 2.9c 4.9b 6.0a 0.2 1.2c 1.9b 2.8a 0.1
N-content (% DM)
total 1.49c 1.95b 2.10a 0.05 1.39c 1.74b 1.87a 0.05
Values with different superscripts a,b,c are significantly different (P<0.05) between treatments
within years.
Plant growth analysis 25
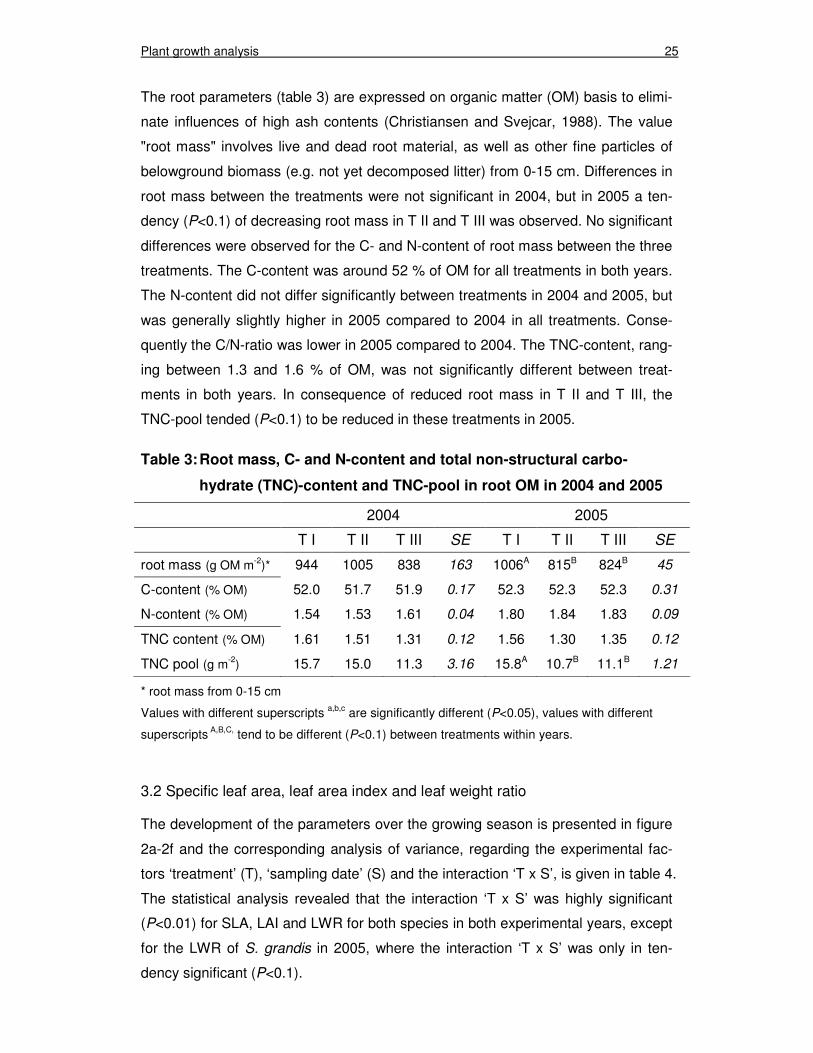
The root parameters (table 3) are expressed on organic matter (OM) basis to elimi-
nate influences of high ash contents (Christiansen and Svejcar, 1988). The value
"root mass" involves live and dead root material, as well as other fine particles of
belowground biomass (e.g. not yet decomposed litter) from 0-15 cm. Differences in
root mass between the treatments were not significant in 2004, but in 2005 a ten-
dency (P<0.1) of decreasing root mass in T II and T III was observed. No significant
differences were observed for the C- and N-content of root mass between the three
treatments. The C-content was around 52 % of OM for all treatments in both years.
The N-content did not differ significantly between treatments in 2004 and 2005, but
was generally slightly higher in 2005 compared to 2004 in all treatments. Conse-
quently the C/N-ratio was lower in 2005 compared to 2004. The TNC-content, rang-
ing between 1.3 and 1.6 % of OM, was not significantly different between treat-
ments in both years. In consequence of reduced root mass in T II and T III, the
TNC-pool tended (P<0.1) to be reduced in these treatments in 2005.
Table 3: Root mass, C- and N-content and total non-structural carbo-
hydrate (TNC)-content and TNC-pool in root OM in 2004 and 2005
2004 2005
T I T II T III SE T I T II T III SE
root mass (g OM m-2)* 944 1005 838 163 1006A 815B 824B 45
C-content (% OM) 52.0 51.7 51.9 0.17 52.3 52.3 52.3 0.31
N-content (% OM) 1.54 1.53 1.61 0.04 1.80 1.84 1.83 0.09
TNC content (% OM) 1.61 1.51 1.31 0.12 1.56 1.30 1.35 0.12
TNC pool (g m-2) 15.7 15.0 11.3 3.16 15.8A 10.7B 11.1B 1.21
* root mass from 0-15 cm
Values with different superscripts a,b,c are significantly different (P<0.05), values with different
superscripts A,B,C, tend to be different (P<0.1) between treatments within years.
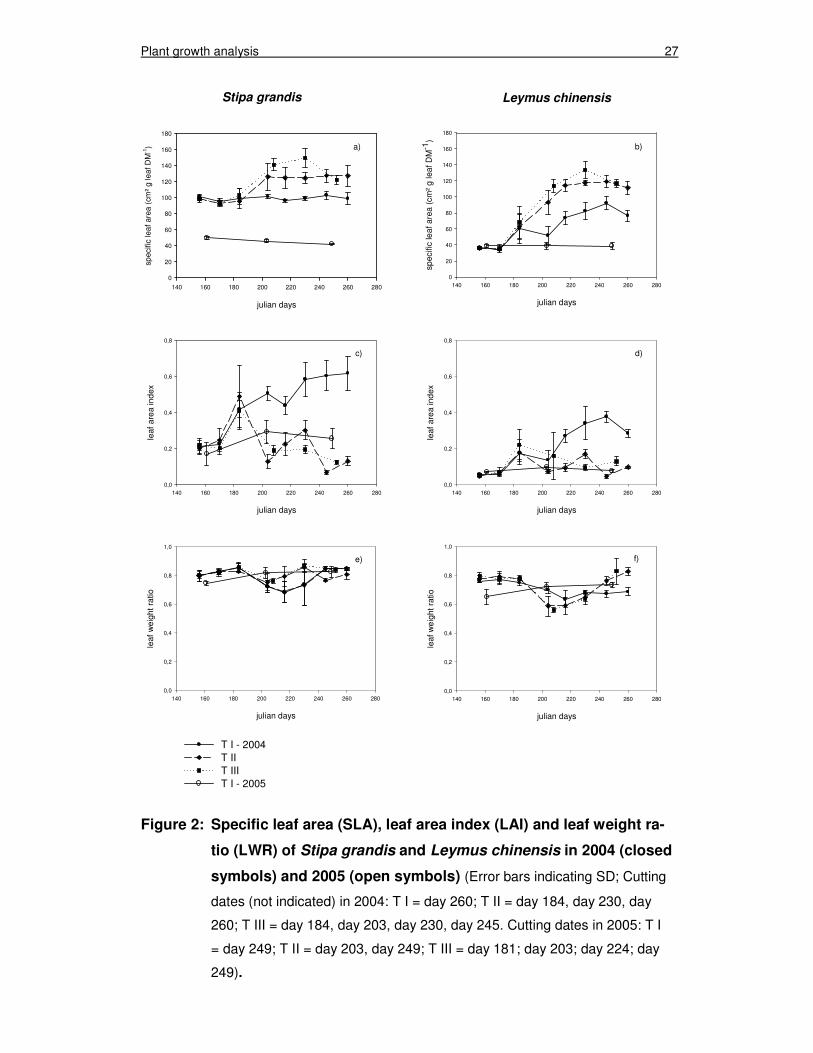
3.2 Specific leaf area, leaf area index and leaf weight ratio
The development of the parameters over the growing season is presented in figure
2a-2f and the corresponding analysis of variance, regarding the experimental fac-
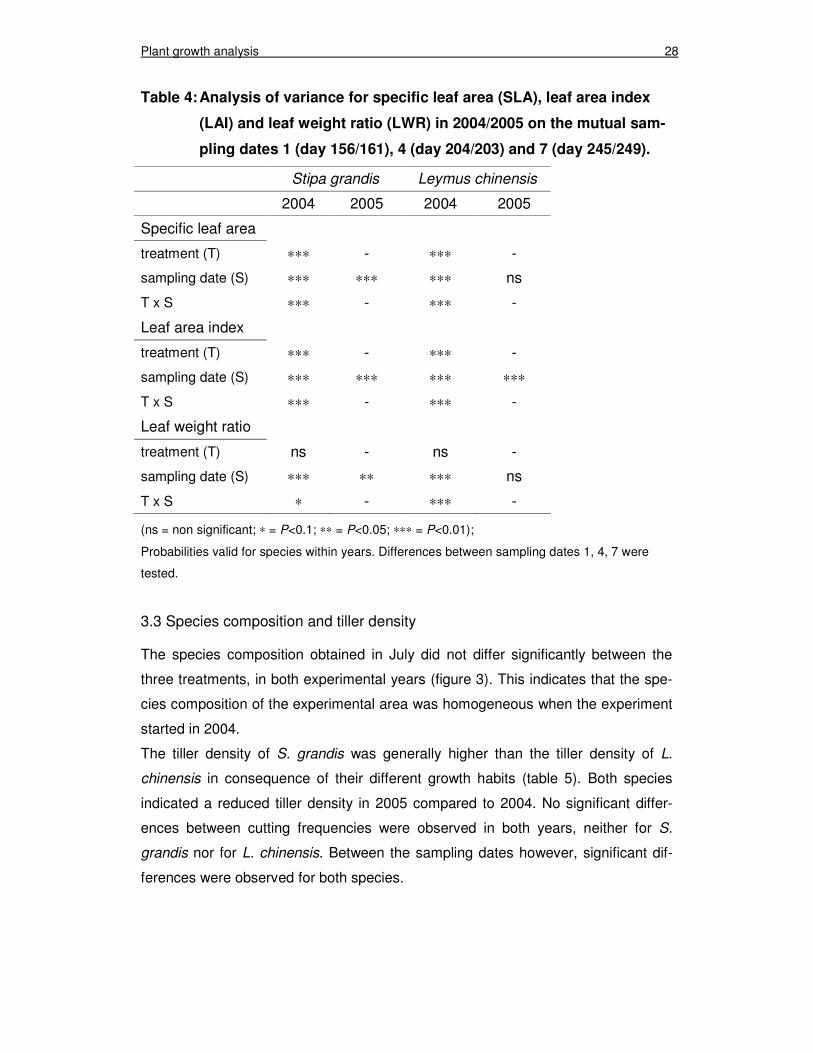
tors ‘treatment’ (T), ‘sampling date’ (S) and the interaction ‘T x S’, is given in table 4.
The statistical analysis revealed that the interaction ‘T x S’ was highly significant
(P<0.01) for SLA, LAI and LWR for both species in both experimental years, except
for the LWR of S. grandis in 2005, where the interaction ‘T x S’ was only in ten-
dency significant (P<0.1).
Plant growth analysis 26
The SLA of S. grandis was constant in T I over the growing season of 2004, rang-
ing around 100 cm² g-1 leaf DM (figure 2a). In T II and T III the SLA increased after
the first cut to approx. 120 cm² g-1 leaf DM. In T II the SLA kept this level until the
end of growing season, whereas in T III there was a further increase with the next
cut and a decrease with the last cut. L. chinensis showed a steady increase in SLA
over the growing season of 2004 in all treatments (figure 2b), but the increases in T
II and T III exceeded the increase in T I. All treatments started with an SLA of 36
cm² g-1 leaf DM, which increased during the growing season to 92 cm² g-1 leaf DM
in T I and 118 and 134 cm² g-1 leaf DM in T II and T III, respectively. In 2005 SLA
was measured only in T I and almost no changes over the growing period were
observed, neither in S. grandis nor in L. chinensis. Besides less dynamic develop-
ment in 2005, the SLA of both species was much lower in 2005 compared to 2004.
The LAI of S. grandis increased in T I from 0.2 to 0.6 (figure 2c) in the growing sea-
son of 2004. In T II the LAI decreased significantly after cutting, but increased again
until the next cut. In T III the LAI indicated that the S. grandis plants had no time to
recover from the cuts, because the LAI decreased steadily with each cut. In 2005
the LAI of S. grandis was reduced to 0.3 in T I as the highest value in mid July. In
general L. chinensis had a lower LAI than S. grandis (figure 2d) between 0.1 and
0.4 in both years, but the development of the LAI after cutting was similar to the
development of LAI in S. grandis. The available data for 2005 in T I displayed a
vastly reduced LAI (< 0.1) compared to 2004.
The LWR of both species ranged between 0.60 and 0.85 over the vegetation period
in 2004 (figure 2e and 2f). In S. grandis the LWR decreased after day 180 in all
treatments. In T I the LWR increased again from day 220 on until the end of the
season. In T II and T III the effect of cutting was demonstrated by a decrease in
LWR after the cut and an increase until the next cut was carried out. The variation
in LWR of S. grandis was high, thus no difference between the treatments was sta-
tistically significant. The LWR of L. chinensis was approx. 0.80 until day 180 fol-
lowed by a decrease in all treatments. This decrease was more pronounced after
the first cut in T II and T III than the decrease in T I. Afterwards the LWR of T II and
T III were fairly similar, although the cutting frequency was different.
Plant growth analysis 27
Figure 2: Specific leaf area (SLA), leaf area index (LAI) and leaf weight ra-
tio (LWR) of Stipa grandis and Leymus chinensis in 2004 (closed
symbols) and 2005 (open symbols) (Error bars indicating SD; Cutting
dates (not indicated) in 2004: T I = day 260; T II = day 184, day 230, day
260; T III = day 184, day 203, day 230, day 245. Cutting dates in 2005: T I
= day 249; T II = day 203, day 249; T III = day 181; day 203; day 224; day
249).
julian days
140 160 180 200 220 240 260 280
spec
ific
lea
f are
a (c
m²
g le
af D
M-1
)
0
20
40
60
80
100
120
140
160
180
julian days
140 160 180 200 220 240 260 280
spec
ific
leaf
are
a (c
m²
g le
af D
M-1
)
0
20
40
60
80
100
120
140
160
180
julian days
140 160 180 200 220 240 260 280
leaf
are
a in
dex
0,0
0,2
0,4
0,6
0,8
julian days
140 160 180 200 220 240 260 280
leaf
are
a in
dex
0,0
0,2
0,4
0,6
0,8
julian days
140 160 180 200 220 240 260 280
leaf
wei
ght
ratio
0,0
0,2
0,4
0,6
0,8
1,0
T I - 2004T IIT IIIT I - 2005
julian days
140 160 180 200 220 240 260 280
leaf
we
ight
rat
io
0,0
0,2
0,4
0,6
0,8
1,0
Stipa grandis Leymus chinensis
a) b)
c) d)
e) f)
Plant growth analysis 28
Table 4: Analysis of variance for specific leaf area (SLA), leaf area index
(LAI) and leaf weight ratio (LWR) in 2004/2005 on the mutual sam-
pling dates 1 (day 156/161), 4 (day 204/203) and 7 (day 245/249).
Stipa grandis Leymus chinensis
2004 2005 2004 2005
Specific leaf area
treatment (T) ∗∗∗ - ∗∗∗ -
sampling date (S) ∗∗∗ ∗∗∗ ∗∗∗ ns
T x S ∗∗∗ - ∗∗∗ -
Leaf area index
treatment (T) ∗∗∗ - ∗∗∗ -
sampling date (S) ∗∗∗ ∗∗∗ ∗∗∗ ∗∗∗
T x S ∗∗∗ - ∗∗∗ -
Leaf weight ratio
treatment (T) ns - ns -
sampling date (S) ∗∗∗ ∗∗ ∗∗∗ ns
T x S ∗ - ∗∗∗ -
(ns = non significant; ∗ = P<0.1; ∗∗ = P<0.05; ∗∗∗ = P<0.01);
Probabilities valid for species within years. Differences between sampling dates 1, 4, 7 were
tested.
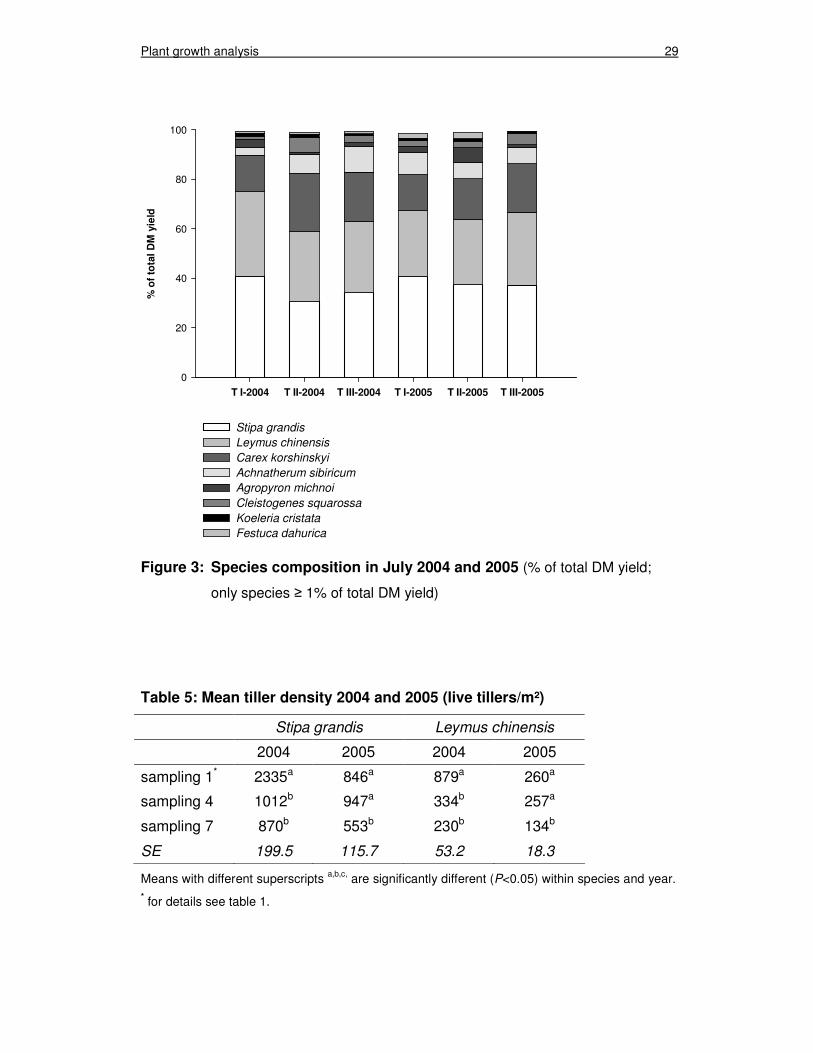
3.3 Species composition and tiller density
The species composition obtained in July did not differ significantly between the
three treatments, in both experimental years (figure 3). This indicates that the spe-
cies composition of the experimental area was homogeneous when the experiment
started in 2004.
The tiller density of S. grandis was generally higher than the tiller density of L.
chinensis in consequence of their different growth habits (table 5). Both species
indicated a reduced tiller density in 2005 compared to 2004. No significant differ-
ences between cutting frequencies were observed in both years, neither for S.
grandis nor for L. chinensis. Between the sampling dates however, significant dif-
ferences were observed for both species.
Plant growth analysis 29
T I-2004 T II-2004 T III-2004 T I-2005 T II-2005 T III-2005
% o
f to
tal
DM
yie
ld
0
20
40
60
80
100
Stipa grandis
Leymus chinensis
Carex korshinskyi
Achnatherum sibiricum
Agropyron michnoi
Cleistogenes squarossa
Koeleria cristata
Festuca dahurica
Figure 3: Species composition in July 2004 and 2005 (% of total DM yield;
only species ≥ 1% of total DM yield)
Table 5: Mean tiller density 2004 and 2005 (live tillers/m²)
Stipa grandis Leymus chinensis
2004 2005 2004 2005
sampling 1* 2335a 846a 879a 260a
sampling 4 1012b 947a 334b 257a
sampling 7 870b 553b 230b 134b
SE 199.5 115.7 53.2 18.3
Means with different superscripts a,b,c, are significantly different (P<0.05) within species and year. * for details see table 1.
Plant growth analysis 30
4. Discussion
Effects of grazing on grasses or grass communities need to be examined in grazing
trials. Grazing trials however, are very complex, expensive and difficult to manage,
therefore a lot of studies analysing plant physiological processes resulting from
grazing, have simulated grazing by defoliation through cutting (Brougham, 1956;
Archer and Tieszen, 1983; Ruess, 1988; Hodgkinson et al., 1989; Turner et al.,
1993; Leriche et al., 2003). Although cutting is inadequate to simulate a grazing
system as a whole (Hart and Norton, 1988), cutting experiments provide the
chance to study the effects of defoliation on grass physiology and morphology in
detail with the knowledge about defoliation date and defoliation intensity. To get an
overview of the short-term responses of the examined grassland sward to defolia-
tion, this cutting-frequency experiment provides a reasonable basis.
4.1 Above- and belowground productivity
In agricultural terminology productivity of the aboveground herbaceous material is
commonly referred to as DM-yield (DMY) (‘t Mannetje, 2000) or, when DM-
increment was measured, the cumulative DM-yield (cDMY). The cDMY of T I was
204 and 86 g m-2 in 2004 and 2005, respectively (table 2). These results fit well into
the range of peak standing crop obtained by Xiao et al. (1995), who analysed the
peak standing crop of a S. grandis and a L. chinensis dominated site (both fenced
from grazing) over a 9-year period. The peak standing crop of the S. grandis site
was on average 152 g m-2 (93-206 g m-2) and of the L. chinensis site 194 g m-2
(107-253 g m-2). Other studies conducted in the Xilin River Basin (Li, 1989; Bai et
al., 2004) describe similar levels of biomass production for ungrazed or lightly
grazed sites.
The frequently defoliated treatments (T II and T III) showed significantly increased
cDMY in both experimental years, even though the production level differed mark-
edly between the years. Increasing cDMY due to defoliation was not expected, as
intensive defoliation has been always reported to have a negative effect on bio-
mass productivity in the grassland of the Xilin River Basin (Li, 1989; Wang, 1992;
Wang and Ripley, 1997; Christensen et al., 2003). Barger et al. (2004) report espe-
cially a reduction in perennial grasses, what was confirmed by Xie and Wittig (2003)
for grassland in Ningxia, which is a neighbouring province of Inner Mongolia with
similar environmental conditions. However, all these studies refer to long-term ex-
Plant growth analysis 31
periments or examine grassland communities from a retrospective point of view,
but do not account for short-term responses of biomass productivity to defoliation.
Similarly, most of the studies examining defoliation effects on semi-arid grasslands
report decreasing biomass production when defoliation intensity increased (Milchu-
nas and Lauenroth, 1993; Fynn and O’Connor, 2000; Ferraro and Oesterheld,
2002). Nevertheless, some studies can be found reporting that defoliation stimu-
lated aboveground biomass production and a compensation or even overcompen-
sation in biomass production was observed (Georgiadis et al., 1989; Frank and
McNaughton, 1993; Loeser et al., 2004). Several negative and positive effects of
defoliation on plant growth have been identified (Noy-Meir, 1993). As negative ef-
fects the reduction in photosynthetic leaf area, removal of apical meristems and
loss of stored nutrients have to be mentioned. Positive effects are increasing light
intensity and improved water and nutrient supply to remaining leaves, reduced se-
nescence of new leaves and increased allocation of stored and current photosyn-
thates to new leaf area, and finally the activation of dormant meristems. The effect
of defoliation on a grassland sward can not be generalised, not even for specific
grassland types like steppes. Whether the effect of defoliation is negative or posi-
tive depends on the particular environmental conditions and on the defoliation
management employed. Positive effects of frequent defoliation on productivity have
especially been observed for low productive sites with a long history of moderate
grazing (Milchunas and Lauenroth, 1993) and for plants suffering from drought
stress (McNaughton, 1983; Coughenour et al., 1990). The positive response of
drought stressed plants to defoliation was attributed to the removal of plant bio-
mass and the subsequently reduced leaf area that results in reduced transpiration
and therefore increased soil-water conservation and soil-water potential of the plant
(Archer and Detling, 1986). Both suggested explanations apply to the situation in
the semi-arid grasslands of the Xilin River Basin.
There are several approaches that can be consulted to explain the increase in
cDMY after frequent defoliation, but from the obtained results it is not possible to
exactly determine the responsible processes. The results indicate short-term ef-
fects that can not account for possible long-term effects, but the results demon-
strate that in the short-term the examined grassland sward is resistant to defolia-
tion-induced decreases in aboveground biomass productivity.
The increase in cDMY in T II and T III resulted from increasing cDMY of the domi-
nant species, as well as of the remaining species fraction (table 2). In 2005 how-
ever, the increase in the remaining species fraction was more pronounced than in
Plant growth analysis 32
2004 and increased significantly due to frequent defoliation. The increase in cDMY
thus resulted to a great extent from the increase in cDMY of other species than S.
grandis and L. chinensis. The remaining species fraction was not further analysed,
but from observation it can be reported that prostrate species with planophile mor-
phology like Carex korshinskyi and Cleistogenes squarossa particularly increased
after defoliation, what can be attributed to enhanced light, space and water avail-
ability after defoliation. Nevertheless, the overcompensation in T II and T III is not
only a result of complementary effects through the advancement of growth condi-
tions of certain species due to defoliation. Overcompensation due to defoliation was
also demonstrated for S. grandis and L. chinensis in T II and T III in both years (ta-
ble 2).
Stipa spp. are the predominant species in desert steppes (Xie and Wittig, 2003),
while L. chinensis becomes predominant in regions that are more humid than the
Xilin River Basin (Wang and Gao, 2003). It was therefore expected that the cDMY
of the L. chinensis fraction would decrease more due to the drought in 2005 than
the cDMY of the other fractions. This happened in T I, but not in T II and T III where
the cDMY of the L. chinensis fraction increased like the fraction of the remaining
species. This overcompensation of L. chinensis after frequent defoliation might be
explained by the fact that in autumn of 2004 the precipitation rate was above-
average and that the plants benefit from the wet autumn 2004 in spring 2005.
When the drought became apparent in summer 2005 the frequently defoliated
treatments benefited from defoliation, as the water loss due to transpiration was
reduced by reducing the leaf area.
The considerable decrease in cDMY in 2005 compared to 2004 has to be dis-
cussed against the difference in precipitation rate between both years. Several
studies point out the strong impact of precipitation on semi-arid grasslands (Noy-
Meir, 1973; Le Houérou et al., 1988; Lauenroth and Sala, 1992; Xiao et al., 1995;
Fynn and O’Connor, 2000; O’Connor et al., 2001; Knapp and Smith, 2001; Knapp
et al., 2002; Christensen et al., 2003, Yu et al., 2004). Especially the variability in
precipitation, both inter-annual and intra-annual, is a major influence on productivity
in grasslands (Knapp and Smith, 2001). For Inner Mongolia grasslands Xiao et al.
(1995) and Bai et al. (2004) explained approx. 40% of the variability in biomass
production by variation in seasonal precipitation. This corresponds to results from
the North American shortgrass steppe, where 39 to 45% of the variability in produc-
tion was attributed to the relation between precipitation and biomass production
(Lauenroth and Sala, 1992).
Plant growth analysis 33
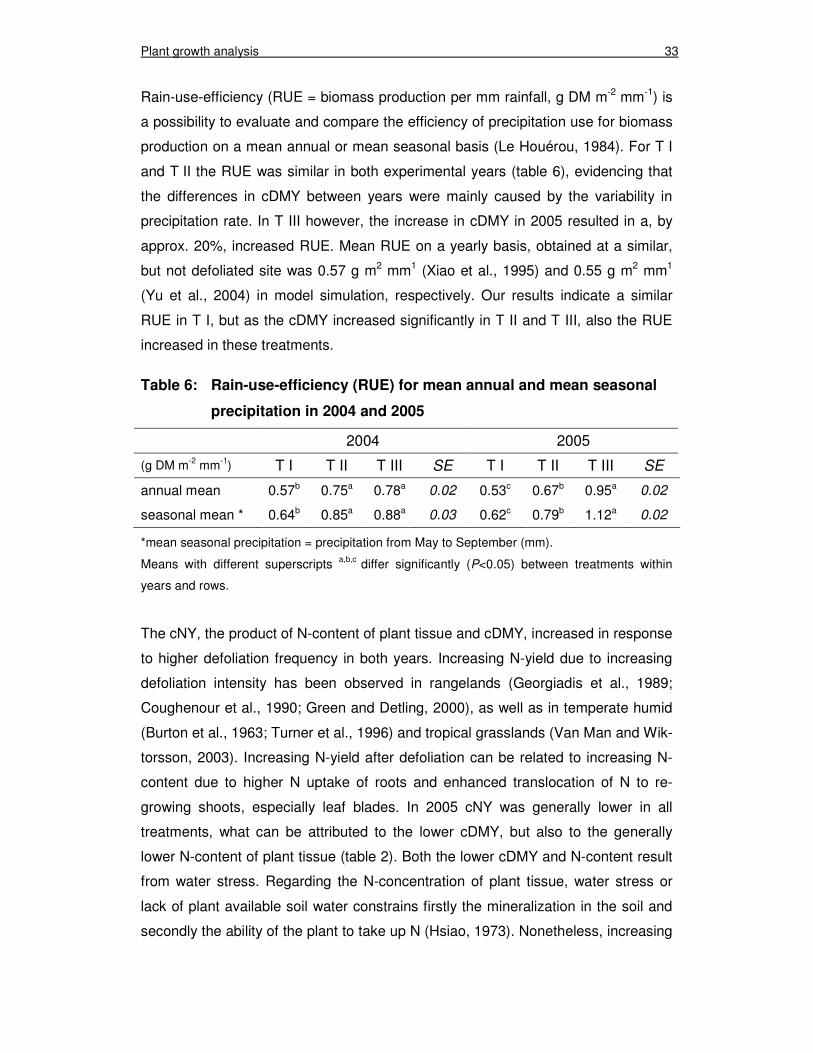
Rain-use-efficiency (RUE = biomass production per mm rainfall, g DM m-2 mm-1) is
a possibility to evaluate and compare the efficiency of precipitation use for biomass
production on a mean annual or mean seasonal basis (Le Houérou, 1984). For T I
and T II the RUE was similar in both experimental years (table 6), evidencing that
the differences in cDMY between years were mainly caused by the variability in
precipitation rate. In T III however, the increase in cDMY in 2005 resulted in a, by
approx. 20%, increased RUE. Mean RUE on a yearly basis, obtained at a similar,
but not defoliated site was 0.57 g m2 mm1 (Xiao et al., 1995) and 0.55 g m2 mm1
(Yu et al., 2004) in model simulation, respectively. Our results indicate a similar
RUE in T I, but as the cDMY increased significantly in T II and T III, also the RUE
increased in these treatments.
Table 6: Rain-use-efficiency (RUE) for mean annual and mean seasonal
precipitation in 2004 and 2005
2004 2005
(g DM m-2 mm-1) T I T II T III SE T I T II T III SE
annual mean 0.57b 0.75a 0.78a 0.02 0.53c 0.67b 0.95a 0.02
seasonal mean * 0.64b 0.85a 0.88a 0.03 0.62c 0.79b 1.12a 0.02
*mean seasonal precipitation = precipitation from May to September (mm).
Means with different superscripts a,b,c differ significantly (P<0.05) between treatments within
years and rows.
The cNY, the product of N-content of plant tissue and cDMY, increased in response
to higher defoliation frequency in both years. Increasing N-yield due to increasing
defoliation intensity has been observed in rangelands (Georgiadis et al., 1989;
Coughenour et al., 1990; Green and Detling, 2000), as well as in temperate humid
(Burton et al., 1963; Turner et al., 1996) and tropical grasslands (Van Man and Wik-
torsson, 2003). Increasing N-yield after defoliation can be related to increasing N-
content due to higher N uptake of roots and enhanced translocation of N to re-
growing shoots, especially leaf blades. In 2005 cNY was generally lower in all
treatments, what can be attributed to the lower cDMY, but also to the generally
lower N-content of plant tissue (table 2). Both the lower cDMY and N-content result
from water stress. Regarding the N-concentration of plant tissue, water stress or
lack of plant available soil water constrains firstly the mineralization in the soil and
secondly the ability of the plant to take up N (Hsiao, 1973). Nonetheless, increasing
Plant growth analysis 34
cNY in T II and T III in 2005 indicated that defoliation stimulates the N-uptake by
roots in the short-term, also under drought conditions.
Short-term effects observed for the root parameters were not significant. In 2004 no
influence of defoliation frequency on root mass was observed, however in 2005 a
tendency (P<0.1) became apparent, indicating reduced root mass in the frequently
defoliated treatments. The root masses obtained in the present study are compara-
ble to data of other studies conducted in the same grassland type (Chen et al.,
2006; Gao, 2007). The root mass is high in comparison to the aboveground bio-
mass, but this has been widely observed in semi-arid grasslands (Werger, 1983).
Several studies have observed decreasing root mass caused by increasing defolia-
tion intensity (Weaver, 1950; Lorenz and Rogler, 1967; Holland and Detling, 1990),
also in semi-arid environments (Coughenour et al., 1985; Ruess, 1988; Turner et
al., 1993; Chen et al., 2006). These studies attributed the reduction in root mass to
a decrease in carbon allocation to the roots, caused by reduced photosynthesis
and enhanced carbon demand for re-growth of aboveground biomass after inten-
sive defoliation. Nevertheless, some studies from semi-arid environments did not
find differences in root mass comparing different defoliation systems (Bartos and
Sims, 1974; Coughenour et al., 1990; Milchunas and Lauenroth, 1993). However,
these studies report observations from grazing systems with a long grazing history
and it is argued that resident plants are well adapted to grazing, as the allocation of
photosynthate is not completely shifted from root to shoot after defoliation, but a
constant level of allocation to roots is maintained. As the root mass was not re-
duced in T I in 2005 compared to 2004, it seems likely that the reduction in T II and
T III, although only in tendency significant, is not a result of drought, but can be
ascribed to the defoliation frequency.
No differences have been observed in C- and N-content of root mass between
treatments in both years (table 3). However, in 2005 the N-content was generally
higher in all treatments compared to 2004, which can be attributed to the early se-
nescence in 2005, resulting from drought. Re-translocation of N to the roots in the
course of senescence is a widely accepted concept (Hayes, 1985).
Roots are considered to serve as storage organs for TNC (Weinmann, 1948; May,
1960; McIlroy, 1967; Pollock and Cairns, 1991), which play an important role in the
energy status of grasses. Roots and rhizomes of temperate grasses store carbohy-
drates, especially at the end of the vegetation period and serve as energy reserves
during winter (Steen and Larsson, 1986). Depletion of carbohydrate reserves by
frequent defoliation during the vegetation period has been widely observed (Ward

Plant growth analysis 35
and Blaser, 1961; White, 1973; Moritz, 1988; Fulkerson and Donaghy, 2001). The
TNC-content of roots found in the present study is low compared to the TNC-
contents found by other investigators working with grasses both in temperate-
humid (Steen and Larsson, 1986; Christiansen and Svejcar, 1988; Moritz, 1988;
Hume, 1991) and semi-arid environments (Buwai and Trlica, 1977; Menke and
Trlica, 1983). In general a comparison of results is challenging, because methods
and experimental designs are differing to a great extent, as do grass species and
environmental conditions. However, the TNC-content of roots in the present study
is particularly low. Gao (2007) investigated root mass dynamics in the same study
area and found out that only about 30% of roots harvested by the soil corer method
are living roots. Taking into account that dead roots are included in the OM, but do
not contain soluble carbohydrates, the TNC-content obtained in the present study
should be corrected for living root mass only.
A significant influence of defoliation on root TNC-content was not observed in the
present study, neither in 2004 nor in 2005. This indicates that the induced defolia-
tion stress was not as strong as to deplete the carbohydrate reserves, what em-
phasises the ability of the investigated grassland sward to resist defoliation stress
in the short-term.
This result contradicts the above cited studies, but is supported by the results of
Buwai and Trlica (1977) who observed, in one out of two rangeland grasses, that
defoliation had no effect on the root TNC-content.
4.2 Specific leaf area, leaf area index and leaf weight ratio
The leaf area measurement of S. grandis and L. chinensis does confirm the results
obtained for cDMY in 2004. Due to the loss of leaf area by defoliation, the produc-
tion of new leaves with higher SLA was stimulated (figure 2a and 2b). Hence the
photosynthesis rate must have been increased, what resulted in increased cDMY.
The development of SLA in T I reflects the different growth habits of S. grandis and
L. chinensis. S. grandis shows a constant SLA over the growing season, what is,
with regard to an increasing LAI, the result of an equal increase in leaf area and
leaf thickness and/or density, which are the two main components of SLA (Garnier
et al., 1997). In contrast, L. chinensis leaves increased the SLA over the growing
season, what can be attributed to a stronger increase in leaf area in relation to the
increase in leaf thickness and/or leaf density. In 2005 however, leaf area was only
measured in T I due to methodological problems in measuring the leaf area.
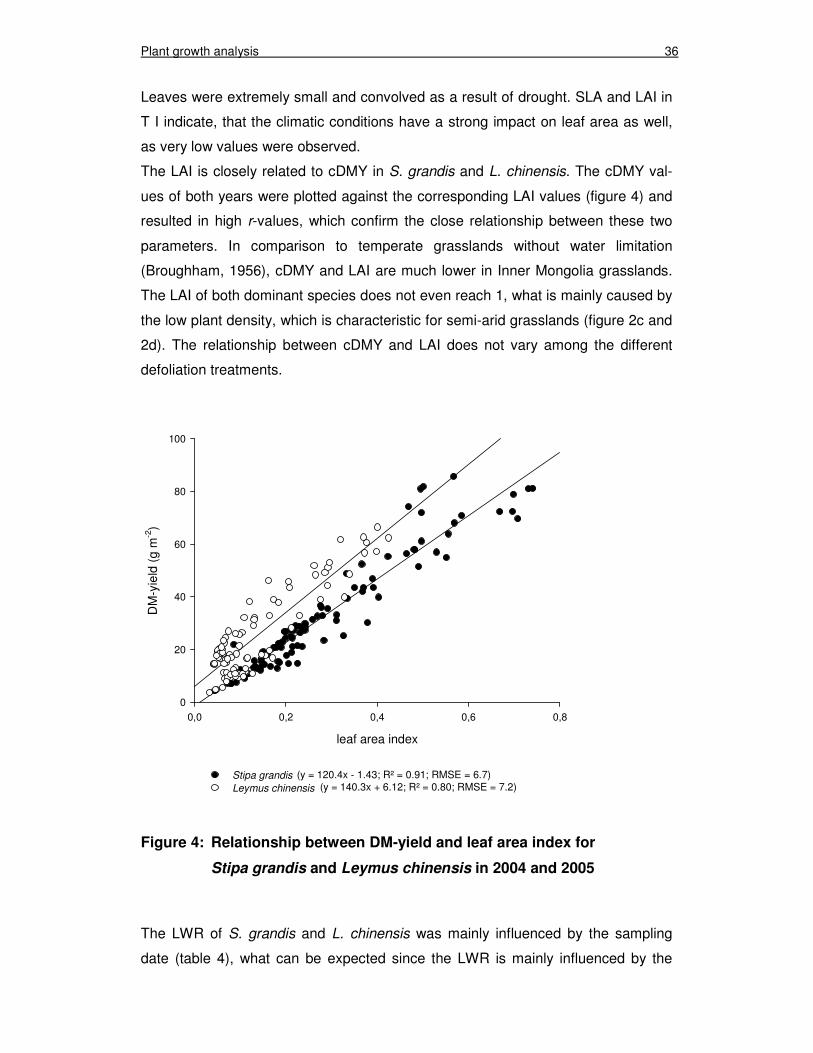
Plant growth analysis 36
Leaves were extremely small and convolved as a result of drought. SLA and LAI in
T I indicate, that the climatic conditions have a strong impact on leaf area as well,
as very low values were observed.
The LAI is closely related to cDMY in S. grandis and L. chinensis. The cDMY val-
ues of both years were plotted against the corresponding LAI values (figure 4) and
resulted in high r-values, which confirm the close relationship between these two
parameters. In comparison to temperate grasslands without water limitation
(Broughham, 1956), cDMY and LAI are much lower in Inner Mongolia grasslands.
The LAI of both dominant species does not even reach 1, what is mainly caused by
the low plant density, which is characteristic for semi-arid grasslands (figure 2c and
2d). The relationship between cDMY and LAI does not vary among the different
defoliation treatments.
Figure 4: Relationship between DM-yield and leaf area index for
Stipa grandis and Leymus chinensis in 2004 and 2005
The LWR of S. grandis and L. chinensis was mainly influenced by the sampling
date (table 4), what can be expected since the LWR is mainly influenced by the
leaf area index
0,0 0,2 0,4 0,6 0,8
DM
-yie
ld (
g m
-2)
0
20
40
60
80
100
Stipa grandis
Leymus chinensis
(y = 120.4x - 1.43; R² = 0.91; RMSE = 6.7) (y = 140.3x + 6.12; R² = 0.80; RMSE = 7.2)
Plant growth analysis 37
development of reproductive tillers in the course of the plant maturation process
(Buxton, 1996). Reproductive tillers are characterised by pronounced stem devel-
opment, what increases the stem proportion against the proportion of leaf (Minson,
1990). Defoliation retards the reproductive development of the grass plants; there-
fore the LWR should have been higher in the frequently defoliated treatments, but
only small and non-significant differences in LWR between treatments were ob-
served for both dominant species (figure 2e and 2 f). This observation implies that
S. grandis and L. chinensis develop only few reproductive tillers, regardless of the
defoliation frequency. The LWR remains therefore relatively constant over the
growing period and short-term responses to defoliation are only marginal.
4.3 Species composition and tiller density
Species composition is a major tool to assess the condition of and the processes in
a grassland ecosystem (Li, 1989; O’Connor et al., 2001; Xie and Wittig, 2003; Bai
et al., 2004; Tong et al., 2004). Many studies conducted in Inner Mongolia grass-
lands indicate changes in species composition from perennial species communities
to annual species communities to shrub communities (Li, 1989; Christensen et al.,
2003; Bai et al., 2004; Barger et al., 2004) with increasing grazing intensity. Li
(1989) classified the dominant species S. grandis and L. chinensis as “decreasers”
when subjected to intensive grazing, what is supported by the results of Wang and
Ripley (1997). Species composition, measured in all treatment plots prior to the first
cut in T III, did not change significantly in the 2nd experimental year in consequence
of defoliation in the first year (figure 3). A change in species composition was not
expected, as such changes are not likely to occur after only 2 years (Jones et al.,
1995); the results do therefore not contradict the studies mentioned above, be-
cause all studies were based on long-term observations.
The development of the tiller density (live tillers/m²) of S. grandis and L. chinensis
also confirm the results obtained for the species composition; there was no signifi-
cant change in tiller density between treatments. However, in the course of growing
season especially in 2004, tiller density declined (table 5). This can be attributed to
the commonly observed mortality of existing tillers and the reduced rate of new tiller
recruitment after the peak in tiller population in early spring in cool-season grasses
(Mitchell et al., 1998). In 2005 the development of tiller density was not as distinct,
because of the limited water availability. A reduction in tiller numbers due to water
stress has been often observed in grass swards (Busso and Richards, 1995; Par-
Plant growth analysis 38
sons and Chapman, 2000). Examining L. chinensis tiller density against an aridity
gradient in Inner Mongolia, Wang and Gao (2003) observed increasing tiller density
with increasing annual precipitation. They derived a regression equation, which
calculate a tiller density of 300 tillers m-2 for a precipitation amount of 340 mm year-
1, what corresponds to our results.
In summary, it can be stated that the aboveground herbage productivity was signifi-
cantly stimulated by frequent defoliation in the short-term. The cDMY positively re-
sponded to defoliation, but was essentially depended on precipitation what was
demonstrated by the concept of RUE. The cNY, as it depends on the cDMY, in-
creased also significantly due to increased defoliation frequency. The SLA and LAI
indicate significant short-term differences between the treatments as it was ex-
pected, especially the SLA was highly sensitive to defoliation and identified different
levels defoliation induced plant stress. The root mass and root TNC reserves how-
ever, did not respond to defoliation in the short term, as well as the LWR, the spe-
cies composition and the tiller density.
5. Conclusions
Short-term responses of the investigated semi-arid grassland sward to defoliation
stress were positive with regard to increased aboveground biomass productivity
and N uptake. Significantly negative short-term responses were not observed for
any of the chosen parameters. This implies that the evaluated grassland ecosystem
is resistant to defoliation or grazing stress respectively, in the short-term and that
the process of grassland degradation therefore results from mid- and/or long-term
grazing stress. Furthermore it became apparent that the mean annual precipitation
and its intra-annual distribution have a substantial impact on this grassland ecosys-
tem. The presented results underline the importance to refer to degradation dynam-
ics on different time scales, that is to distinguish between short-, mid-, and long-
term effects of defoliation stress.
Plant growth analysis 39
6. References
Archer, S., Detling, J.K., 1986. Evaluation of potential herbivore mediation of plant
water status in a North American mixed-grass prairie. Oikos 47, 287-291.
Archer, S., Tieszen, L.L., 1983. Effects of simulated grazing on foliage and root
production and biomass allocation in an Arctic tundra sedge (Eriophorum
vaginatum). Oecologia 58, 92-102.
Bai, Y., Han, X., Wu, J., Chen, Z., Li, L., 2004. Ecosystem stability and compensa-
tory effects in the Inner Mongolia grassland. Nature 431, 181-184.
Barger, N.N., Ojima, D.S., Belnap, J., Wang, S.P., Wang, Y.F., Chen, Z.Z., 2004.
Changes in plant functional groups, litter quality, and soil carbon and nitrogen
mineralization with sheep grazing in an Inner Mongolian grassland. Journal of
Range Management 57, 613-619.
Bartos, D.L., Sims, P.L., 1974. Root dynamics of a shortgrass ecosystem. Journal
of Range Management 27, 33-36.
Brougham, R.W., 1956. Effect of intensity of defoliation on regrowth of pasture.
Australian Journal of Agricultural Research 7, 377-387.
Burton, G.W., Jacksson, J.E., Hart, R.H., 1963. Effects of cutting frequency and
nitrogen on yield, in vitro digestibility, and protein, fiber, and carotene content
of Coastal Bermudagrass. Agronomy Journal 55, 500-502.
Busso, C.A., Richards, J.H., 1995. Drought and clipping effects on tiller demogra-
phy and growth of two tussock grasses in Utah. Journal of Arid Environments
29, 239-251.
Buwai, M., Trlica, M.J., 1977. Defoliation effects on root weights and total non-
structural carbohydrates of Blue Grama and Western Wheatgrass. Crop Sci-
ence 17, 15-17.
Buxton, D.R., 1996. Quality-related characteristics of forages as influenced by plant
environment and agronomic factors. Animal Feed Science and Technology 59,
37-49.
Chatterton, N.J., Harrison, P.A., Thornley, W.R., Bennett, J.H., 1989: Purification
and quantification of kestoses (fructosylsucroses) by gel permeation and an-
ion exchange chromatography. Plant Physiology and Biochemistry 27, 289-
295.
Plant growth analysis 40
Chen, Y.X., Lee, P., Lee, G., Mariko, S., Oikawa, T., 2006. Simulating root re-
sponses to grazing of a Mongolian grassland ecosystem. Plant Ecology 183,
265-275.
Christensen, L., Coughenour, M.B., Ellis, J.E., Chen, Z., 2003. Sustainability of In-
ner Mongolian Grasslands: Application of the Savanna Model. Journal of
Range Management 56, 319-327.
Christiansen, S., Svejcar, T., 1988. Grazing effects on shoot and root dynamics and
above- and below-ground non-structural carbohydrate in Caucasian bluestem.
Grass and Forage Science 43, 111-119.
Coughenour, M.B., 1993. Savanna-Landscape and regional ecosystem model.
Natural Resource Ecology Laboratory. Colorado State University, Ft. Collins,
USA.
Coughenour, M.B., McNaughton, S.J., Wallace, L.L., 1985. Responses of an Afri-
can graminoid (Themeda triandra Forsk.) to frequent defoliation, nitrogen, and
water: a limit of adaptation to herbivory. Oecologia 68, 105-110.
Coughenour, M.B., Detling, J.K., Bamberg, I.E., Mugambi, M.M., 1990. Production
and nitrogen responses of the African dwarf shrub Indigofera spinosa to defo-
liation and water limitation. Oecologia 83, 546-552.
FAO, 2001. http://www.fao.org/ag/agp/agpc/doc/counprof/china/China1.htm
(04.08.2007)
Ferraro, D.O., Oesterheld, M., 2002. Effect of defoliation on grass growth. A quanti-
tative review. Oikos 98, 125-133.
Frank, D.A., McNaughton, S.J., 1993. Evidence for the promotion of aboveground
grassland production by native large herbivores in Yellowstone National Park.
Oecologia 96, 157-161.
Fulkerson, W.J., Donaghy, D.J., 2001. Plant-soluble carbohydrate reserves and
senescence - key criteria for developing an effective grazing management
system for ryegrass-based pastures: a review. Australian Journal of Experi-
mental Agriculture 41, 261-275.
Fynn, R.W.S., O'Connor, T.G., 2000. Effect of stocking rate and rainfall on range-
land dynamics and cattle performance in a semi-arid savanna, South Africa.
Journal of Applied Ecology 37, 491-507.
Plant growth analysis 41
Gao, Y.Z., 2007. Influences of different land use management on net primary pro-
ductivity and belowground carbon allocation in a semi-arid Inner Mongolia
steppe. PhD-Thesis, University Kiel.
Garnier, E., Cordonnier, P., Guillerm, J.-L., Sonié, L., 1997. Specific leaf area and
leaf nitrogen concentration in annual and perennial grass species growing in
Mediterranean old-fields. Oecologia 111, 490-498.
Georgiadis, N.J., Ruess, R.W., McNaughton, S.J., Western, D., 1989. Ecological
conditions that determine when grazing stimulates grass production. Oecolo-
gia 81, 316-322.
Green, R.A., Detling, J.K., 2000. Defoliation-induced enhancement of total above-
ground nitrogen yield of grasses. Oikos 91, 280-284.
Hart, R.H., Norton, B.E., 1988. Grazing management and vegetation response. In:
Tueller, P.T. (Ed.), Vegetation science application for rangeland analysis and
management. Kluwer, Dordrecht.
Hayes, D.C., 1985. Seasonal nitrogen translocation in Big Bluestem during drought
conditions. Journal of Range Management 38, 406-410.
Hodgkinson, K.C., Ludlow, M.M., Mott, J.J., Baruch, Z., 1989. Comparative re-
sponses of the savanna grasses Chenchrus ciliaris and Themeda triandra to
defoliation. Oecologia 79, 45-52.
Holland, E.A., Detling, J.K., 1990. Plant response to herbivory and belowground
nitrogen cycling. Ecology 71, 1040-1049.
Horn, M., Vollandt, R., 1995. Multiple Tests und Auswahlverfahren. Gustav Fischer
Verlag, Stuttgart
Hsiao, T.C., 1973. Plant responses to water stress. Annual Review of Plant Physi-
ology and Molecular Biology 24, 519-570.
Hume, D.E., 1991. Effect of cutting on production and tillering in prairie grass (Bro-
mus willdenowii Kunth) compared with two ryegrass (Lolium) species. 1.
Vegetative plants. Annals of Botany 67, 533-541.
Hunt, R., 1978. Plant Growth Analysis. Studies in Biology No. 96, Edward Arnold,
London.
IUSS Working Group WRB, 2006. World reference base for soil resources 2006.
2nd edition. World Soil Resources Reports No. 103. FAO, Rome.
Plant growth analysis 42
Jiang, Y., Meurer, M., 2001. Die Steppen Nordchinas und ihre Belastung durch
weide- und landwirtschaftliche Landnutzung. Geographische Rundschau 53,
48-52.
Jones, R.M., Jones, R.J., McDonald, C.K., 1995. Some advantages of long-term
grazing trials, with particular reference to changes in botanical composition.
Australian Journal of Experimental Agriculture 35, 1029-1038.
Knapp, A.K., Smith, M.D., 2001. Variation among biomes in temporal dynamics of
aboveground primary production. Science 291, 481-484.
Knapp, A.K., Fay, P.A., Blair, J.M., Collins, S.L., Smith, M.D., Carlisle, J.D., Harper,
C.W., Danner, B.T., Lett, M.S., McCarron, J.K., 2002. Rainfall variability, car-
bon cycling, and plant species diversity in a mesic grassland. Science 298,
2202-2205.
Lauenroth, W.K., Sala, O.E., 1992. Long-term forage production of North American
shortgrass steppe. Ecological Applications 2, 397-403.
Le Houérou, H.N., 1984. Rain use efficiency: a unifying concept in arid-land ecol-
ogy. Journal of Arid Environments 7, 213-247.
Le Houérou, H.N., Bingham, R.L., Skerbek, W., 1988. Relationship between the
variability of primary production and the variability of annual precipitation in
world arid lands. Journal of Arid Enviroments 15, 1-18.
Leriche, H., Le Roux, X., Desnoyers, F., Benest, D., Simioni, G., Abbadie, L., 2003.
Grass response to clipping in an African savanna: testing the grazing optimi-
zation hypothesis. Ecological Applications 13, 1346-1354.
Li, Y.H., 1989. Impact of grazing on Aneurolepidium chinense steppe and Stipa
grandis steppe. Acta Oecologica/Oecologia Applicata 10, 31-46.
Liu, Z.L., Wang, W., Liang, C.Z., Hao, D.Y., 1998. The regressive succession pat-
tern and its diagnostic of Inner Mongolia steppe in sustained and super-strong
grazing. Acta Agrestia Sinica 6, 244-251. (in Chinese, with English abstract)
Loeser, M.R., Crews, T.E., Sisk, T.D., 2004. Defoliation increased above-ground
productivity in a semi-arid grassland. Rangeland Ecology and Management
57, 442-447.
Lorenz, R.J., Rogler, G.A., 1967. Grazing and fertilisation affect root development
of range grasses. Journal of Range Management 20, 129-132.
May, L.H., 1960. The utilization of carbohydrate reserves in pasture plants after
defoliation. Herbage Abstracts 30, 239-245.
Plant growth analysis 43
McIlroy, R.J., 1967. Carbohydrates of grassland herbage. Herbage Abstracts 37,
79-87.
McNaughton, S.J., 1983. Compensatory plant growth as a response to herbivory.
Oikos 40, 329-336.
Menke, J.W., Trlica, M.J., 1983. Effects of single and sequential defoliations on the
carbohydrate reserves of four range species. Journal of Range Management
36, 70-74.
Milchunas, D.G., Lauenroth, W.K., 1993. Quantitative effects of grazing on vegeta-
tion and soils over a global range of environments. Ecological Monographs 63,
327-366.
Minson, D.J., 1990. Forage in ruminant nutrition. Academic Press, Inc., San Diego.
Mitchell, R.B., Moser, L.E., Moore, K.J., Redfearn, D.D., 1998. Tiller demographics
and leaf area index of four perennial pasture grasses. Agronomy Journal 90,
47-53.
Moritz, R., 1988. Wirkungen der Nutzungshäufigkeit auf den Reservekohlenhydrat-
Haushalt von Festuca pratensis Huds. bei variierter N-Düngung. PhD-Thesis,
University Hohenheim.
Noy-Meir, I., 1973. Desert ecosystems: environment and producers. Annual Review
of Ecology and Systematics 4, 25-51.
Noy-Meir, I., 1993. Compensating growth of grazed plants and its relevance to the
use of rangelands. Ecological Applications 3, 32-34.
O'Connor, T.G., Haines, L.M., Snyman, H.A., 2001. Influence of precipitation and
species composition on phytomass of s semi-arid African grassland. Journal
of Ecology 89, 850-860.
Parsons, A.J., Chapman, D.F., 2000. The principles of pasture growth and utiliza-
tion. In: Hopkins, A. (Ed.), Grass – Its production and utilization, 3rd edition,
Blackwell Science, UK.
Pollock, C.J., Cairns, A.J., 1991. Fructan metabolism in grasses and cereals. An-
nual Review of Plant Physiology and Molecular Biology 42, 77-101.
Ruess, R.W., 1988. The interaction of defoliation and nutrient uptake in Sporobolus
kentrophyllus, a short-grass species from the Serengeti Plains. Oecologia 77,
550-556.
Plant growth analysis 44
Shiomi, N., Onodera, S., Chatterton, N.J., Harrison, P.A., 1991. Separation of fruc-
tooligosaccharide isomers by anion-exchange chromatography. Agricultural
and Biological Chemistry 55, 1427-1428.
Sneath, D., 1998. State policy and pasture degradation in Inner Asia. Science 281,
1147-1148.
Steen, E., Larsson, K., 1986. Carbohydrates in roots and rhizomes of perennial
grasses. New Phytologist 104, 339-346.
‘t Mannetje, L., 2000. Measuring biomass of grassland vegetation. In: ‘t Mannetje,
L., Jones, R.M. (Eds.), Field and laboratory methods for grassland and animal
production research. Cabi Publishing, Wallingford.
Tong, C., Wu, J., Yong, S., Yang, J., Yong, W., 2004. A landscape-scale assess-
ment of steppe degradation in the Xilin River Basin, Inner Mongolia, China.
Journal of Arid Environments 59, 133-149.
Turner, C.L., Seastedt, T.R., Dyer, M.I., 1993. Maximisation of aboveground grass-
land production: the role of defoliation frequency, intensity, and history. Eco-
logical Applications 3, 175-186.
Turner, K.E., Belesky, D.P., Fedders, J.M., Rayburn, E.B., 1996. Canopy manage-
ment influences on cool-season grass quality and simulated livestock per-
formance. Agronomy Journal 88, 199-205.
Van Man, N., Wiktorsson, H., 2003. Forage yield, nutritive value, feed intake and
digestibility of three grass species as affected by harvest frequency. Tropical
Grasslands 37, 101-110.
Verburg, P.H., Van Keulen, H., 1999. Exploring changes in the spatial distribution
of livestock in China. Agricultural Systems 62, 51-67.
Wang, R.Z., Ripley, E.A., 1997. Effects of grazing on a Leymus chinensis grassland
on the Songnen plain of north-eastern China. Journal of Arid Environments 36,
307-318.
Wang, R.Z., Gao, Y.Z., 2003. Climate-driven changes in shoot density and shoot
biomass in Leymus chinensis (Poacae) on the North-east China Transect
(NECT). Global Ecology and Biogeography 12, 249-259.
Wang, S., Li, Y., Chen, Z., 1999. The optimal stocking rate on grazing systems in
Inner Mongolia steppe. 1. Based on relationship between stocking rate and
aboveground net primary productivity. Acta Agrestia Sinica 7, 192-197. (in
Chinese, with English abstract)
Plant growth analysis 45
Wang, Y.S., 1992. Vegetation dynamics of grazing succession in the Stipa bai-
calensis steppe in Northeastern China. Vegetatio 98, 83-95.
Wang, Y.S., Shiyomi, M., Tsuiki, M., Tsutsumi, M., Yu, X.R., Yi, R.H., 2002. Spatial
heterogeneity of vegetation under different grazing intensities in the North-
west Heilongjiang steppe of China. Agriculture, Ecosystems and Environment
90, 217-229.
Ward, C.Y., Blaser, R.E., 1961. Carbohydrate food reserves and leaf area in re-
growth of orchardgrass. Crop Science 1, 366-370.
Weaver, J.E., 1950. Effects of different intensities of grazing on depth and quantity
of roots of grasses. Journal of Range Management 3, 100-113.
Weinmann, H., 1948. Underground development and reserves of grasses. A review.
Journal of the British Grassland Society 3, 115-140.
Werger, M.J.A., 1983. Wurzel/Spross-Verhältnis als Merkmal der Pflanzendstrate-
gie. In: Böhm W., Kutschera L., Lichtenegger E. (Eds.), Wurzelökologie und
ihre Nutzanwendung. Bundesanstalt für alpenländische Landwirtschaft, Gum-
penstein, Irdning.
White, L.M., 1973. Carbohydrate reserves of grasses: a review. Journal of Range
Management 26, 13-18.
Xiao, X.M., Wang, Y.F., Jiang, S., Ojima, D.S., Bonham, C.D., 1995. Interannual
variation in the climate and above-ground biomass of Leymus chinensis
steppe and Stipa grandis steppe in the Xilin River basin, Inner Mongolia,
China. Journal of Arid Environments 31, 283-299.
Xiao, X.M., Jiang, S., Wang, Y.F., Ojima, D.S., Bonham, C.D., 1996. Temporal
variation in aboveground biomass of Leymus chinensis steppe from species
to community levels in the Xilin River Basin, Inner Mongolia, China. Vegetatio
123, 1-12.
Xie, Y.Z., Wittig, R., 2003. Growth parameters of characteristic species of Stipa
steppes in Northern China as indicators of the grazing intensity. Journal of
Applied Botany 77, 68-74.
Yi, R.H., Hayashi, I., Nakamura, T., Shiyomi, M., 2004. Relationship between bo-
tanical composition and grazing intensities in Xilingoule grasslands, Inner
Mongolia. Ecologic Science 23, 12-15.

Plant growth analysis 46
Yu, M., Ellis, J.E., Epstein, H.E., 2004. Regional analysis of climate, primary pro-
duction, and livestock density in Inner Mongolia. Journal of Environmental
Quality 33, 1675-1681.
Zhang, T.H., Zhao, H.L., Li, S.G., Zhou, R.L., 2004. Grassland changes under graz-
ing stress in Horqin sandy grassland in Inner Mongolia, China. New Zealand
Journal of Agricultural Research 47, 307-312.
Zhao, H.L., Zhao, X.Y., Zhou, R.L., Zhang, T.H., Drake, S., 2005. Desertification
process due to heavy grazing in sandy rangeland, Inner Mongolia. Journal of
Arid Environments 62, 309-319.
Zhou, G., Wang, Y., Wang, S., 2002. Responses of grassland ecosystems to pre-
cipitation and land use along the Northeast China Transect. Journal of Vege-
tation Science 13, 361-368.
Chapter 3
Short-term responses to defoliation stress of a semi-arid grass-
land sward in Inner Mongolia, China.
2. Herbage quality
Herbage quality 48
Abstract
Grassland degradation due to overgrazing is the major ecological and socio-
economical problem in the Inner Mongolia steppes, P.R. China. Degradation and its
consequences have often been described retrospective, but almost no information
is available about short-term effects of intensive grazing. To completely understand
the degradation process such information is crucial and the aim of the present
study is to assess short-term responses of the steppe grassland through herbage
quality parameters, when it is subjected to defoliation stress.
A cutting-frequency experiment, based on a randomized block design, was carried
out in the natural grasslands of the Xilin River Basin, Inner Mongolia, comparing
low (T I), moderate (T II) and high (T III) defoliation frequency. Over the vegetation
periods of 2004 and 2005 herbage samples of the total green biomass and the two
dominant species Stipa grandis and Leymus chinensis were consecutively taken
and analysed by means of NIRS for crude protein (CP), cell wall content and com-
position, in vitro digestibility (IVDOM) and total non-structural carbohydrates (TNC).
The CP content increased significantly due to frequent defoliation in T II and T III
from on average 100 to 150 g kg-1 DM in 2004 and 90 to 130 g kg-1 DM in 2005.
The cell wall content was generally high in the sampled herbage, reaching 700 g
NDF kg-1 DM already in the early growing season in all sward constituents. The cell
wall content and its composition did not significantly respond to frequent defoliation,
especially in 2005. The IVDOM of the herbage is generally low, ranging between
610 g kg-1 OM in L. chinensis in 2004 and 514 g kg-1 OM in S. grandis in 2005.
Frequent defoliation caused an average increase in IVDOM of only 30 g kg-1 OM in
T II and T III in 2004, but in 2005 no responses of IVDOM were observed. The TNC
content decreased after frequent defoliation in 2004 in all sward constituents, but in
2005 the differences were not significant. The results demonstrated that the herb-
age quality parameters were highly susceptible to differences in precipitation rate,
as in 2005 none of the herbage quality parameters, except the CP content, re-
sponded significantly and consistently to frequent defoliation.
It can be concluded that short-term effects of frequent defoliation can be quantified
by the CP content, while the cell wall content and IVDOM did not show distinct re-
sponses to defoliation. The TNC content showed significant short-term effects, but
was highly susceptible to climatic and seasonal fluctuations which covered defolia-
tion-induced effects. The influence of climatic fluctuations, especially precipitation
Herbage quality 49
rate, plays a key role in the steppe ecosystem and does also substantially affect the
herbage quality.
1. Introduction
Native grasslands cover about 70% of the territory of the Inner Mongolia autono-
mous region in P.R. China (FAO, 2001). About one third has been already heavily
degraded (Sneath, 1998; Zhou et al., 2002). Livestock numbers increased tenfold
in the last 60 years, what entailed overgrazing of the steppe grasslands (Jiang and
Meurer, 2001). Attributes of steppe degradation are decreasing grassland produc-
tivity, resulting in reduced economical return from livestock husbandry and ecologi-
cal consequences like wind and water erosion that cause substantial loss of soil
and nutrients from the grassland ecosystem. Management strategies are urgently
needed to avoid irreversible degradation of the steppe grassland and supply ade-
quate amounts of good quality feed for the grazing animals, to enable local farmers
to subsist themselves by livestock production (Zhou et al., 2002, Tong et al., 2004).
Several studies have been conducted in the Inner Mongolia grassland, mainly con-
centrated on long-term ecological interrelations within the grassland ecosystem (Li,
1989; Xiao et al., 1996; Wang and Ripley, 1997; Bai et al., 2004; Yu et al., 2004).
Only a few studies have examined the degradation process in its formation and
development, rather than from a retrospective point of view (Wang et al., 1999;
Zhang et al., 2004; Zhao et al., 2005). However, the comprehension of the degra-
dation processes resulting from overgrazing is essential to develop adequate man-
agement strategies for sustainable agriculture in this grassland ecosystem, includ-
ing information about short-term effects of defoliation stress. The aim of the present
study is to evaluate such short-term responses to defoliation stress in a semi-arid
grassland sward in Inner Mongolia. Parameters of classical growth analysis were
used in chapter 2 to identify short-term effects of defoliation, which will be com-
pleted in the current chapter by evaluating herbage quality parameters for short-
term responses to defoliation stress.
In the short term herbage quality is mainly influenced by the maturation process
grass plants undergo during the vegetation period (Minson, 1990; Buxton, 1996). In
the long term herbage quality may change when the species composition of a
grassland sward is changing. The maturation process is directly influenced by the
environmental factors light, temperature and precipitation. These environmental
factors can vary from year to year (Buxton and Fales, 1994), however the mean
Herbage quality 50
annual precipitation and its distribution is probably the most important one in semi-
arid grassland ecosystems. Herbage utilisation by grazing or cutting retards the
maturation process, so that the quality of the re-growth differs from the quality of
mature grasses that undergo reproductive tillering. Hence, it can be expected that
herbage quality parameters will respond directly to defoliation stress, in other words
defoliation affects herbage quality in the short-term.
In literature, the quality of herbages is commonly described by crude protein (CP)
content and in vitro digestibility (IVDOM). However other plant components like cell
wall content and its composition, or the content of total non-structural carbohy-
drates (TNC) are also valuable parameters in describing herbage quality for grazing
ruminants.
The objective of the present investigation is to describe short-term responses to
different defoliation frequencies on community and plant level through the above
mentioned herbage quality parameters. To achieve this objective a cutting-
frequency experiment was carried out in 2004 and 2005 in the typical steppe area
of the Xilin River Basin, Inner Mongolia. The natural grassland sward was sub-
jected to 3 different cutting frequencies: low, moderate and high defoliation intensity.
Herbage quality was determined over the vegetation periods for the total green
biomass, and separately for the two dominant species Stipa grandis and Leymus
chinensis, which account together for approx. two thirds of the total aboveground
biomass in the present study.
2. Material and Methods
2.1 Study area, experimental design and herbage sampling
Detailed information about the field experiment has been reported in chapter 2 of
this thesis. Briefly, the present study was carried out within the sino-german
MAGIM-project (Matter fluxes of grasslands in Inner Mongolia as influenced by
stocking rate). A cutting-frequency experiment was conducted near the Inner Mon-
golia Ecosystem Research Station (IMGERS), Chinese Academy of Sciences. The
climate is semi-arid, characterised by significant seasonal and inter-annual variabil-
ity (table 1). The vegetation is dominated by the perennial bunchgrass Stipa gran-
dis P. Smirn. and the perennial rhizomatous Leymus chinensis (Trin.) Tsvelev, both
grasses belong to the C3 photosynthesis type. This vegetation type can be consid-
ered as representative for large parts of the Xilin River Basin (Bai et al., 2004).
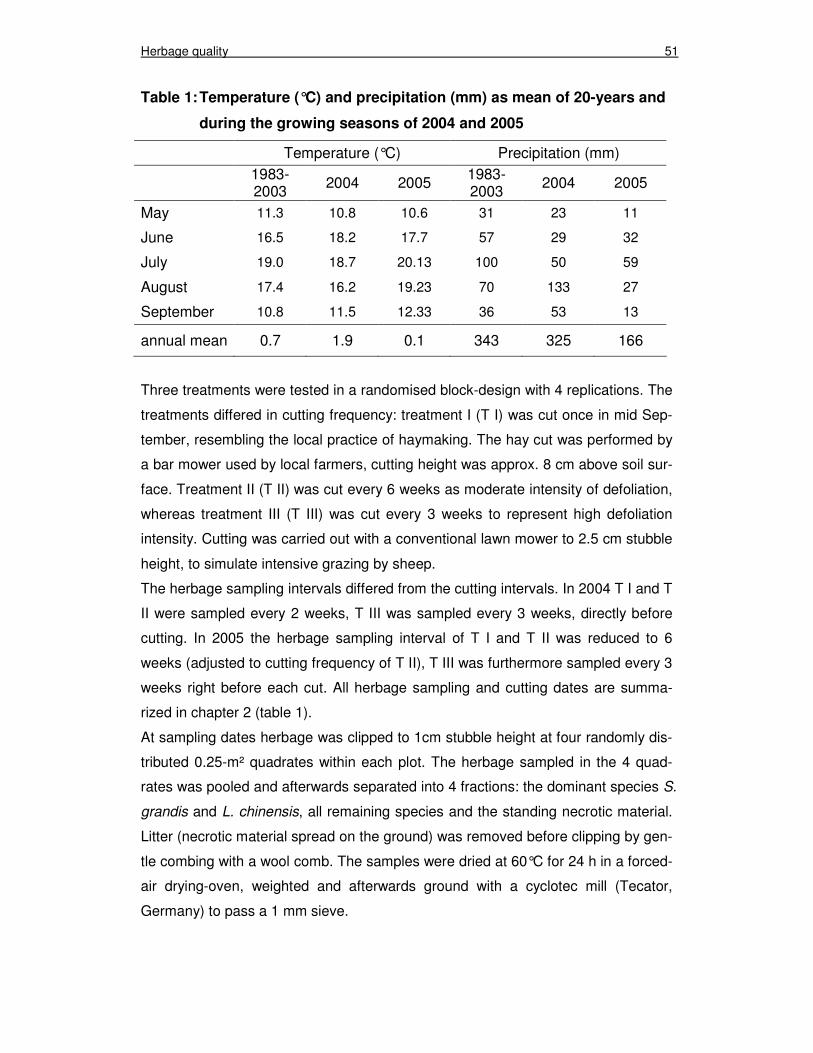
Herbage quality 51
Table 1: Temperature (°C) and precipitation (mm) as mean of 20-years and
during the growing seasons of 2004 and 2005
Temperature (°C) Precipitation (mm)
1983-2003
2004 2005 1983-2003
2004 2005
May 11.3 10.8 10.6 31 23 11
June 16.5 18.2 17.7 57 29 32
July 19.0 18.7 20.13 100 50 59
August 17.4 16.2 19.23 70 133 27
September 10.8 11.5 12.33 36 53 13
annual mean 0.7 1.9 0.1 343 325 166
Three treatments were tested in a randomised block-design with 4 replications. The
treatments differed in cutting frequency: treatment I (T I) was cut once in mid Sep-
tember, resembling the local practice of haymaking. The hay cut was performed by
a bar mower used by local farmers, cutting height was approx. 8 cm above soil sur-
face. Treatment II (T II) was cut every 6 weeks as moderate intensity of defoliation,
whereas treatment III (T III) was cut every 3 weeks to represent high defoliation
intensity. Cutting was carried out with a conventional lawn mower to 2.5 cm stubble
height, to simulate intensive grazing by sheep.
The herbage sampling intervals differed from the cutting intervals. In 2004 T I and T
II were sampled every 2 weeks, T III was sampled every 3 weeks, directly before
cutting. In 2005 the herbage sampling interval of T I and T II was reduced to 6
weeks (adjusted to cutting frequency of T II), T III was furthermore sampled every 3
weeks right before each cut. All herbage sampling and cutting dates are summa-
rized in chapter 2 (table 1).
At sampling dates herbage was clipped to 1cm stubble height at four randomly dis-
tributed 0.25-m² quadrates within each plot. The herbage sampled in the 4 quad-
rates was pooled and afterwards separated into 4 fractions: the dominant species S.
grandis and L. chinensis, all remaining species and the standing necrotic material.
Litter (necrotic material spread on the ground) was removed before clipping by gen-
tle combing with a wool comb. The samples were dried at 60°C for 24 h in a forced-
air drying-oven, weighted and afterwards ground with a cyclotec mill (Tecator,
Germany) to pass a 1 mm sieve.
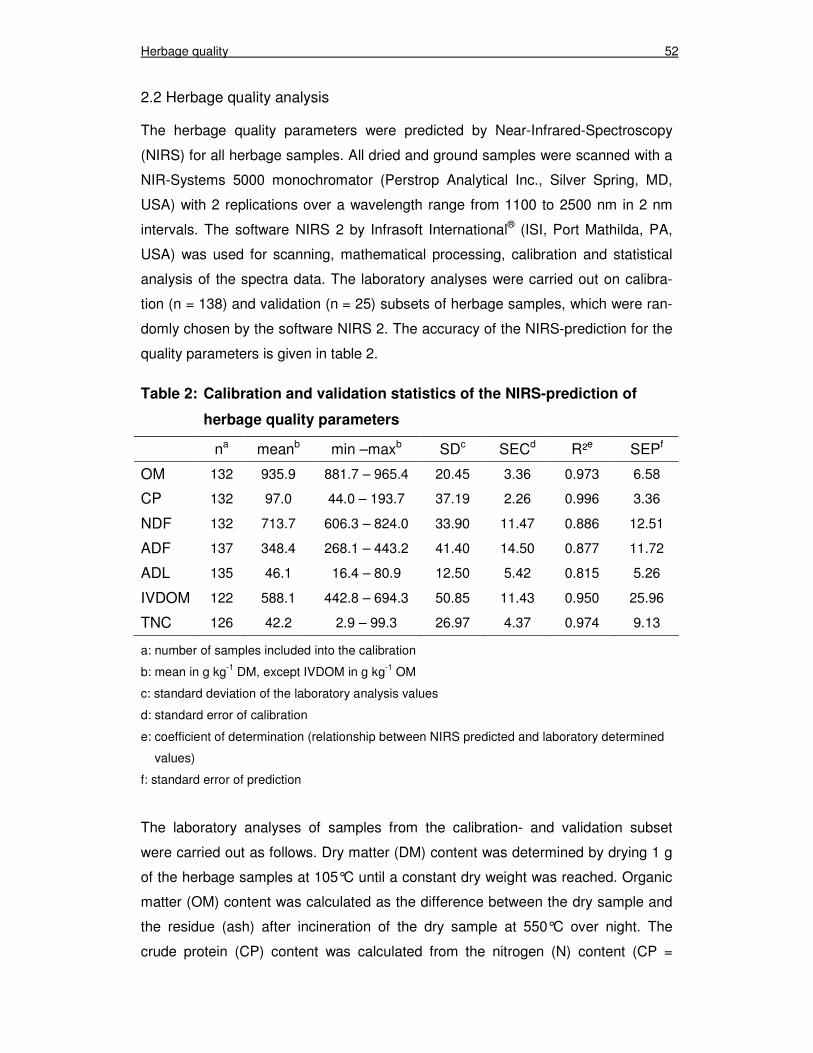
Herbage quality 52
2.2 Herbage quality analysis
The herbage quality parameters were predicted by Near-Infrared-Spectroscopy
(NIRS) for all herbage samples. All dried and ground samples were scanned with a
NIR-Systems 5000 monochromator (Perstrop Analytical Inc., Silver Spring, MD,
USA) with 2 replications over a wavelength range from 1100 to 2500 nm in 2 nm
intervals. The software NIRS 2 by Infrasoft International® (ISI, Port Mathilda, PA,
USA) was used for scanning, mathematical processing, calibration and statistical
analysis of the spectra data. The laboratory analyses were carried out on calibra-
tion (n = 138) and validation (n = 25) subsets of herbage samples, which were ran-
domly chosen by the software NIRS 2. The accuracy of the NIRS-prediction for the
quality parameters is given in table 2.
Table 2: Calibration and validation statistics of the NIRS-prediction of
herbage quality parameters
na meanb min –maxb SDc SECd R²e SEPf
OM 132 935.9 881.7 – 965.4 20.45 3.36 0.973 6.58
CP 132 97.0 44.0 – 193.7 37.19 2.26 0.996 3.36
NDF 132 713.7 606.3 – 824.0 33.90 11.47 0.886 12.51
ADF 137 348.4 268.1 – 443.2 41.40 14.50 0.877 11.72
ADL 135 46.1 16.4 – 80.9 12.50 5.42 0.815 5.26
IVDOM 122 588.1 442.8 – 694.3 50.85 11.43 0.950 25.96
TNC 126 42.2 2.9 – 99.3 26.97 4.37 0.974 9.13
a: number of samples included into the calibration
b: mean in g kg-1 DM, except IVDOM in g kg-1 OM
c: standard deviation of the laboratory analysis values
d: standard error of calibration
e: coefficient of determination (relationship between NIRS predicted and laboratory determined
values)
f: standard error of prediction
The laboratory analyses of samples from the calibration- and validation subset
were carried out as follows. Dry matter (DM) content was determined by drying 1 g
of the herbage samples at 105°C until a constant dry weight was reached. Organic
matter (OM) content was calculated as the difference between the dry sample and
the residue (ash) after incineration of the dry sample at 550°C over night. The
crude protein (CP) content was calculated from the nitrogen (N) content (CP =
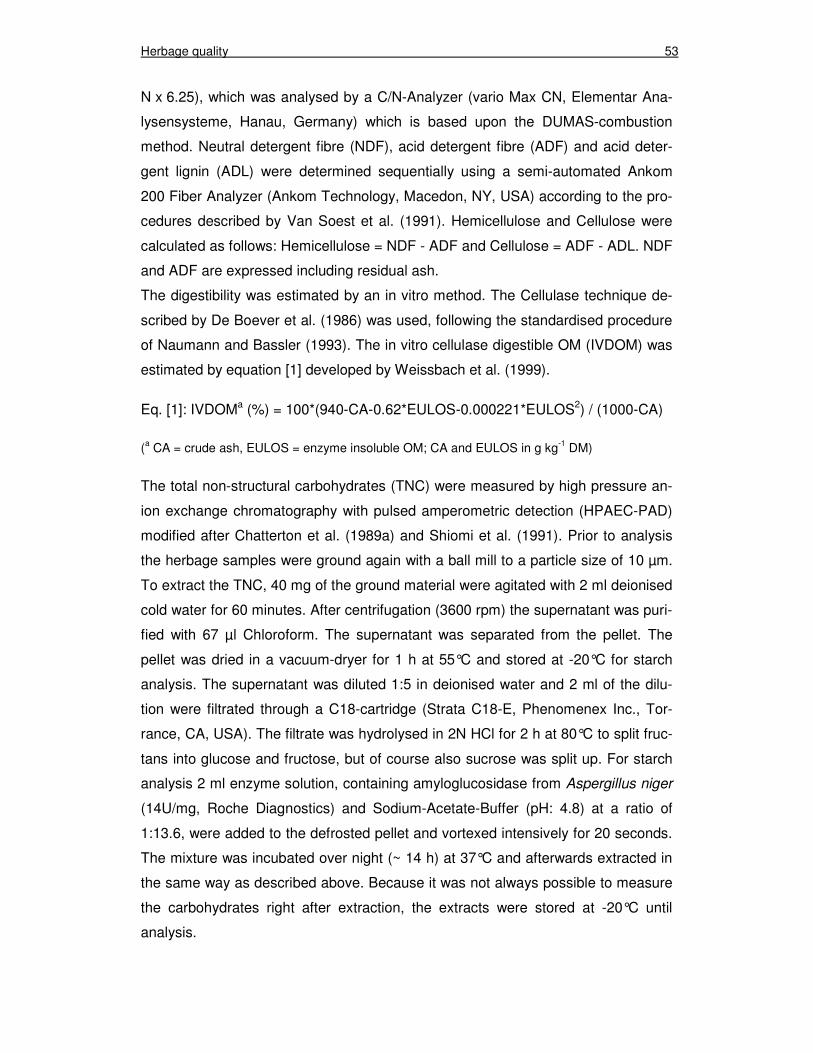
Herbage quality 53
N x 6.25), which was analysed by a C/N-Analyzer (vario Max CN, Elementar Ana-
lysensysteme, Hanau, Germany) which is based upon the DUMAS-combustion
method. Neutral detergent fibre (NDF), acid detergent fibre (ADF) and acid deter-
gent lignin (ADL) were determined sequentially using a semi-automated Ankom
200 Fiber Analyzer (Ankom Technology, Macedon, NY, USA) according to the pro-
cedures described by Van Soest et al. (1991). Hemicellulose and Cellulose were
calculated as follows: Hemicellulose = NDF - ADF and Cellulose = ADF - ADL. NDF
and ADF are expressed including residual ash.
The digestibility was estimated by an in vitro method. The Cellulase technique de-
scribed by De Boever et al. (1986) was used, following the standardised procedure
of Naumann and Bassler (1993). The in vitro cellulase digestible OM (IVDOM) was
estimated by equation [1] developed by Weissbach et al. (1999).
Eq. [1]: IVDOMa (%) = 100*(940-CA-0.62*EULOS-0.000221*EULOS2) / (1000-CA)
(a CA = crude ash, EULOS = enzyme insoluble OM; CA and EULOS in g kg-1 DM)
The total non-structural carbohydrates (TNC) were measured by high pressure an-
ion exchange chromatography with pulsed amperometric detection (HPAEC-PAD)
modified after Chatterton et al. (1989a) and Shiomi et al. (1991). Prior to analysis
the herbage samples were ground again with a ball mill to a particle size of 10 µm.
To extract the TNC, 40 mg of the ground material were agitated with 2 ml deionised
cold water for 60 minutes. After centrifugation (3600 rpm) the supernatant was puri-
fied with 67 µl Chloroform. The supernatant was separated from the pellet. The
pellet was dried in a vacuum-dryer for 1 h at 55°C and stored at -20°C for starch
analysis. The supernatant was diluted 1:5 in deionised water and 2 ml of the dilu-
tion were filtrated through a C18-cartridge (Strata C18-E, Phenomenex Inc., Tor-
rance, CA, USA). The filtrate was hydrolysed in 2N HCl for 2 h at 80°C to split fruc-
tans into glucose and fructose, but of course also sucrose was split up. For starch
analysis 2 ml enzyme solution, containing amyloglucosidase from Aspergillus niger
(14U/mg, Roche Diagnostics) and Sodium-Acetate-Buffer (pH: 4.8) at a ratio of
1:13.6, were added to the defrosted pellet and vortexed intensively for 20 seconds.
The mixture was incubated over night (~ 14 h) at 37°C and afterwards extracted in
the same way as described above. Because it was not always possible to measure
the carbohydrates right after extraction, the extracts were stored at -20°C until
analysis.
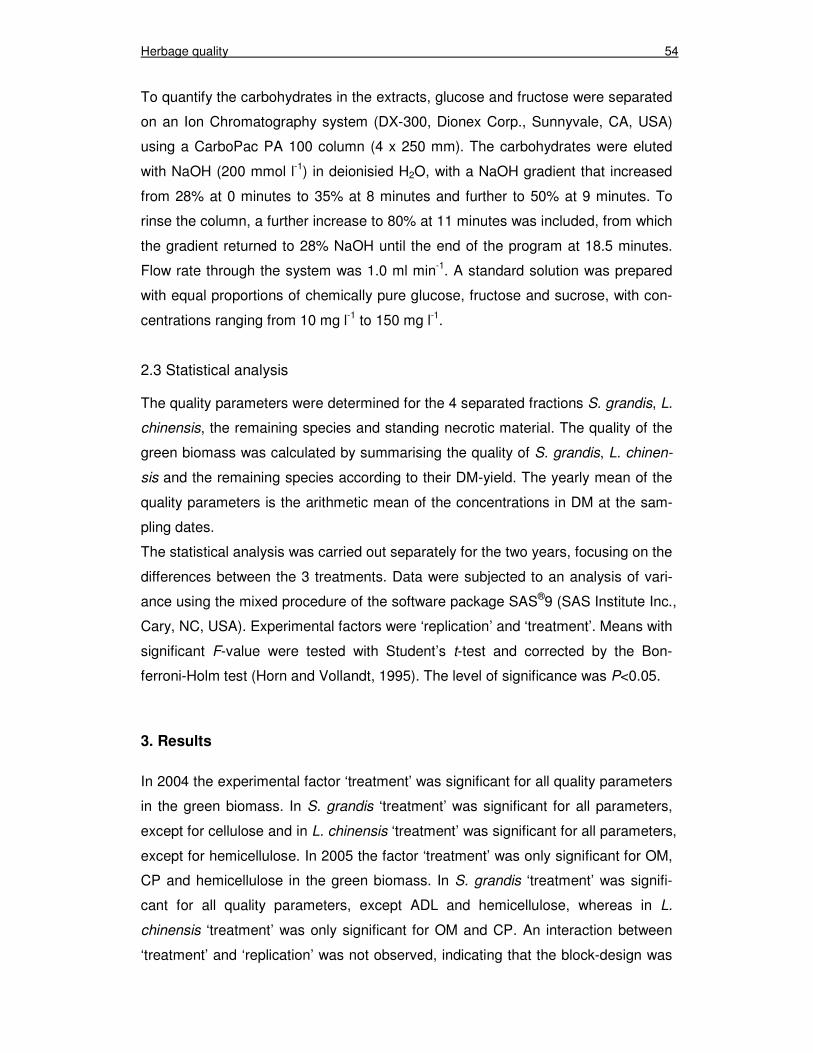
Herbage quality 54
To quantify the carbohydrates in the extracts, glucose and fructose were separated
on an Ion Chromatography system (DX-300, Dionex Corp., Sunnyvale, CA, USA)
using a CarboPac PA 100 column (4 x 250 mm). The carbohydrates were eluted
with NaOH (200 mmol l-1) in deionisied H2O, with a NaOH gradient that increased
from 28% at 0 minutes to 35% at 8 minutes and further to 50% at 9 minutes. To
rinse the column, a further increase to 80% at 11 minutes was included, from which
the gradient returned to 28% NaOH until the end of the program at 18.5 minutes.
Flow rate through the system was 1.0 ml min-1. A standard solution was prepared
with equal proportions of chemically pure glucose, fructose and sucrose, with con-
centrations ranging from 10 mg l-1 to 150 mg l-1.
2.3 Statistical analysis
The quality parameters were determined for the 4 separated fractions S. grandis, L.
chinensis, the remaining species and standing necrotic material. The quality of the
green biomass was calculated by summarising the quality of S. grandis, L. chinen-
sis and the remaining species according to their DM-yield. The yearly mean of the
quality parameters is the arithmetic mean of the concentrations in DM at the sam-
pling dates.
The statistical analysis was carried out separately for the two years, focusing on the
differences between the 3 treatments. Data were subjected to an analysis of vari-
ance using the mixed procedure of the software package SAS®9 (SAS Institute Inc.,
Cary, NC, USA). Experimental factors were ‘replication’ and ‘treatment’. Means with
significant F-value were tested with Student’s t-test and corrected by the Bon-
ferroni-Holm test (Horn and Vollandt, 1995). The level of significance was P<0.05.
3. Results
In 2004 the experimental factor ‘treatment’ was significant for all quality parameters
in the green biomass. In S. grandis ‘treatment’ was significant for all parameters,
except for cellulose and in L. chinensis ‘treatment’ was significant for all parameters,
except for hemicellulose. In 2005 the factor ‘treatment’ was only significant for OM,
CP and hemicellulose in the green biomass. In S. grandis ‘treatment’ was signifi-
cant for all quality parameters, except ADL and hemicellulose, whereas in L.
chinensis ‘treatment’ was only significant for OM and CP. An interaction between
‘treatment’ and ‘replication’ was not observed, indicating that the block-design was

Herbage quality 55
well defined. The quality of the green biomass and the species S. grandis and L.
chinensis is described by mean values of the quality parameters for 2004 in table 3
and 2005 in table 4.
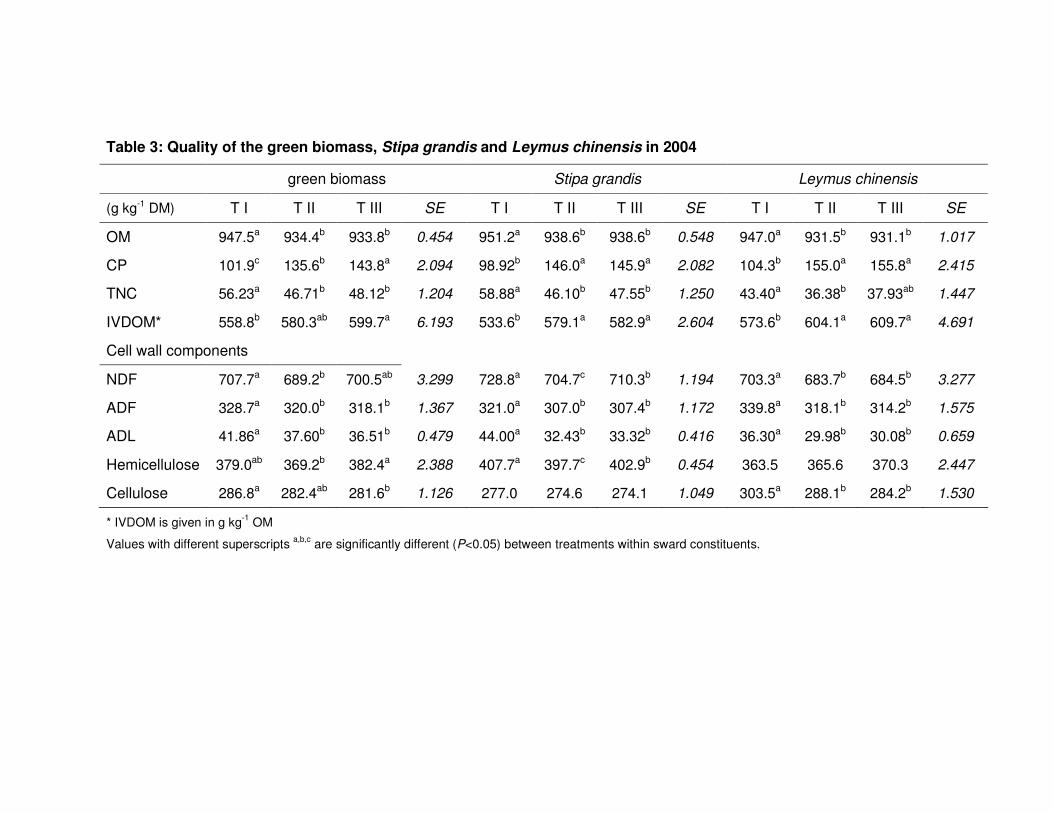
Table 3: Quality of the green biomass, Stipa grandis and Leymus chinensis in 2004
green biomass Stipa grandis Leymus chinensis
(g kg-1 DM) T I T II T III SE T I T II T III SE T I T II T III SE
OM 947.5a 934.4b 933.8b 0.454 951.2a 938.6b 938.6b 0.548 947.0a 931.5b 931.1b 1.017
CP 101.9c 135.6b 143.8a 2.094 98.92b 146.0a 145.9a 2.082 104.3b 155.0a 155.8a 2.415
TNC 56.23a 46.71b 48.12b 1.204 58.88a 46.10b 47.55b 1.250 43.40a 36.38b 37.93ab 1.447
IVDOM* 558.8b 580.3ab 599.7a 6.193 533.6b 579.1a 582.9a 2.604 573.6b 604.1a 609.7a 4.691
Cell wall components
NDF 707.7a 689.2b 700.5ab 3.299 728.8a 704.7c 710.3b 1.194 703.3a 683.7b 684.5b 3.277
ADF 328.7a 320.0b 318.1b 1.367 321.0a 307.0b 307.4b 1.172 339.8a 318.1b 314.2b 1.575
ADL 41.86a 37.60b 36.51b 0.479 44.00a 32.43b 33.32b 0.416 36.30a 29.98b 30.08b 0.659
Hemicellulose 379.0ab 369.2b 382.4a 2.388 407.7a 397.7c 402.9b 0.454 363.5 365.6 370.3 2.447
Cellulose 286.8a 282.4ab 281.6b 1.126 277.0 274.6 274.1 1.049 303.5a 288.1b 284.2b 1.530
* IVDOM is given in g kg-1 OM
Values with different superscripts a,b,c are significantly different (P<0.05) between treatments within sward constituents.
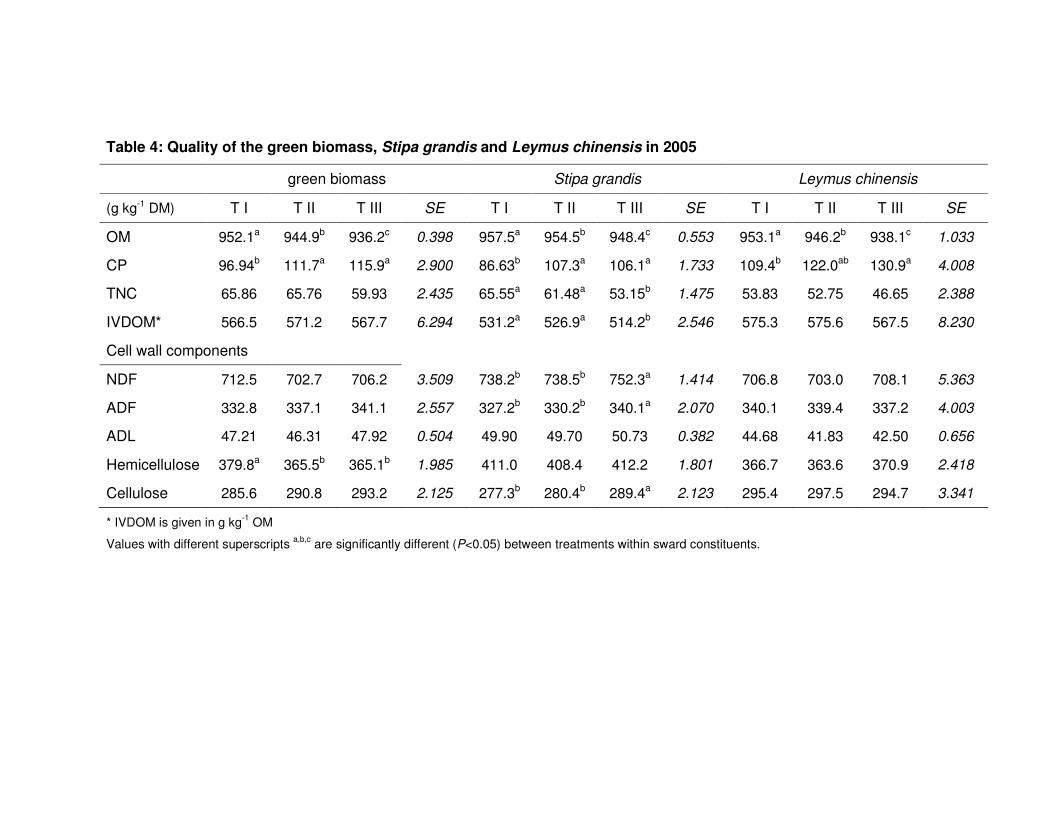
Table 4: Quality of the green biomass, Stipa grandis and Leymus chinensis in 2005
green biomass Stipa grandis Leymus chinensis
(g kg-1 DM) T I T II T III SE T I T II T III SE T I T II T III SE
OM 952.1a 944.9b 936.2c 0.398 957.5a 954.5b 948.4c 0.553 953.1a 946.2b 938.1c 1.033
CP 96.94b 111.7a 115.9a 2.900 86.63b 107.3a 106.1a 1.733 109.4b 122.0ab 130.9a 4.008
TNC 65.86 65.76 59.93 2.435 65.55a 61.48a 53.15b 1.475 53.83 52.75 46.65 2.388
IVDOM* 566.5 571.2 567.7 6.294 531.2a 526.9a 514.2b 2.546 575.3 575.6 567.5 8.230
Cell wall components
NDF 712.5 702.7 706.2 3.509 738.2b 738.5b 752.3a 1.414 706.8 703.0 708.1 5.363
ADF 332.8 337.1 341.1 2.557 327.2b 330.2b 340.1a 2.070 340.1 339.4 337.2 4.003
ADL 47.21 46.31 47.92 0.504 49.90 49.70 50.73 0.382 44.68 41.83 42.50 0.656
Hemicellulose 379.8a 365.5b 365.1b 1.985 411.0 408.4 412.2 1.801 366.7 363.6 370.9 2.418
Cellulose 285.6 290.8 293.2 2.125 277.3b 280.4b 289.4a 2.123 295.4 297.5 294.7 3.341
* IVDOM is given in g kg-1 OM
Values with different superscripts a,b,c are significantly different (P<0.05) between treatments within sward constituents.
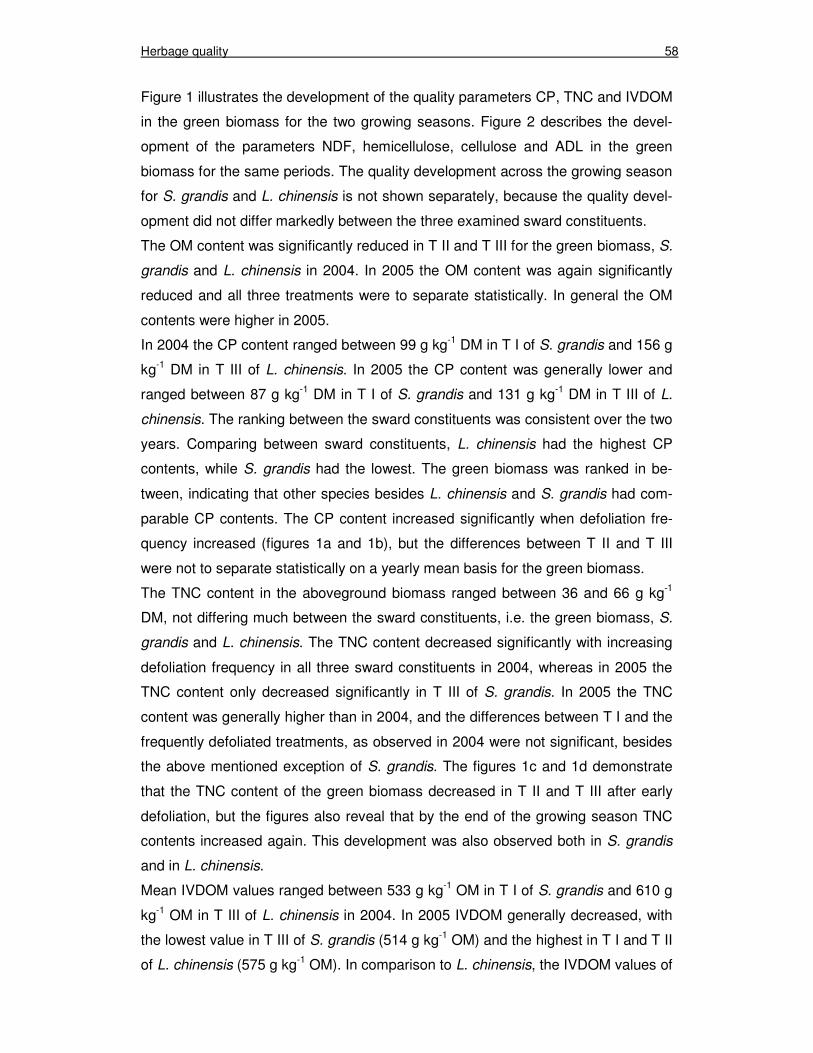
Herbage quality 58
Figure 1 illustrates the development of the quality parameters CP, TNC and IVDOM
in the green biomass for the two growing seasons. Figure 2 describes the devel-
opment of the parameters NDF, hemicellulose, cellulose and ADL in the green
biomass for the same periods. The quality development across the growing season
for S. grandis and L. chinensis is not shown separately, because the quality devel-
opment did not differ markedly between the three examined sward constituents.
The OM content was significantly reduced in T II and T III for the green biomass, S.
grandis and L. chinensis in 2004. In 2005 the OM content was again significantly
reduced and all three treatments were to separate statistically. In general the OM
contents were higher in 2005.
In 2004 the CP content ranged between 99 g kg-1 DM in T I of S. grandis and 156 g
kg-1 DM in T III of L. chinensis. In 2005 the CP content was generally lower and
ranged between 87 g kg-1 DM in T I of S. grandis and 131 g kg-1 DM in T III of L.
chinensis. The ranking between the sward constituents was consistent over the two
years. Comparing between sward constituents, L. chinensis had the highest CP
contents, while S. grandis had the lowest. The green biomass was ranked in be-
tween, indicating that other species besides L. chinensis and S. grandis had com-
parable CP contents. The CP content increased significantly when defoliation fre-
quency increased (figures 1a and 1b), but the differences between T II and T III
were not to separate statistically on a yearly mean basis for the green biomass.
The TNC content in the aboveground biomass ranged between 36 and 66 g kg-1
DM, not differing much between the sward constituents, i.e. the green biomass, S.
grandis and L. chinensis. The TNC content decreased significantly with increasing
defoliation frequency in all three sward constituents in 2004, whereas in 2005 the
TNC content only decreased significantly in T III of S. grandis. In 2005 the TNC
content was generally higher than in 2004, and the differences between T I and the
frequently defoliated treatments, as observed in 2004 were not significant, besides
the above mentioned exception of S. grandis. The figures 1c and 1d demonstrate
that the TNC content of the green biomass decreased in T II and T III after early
defoliation, but the figures also reveal that by the end of the growing season TNC
contents increased again. This development was also observed both in S. grandis
and in L. chinensis.
Mean IVDOM values ranged between 533 g kg-1 OM in T I of S. grandis and 610 g
kg-1 OM in T III of L. chinensis in 2004. In 2005 IVDOM generally decreased, with
the lowest value in T III of S. grandis (514 g kg-1 OM) and the highest in T I and T II
of L. chinensis (575 g kg-1 OM). In comparison to L. chinensis, the IVDOM values of
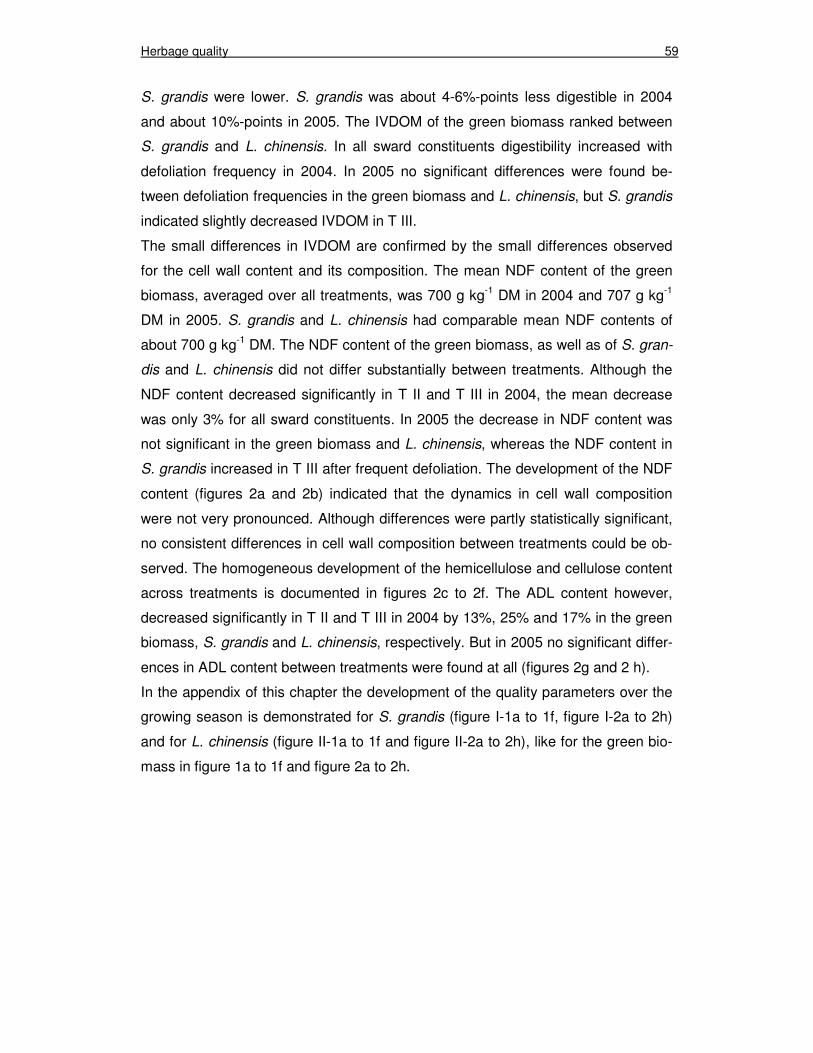
Herbage quality 59
S. grandis were lower. S. grandis was about 4-6%-points less digestible in 2004
and about 10%-points in 2005. The IVDOM of the green biomass ranked between
S. grandis and L. chinensis. In all sward constituents digestibility increased with
defoliation frequency in 2004. In 2005 no significant differences were found be-
tween defoliation frequencies in the green biomass and L. chinensis, but S. grandis
indicated slightly decreased IVDOM in T III.
The small differences in IVDOM are confirmed by the small differences observed
for the cell wall content and its composition. The mean NDF content of the green
biomass, averaged over all treatments, was 700 g kg-1 DM in 2004 and 707 g kg-1
DM in 2005. S. grandis and L. chinensis had comparable mean NDF contents of
about 700 g kg-1 DM. The NDF content of the green biomass, as well as of S. gran-
dis and L. chinensis did not differ substantially between treatments. Although the
NDF content decreased significantly in T II and T III in 2004, the mean decrease
was only 3% for all sward constituents. In 2005 the decrease in NDF content was
not significant in the green biomass and L. chinensis, whereas the NDF content in
S. grandis increased in T III after frequent defoliation. The development of the NDF
content (figures 2a and 2b) indicated that the dynamics in cell wall composition
were not very pronounced. Although differences were partly statistically significant,
no consistent differences in cell wall composition between treatments could be ob-
served. The homogeneous development of the hemicellulose and cellulose content
across treatments is documented in figures 2c to 2f. The ADL content however,
decreased significantly in T II and T III in 2004 by 13%, 25% and 17% in the green
biomass, S. grandis and L. chinensis, respectively. But in 2005 no significant differ-
ences in ADL content between treatments were found at all (figures 2g and 2 h).
In the appendix of this chapter the development of the quality parameters over the
growing season is demonstrated for S. grandis (figure I-1a to 1f, figure I-2a to 2h)
and for L. chinensis (figure II-1a to 1f and figure II-2a to 2h), like for the green bio-
mass in figure 1a to 1f and figure 2a to 2h.
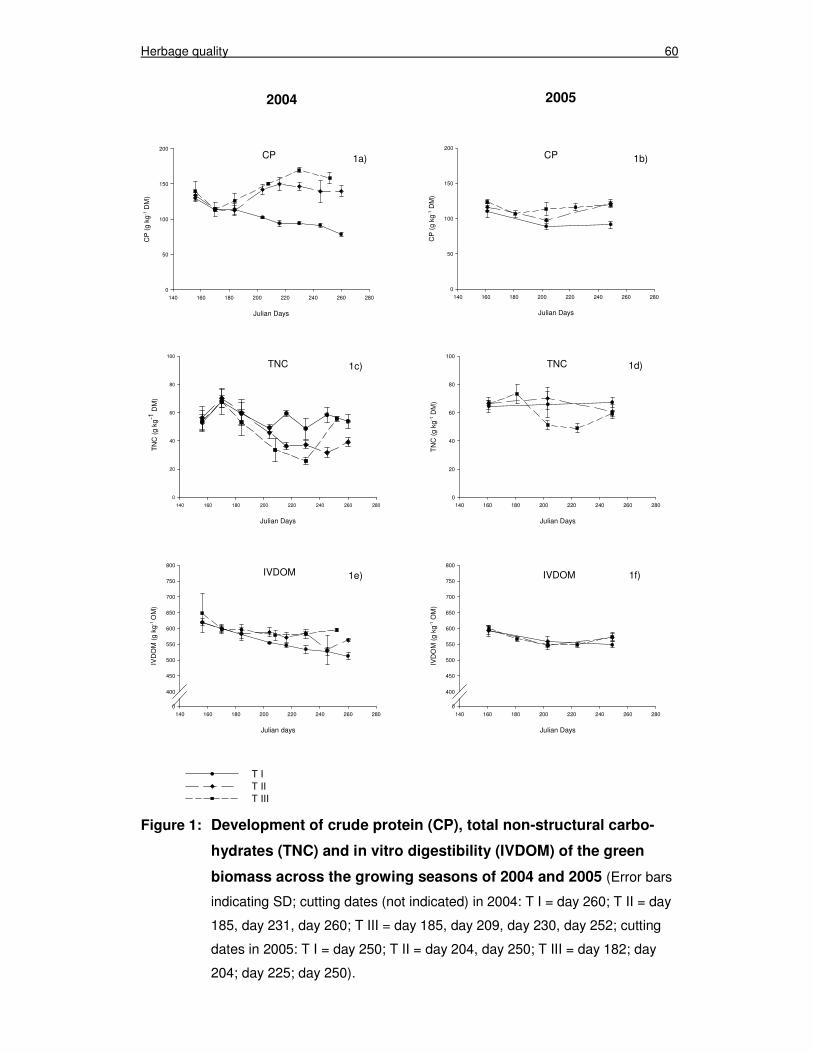
Herbage quality 60
Figure 1: Development of crude protein (CP), total non-structural carbo-
hydrates (TNC) and in vitro digestibility (IVDOM) of the green
biomass across the growing seasons of 2004 and 2005 (Error bars
indicating SD; cutting dates (not indicated) in 2004: T I = day 260; T II = day
185, day 231, day 260; T III = day 185, day 209, day 230, day 252; cutting
dates in 2005: T I = day 250; T II = day 204, day 250; T III = day 182; day
204; day 225; day 250).
CP
Julian Days
140 160 180 200 220 240 260 280
CP
(g
kg-1
DM
)
0
50
100
150
200CP
Julian Days
140 160 180 200 220 240 260 280
CP
(g
kg-1
DM
)
0
50
100
150
200
TNC
Julian Days
140 160 180 200 220 240 260 280
TN
C (
g kg
-1 D
M)
0
20
40
60
80
100
TNC
Julian Days
140 160 180 200 220 240 260 280
TN
C (
g kg
-1 D
M)
0
20
40
60
80
100
IVDOM
Julian days
140 160 180 200 220 240 260 280
IVD
OM
(g
kg-1
OM
)
0
400
450
500
550
600
650
700
750
800
T IT IIT III
IVDOM
Julian Days
140 160 180 200 220 240 260 280
IVD
OM
(g
kg-1
OM
)
0
400
450
500
550
600
650
700
750
800
2004 2005
1a) 1b)
1c) 1d)
1e) 1f)
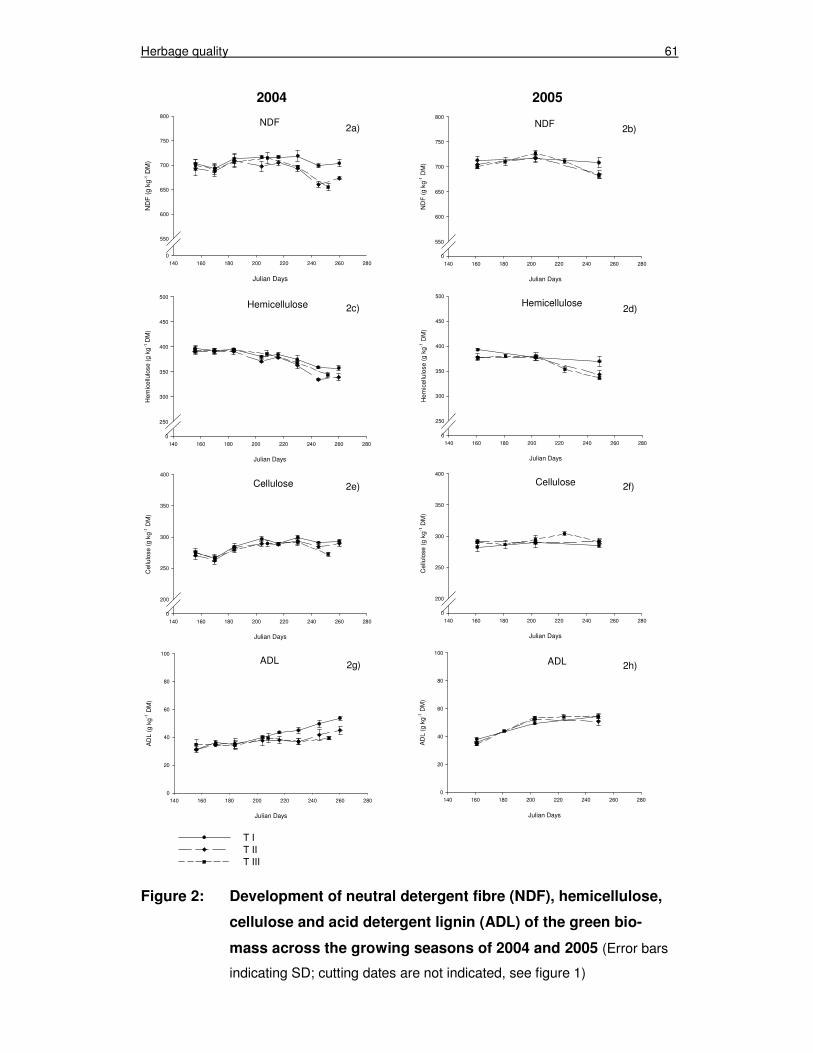
Herbage quality 61
Figure 2: Development of neutral detergent fibre (NDF), hemicellulose,
cellulose and acid detergent lignin (ADL) of the green bio-
mass across the growing seasons of 2004 and 2005 (Error bars
indicating SD; cutting dates are not indicated, see figure 1)
NDF
Julian Days
140 160 180 200 220 240 260 280
ND
F (
g kg
-1 D
M)
0
550
600
650
700
750
800
Hemicellulose
Julian Days
140 160 180 200 220 240 260 280
Hem
icel
lulo
se (
g kg
-1 D
M)
0
250
300
350
400
450
500
Cellulose
Julian Days
140 160 180 200 220 240 260 280
Cel
lulo
se (
g kg
-1 D
M)
0
200
250
300
350
400
ADL
Julian Days
140 160 180 200 220 240 260 280
AD
L (g
kg-1
DM
)
0
20
40
60
80
100
T IT IIT III
ADL
Julian Days
140 160 180 200 220 240 260 280
AD
L (g
kg-1
DM
)
0
20
40
60
80
100
NDF
Julian Days
140 160 180 200 220 240 260 280
ND
F (
g kg
-1 D
M)
0
550
600
650
700
750
800
Hemicellulose
Julian Days
140 160 180 200 220 240 260 280
Hem
icel
lulo
se (
g kg
-1 D
M)
0
250
300
350
400
450
500
Julian Days
140 160 180 200 220 240 260 280
Cel
lulo
se (
g kg
-1 D
M)
0
200
250
300
350
400
Cellulose
2a) 2b)
2c) 2d)
2e) 2f)
2g) 2h)
2004 2005
Herbage quality 62
4. Discussion
In comparison to cool-season grasses investigated in humid temperate grasslands,
much higher cell wall contents and lower CP and TNC contents were observed for
grasses in the present study (Collins and Casler, 1990; Cherney et al., 1993;
Turner et al., 1996; Ombabi et al., 2001). In contrast, compared to warm-season
grasses the cell wall content was comparable (Hendrickson et al., 1997; Van Man
and Wiktorsson, 2003), but the CP content tended to be higher (Mutz and Drawe,
1983; Minson, 1990; Madakadaze et al., 1999). However, comparison with cool-
season grasses growing in other semi-arid grassland ecosystems show similar
quality, only the cell wall content tended to be higher in the present study (Pérez-
Corona et al., 1994; Long et al., 1999; Vázquez-Aldana et al., 2000; Ganskopp and
Bohnert, 2001).
Improved quality of herbage re-growth after defoliation has been widely observed in
cutting-frequency experiments (Binnie and Harrington, 1972; Mutz and Drawe,
1983; Willms and Beauchemin, 1991; Turner et al., 1996; Van Man and Wiktorsson,
2003) and grazing trials (Heitschmidt et al., 1989; Georgiadis and McNaughton,
1990; Wang and Wang, 1999; Schlegel et al., 2000; Garcia et al., 2003). Also in the
present study increasing herbage quality was found after frequent defoliation, but
not for all herbage quality parameters and not consistent for both experimental
years (tables 3 and 4).
The OM content decreased significantly in T II and T III in 2004, in 2005 also differ-
ences between T II and T III were significant, compared to T I. This was observed
for the green biomass and for S. grandis and L. chinensis as well (see appendix).
The plant cover in the investigated semi-arid grassland is low, about 40% to 60%
depending on the annual precipitation rate (M. Giese, personal communication).
After removing the aboveground biomass by cutting the soil surface is directly sub-
jected to rainfall. Rebounding raindrops transport soil particles and deposit them on
the remaining grass stubbles. It has been demonstrated that sediment production
from rainfall is negatively related to total aboveground biomass and coverage in
Texas’ rangelands (Thurow et al., 1986), as sufficient plant cover restricts sediment
production through rainfall. In 2005 the OM content increased in all treatments and
all sward constituents compared to 2004, what can be explained by less rainfall,
and therefore less soil contamination of the stubbles in 2005. In addition, defoliation
was carried out by a conventional lawn mower to 2.5 cm stubble height. Soil parti-
Herbage quality 63
cles were dispersed by mowing and particle deposition may have contributed to the
differences in OM content of the remaining grass stubbles.
The CP content increased significantly in the frequently defoliated treatments in
both years, but the differences between the 3-week and the 6-week defoliation in-
terval were not significant, except for the green biomass in 2004. This significant
difference between T II and T III might be a result of short-term changes in species
composition, as it was demonstrated for T II and T III in chapter 2 (table 2). The CP
content was maintained on a higher level in the frequently defoliated treatments as
it can be expected for juvenile re-growth. However, the increase in CP content in T
II and T III was much lower in 2005 compared to 2004 in all sward constituents,
what is probably a result of severe soil water deficit in the growing season of 2005.
As water is the first limiting resource in semi-arid grassland steppes (Noy-Meir,
1973), after defoliation probably only low amounts of N were available for incorpo-
ration into the re-growing grass plants (Hsiao, 1973). The N content of the plants
was therefore reduced in 2005.
In T I the CP content decreased during the vegetation period as the grass plants
matured in both experimental years. Decreasing CP content has been attributed to
decreasing leaf/stem ratio, as leaves contain more CP than stems (Terry and Tilley,
1964; Wilman and Rezvani Moghaddam, 1998). Minson (1990) reviewed several
studies which examined temperate and tropical forages and provided information
about the decline in CP content as plant maturation progressed. It was stated that
the CP content on average decreases by 2.2 g kg-1 DM day-1 in maturing forages,
with no significant differences between temperate and tropical forages. In the pre-
sent study a much lower decline of only 0.5 g kg-1 DM day-1 and 0.2 g kg-1 DM day-1
was observed in T I in 2004 and 2005, respectively. This result suggests that plant
maturation progresses very slowly in this dry environment and/or that the effect of
maturation, namely the decrease in leaf/stem ratio, is less pronounced. Conse-
quently, the decrease in CP content might be more a result of increasing senes-
cence and connected to re-translocation of N, than of increasing amounts of stem.
This assumption is supported by the results obtained for the cell wall content and
its composition. It has been widely observed that the cell wall content increases
when grass plants mature, mainly due to reproductive tillering (Bailey, 1973; Wilson,
1994). As frequent defoliation retards plant maturation and re-growth remains pri-
marily vegetative thereafter (Allinson et al., 1969), it can be expected that the NDF
content of re-growing grass plants is considerably lower. However, after the first cut
almost no change in NDF content was observed for T II and T III. Only after the
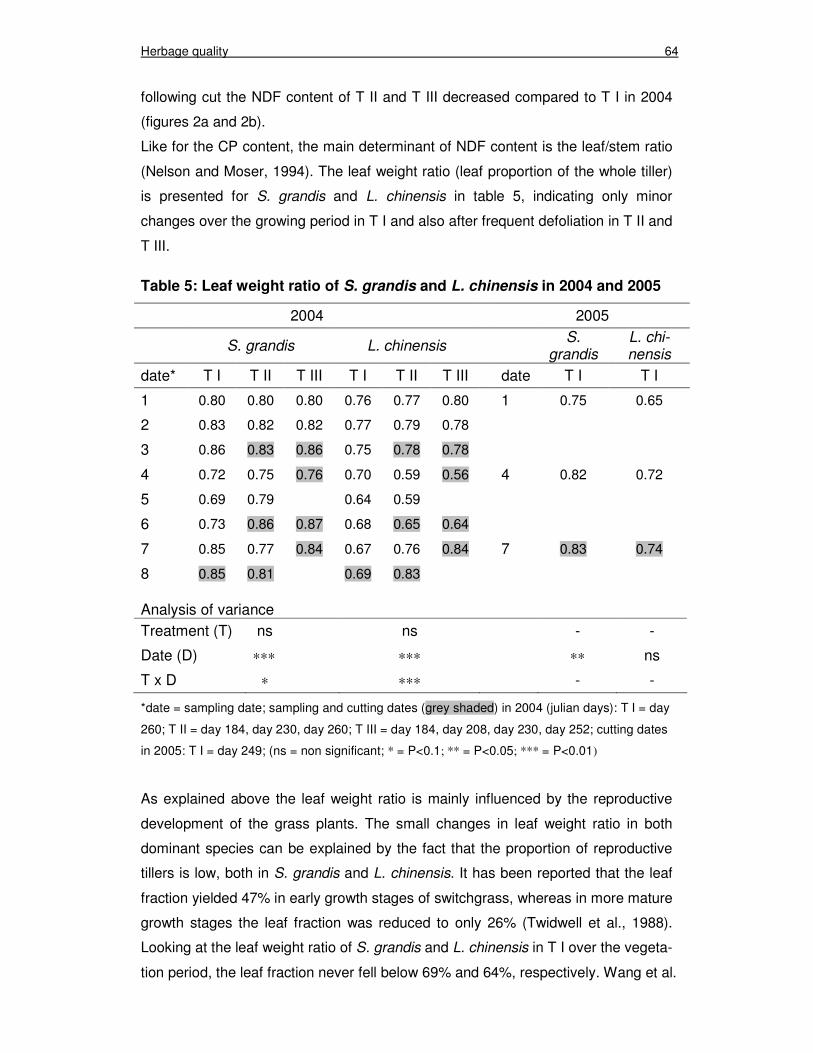
Herbage quality 64
following cut the NDF content of T II and T III decreased compared to T I in 2004
(figures 2a and 2b).
Like for the CP content, the main determinant of NDF content is the leaf/stem ratio
(Nelson and Moser, 1994). The leaf weight ratio (leaf proportion of the whole tiller)
is presented for S. grandis and L. chinensis in table 5, indicating only minor
changes over the growing period in T I and also after frequent defoliation in T II and
T III.
Table 5: Leaf weight ratio of S. grandis and L. chinensis in 2004 and 2005
2004 2005
S. grandis L. chinensis
S.
grandis L. chi-nensis
date* T I T II T III T I T II T III date T I T I
1 0.80 0.80 0.80 0.76 0.77 0.80 1 0.75 0.65
2 0.83 0.82 0.82 0.77 0.79 0.78
3 0.86 0.83 0.86 0.75 0.78 0.78
4 0.72 0.75 0.76 0.70 0.59 0.56 4 0.82 0.72
5 0.69 0.79 0.64 0.59
6 0.73 0.86 0.87 0.68 0.65 0.64
7 0.85 0.77 0.84 0.67 0.76 0.84 7 0.83 0.74
8 0.85 0.81 0.69 0.83
Analysis of variance Treatment (T) ns ns - -
Date (D) ∗∗∗ ∗∗∗ ∗∗ ns
T x D ∗ ∗∗∗ - -
*date = sampling date; sampling and cutting dates (grey shaded) in 2004 (julian days): T I = day
260; T II = day 184, day 230, day 260; T III = day 184, day 208, day 230, day 252; cutting dates
in 2005: T I = day 249; (ns = non significant; * = P<0.1; ** = P<0.05; *** = P<0.01)
As explained above the leaf weight ratio is mainly influenced by the reproductive
development of the grass plants. The small changes in leaf weight ratio in both
dominant species can be explained by the fact that the proportion of reproductive
tillers is low, both in S. grandis and L. chinensis. It has been reported that the leaf
fraction yielded 47% in early growth stages of switchgrass, whereas in more mature
growth stages the leaf fraction was reduced to only 26% (Twidwell et al., 1988).
Looking at the leaf weight ratio of S. grandis and L. chinensis in T I over the vegeta-
tion period, the leaf fraction never fell below 69% and 64%, respectively. Wang et al.
Herbage quality 65
(2001) reported that the reproductive shoot differentiation of L. chinensis was less
then 5% under dry conditions and only about 17% when the soil water availability
was sufficient. In the present study it was observed that 32% of S. grandis’ DM-
yield sampled in the end of the growing season in 2004, belonged to reproductive
tillers. It can be further added that the leaf/stem ratio remains on a higher level un-
der drought conditions, because the maturation process is slowed down due to wa-
ter limitations (Albrecht et al., 1987). As spring was drier than average, both in 2004
and 2005, this may have contributed to the only minimal changes in leaf weight
ratio in the present study.
Besides constant values over the vegetation period, the high NDF content (> 700 g
NDF kg-1 DM) in early growing season is surprising. No comparable results were
found in literature so far. Due to the unfavourable growth conditions, it seems pos-
sible that the native grasses protect themselves from environmental stresses like
drought, by developing thick cell walls. Buxton and Casler (1993) stated that a
common plant reaction to environmental stresses is cell wall thickening. Other au-
thors reported thick, lignified cell walls to be characteristic for plants growing in dry
habitats, attempting to enhance the resistance to water loss (Levitt, 1980; Melk-
onian, 1982; Frank et al., 1996; Frey and Lösch, 2004).
Like the NDF content, also the NDF composition was relatively constant over the
growing season. Hemicellulose slightly decreased in the course of the growing
season, whereas cellulose content remained unchanged in both years. Neither
hemicellulose nor cellulose indicate relevant differences between defoliation treat-
ments in 2004, whereas in 2005 hemicellulose decreased significantly in the green
biomass and cellulose increased significantly in S. grandis. The ADL content de-
creased significantly due to defoliation in 2004, but differences between TII and TIII
were not significant. In 2005 however, the ADL content also increased in the course
of the growing season (figure 2g and 2h), but defoliation frequency did not alter the
ADL content in T II and T III. Lignification of plant cell walls results from secondary
wall thickening as it can be observed in ageing grass plants (Jung and Allen, 1995).
Lignification is usually accelerated by high temperatures (Ford et al., 1979; Wilson
et al., 1991; Van Soest, 1994). As temperatures were above average in July and
August 2005 (table 1), this is probably the reason for slightly increased ADL con-
tents in 2005. However, this does not explain why defoliation had no effect on ADL
content in 2005. It can be assumed that constantly high ADL contents, like high
NDF contents, contribute to the protection mechanism against drought.
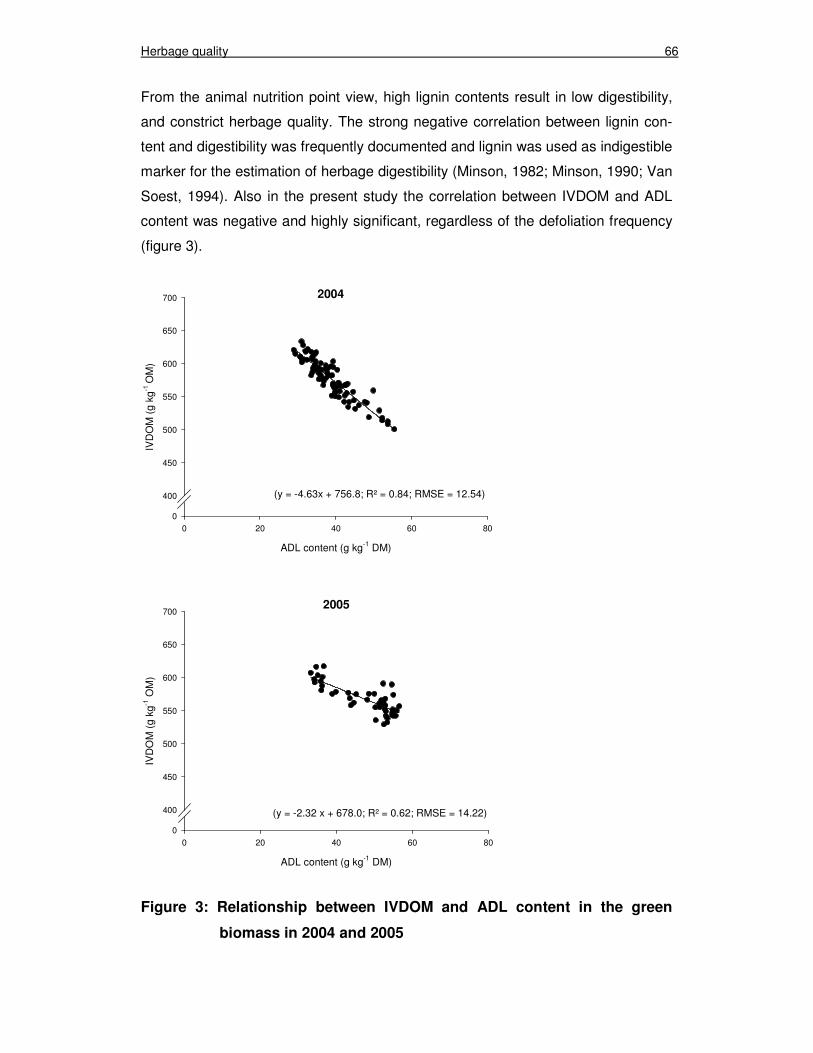
Herbage quality 66
From the animal nutrition point view, high lignin contents result in low digestibility,
and constrict herbage quality. The strong negative correlation between lignin con-
tent and digestibility was frequently documented and lignin was used as indigestible
marker for the estimation of herbage digestibility (Minson, 1982; Minson, 1990; Van
Soest, 1994). Also in the present study the correlation between IVDOM and ADL
content was negative and highly significant, regardless of the defoliation frequency
(figure 3).
Figure 3: Relationship between IVDOM and ADL content in the green
biomass in 2004 and 2005
2004
ADL content (g kg-1 DM)
0 20 40 60 80
IVD
OM
(g
kg-1
OM
)
0
400
450
500
550
600
650
700
(y = -4.63x + 756.8; R² = 0.84; RMSE = 12.54)
2005
ADL content (g kg-1 DM)
0 20 40 60 80
IVD
OM
(g
kg-1
OM
)
0
400
450
500
550
600
650
700
(y = -2.32 x + 678.0; R² = 0.62; RMSE = 14.22)
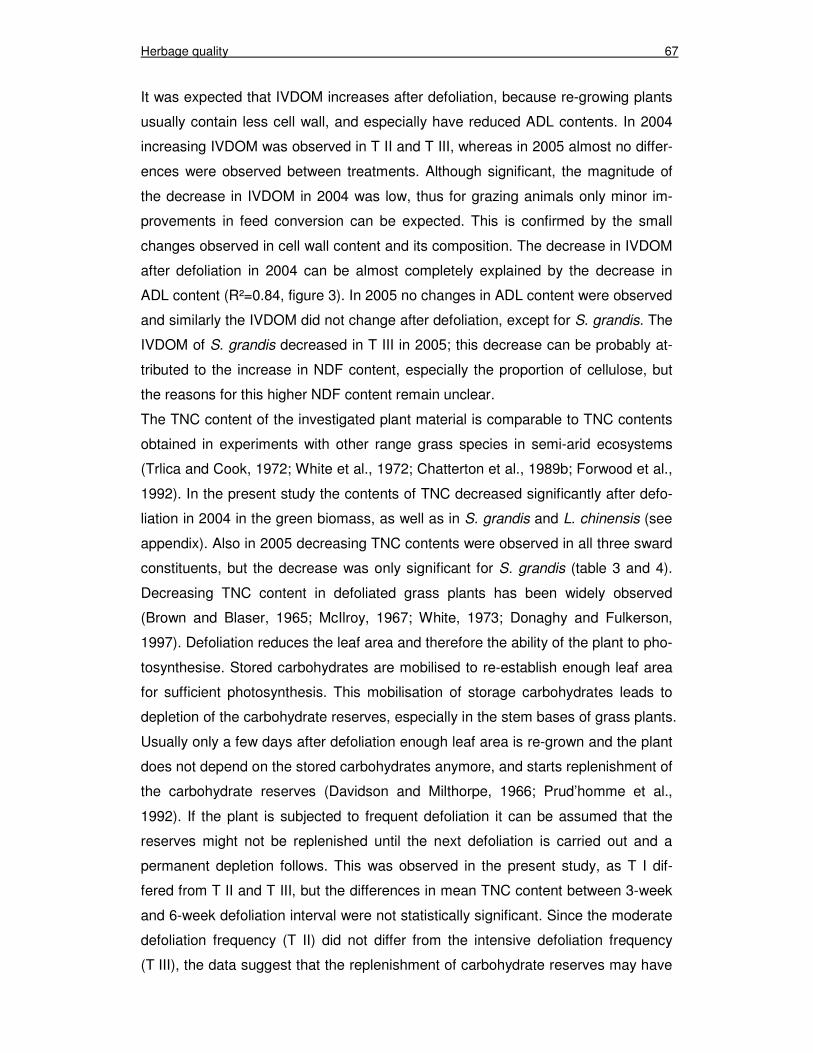
Herbage quality 67
It was expected that IVDOM increases after defoliation, because re-growing plants
usually contain less cell wall, and especially have reduced ADL contents. In 2004
increasing IVDOM was observed in T II and T III, whereas in 2005 almost no differ-
ences were observed between treatments. Although significant, the magnitude of
the decrease in IVDOM in 2004 was low, thus for grazing animals only minor im-
provements in feed conversion can be expected. This is confirmed by the small
changes observed in cell wall content and its composition. The decrease in IVDOM
after defoliation in 2004 can be almost completely explained by the decrease in
ADL content (R²=0.84, figure 3). In 2005 no changes in ADL content were observed
and similarly the IVDOM did not change after defoliation, except for S. grandis. The
IVDOM of S. grandis decreased in T III in 2005; this decrease can be probably at-
tributed to the increase in NDF content, especially the proportion of cellulose, but
the reasons for this higher NDF content remain unclear.
The TNC content of the investigated plant material is comparable to TNC contents
obtained in experiments with other range grass species in semi-arid ecosystems
(Trlica and Cook, 1972; White et al., 1972; Chatterton et al., 1989b; Forwood et al.,
1992). In the present study the contents of TNC decreased significantly after defo-
liation in 2004 in the green biomass, as well as in S. grandis and L. chinensis (see
appendix). Also in 2005 decreasing TNC contents were observed in all three sward
constituents, but the decrease was only significant for S. grandis (table 3 and 4).
Decreasing TNC content in defoliated grass plants has been widely observed
(Brown and Blaser, 1965; McIlroy, 1967; White, 1973; Donaghy and Fulkerson,
1997). Defoliation reduces the leaf area and therefore the ability of the plant to pho-
tosynthesise. Stored carbohydrates are mobilised to re-establish enough leaf area
for sufficient photosynthesis. This mobilisation of storage carbohydrates leads to
depletion of the carbohydrate reserves, especially in the stem bases of grass plants.
Usually only a few days after defoliation enough leaf area is re-grown and the plant
does not depend on the stored carbohydrates anymore, and starts replenishment of
the carbohydrate reserves (Davidson and Milthorpe, 1966; Prud’homme et al.,
1992). If the plant is subjected to frequent defoliation it can be assumed that the
reserves might not be replenished until the next defoliation is carried out and a
permanent depletion follows. This was observed in the present study, as T I dif-
fered from T II and T III, but the differences in mean TNC content between 3-week
and 6-week defoliation interval were not statistically significant. Since the moderate
defoliation frequency (T II) did not differ from the intensive defoliation frequency
(T III), the data suggest that the replenishment of carbohydrate reserves may have
Herbage quality 68
taken more than 6 weeks in the described grass species. Looking at the TNC con-
tent in the course of the vegetation period, figure 1c and 1d demonstrate that the
TNC content is not only influenced by defoliation frequency, but also by seasonal
fluctuations. A similar level of TNC was observed in the end of the vegetation pe-
riod across the three defoliation frequencies in both years. It seems that the TNC
accumulate in the aboveground biomass around the end of the vegetation period,
presumably induced by lower temperatures at this time of the year. Mean tempera-
tures decreased gradually from late August on (table 1), what decreased respiration
and slowed down plant growth. Photosynthesis was proved to be less sensitive to
decreasing temperatures maintaining high activity, especially in the younger, defo-
liated plants (Caldwell et al., 1981). Reduced growth and maintained photosynthe-
sis rates result in accumulation of TNC (Brown and Blaser, 1965; Chatterton et al.,
1987). The TNC content increased in late growing season in the green biomass
and in both dominant species, suggesting that the increase in TNC content is not
species specific, but largely influenced by changing environmental conditions. The
TNC content was generally higher in 2005 compared to 2004. Increasing TNC con-
tent has been often related to drought. Plant growth is substantially reduced by
drought, but the photosynthetic activity is less sensible to environmental stresses
like drought or low temperatures, as discussed above, and still active (Brown and
Blaser, 1970; Hsiao, 1973; Busso et al., 1990). The result is accumulation of TNC
in the plant tissue. The depletion due to defoliation was therefore less pronounced
in 2005 and the effect of treatment was not significant.
Herbage quality differences between the total green biomass and the two dominant
species S. grandis and L. chinensis were only small and consistent across the
three sward constituents (see appendix). This is in accordance with the results of
Ganskopp and Bohnert (2001) who analyzed herbage growth and quality of 7 na-
tive grasses from the semi-arid northern Great Basin (USA), and could explain only
10% of the variation in herbage quality by species effects, but 80% of the variation
by seasonal effects. L. chinensis tended to be higher in herbage quality than S.
grandis and the green biomass. After defoliation the development of herbage qual-
ity parameters was consistent across the three sward constituents, not indicating
fundamental differences in their responses to frequent defoliation.
In accordance with the objective of the present study, which aimed at the identifica-
tion of short-term responses of herbage quality parameters to different defoliation
intensities, it can be stated that herbage quality is significantly influenced by fre-
quent defoliation, although not all investigated quality parameters. However, it was
Herbage quality 69
demonstrated that the climatic fluctuations between years substantially influenced
the herbage quality as well, probably covering consistent short-term responses of
herbage quality parameters to defoliation frequency.
Nevertheless, the CP content showed the most consistent response to different
defoliation intensities, even in the dry year 2005. The OM content also showed sig-
nificant differences between treatments, but these differences can be mainly attrib-
uted to the harvesting technique; therefore is the informational value of OM content
obtained in the present study not transferable to grazing experiments. IVDOM re-
sponded only slightly and inconsistently. The steady digestibility is the result of the
consistent cell wall content and its composition that showed only minor changes
between defoliation frequencies. IVDOM and cell wall content are not suitable to
identify short-term effects of defoliation stress. The TNC content has to be as-
sessed in the same way; although significant short-term differences in TNC content
were observed between defoliation frequencies, the TNC content was highly sus-
ceptible to climatic effects in both experimental years.
5. Conclusions
The CP-content is a reliable indicator for short-term effects of defoliation stress. For
other herbage quality parameters the strong influence of climatic fluctuations and
seasonal dynamics was demonstrated, which interfere to a great extent with short-
term effects of defoliation. However, in the long-term herbage quality parameters
might be useful indicators for changes caused by defoliation stress, as it is likely
that herbage quality is influenced by substantial changes in the plant community,
e.g. a shift from grass to shrub vegetation. From the animal nutrition point of view
the quality of the investigated herbage is low and only suffices minimal nutritional
requirements (Leng, 1990; Van Soest, 1994).
Herbage quality 70
6. References
Albrecht, K.A., Wedin, W.F., Buxton, D.R., 1987. Cell-wall composition and digesti-
bility of alfalfa stems and leaves. Crop Science 27, 735-741.
Allinson, D.W., Tesar, M.B., Thomas, J.W., 1969. Influence of cutting frequency,
species, and nitrogen fertilization on forage nutritional value. Crop Science 9,
504-508.
Bai, Y., Han, X., Wu, J., Chen, Z., Li, L., 2004. Ecosystem stability and compensa-
tory effects in the Inner Mongolia grassland. Nature 431, 181-184.
Bailey, R.W., 1973. Structural carbohydrates. In: Butler, G.W., Bailey, R.W. (Eds.),
Chemistry and biochemistry of herbage. Academic Press, London and New
York.
Binnie, R.C., Harrington, F.J., 1972. The effect of cutting height and cutting fre-
quency on the productivity of an Italian ryegrass sward. Journal of the British
Grassland Society 27, 177-182.
Brown, R.H., Blaser, R.E., 1965. Relationship between reserve carbohydrate ac-
cumulation and growth rate in orchardgrass and tall fescue. Crop Science 5,
577-582.
Brown, R.H., Blaser, R.E., 1970. Soil moisture and temperature effects on growth
and soluble carbohydrates of orchardgrass (Dactylis glomerata). Crop Sci-
ence 10, 213-216.
Busso, C.A., Richards, J.H., Chatterton, N.J., 1990. Nonstructural carbohydrates
and spring regrowth of two cool-season grasses: Interaction of drought and
clipping. Journal of Range Management 43, 336-343.
Buxton, D.R., 1996. Quality-related characteristics of forages as influenced by plant
environment and agronomic factors. Animal Feed Science and Technology 59,
37-49.
Buxton, D.R., Casler, M.D., 1993. Environmental and genetic effects on cell wall
composition and digestibility. In: Jung, H.G. et al. (Eds.), Forage cell wall
structure and digestibility. ASA-CSSA-SSSA, Madison.
Buxton, D.R., Fales, S.L., 1994. Plant environment and quality. In : Fahey, G.C.Jr.
(Ed.), Forage Quality, Evaluation and Utilization. ASA-CSSA-SSSA, Madison.
Caldwell, M.M., Richards, J.H., Johnson, D.A., Nowak, R.S., Dzurec, R.S., 1981.
Coping with herbivory: photosynthetic capacity and resource allocation in two
semi-arid Agropyron bunchgrasses. Oecologia 50, 14-24.
Herbage quality 71
Chatterton, N.J., Harrison, P.A., Bennett, J.H., Thornley, W.R., 1987. Fructan,
starch and sucrose concentrations in crested wheatgrass and redtop as af-
fected by temperature. Plant Physiology and Biochemistry 25, 617-623.
Chatterton, N.J., Harrison, P.A., Thornley, W.R., Bennett, J.H., 1989a: Purification
and quantification of kestoses (fructosylsucroses) by gel permeation and an-
ion exchange chromatography. Plant Physiology and Biochemistry 27, 289-
295.
Chatterton, N.J., Harrison, P.A., Bennett, J.H., Asay, K.H., 1989b. Carbohydrate
partitioning in 185 accessions of gramineae grown under warm and cool tem-
peratures. Journal of Plant Physiology 134, 169-179.
Cherney, D.J.R., Cherney, J.H., Lucey, R.F., 1993. In vitro digestion kinetics and
quality of perennial grasses as influenced by forage maturity. Journal of Dairy
Science 76, 790-797.
Collins, M., Casler, M.D., 1990. Forage quality of five cool-season grasses. II. Spe-
cies effects. Animal Feed Science and Technology 27, 209-218.
Davidson, J.L., Milthorpe, F.L., 1966. The effect of defoliation on the carbon bal-
ance in Dactylis glomerata. Annals of Botany 30, 185-198.
De Boever, J.L., Cottyn, B.G., Buysse, F.X., Wainman, F.W., Vanacker, J.M., 1986.
The use of an enzymatic technique to predict digestibility, metabolizable en-
ergy of compound feedstuffs for ruminants. Animal Feed Science and Tech-
nology 14, 203-214.
Donaghy, D.J., Fulkerson, W.J., 1997. The importance of water-soluble carbohy-
drate reserves on regrowth and root growth of Lolium perenne L. Grass and
Forage Science 52, 401-407.
FAO, 2001. http://www.fao.org/ag/agp/agpc/doc/counprof/china/China1.htm
(04.08.2007)
Ford, C.W., Morrison, I.M., Wilson, J.R., 1979. Temperature effects on lignin, hemi-
cellulose and cellulose in tropical and temperate grasses. Australian Journal
of Agricultural Research 30, 621-633.
Forwood, J.R., Magai, M.M., 1992. Clipping frequency and intensity effects on big
bluestem yield, quality, and persistence. Journal of Range Management 45,
554-559.
Herbage quality 72
Frank, A.B., Bittman, S., Johnson, D.A., 1996. Water relations of cool-season
grasses. In: Moser, L.E., Buxton, D.R., Casler, M.D. (Eds.), Cool-Season
Forage Grasses. ASA-CSSA-SSSA, Madison.
Frey, W., Lösch, R., 2004. Lehrbuch der Geobotanik. G. Fischer Verlag, Stuttgart.
Ganskopp, D., Bohnert, D., 2001. Nutritional dynamics of 7 northern Great Basin
grasses. Journal of Range Management 54, 640-647.
Garcia, F., Carrère, P., Soussana, J.F., Baumont, R., 2003. How do severity and
frequency of grazing affect sward characteristics and the choices of sheep
during the grazing season? Grass and Forage Science 58, 138-150.
Georgiadis, N.J., McNaughton, S.J., 1990. Elemental and fibre contents of savanna
grasses: variation with grazing, soil type, season and species. Journal of Ap-
plied Ecology 27, 623-634.
Heitschmidt, R.K., Dowhower, S.L., Pinchak, W.E., Canon, S.K., 1989. Effects of
stocking rate on quantity and quality of available forage in a southern mixed
grass prairie. Journal of Range Management 42, 468-473.
Hendrickson, J.R., Moser, L.E., Moore, K.J., Waller, S.S., 1997. Leaf nutritive value
related to tiller development in warm-season grasses. Journal of Range Ma-
nagement 50, 116-122.
Horn, M., Vollandt, R., 1995. Multiple Tests und Auswahlverfahren. Gustav Fischer
Verlag, Stuttgart.
Hsiao, T.C., 1973. Plant responses to water stress. Annual Review of Plant Physi-
ology and Molecular Biology 24, 519-570.
Jiang, Y., Meurer, M., 2001. Die Steppen Nordchinas und ihre Belastung durch
weide- und landwirtschaftliche Landnutzung. Geographische Rundschau 53,
48-52.
Jung, H.G., Allen, M.S., 1995. Characteristics of plant cell walls affecting intake and
digestibility of forages by ruminants. Journal of Animal Science 73, 2774-2790.
Leng, R.A., 1990. Factors affecting the utilization of ‘poor-quality’ forages by rumi-
nants particularly under tropical conditions. Nutrition Research Reviews 3,
277-303.
Levitt, J., 1980. Response of plants to environmental stresses, Vol. II. Academic
Press, New York.
Li, Y.H., 1989. Impact of grazing on Aneurolepidium chinense steppe and Stipa
grandis steppe. Acta Oecologica/Oecologia Applicata 10, 31-46.
Herbage quality 73
Long, R.J., Apori, S.O., Castro, F.B., Orskov, E.R., 1999. Feed value of native for-
ages of the Tibetean Plateau of China. Animal Feed Science and Technology
80, 101-113.
Madakadaze, I., Stewart, K., Peterson, P., Coulman, B.E., Smith, D.L., 1999. Cut-
ting frequency and nitrogen fertilization effects on yield and nitrogen concen-
tration of switchgrass in a short season area. Crop Science 39, 552-557.
McIlroy, R.J., 1967. Carbohydrates of grassland herbage. Herbage Abstracts 37,
79-87.
Melkonian, J.J., Wolfe, J., Steponkus, P.L., 1982. Determination of the volumetric
modulus of elasticity of wheat leaves by pressure-volume relations and effect
of drought conditioning. Crop Science 22, 116-123.
Minson, D.J., 1982. Effect of chemical composition on feed digestibility and me-
tabolizable energy. Nutrition Abstracts and Reviews 52b, 591-615.
Minson, D.J., 1990. Forage in ruminant nutrition. Academic Press, Inc., San Diego.
Mutz, J.L., Drawe, D.L., 1983. Clipping frequency and fertilization influence herb-
age yields and crude protein content of 4 grasses in South Texas. Journal of
Range Management 36, 582-585.
Naumann, K., Bassler, R., 1993. Methodenbuch III, 3. Erg., Die chemische Unter-
suchung von Futtermitteln. Verlag J. Neumann – Neudann, Melsungen.
Nelson, C.J., Moser, L.E., 1994. Plant factors affecting forage quality. In : Fahey,
G.C.Jr. (Ed.), Forage Quality, Evaluation and Utilization. ASA-CSSA-SSSA,
Madison.
Noy-Meir, I., 1973. Desert ecosystems: environment and producers. Annual Review
of Ecology and Systematics 4, 25-51.
Ombabi, A., Südekum, K.-H., Taube, F., 2001. Untersuchungen am Primärauf-
wuchs zweier Weidelgräser zur Dynamik der Veränderungen im Futterwert
und der Futteraufnahme durch Schafe. Journal of Animal Physiology and A-
nimal Nutrition 85, 385-405.
Pérez-Corona, M.E., García-Criado, B., Vázquez-de-Aldana, B.R., García-Ciudad,
A., 1994. Effect of topographic and temporal (maturity) gradients on the nutri-
tive quality of semiarid herbaceous communities. Communication in Soil Sci-
ence and Plant Analysis 25, 2047-2061.
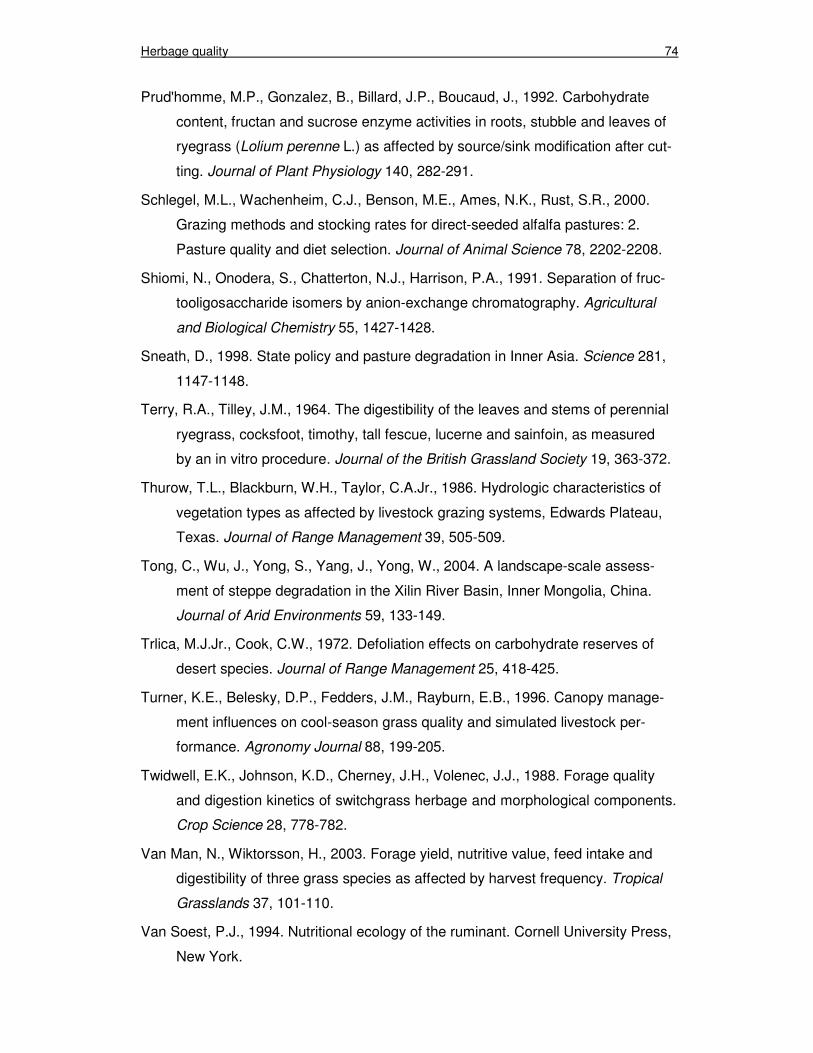
Herbage quality 74
Prud'homme, M.P., Gonzalez, B., Billard, J.P., Boucaud, J., 1992. Carbohydrate
content, fructan and sucrose enzyme activities in roots, stubble and leaves of
ryegrass (Lolium perenne L.) as affected by source/sink modification after cut-
ting. Journal of Plant Physiology 140, 282-291.
Schlegel, M.L., Wachenheim, C.J., Benson, M.E., Ames, N.K., Rust, S.R., 2000.
Grazing methods and stocking rates for direct-seeded alfalfa pastures: 2.
Pasture quality and diet selection. Journal of Animal Science 78, 2202-2208.
Shiomi, N., Onodera, S., Chatterton, N.J., Harrison, P.A., 1991. Separation of fruc-
tooligosaccharide isomers by anion-exchange chromatography. Agricultural
and Biological Chemistry 55, 1427-1428.
Sneath, D., 1998. State policy and pasture degradation in Inner Asia. Science 281,
1147-1148.
Terry, R.A., Tilley, J.M., 1964. The digestibility of the leaves and stems of perennial
ryegrass, cocksfoot, timothy, tall fescue, lucerne and sainfoin, as measured
by an in vitro procedure. Journal of the British Grassland Society 19, 363-372.
Thurow, T.L., Blackburn, W.H., Taylor, C.A.Jr., 1986. Hydrologic characteristics of
vegetation types as affected by livestock grazing systems, Edwards Plateau,
Texas. Journal of Range Management 39, 505-509.
Tong, C., Wu, J., Yong, S., Yang, J., Yong, W., 2004. A landscape-scale assess-
ment of steppe degradation in the Xilin River Basin, Inner Mongolia, China.
Journal of Arid Environments 59, 133-149.
Trlica, M.J.Jr., Cook, C.W., 1972. Defoliation effects on carbohydrate reserves of
desert species. Journal of Range Management 25, 418-425.
Turner, K.E., Belesky, D.P., Fedders, J.M., Rayburn, E.B., 1996. Canopy manage-
ment influences on cool-season grass quality and simulated livestock per-
formance. Agronomy Journal 88, 199-205.
Twidwell, E.K., Johnson, K.D., Cherney, J.H., Volenec, J.J., 1988. Forage quality
and digestion kinetics of switchgrass herbage and morphological components.
Crop Science 28, 778-782.
Van Man, N., Wiktorsson, H., 2003. Forage yield, nutritive value, feed intake and
digestibility of three grass species as affected by harvest frequency. Tropical
Grasslands 37, 101-110.
Van Soest, P.J., 1994. Nutritional ecology of the ruminant. Cornell University Press,
New York.
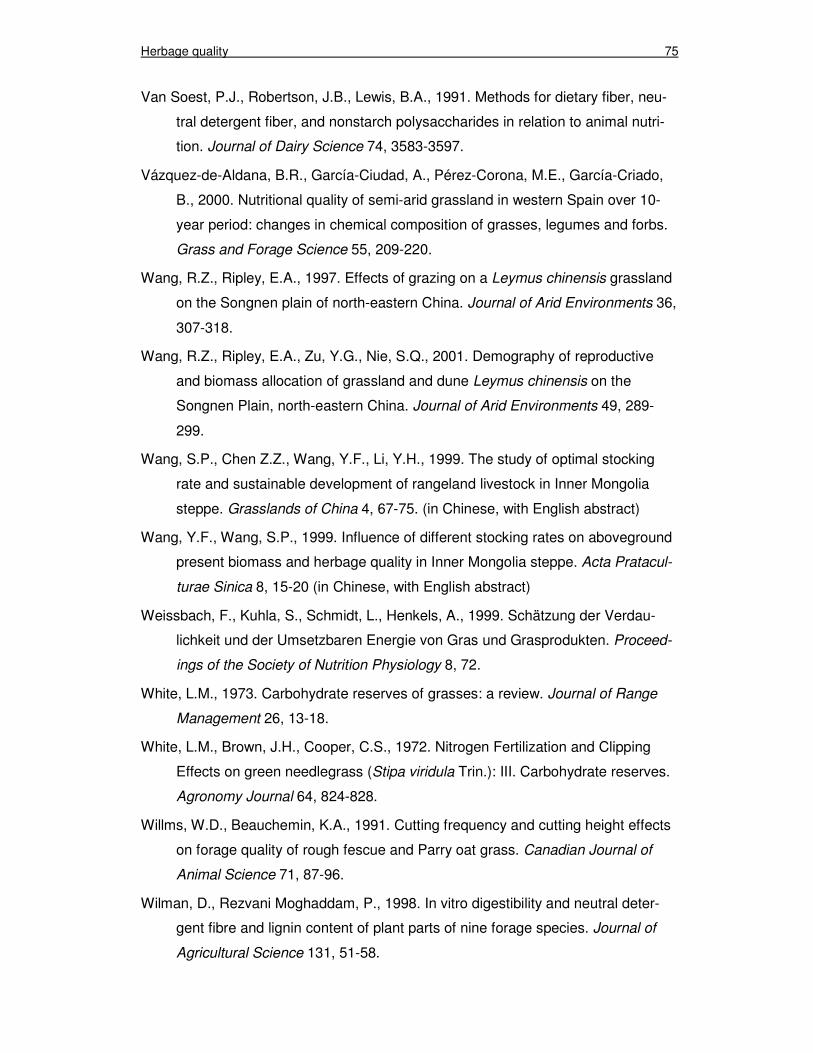
Herbage quality 75
Van Soest, P.J., Robertson, J.B., Lewis, B.A., 1991. Methods for dietary fiber, neu-
tral detergent fiber, and nonstarch polysaccharides in relation to animal nutri-
tion. Journal of Dairy Science 74, 3583-3597.
Vázquez-de-Aldana, B.R., García-Ciudad, A., Pérez-Corona, M.E., García-Criado,
B., 2000. Nutritional quality of semi-arid grassland in western Spain over 10-
year period: changes in chemical composition of grasses, legumes and forbs.
Grass and Forage Science 55, 209-220.
Wang, R.Z., Ripley, E.A., 1997. Effects of grazing on a Leymus chinensis grassland
on the Songnen plain of north-eastern China. Journal of Arid Environments 36,
307-318.
Wang, R.Z., Ripley, E.A., Zu, Y.G., Nie, S.Q., 2001. Demography of reproductive
and biomass allocation of grassland and dune Leymus chinensis on the
Songnen Plain, north-eastern China. Journal of Arid Environments 49, 289-
299.
Wang, S.P., Chen Z.Z., Wang, Y.F., Li, Y.H., 1999. The study of optimal stocking
rate and sustainable development of rangeland livestock in Inner Mongolia
steppe. Grasslands of China 4, 67-75. (in Chinese, with English abstract)
Wang, Y.F., Wang, S.P., 1999. Influence of different stocking rates on aboveground
present biomass and herbage quality in Inner Mongolia steppe. Acta Pratacul-
turae Sinica 8, 15-20 (in Chinese, with English abstract)
Weissbach, F., Kuhla, S., Schmidt, L., Henkels, A., 1999. Schätzung der Verdau-
lichkeit und der Umsetzbaren Energie von Gras und Grasprodukten. Proceed-
ings of the Society of Nutrition Physiology 8, 72.
White, L.M., 1973. Carbohydrate reserves of grasses: a review. Journal of Range
Management 26, 13-18.
White, L.M., Brown, J.H., Cooper, C.S., 1972. Nitrogen Fertilization and Clipping
Effects on green needlegrass (Stipa viridula Trin.): III. Carbohydrate reserves.
Agronomy Journal 64, 824-828.
Willms, W.D., Beauchemin, K.A., 1991. Cutting frequency and cutting height effects
on forage quality of rough fescue and Parry oat grass. Canadian Journal of
Animal Science 71, 87-96.
Wilman, D., Rezvani Moghaddam, P., 1998. In vitro digestibility and neutral deter-
gent fibre and lignin content of plant parts of nine forage species. Journal of
Agricultural Science 131, 51-58.
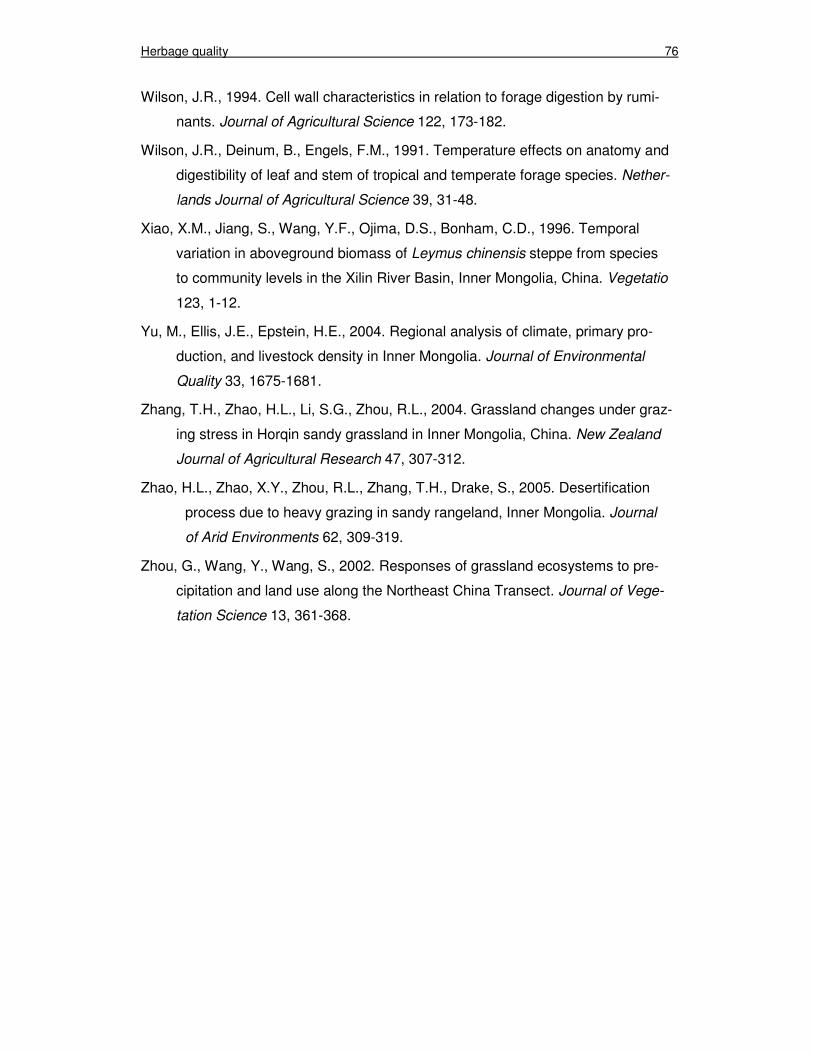
Herbage quality 76
Wilson, J.R., 1994. Cell wall characteristics in relation to forage digestion by rumi-
nants. Journal of Agricultural Science 122, 173-182.
Wilson, J.R., Deinum, B., Engels, F.M., 1991. Temperature effects on anatomy and
digestibility of leaf and stem of tropical and temperate forage species. Nether-
lands Journal of Agricultural Science 39, 31-48.
Xiao, X.M., Jiang, S., Wang, Y.F., Ojima, D.S., Bonham, C.D., 1996. Temporal
variation in aboveground biomass of Leymus chinensis steppe from species
to community levels in the Xilin River Basin, Inner Mongolia, China. Vegetatio
123, 1-12.
Yu, M., Ellis, J.E., Epstein, H.E., 2004. Regional analysis of climate, primary pro-
duction, and livestock density in Inner Mongolia. Journal of Environmental
Quality 33, 1675-1681.
Zhang, T.H., Zhao, H.L., Li, S.G., Zhou, R.L., 2004. Grassland changes under graz-
ing stress in Horqin sandy grassland in Inner Mongolia, China. New Zealand
Journal of Agricultural Research 47, 307-312.
Zhao, H.L., Zhao, X.Y., Zhou, R.L., Zhang, T.H., Drake, S., 2005. Desertification
process due to heavy grazing in sandy rangeland, Inner Mongolia. Journal
of Arid Environments 62, 309-319.
Zhou, G., Wang, Y., Wang, S., 2002. Responses of grassland ecosystems to pre-
cipitation and land use along the Northeast China Transect. Journal of Vege-
tation Science 13, 361-368.
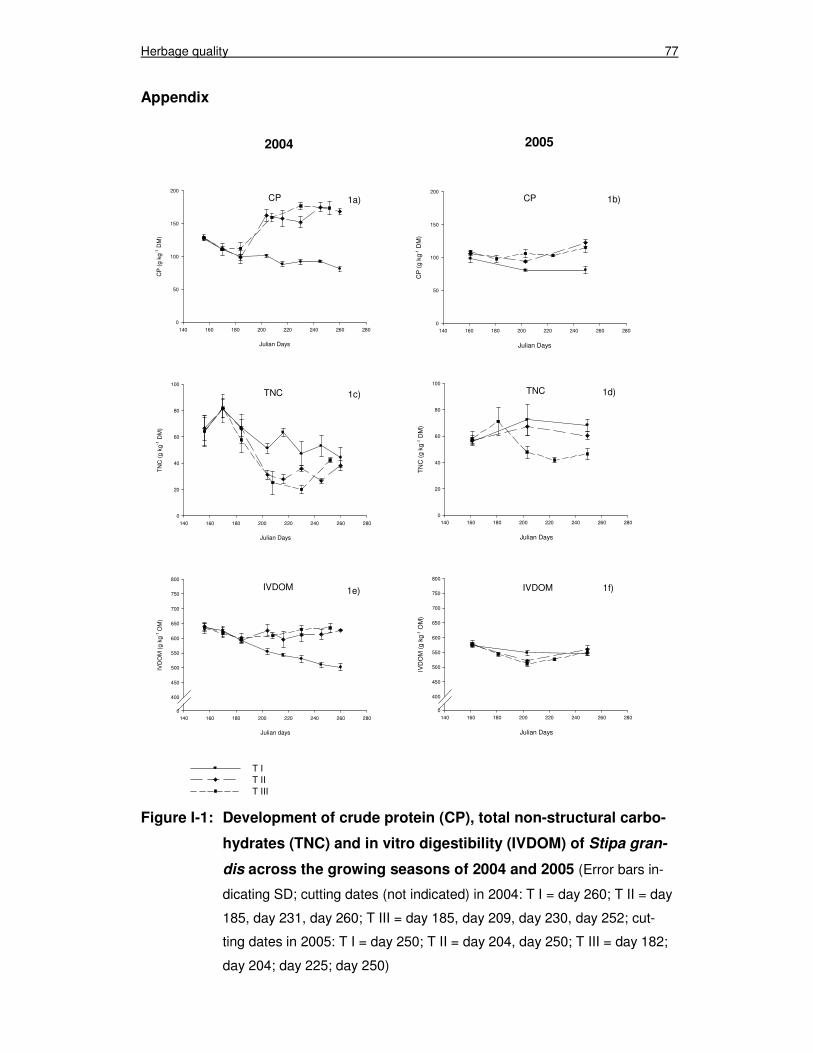
Herbage quality 77
Appendix
Figure I-1: Development of crude protein (CP), total non-structural carbo-
hydrates (TNC) and in vitro digestibility (IVDOM) of Stipa gran-
dis across the growing seasons of 2004 and 2005 (Error bars in-
dicating SD; cutting dates (not indicated) in 2004: T I = day 260; T II = day
185, day 231, day 260; T III = day 185, day 209, day 230, day 252; cut-
ting dates in 2005: T I = day 250; T II = day 204, day 250; T III = day 182;
day 204; day 225; day 250)
CP
Julian Days
140 160 180 200 220 240 260 280
CP
(g
kg-1
DM
)
0
50
100
150
200
TNC
Julian Days
140 160 180 200 220 240 260 280
TN
C (
g kg
-1 D
M)
0
20
40
60
80
100
IVDOM
Julian Days
140 160 180 200 220 240 260 280
IVD
OM
(g
kg
-1 O
M)
0
400
450
500
550
600
650
700
750
800
2004 2005
1a)
1b)
1d)
1f)
CP
Julian Days
140 160 180 200 220 240 260 280
CP
(g
kg-1
DM
)
0
50
100
150
200
1a)
Julian Days
140 160 180 200 220 240 260 280
TN
C (
g kg
-1 D
M)
0
20
40
60
80
100
1c)TNC
IVDOM
Julian days
140 160 180 200 220 240 260 280
IVD
OM
(g
kg-1
OM
)
0
400
450
500
550
600
650
700
750
800
T IT IIT III
1e)
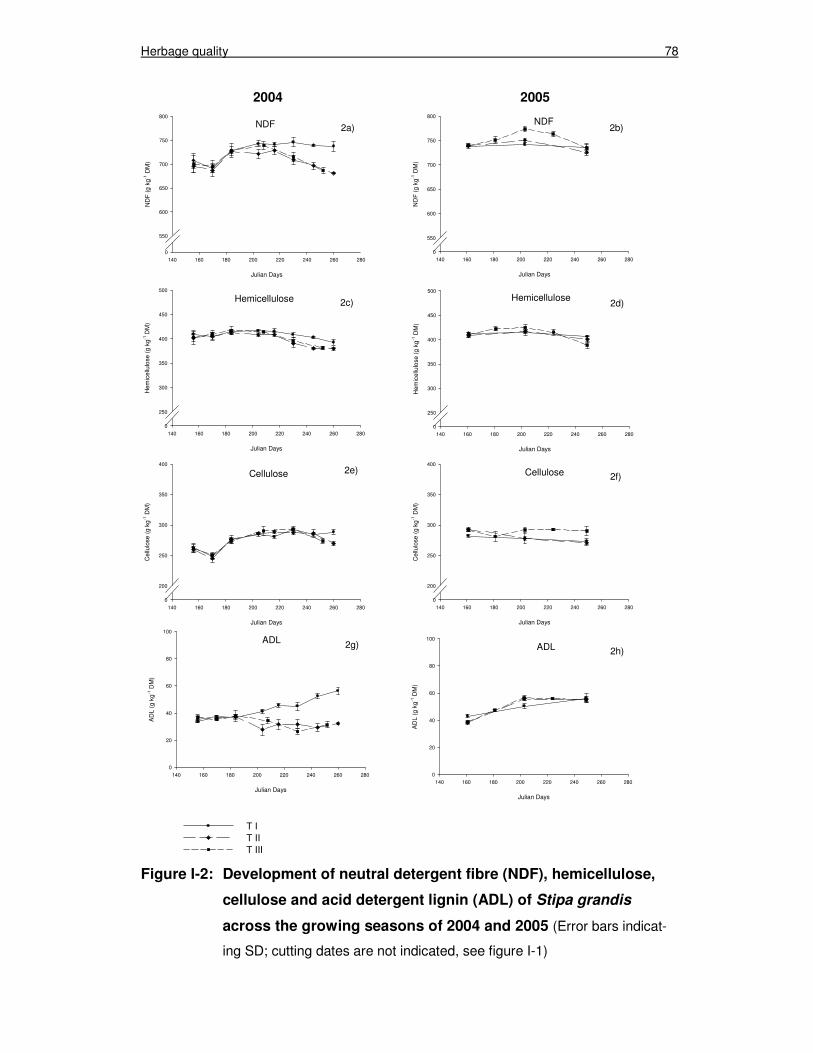
Herbage quality 78
Figure I-2: Development of neutral detergent fibre (NDF), hemicellulose,
cellulose and acid detergent lignin (ADL) of Stipa grandis
across the growing seasons of 2004 and 2005 (Error bars indicat-
ing SD; cutting dates are not indicated, see figure I-1)
NDF
Julian Days
140 160 180 200 220 240 260 280
ND
F (
g kg
-1 D
M)
0
550
600
650
700
750
800
Hemicellulose
Julian Days
140 160 180 200 220 240 260 280
Hem
icel
lulo
se (
g k
g-1
DM
)
0
250
300
350
400
450
500
Cellulose
Julian Days
140 160 180 200 220 240 260 280
Ce
llulo
se (
g kg
-1 D
M)
0
200
250
300
350
400
ADL
Julian Days
140 160 180 200 220 240 260 280
AD
L (
g k
g-1
DM
)
0
20
40
60
80
100
2b)
2d)
2f)
2h)
2004 2005
Hemicellulose
Julian Days
140 160 180 200 220 240 260 280
Hem
icel
lulo
se (
g k
g-1 D
M)
0
250
300
350
400
450
500
2c)
Cellulose
Julian Days
140 160 180 200 220 240 260 280
Ce
llulo
se (
g kg
-1 D
M)
0
200
250
300
350
4002e)
ADL
Julian Days
140 160 180 200 220 240 260 280
AD
L (
g k
g-1
DM
)
0
20
40
60
80
100
T IT IIT III
2g)
NDF
Julian Days
140 160 180 200 220 240 260 280
ND
F (
g k
g-1
DM
)
0
550
600
650
700
750
800
2a)
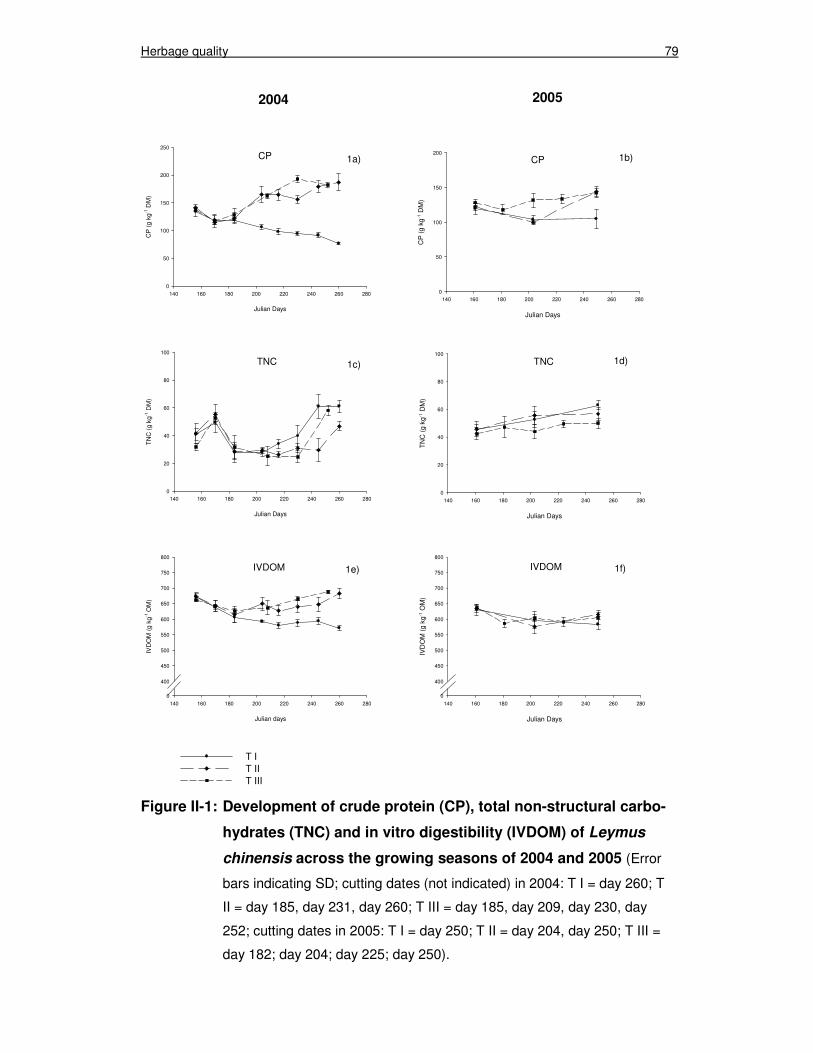
Herbage quality 79
Figure II-1: Development of crude protein (CP), total non-structural carbo-
hydrates (TNC) and in vitro digestibility (IVDOM) of Leymus
chinensis across the growing seasons of 2004 and 2005 (Error
bars indicating SD; cutting dates (not indicated) in 2004: T I = day 260; T
II = day 185, day 231, day 260; T III = day 185, day 209, day 230, day
252; cutting dates in 2005: T I = day 250; T II = day 204, day 250; T III =
day 182; day 204; day 225; day 250).
CP
Julian Days
140 160 180 200 220 240 260 280
CP
(g
kg-1
DM
)
0
50
100
150
200
TNC
Julian Days
140 160 180 200 220 240 260 280
TN
C (
g kg
-1 D
M)
0
20
40
60
80
100
IVDOM
Julian Days
140 160 180 200 220 240 260 280
IVD
OM
(g
kg-1
OM
)
0
400
450
500
550
600
650
700
750
800
2004 2005
1b)
1d)
1f)
CP
Julian Days
140 160 180 200 220 240 260 280
CP
(g
kg-1
DM
)
0
50
100
150
200
250
1a)
TNC
Julian Days
140 160 180 200 220 240 260 280
TN
C (
g kg
-1 D
M)
0
20
40
60
80
100
1c)
IVDOM
Julian days
140 160 180 200 220 240 260 280
IVD
OM
(g
kg-1
OM
)
0
400
450
500
550
600
650
700
750
800
T IT IIT III
1e)
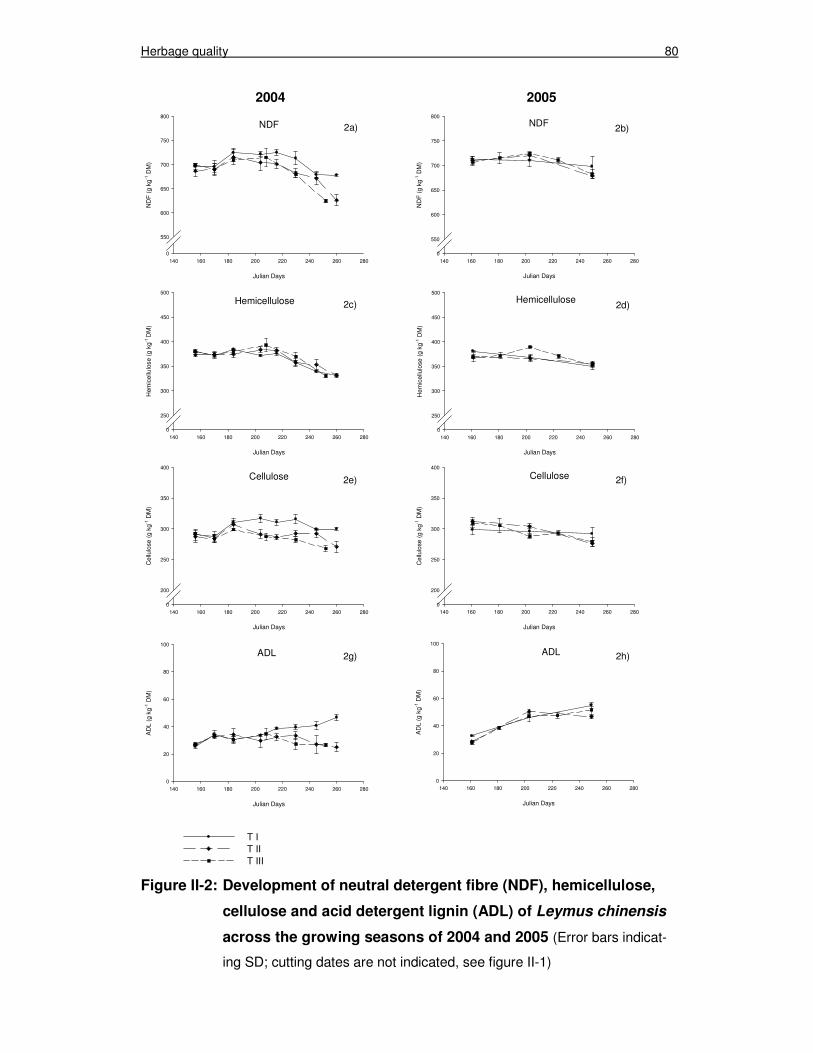
Herbage quality 80
Figure II-2: Development of neutral detergent fibre (NDF), hemicellulose,
cellulose and acid detergent lignin (ADL) of Leymus chinensis
across the growing seasons of 2004 and 2005 (Error bars indicat-
ing SD; cutting dates are not indicated, see figure II-1)
NDF
Julian Days
140 160 180 200 220 240 260 280
ND
F (
g kg
-1 D
M)
0
550
600
650
700
750
800
Hemicellulose
Julian Days
140 160 180 200 220 240 260 280
Hem
icel
lulo
se (
g kg
-1 D
M)
0
250
300
350
400
450
500
Cellulose
Julian Days
140 160 180 200 220 240 260 280
Cel
lulo
se (
g kg
-1 D
M)
0
200
250
300
350
400
ADL
Julian Days
140 160 180 200 220 240 260 280
AD
L (g
kg-1
DM
)
0
20
40
60
80
100
2b)
2d)
2f)
2h)
2004 2005
NDF
Julian Days
140 160 180 200 220 240 260 280
ND
F (
g kg
-1 D
M)
0
550
600
650
700
750
800
2a)
Hemicellulose
Julian Days
140 160 180 200 220 240 260 280
Hem
icel
lulo
se (
g kg
-1 D
M)
0
250
300
350
400
450
500
2c)
Cellulose
Julian Days
140 160 180 200 220 240 260 280
Cel
lulo
se (
g kg
-1 D
M)
0
200
250
300
350
400
2e)
ADL
Julian Days
140 160 180 200 220 240 260 280
AD
L (g
kg-1
DM
)
0
20
40
60
80
100
T IT IIT III
2g)
Chapter 4
Comparing in vivo and in vitro determined organic matter
digestibility in a grazing experiment conducted in the natural
grasslands of Inner Mongolia, China
Comparing in vivo and in vitro digestibility 82
Abstract
Herbage ingested differs substantially from herbage on offer in composition and
quality, when ruminants are grazing and selecting plants and plant parts of higher
digestibility. Therefore it can be expected that the organic matter digestibility of
herbage on offer is lower than the digestibility of the actually ingested herbage.
However, when herbage on offer is limited grazing animals are not able to select
their diet. The differences between herbage ingested and herbage on offer become
increasingly smaller the more herbage offered is ingested, what was especially
documented for temperate-humid and tropical grasslands but rarely for semi-arid
grassland. The differences in digestibility of herbage ingested and herbage on offer
can be used as criterion for dietary selection. If differences are large, animals have
selected intensively, but if differences are small, only little dietary selection oc-
curred.
A grazing experiment with 6 grazing intensities from light (1.5 sheep ha-1) to very
heavy grazing (9.0 sheep ha-1) was conducted in the natural steppe grassland of
Inner Mongolia, P.R. China. In July, August and September 2005 the digestibility of
herbage ingested was determined by the faecal-nitrogen method (FDOM). Simulta-
neously the digestibility of herbage on offer was estimated using a Cellulase-
technique (CDOM) and the Hohenheim gas test (GDOM). Additionally the amount
of herbage on offer, the proportion of green (living) biomass, and further quality
parameters of herbage on offer were determined.
Mean herbage mass on offer significantly decreased from 157 g DM m-2 in the low-
est to 60 g DM m-2 in the highest grazing intensity. The quality of herbage on offer
did not differ between grazing intensities, but decreased with proceeding vegetation
period. Neither FDOM, nor CDOM or GDOM were influenced by grazing intensity,
but decreased from July to September. CDOM constantly overestimated the FDOM
by 3.9%-points. GDOM overestimated the FDOM in July, but in August and Sep-
tember GDOM and FDOM did not differ or differed only slightly by 1%-point.
GDOM corresponded well with FDOM in August and September in all grazing in-
tensities, disproving the hypothesis that herbage on offer is less digestible than
herbage ingested when herbage on offer is abundant. The correspondence be-
tween FDOM and GDOM demonstrated that herbage ingested and herbage on
offer did not differ substantially from each other in the present study, suggesting
that no or only little selection occurred. The applied estimation equation for CDOM
Comparing in vivo and in vitro digestibility 83
turned out to be unsuitable for the analysed herbage material, indicating a system-
atic prediction error.
1. Introduction
Organic matter digestibility (OMD) is the crucial quality parameter to characterise
feeds and their value in animal nutrition. In vivo feeding trials are the ultimate
method to measure the OMD, but in vivo methods are laborious and expensive.
Therefore several in vitro methods, which are generally more efficient and repro-
ducible than in vivo measurements, have been developed to estimate the OMD of
feeds. The in vitro methods can be divided into methods still depending on the ani-
mal like gas production- (Menke et al., 1979; Pell and Schofield, 1993; Theodorou
et al., 1994) and two-stage technique (Tilley and Terry, 1963), and enzymatic
methods independent from the animal (Jones and Hayward, 1975; McLeod and
Minson, 1978; De Boever et al., 1986). Nevertheless in vitro methods always de-
pend on in vivo experiments to derive and validate equations for the estimation of
OMD.
A particular challenge is the OMD determination in grazing experiments, because it
is difficult to determine what free-ranging animals are actually ingesting, both quan-
titative and qualitative. To determine OMD of herbage ingested while grazing, indi-
rect methods using indigestible markers such as acid-insoluble ash (Minson, 1990)
or n-alkanes (Dove and Coombe, 1992) can be used. But methods based on indi-
gestible markers rely on representative sampling of herbage and faeces, as do in
vitro methods. Since ruminants are able to select their diet by preferring plants and
plant parts of higher digestibility (Arnold, 1960; Lu, 1988; Jung and Sahlu, 1989), a
discrepancy between herbage on offer and herbage ingested occurs. To get repre-
sentative samples of herbage ingested many workers have used oesophageal fistu-
lated animals, which is the only method to get samples of herbage actually ingested
by an animal (Van Dyne and Torell, 1964; Schlecht et al., 1999; Coates and Pen-
ning, 2000). A less complex, but less accurate method is the hand-plucking method
(Penning et al., 1991), where animals are observed in their grazing behaviour and
samples of herbage are plucked from the sward in an attempt to mimic the inges-
tive behaviour of the animals. A further possibility to predict the OMD of herbage
ingested is the use of faecal indices such as nitrogen (N) or chromogen (Rymer,
2000). In vivo determined digestibility is related to a faecal component and a re-
gression can be established between in vivo digestibility and the component’s con-
Comparing in vivo and in vitro digestibility 84
centration in the faeces. After establishing the regression herbage samples are not
required anymore. The most common used component is N, which has been used
successfully in several studies and is known as the faecal-N method (Lancaster,
1949; Corbett, 1960; Thomas and Campling, 1976; Schmidt and Jentsch, 1994;
Lukas et al., 2005; Schlecht and Susenbeth, 2006).
From the grassland science point of view, a representative herbage sample repre-
sents the herbage on offer, which may also be defined as herbage yield. As ex-
plained above herbage on offer normally differs considerably from herbage in-
gested (Coates and Penning, 2000). If the OMD of herbage on offer is estimated to
define herbage quality, it is obvious that this estimate does not represent the OMD
of herbage ingested. However there is one constraint: two situations of herbage
availability are conceivable, i.e. abundant herbage on offer and limited herbage on
offer. When enough herbage is available, the animals will select their diet, but if
herbage on offer is limited the animals need to ingest the herbage available in at-
tempt to satisfy their nutritional requirements (Bryant et al., 1970). This relationship
has been mainly investigated in temperate-humid (Hamilton et al., 1973; Jung et al.,
1989) and tropical (Chacon and Stobbs, 1976) grasslands, but less information is
available for semi-arid grasslands that produce only few herbage of poor quality.
The hypothesis of the present study is that in semi-arid grasslands, because of the
generally low herbage quality, the selectivity of the grazing animals is high and
therefore the OMD of herbage ingested in grazing situations with abundant herbage
on offer will be higher than the OMD of herbage on offer. However, if herbage on
offer is limited, due to high grazing intensity for example, the OMD of herbage in-
gested and the OMD of herbage on offer will converge as it has been observed in
indoor feeding trials (Cherney et al., 1990).
The discrepancy between OMD of herbage ingested and OMD of herbage on offer
was additionally used as a criterion for dietary selection (Hamilton et al., 1973; Jung
et al., 1989; Schmidt et al., 1999). This means that at large discrepancy the animals
are selecting intensively, but at low or without discrepancy herbage on offer does
not differ from herbage ingested and no selection occurs, or is not detectable.
A grazing experiment was initiated in 2005 in the semi-arid grasslands of Inner
Mongolia, P.R. China. Six grazing intensities from light to very heavy grazing (1.5,
3.0, 4.5, 6.0, 7.5, 9.0 sheep ha-1) and their impact on the grassland ecosystem
were assessed, offering the opportunity to test the proposed hypothesis against a
wide range of herbage availabilities. Results from the grazing period of 2005 are
presented.
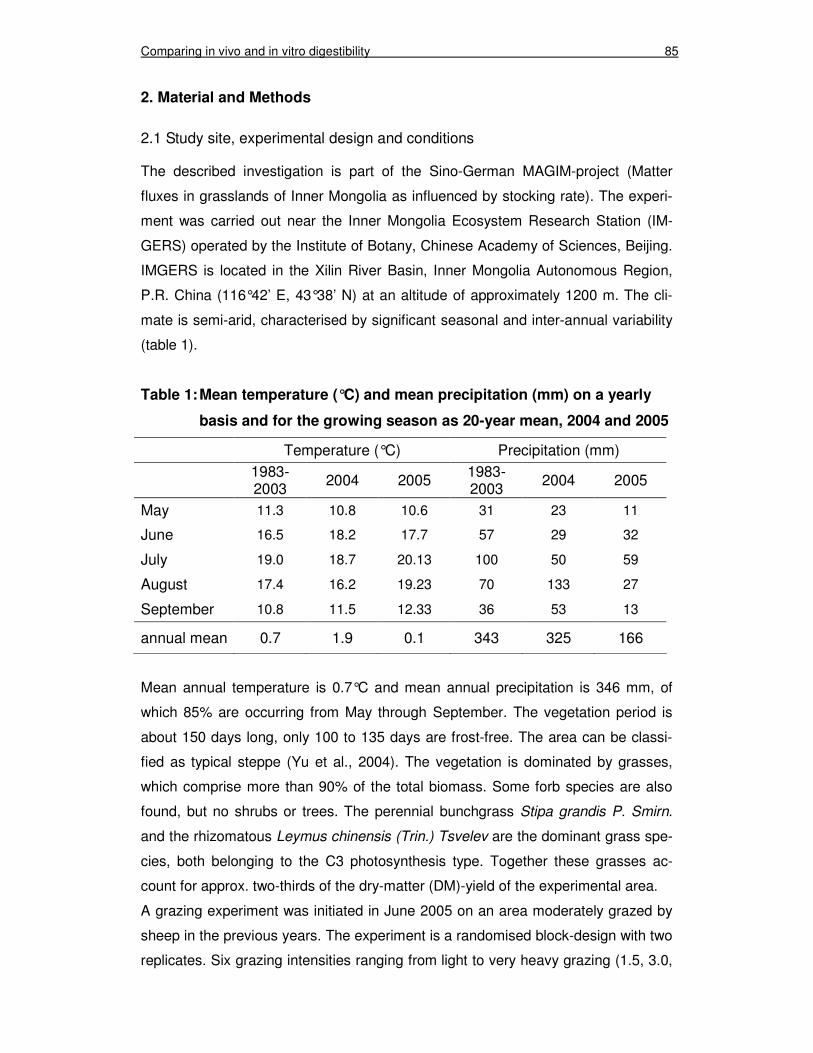
Comparing in vivo and in vitro digestibility 85
2. Material and Methods
2.1 Study site, experimental design and conditions
The described investigation is part of the Sino-German MAGIM-project (Matter
fluxes in grasslands of Inner Mongolia as influenced by stocking rate). The experi-
ment was carried out near the Inner Mongolia Ecosystem Research Station (IM-
GERS) operated by the Institute of Botany, Chinese Academy of Sciences, Beijing.
IMGERS is located in the Xilin River Basin, Inner Mongolia Autonomous Region,
P.R. China (116°42’ E, 43°38’ N) at an altitude of approximately 1200 m. The cli-
mate is semi-arid, characterised by significant seasonal and inter-annual variability
(table 1).
Table 1: Mean temperature (°C) and mean precipitation (mm) on a yearly
basis and for the growing season as 20-year mean, 2004 and 2005
Temperature (°C) Precipitation (mm)
1983-2003
2004 2005 1983-2003
2004 2005
May 11.3 10.8 10.6 31 23 11
June 16.5 18.2 17.7 57 29 32
July 19.0 18.7 20.13 100 50 59
August 17.4 16.2 19.23 70 133 27
September 10.8 11.5 12.33 36 53 13
annual mean 0.7 1.9 0.1 343 325 166
Mean annual temperature is 0.7°C and mean annual precipitation is 346 mm, of
which 85% are occurring from May through September. The vegetation period is
about 150 days long, only 100 to 135 days are frost-free. The area can be classi-
fied as typical steppe (Yu et al., 2004). The vegetation is dominated by grasses,
which comprise more than 90% of the total biomass. Some forb species are also
found, but no shrubs or trees. The perennial bunchgrass Stipa grandis P. Smirn.
and the rhizomatous Leymus chinensis (Trin.) Tsvelev are the dominant grass spe-
cies, both belonging to the C3 photosynthesis type. Together these grasses ac-
count for approx. two-thirds of the dry-matter (DM)-yield of the experimental area.
A grazing experiment was initiated in June 2005 on an area moderately grazed by
sheep in the previous years. The experiment is a randomised block-design with two
replicates. Six grazing intensities ranging from light to very heavy grazing (1.5, 3.0,
Comparing in vivo and in vitro digestibility 86
4.5, 6.0, 7.5 and 9.0 sheep ha-1) are compared in terms of their impact on the
steppe ecosystem. Wang et al. (1999) defined an optimal stocking rate of 3 sheep
ha-1 for a similar, but less productive herbage sward in the Xilin River Basin, using
mature wethers. In the present study female sheep aged 15 month were used,
which were smaller and lighter than mature wethers. Therefore the grazing intensi-
ties chosen can be classified as light (1.5 and 3.0 sheep ha-1), moderate (4.5 and
6.0 sheep ha-1) and heavy (7.5 and 9.0 sheep ha-1) grazing intensities. Sheep were
chosen, as they are the most frequent livestock in Inner Mongolia grazing the natu-
ral grassland. Groups of 6 to 18 sheep from a local fat-tailed breed grazed 12 pad-
docks (6 grazing intensities x 2 replicates) continuously from June through Sep-
tember. The female, non-lactating and non-pregnant sheep had an average body
weight of 31.6 kg (SD ± 4.8) in the beginning of the experiment. Sheep were not
supplemented, had free access to water and minerals and were treated against
endoparasites prior to the start of the experiment. Sampling periods were the 11th
to the 15th July, 8th to 12th August and 12th to 16th September 2005.
2.2 Herbage sampling and analysis
Herbage on offer was defined as standing biomass cut to 1 cm stubble height, what
was assumed to be the minimum bite height of a sheep under restricted but not
starving conditions. Litter (dead biomass spread on the ground) was not included,
but all standing dead biomass was sampled with the living biomass. The herbage
on offer samples were taken only once during the sampling periods. In each pad-
dock one sample was obtained from 3 sub-samples, taken from 0.5 m² (0.25 x 2 m)
sized transects at previously defined representative areas. The 3 sub-samples
were pooled and weighed. From the bulk sample an additional sample (ca. 40-50 g)
was taken to separate green (living) herbage from dead herbage. Afterwards all
samples were dried at 60°C for 24 h in a forced-air drying-oven and dry-weight was
determined. The dried bulk samples were ground with a cyclotec mill (Tecator,
Germany) to pass through a 1 mm screen. The quality of herbage samples was
determined by means of Near-Infrared-Spectroscopy (NIRS). All samples were
scanned twice with a NIR-Systems 5000 monochromator (Perstrop Analytical Inc.,
Silver Spring, MD, USA) over a wavelength range from 1100 to 2500 nm in 2 nm
intervals. The software NIRS 2 by Infrasoft International® (ISI, Port Mathilda, PA,
USA) was used for scanning, mathematical processing, calibration and statistical
analysis of the spectra data. The laboratory analyses were carried out on calibra-
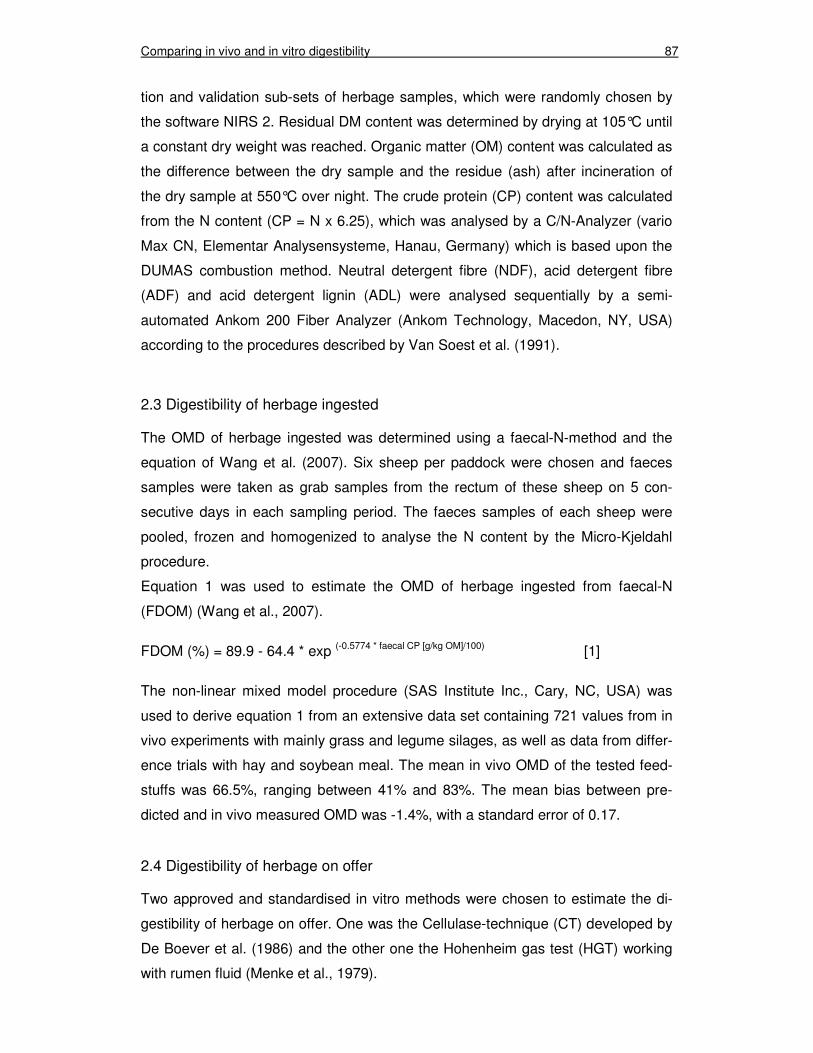
Comparing in vivo and in vitro digestibility 87
tion and validation sub-sets of herbage samples, which were randomly chosen by
the software NIRS 2. Residual DM content was determined by drying at 105°C until
a constant dry weight was reached. Organic matter (OM) content was calculated as
the difference between the dry sample and the residue (ash) after incineration of
the dry sample at 550°C over night. The crude protein (CP) content was calculated
from the N content (CP = N x 6.25), which was analysed by a C/N-Analyzer (vario
Max CN, Elementar Analysensysteme, Hanau, Germany) which is based upon the
DUMAS combustion method. Neutral detergent fibre (NDF), acid detergent fibre
(ADF) and acid detergent lignin (ADL) were analysed sequentially by a semi-
automated Ankom 200 Fiber Analyzer (Ankom Technology, Macedon, NY, USA)
according to the procedures described by Van Soest et al. (1991).
2.3 Digestibility of herbage ingested
The OMD of herbage ingested was determined using a faecal-N-method and the
equation of Wang et al. (2007). Six sheep per paddock were chosen and faeces
samples were taken as grab samples from the rectum of these sheep on 5 con-
secutive days in each sampling period. The faeces samples of each sheep were
pooled, frozen and homogenized to analyse the N content by the Micro-Kjeldahl
procedure.
Equation 1 was used to estimate the OMD of herbage ingested from faecal-N
(FDOM) (Wang et al., 2007).
FDOM (%) = 89.9 - 64.4 * exp (-0.5774 * faecal CP [g/kg OM]/100) [1]
The non-linear mixed model procedure (SAS Institute Inc., Cary, NC, USA) was
used to derive equation 1 from an extensive data set containing 721 values from in
vivo experiments with mainly grass and legume silages, as well as data from differ-
ence trials with hay and soybean meal. The mean in vivo OMD of the tested feed-
stuffs was 66.5%, ranging between 41% and 83%. The mean bias between pre-
dicted and in vivo measured OMD was -1.4%, with a standard error of 0.17.
2.4 Digestibility of herbage on offer
Two approved and standardised in vitro methods were chosen to estimate the di-
gestibility of herbage on offer. One was the Cellulase-technique (CT) developed by
De Boever et al. (1986) and the other one the Hohenheim gas test (HGT) working
with rumen fluid (Menke et al., 1979).
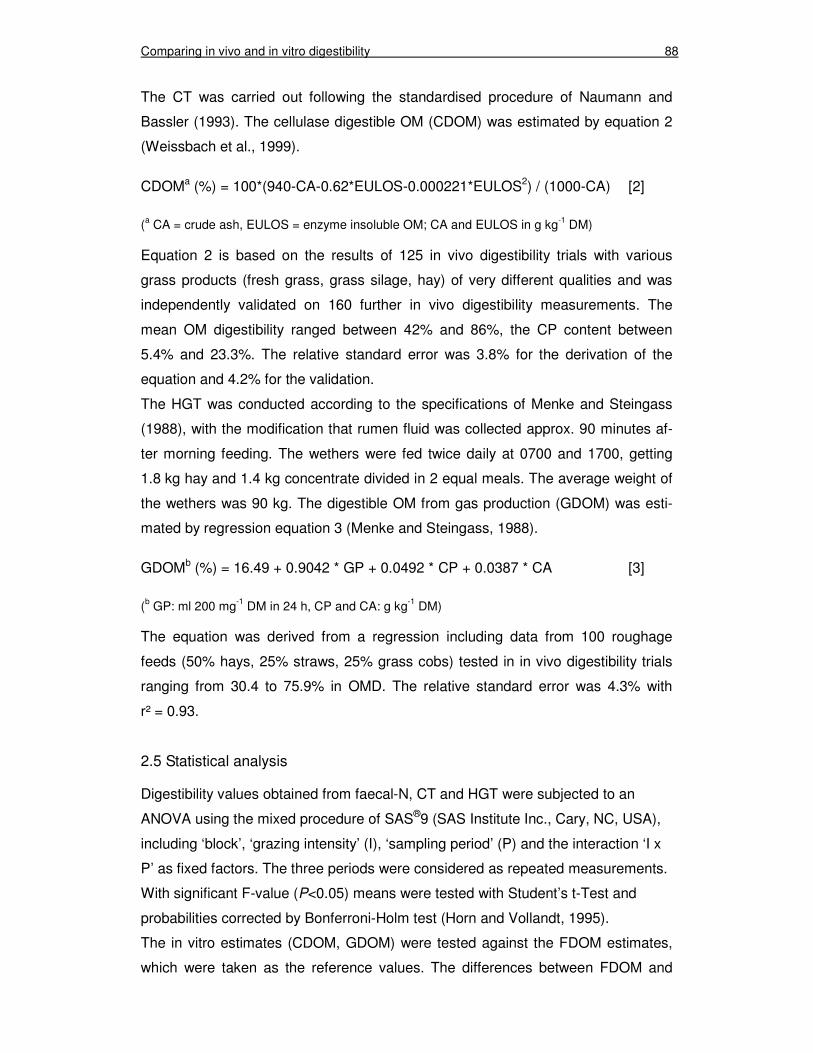
Comparing in vivo and in vitro digestibility 88
The CT was carried out following the standardised procedure of Naumann and
Bassler (1993). The cellulase digestible OM (CDOM) was estimated by equation 2
(Weissbach et al., 1999).
CDOMa (%) = 100*(940-CA-0.62*EULOS-0.000221*EULOS2) / (1000-CA) [2]
(a CA = crude ash, EULOS = enzyme insoluble OM; CA and EULOS in g kg-1 DM)
Equation 2 is based on the results of 125 in vivo digestibility trials with various
grass products (fresh grass, grass silage, hay) of very different qualities and was
independently validated on 160 further in vivo digestibility measurements. The
mean OM digestibility ranged between 42% and 86%, the CP content between
5.4% and 23.3%. The relative standard error was 3.8% for the derivation of the
equation and 4.2% for the validation.
The HGT was conducted according to the specifications of Menke and Steingass
(1988), with the modification that rumen fluid was collected approx. 90 minutes af-
ter morning feeding. The wethers were fed twice daily at 0700 and 1700, getting
1.8 kg hay and 1.4 kg concentrate divided in 2 equal meals. The average weight of
the wethers was 90 kg. The digestible OM from gas production (GDOM) was esti-
mated by regression equation 3 (Menke and Steingass, 1988).
GDOMb (%) = 16.49 + 0.9042 * GP + 0.0492 * CP + 0.0387 * CA [3]
(b GP: ml 200 mg-1 DM in 24 h, CP and CA: g kg-1 DM)
The equation was derived from a regression including data from 100 roughage
feeds (50% hays, 25% straws, 25% grass cobs) tested in in vivo digestibility trials
ranging from 30.4 to 75.9% in OMD. The relative standard error was 4.3% with
r² = 0.93.
2.5 Statistical analysis
Digestibility values obtained from faecal-N, CT and HGT were subjected to an
ANOVA using the mixed procedure of SAS®9 (SAS Institute Inc., Cary, NC, USA),
including ‘block’, ‘grazing intensity’ (I), ‘sampling period’ (P) and the interaction ‘I x
P’ as fixed factors. The three periods were considered as repeated measurements.
With significant F-value (P<0.05) means were tested with Student’s t-Test and
probabilities corrected by Bonferroni-Holm test (Horn and Vollandt, 1995).
The in vitro estimates (CDOM, GDOM) were tested against the FDOM estimates,
which were taken as the reference values. The differences between FDOM and
Comparing in vivo and in vitro digestibility 89
CDOM, and the differences between FDOM and GDOM were also subjected to an
ANOVA using the same model as before. By means of Student’s t-test it was tested
if the differences were to separate from zero. Furthermore it was investigated if the
differences between FDOM and in vitro estimates were significantly different from
zero as a mean of all intensities and periods.
3. Results
3.1 Herbage on offer
The factors ‘grazing intensity’ and ‘sampling period’ were significant for herbage on
offer, but the interaction ‘I x P’ was not significant. Herbage on offer decreased with
increasing grazing intensity (table 2). However, the differences between grazing
intensities were only significant between 1.5 sheep ha-1 and 7.5 sheep ha-1. Mean
herbage on offer in July and August was 104 g m-2 and 100 g m-2, respectively. In
September herbage on offer decreased significantly to 71 g m-2. The green herb-
age proportion of herbage on offer was not influenced by grazing intensity, but
green herbage proportion decreased significantly from 95% in July to 82% and 79%
in August and September, respectively.
Table 2: Herbage on offer and proportion of green herbage at sampling
periods in July, August and September 2005
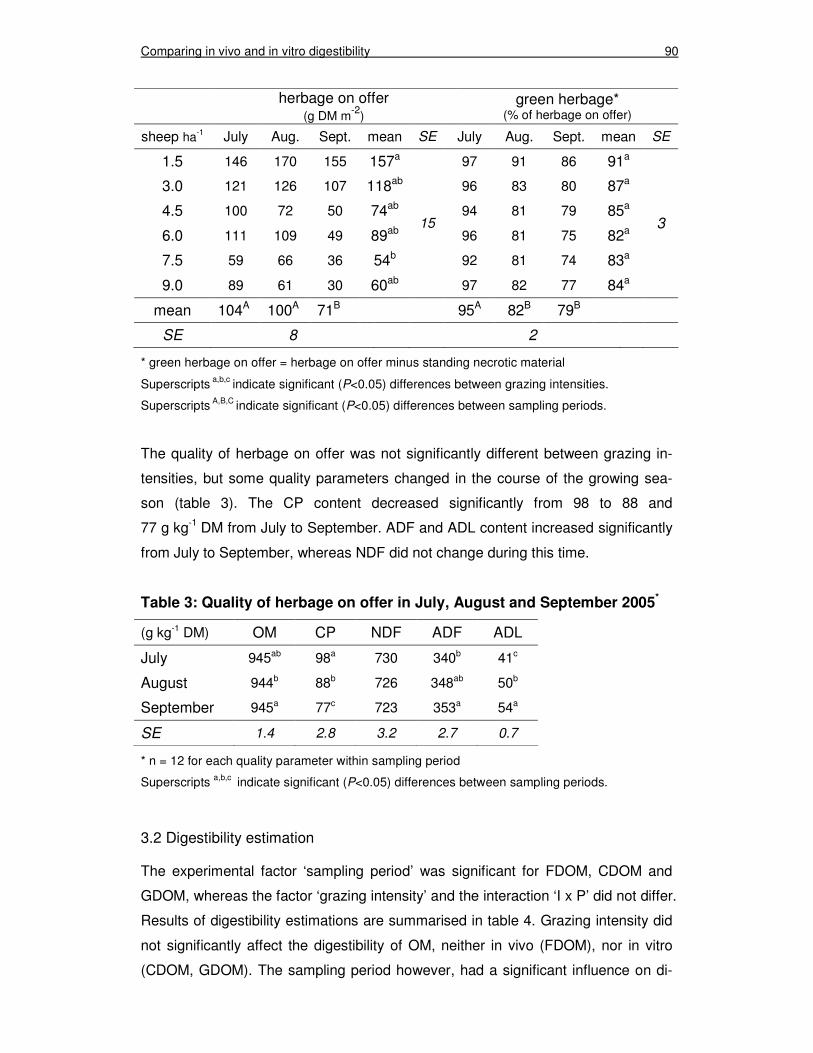
Comparing in vivo and in vitro digestibility 90
herbage on offer (g DM m-2)
green herbage* (% of herbage on offer)
sheep ha-1 July Aug. Sept. mean SE July Aug. Sept. mean SE
1.5 146 170 155 157a 97 91 86 91a
3.0 121 126 107 118ab 96 83 80 87a
4.5 100 72 50 74ab 94 81 79 85a
6.0 111 109 49 89ab 96 81 75 82a
7.5 59 66 36 54b 92 81 74 83a
9.0 89 61 30 60ab
15
97 82 77 84a
3
mean 104A 100A 71B 95A 82B 79B
SE 8 2
* green herbage on offer = herbage on offer minus standing necrotic material
Superscripts a,b,c indicate significant (P<0.05) differences between grazing intensities.
Superscripts A,B,C indicate significant (P<0.05) differences between sampling periods.
The quality of herbage on offer was not significantly different between grazing in-
tensities, but some quality parameters changed in the course of the growing sea-
son (table 3). The CP content decreased significantly from 98 to 88 and
77 g kg-1 DM from July to September. ADF and ADL content increased significantly
from July to September, whereas NDF did not change during this time.
Table 3: Quality of herbage on offer in July, August and September 2005*
(g kg-1 DM) OM CP NDF ADF ADL
July 945ab 98a 730 340b 41c
August 944b 88b 726 348ab 50b
September 945a 77c 723 353a 54a
SE 1.4 2.8 3.2 2.7 0.7
* n = 12 for each quality parameter within sampling period
Superscripts a,b,c indicate significant (P<0.05) differences between sampling periods.
3.2 Digestibility estimation
The experimental factor ‘sampling period’ was significant for FDOM, CDOM and
GDOM, whereas the factor ‘grazing intensity’ and the interaction ‘I x P’ did not differ.
Results of digestibility estimations are summarised in table 4. Grazing intensity did
not significantly affect the digestibility of OM, neither in vivo (FDOM), nor in vitro
(CDOM, GDOM). The sampling period however, had a significant influence on di-
Comparing in vivo and in vitro digestibility 91
gestibility, since the digestibility decreased as the vegetation period proceeded.
The mean FDOM significantly decreased from 56.5% in July to 55.6% and 53.8% in
August and September, respectively. The mean CDOM ranged between 60.3% and
57.8% and a significant decrease was observed only in September. The mean
GDOM indicated the widest range of digestibility estimates of all methods, ranging
from 60.5% to 52.9%, so that the differences in mean GDOM were significant be-
tween all sampling periods.
The differences between FDOM and CDOM, as well as the differences between
FDOM and GDOM were tested against zero to determine if significant differences
exist between the digestibility estimations. For each sampling period the gradients
for the 3 digestibility estimations over the 6 grazing intensities are demonstrated in
figure 1 and the statistical ratios are given in table 5. In July CDOM and GDOM
overestimated FDOM on average by 3.8%- and 4.0%-points. The differences be-
tween FDOM and in vitro estimates were significantly different from zero, but the in
vitro estimates did not differ among each other. In August CDOM still overestimated
FDOM on average by 3.9%-points, but GDOM could not be separated statistically
from FDOM. In September CDOM still overestimated FDOM rather constantly by
approx. 4.0%-points over all grazing intensities, whereas GDOM slightly underesti-
mated FDOM by 1.0%-point, especially in the lowest and the highest grazing inten-
sity.
To evaluate if CDOM and GDOM differ significantly from FDOM irrespective of the
sampling period, estimates were tested over all grazing intensities and all sampling
periods.
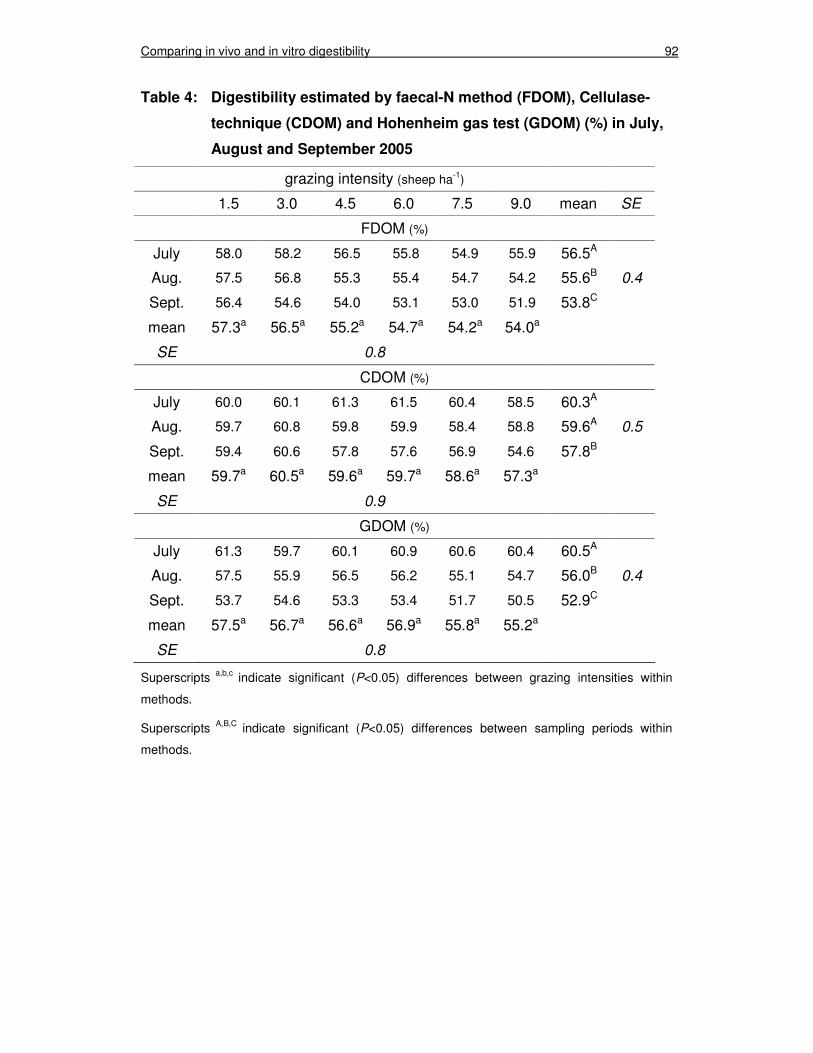
Comparing in vivo and in vitro digestibility 92
Table 4: Digestibility estimated by faecal-N method (FDOM), Cellulase-
technique (CDOM) and Hohenheim gas test (GDOM) (%) in July,
August and September 2005
grazing intensity (sheep ha-1)
1.5 3.0 4.5 6.0 7.5 9.0 mean SE
FDOM (%)
July 58.0 58.2 56.5 55.8 54.9 55.9 56.5A
Aug. 57.5 56.8 55.3 55.4 54.7 54.2 55.6B
Sept. 56.4 54.6 54.0 53.1 53.0 51.9 53.8C
0.4
mean 57.3a 56.5a 55.2a 54.7a 54.2a 54.0a
SE 0.8
CDOM (%)
July 60.0 60.1 61.3 61.5 60.4 58.5 60.3A
Aug. 59.7 60.8 59.8 59.9 58.4 58.8 59.6A
Sept. 59.4 60.6 57.8 57.6 56.9 54.6 57.8B
0.5
mean 59.7a 60.5a 59.6a 59.7a 58.6a 57.3a
SE 0.9
GDOM (%)
July 61.3 59.7 60.1 60.9 60.6 60.4 60.5A
Aug. 57.5 55.9 56.5 56.2 55.1 54.7 56.0B
Sept. 53.7 54.6 53.3 53.4 51.7 50.5 52.9C
0.4
mean 57.5a 56.7a 56.6a 56.9a 55.8a 55.2a
SE 0.8
Superscripts a,b,c indicate significant (P<0.05) differences between grazing intensities within
methods.
Superscripts A,B,C indicate significant (P<0.05) differences between sampling periods within
methods.
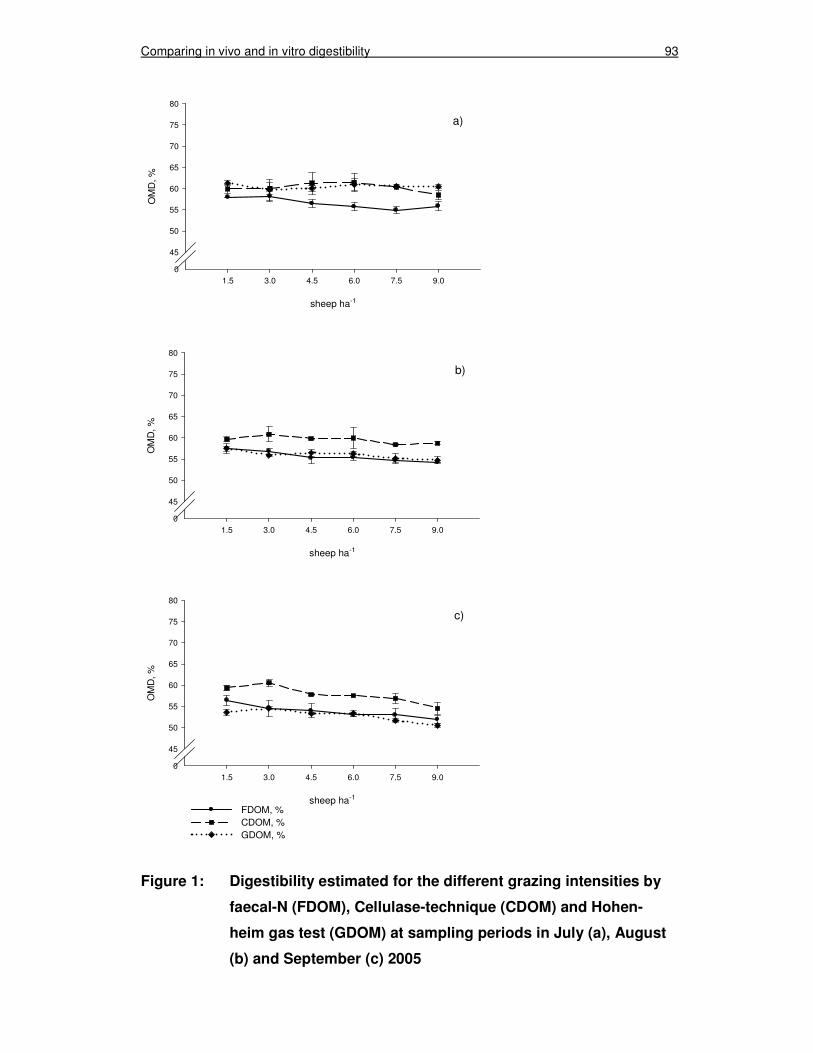
Comparing in vivo and in vitro digestibility 93
Figure 1: Digestibility estimated for the different grazing intensities by
faecal-N (FDOM), Cellulase-technique (CDOM) and Hohen-
heim gas test (GDOM) at sampling periods in July (a), August
(b) and September (c) 2005
a)
sheep ha-1
1.5 3.0 4.5 6.0 7.5 9.0
OM
D, %
0
45
50
55
60
65
70
75
80
b)
sheep ha-1
1.5 3.0 4.5 6.0 7.5 9.0
OM
D, %
0
45
50
55
60
65
70
75
80
c)
sheep ha-1
1.5 3.0 4.5 6.0 7.5 9.0
OM
D, %
0
45
50
55
60
65
70
75
80
FDOM, %CDOM, %GDOM, %
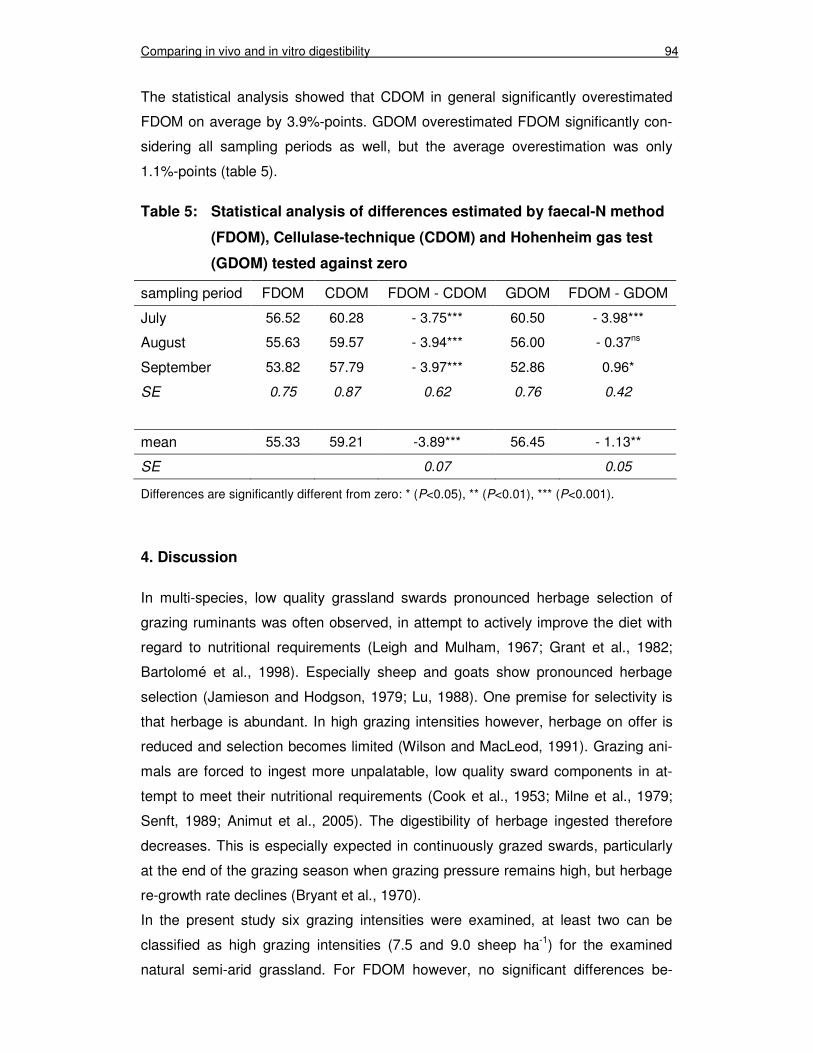
Comparing in vivo and in vitro digestibility 94
The statistical analysis showed that CDOM in general significantly overestimated
FDOM on average by 3.9%-points. GDOM overestimated FDOM significantly con-
sidering all sampling periods as well, but the average overestimation was only
1.1%-points (table 5).
Table 5: Statistical analysis of differences estimated by faecal-N method
(FDOM), Cellulase-technique (CDOM) and Hohenheim gas test
(GDOM) tested against zero
sampling period FDOM CDOM FDOM - CDOM GDOM FDOM - GDOM
July 56.52 60.28 - 3.75*** 60.50 - 3.98***
August 55.63 59.57 - 3.94*** 56.00 - 0.37ns
September 53.82 57.79 - 3.97*** 52.86 0.96*
SE 0.75 0.87 0.62 0.76 0.42
mean 55.33 59.21 -3.89*** 56.45 - 1.13**
SE 0.07 0.05
Differences are significantly different from zero: * (P<0.05), ** (P<0.01), *** (P<0.001).
4. Discussion
In multi-species, low quality grassland swards pronounced herbage selection of
grazing ruminants was often observed, in attempt to actively improve the diet with
regard to nutritional requirements (Leigh and Mulham, 1967; Grant et al., 1982;
Bartolomé et al., 1998). Especially sheep and goats show pronounced herbage
selection (Jamieson and Hodgson, 1979; Lu, 1988). One premise for selectivity is
that herbage is abundant. In high grazing intensities however, herbage on offer is
reduced and selection becomes limited (Wilson and MacLeod, 1991). Grazing ani-
mals are forced to ingest more unpalatable, low quality sward components in at-
tempt to meet their nutritional requirements (Cook et al., 1953; Milne et al., 1979;
Senft, 1989; Animut et al., 2005). The digestibility of herbage ingested therefore
decreases. This is especially expected in continuously grazed swards, particularly
at the end of the grazing season when grazing pressure remains high, but herbage
re-growth rate declines (Bryant et al., 1970).
In the present study six grazing intensities were examined, at least two can be
classified as high grazing intensities (7.5 and 9.0 sheep ha-1) for the examined
natural semi-arid grassland. For FDOM however, no significant differences be-
Comparing in vivo and in vitro digestibility 95
tween grazing intensities were indicated, only between sampling periods (table 4).
Herbage on offer decreased significantly with increasing grazing intensity, so this
precondition for the expected decrease in digestibility of herbage ingested was met.
Hamilton et al. (1973) have pointed out that the digestibility of herbage ingested is
closely related to green herbage yield, which they found to be decreasing when
herbage on offer was reduced. Jung and Sahlu (1989) have observed less green
herbage on offer in a more intensively grazed sward compared to a lightly grazed
one. Simultaneously these authors observed higher digestibility of herbage in-
gested for sheep grazing at light intensity, what they attribute to the superior
chances to select high digestible green herbage. As demonstrated in table 2 the
green herbage proportion of herbage on offer was not significantly influenced by
grazing intensity, only the sampling date had a significant influence. This result un-
derlines the observation made for the digestibility of herbage ingested. If the
amount of green herbage on offer did not significantly change between grazing in-
tensities, all sheep were offered the same proportion of green herbage mass in
relation to mass of herbage on offer. This suggests that sheep did not, or only to a
small extend, select between green and dead herbage on offer.
Although it was reported that sheep still select their diet when herbage on offer was
limited, it seems that the sheep in the present study rather optimised their intake
than the quality of their diet (Broom and Arnold, 1986; Garcia et al., 2003). Signifi-
cant differences in herbage intake per sheep and day between grazing intensities
were not observed in this experiment, what supports this assumption (Glindemann
et al., 2007).
Digestibility of herbage ingested can also be influenced by herbage intake. Namely
high intake rates are expected to result in faster ruminal passage rates, reducing
the digestibility of herbage ingested (Van Soest, 1994). Since intake rate was not
significantly altered between grazing intensities, it is unlikely that the digestibility of
herbage ingested was affected by passage rate in this experiment.
The quality of herbage on offer was also not significantly influenced by grazing in-
tensity (table 3). Herbage quality was characterised by high and constant cell wall
contents (> 700 g NDF kg-1 DM) over the vegetation period. The CP content de-
creased significantly from July to September, but never fell below 70 g kg-1 DM,
what has been defined as the minimum content for efficient ruminal fermentation
(Van Soest, 1994). ADL increased significantly from July to September, as a result
of plant maturing processes. Decreasing CP and increasing ADL account for the
Comparing in vivo and in vitro digestibility 96
decline in digestibility of herbage on offer as the vegetation period proceeded (Min-
son, 1990).
For light to moderate grazing intensities increasing quality of herbage on offer was
observed (Arnold, 1960; Schlegel et al., 2000). Through grazing less grass plants
become reproductive and therefore the proportion of the less digestible stem frac-
tion is increasing to a lesser extend (Terry and Tilley, 1964; Laredo and Minson,
1975). For high grazing intensities (were feed intake exceeds re-growth potential)
however, a reduction in green material was observed, which resulted in reduced
quality of herbage on offer (Cook et al., 1953; Hamilton et al., 1973; Chacon and
Stobbs, 1976; Animut et al., 2005). The reason for this reduction is that only lower,
less digestible layers of the sward are left and still available to the grazing animals
(Blaser et al., 1960). The major influence on the quality of herbage on offer is the
proportion of green herbage. It was demonstrated that the green herbage propor-
tion of herbage on offer was constant for all grazing intensities, what explains the
small influence of grazing intensity on the quality of herbage on offer.
Selective behaviour was often observed in sheep, raising the question why selec-
tion could not be observed in the present study, although such a large gradient of
grazing intensities was examined. Selectivity might be reduced, when the sward
composition is rather homogenous (Arnold, 1981). This is unlikely to occur in multi-
species grassland swards which are continuously grazed. It has been widely dem-
onstrated that grazing results in patchy structures of grazed and ungrazed areas,
resulting in areas of high and low herbage quality (Bakker et al., 1983; Willms et al.,
1988). Particularly when herbage was abundant clear structures have been ob-
served, whereas in more intensively grazed swards the structures were less signifi-
cant. In the present study grazing started in mid-June 2005 and the sward condi-
tions were the same for all grazing intensities as it was the first experimental year.
On average 80 g DM m-2 of herbage were offered in June. The horizontal structure
was not examined, but from observation it can be reported that patchy structures
occurred in the moderate and high grazing intensities, but were not very stable due
to marginal re-growth of herbage as influenced by the persistent drought in 2005
(table1). In the light grazing intensities clear patch structures were hardly observed,
except close to the watering places.
Looking at the vertical quality structure of the two dominant species S. grandis and
L. chinensis (table 6) in an additional experiment in July 2005, it is likely that due to
a homogenous vertical quality structure the sheep were limited in their selection
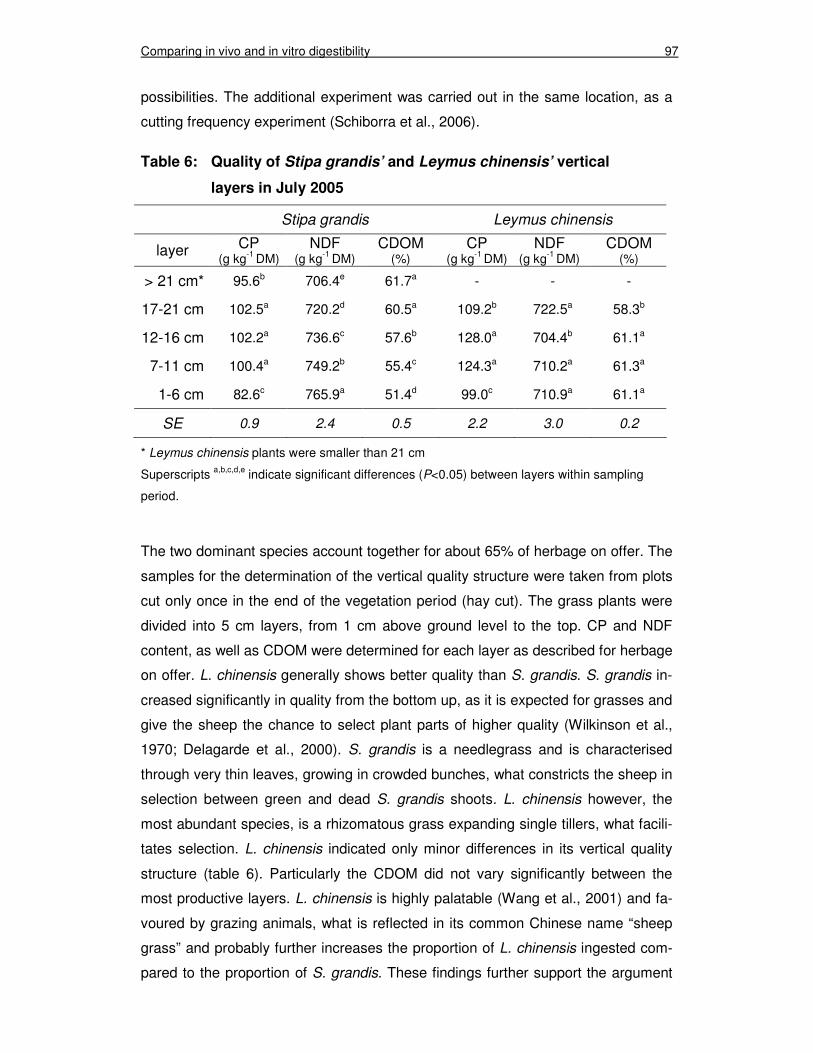
Comparing in vivo and in vitro digestibility 97
possibilities. The additional experiment was carried out in the same location, as a
cutting frequency experiment (Schiborra et al., 2006).
Table 6: Quality of Stipa grandis’ and Leymus chinensis’ vertical
layers in July 2005
Stipa grandis Leymus chinensis
layer CP (g kg-1 DM)
NDF (g kg-1 DM)
CDOM (%)
CP (g kg-1 DM)
NDF (g kg-1 DM)
CDOM (%)
> 21 cm* 95.6b 706.4e 61.7a - - -
17-21 cm 102.5a 720.2d 60.5a 109.2b 722.5a 58.3b
12-16 cm 102.2a 736.6c 57.6b 128.0a 704.4b 61.1a
7-11 cm 100.4a 749.2b 55.4c 124.3a 710.2a 61.3a
1-6 cm 82.6c 765.9a 51.4d 99.0c 710.9a 61.1a
SE 0.9 2.4 0.5 2.2 3.0 0.2
* Leymus chinensis plants were smaller than 21 cm
Superscripts a,b,c,d,e indicate significant differences (P<0.05) between layers within sampling
period.
The two dominant species account together for about 65% of herbage on offer. The
samples for the determination of the vertical quality structure were taken from plots
cut only once in the end of the vegetation period (hay cut). The grass plants were
divided into 5 cm layers, from 1 cm above ground level to the top. CP and NDF
content, as well as CDOM were determined for each layer as described for herbage
on offer. L. chinensis generally shows better quality than S. grandis. S. grandis in-
creased significantly in quality from the bottom up, as it is expected for grasses and
give the sheep the chance to select plant parts of higher quality (Wilkinson et al.,
1970; Delagarde et al., 2000). S. grandis is a needlegrass and is characterised
through very thin leaves, growing in crowded bunches, what constricts the sheep in
selection between green and dead S. grandis shoots. L. chinensis however, the
most abundant species, is a rhizomatous grass expanding single tillers, what facili-
tates selection. L. chinensis indicated only minor differences in its vertical quality
structure (table 6). Particularly the CDOM did not vary significantly between the
most productive layers. L. chinensis is highly palatable (Wang et al., 2001) and fa-
voured by grazing animals, what is reflected in its common Chinese name “sheep
grass” and probably further increases the proportion of L. chinensis ingested com-
pared to the proportion of S. grandis. These findings further support the argument
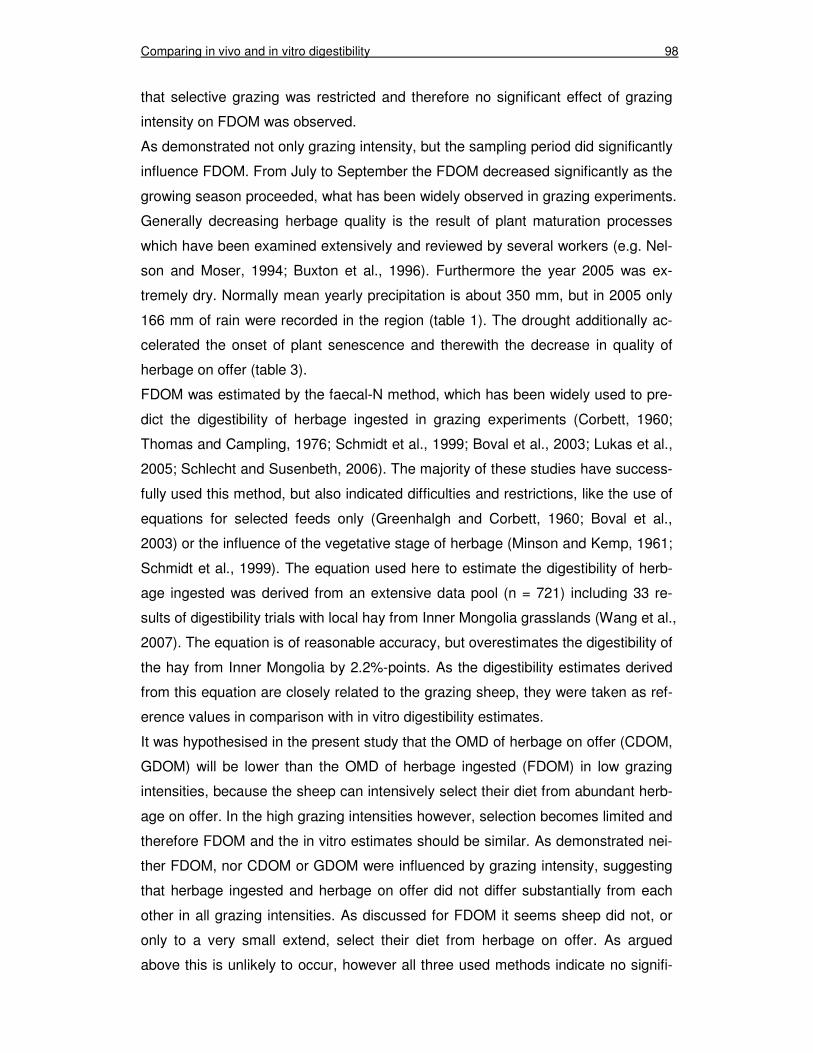
Comparing in vivo and in vitro digestibility 98
that selective grazing was restricted and therefore no significant effect of grazing
intensity on FDOM was observed.
As demonstrated not only grazing intensity, but the sampling period did significantly
influence FDOM. From July to September the FDOM decreased significantly as the
growing season proceeded, what has been widely observed in grazing experiments.
Generally decreasing herbage quality is the result of plant maturation processes
which have been examined extensively and reviewed by several workers (e.g. Nel-
son and Moser, 1994; Buxton et al., 1996). Furthermore the year 2005 was ex-
tremely dry. Normally mean yearly precipitation is about 350 mm, but in 2005 only
166 mm of rain were recorded in the region (table 1). The drought additionally ac-
celerated the onset of plant senescence and therewith the decrease in quality of
herbage on offer (table 3).
FDOM was estimated by the faecal-N method, which has been widely used to pre-
dict the digestibility of herbage ingested in grazing experiments (Corbett, 1960;
Thomas and Campling, 1976; Schmidt et al., 1999; Boval et al., 2003; Lukas et al.,
2005; Schlecht and Susenbeth, 2006). The majority of these studies have success-
fully used this method, but also indicated difficulties and restrictions, like the use of
equations for selected feeds only (Greenhalgh and Corbett, 1960; Boval et al.,
2003) or the influence of the vegetative stage of herbage (Minson and Kemp, 1961;
Schmidt et al., 1999). The equation used here to estimate the digestibility of herb-
age ingested was derived from an extensive data pool (n = 721) including 33 re-
sults of digestibility trials with local hay from Inner Mongolia grasslands (Wang et al.,
2007). The equation is of reasonable accuracy, but overestimates the digestibility of
the hay from Inner Mongolia by 2.2%-points. As the digestibility estimates derived
from this equation are closely related to the grazing sheep, they were taken as ref-
erence values in comparison with in vitro digestibility estimates.
It was hypothesised in the present study that the OMD of herbage on offer (CDOM,
GDOM) will be lower than the OMD of herbage ingested (FDOM) in low grazing
intensities, because the sheep can intensively select their diet from abundant herb-
age on offer. In the high grazing intensities however, selection becomes limited and
therefore FDOM and the in vitro estimates should be similar. As demonstrated nei-
ther FDOM, nor CDOM or GDOM were influenced by grazing intensity, suggesting
that herbage ingested and herbage on offer did not differ substantially from each
other in all grazing intensities. As discussed for FDOM it seems sheep did not, or
only to a very small extend, select their diet from herbage on offer. As argued
above this is unlikely to occur, however all three used methods indicate no signifi-
Comparing in vivo and in vitro digestibility 99
cant differences between grazing intensities. Assuming that there are only minor
differences between herbage on offer and herbage ingested for all grazing intensi-
ties, there should therefore be no differences between FDOM and the in vitro di-
gestibility, neither estimated by CT nor by HGT.
CDOM was approx. 3.9%-points higher than FDOM in all three sampling periods.
De Boever et al. (1986) observed an overestimation of in vivo digestibility by the CT
for concentrates, but for grass silages and hays an underestimation was found,
which increased with decreasing forage quality (De Boever et al., 1988; Andrighetto
et al., 1992; Iantcheva et al., 1999). As the quality of herbage on offer is low com-
pared to herbages grown in more humid environments, the overestimation in the
present study is surprising. Taking into account that the used equation for CDOM,
although derived from a wide range of herbage qualities, was developed from a
data set of herbages grown in European pastures, it seems that this equation is not
appropriate for the digestibility estimation of herbage from Inner Mongolia grass-
lands. Nevertheless the estimates for CDOM are still within the variation of 4.2%-
points given for the used equation (Weissbach et al., 1999), and the fact that the
overestimation by the CT was not significantly different between sampling periods
is a strong argument for a systematic prediction error, resulting from inadequacy of
the equation for the herbage tested.
The HGT did not provide as consistent results as the CT did. In July the GDOM
was also 4.0%-points higher than the FDOM, whereas in August and September
GDOM and FDOM corresponded very well in the digestibility estimations. In August
the difference between GDOM and FDOM was not significant, whereas in Septem-
ber the difference, although less than 1%-point, was significant. The overestimation
in July is difficult to reconcile with the findings in August and September. Either the
sheep have selected their diet negatively in July, what is unlikely, or some meth-
odological problems account for the overestimation. A possible influence of rumen
fluid quality in the HGT method was avoided by taking the fluid from the same ani-
mals, which were fed and housed under standardised conditions. According to the
instructions of Menke and Steingass (1988) two standard feedstuffs (hay, concen-
trate) were included to correct the gas production for possible quality differences.
During analysis, the samples were randomly chosen and 6 times replicated on two
different days, so that the influence of rumen fluid quality was the same for all sam-
pling periods. Herbage on offer was sampled by cutting all standing biomass 1 cm
above ground level, not including litter spread on the ground. If the sheep have in-
gested this very low quality material in July, the FDOM would have decreased,
Comparing in vivo and in vitro digestibility 100
whereas there was no effect on GDOM, because litter was not sampled. Consider-
ing the amount of herbage on offer in July and also the high proportion of green
herbage on offer in this period, there was no need for the sheep to ingest litter.
Using the differences between FDOM and in vitro digestibility CDOM and GDOM
as criterion for dietary selection was a further concern of the present study. As ar-
gued above the CDOM seemed to be inapplicable to estimate the digestibility of
herbage on offer. Therefore the differences between FDOM and CDOM can not be
used as a criterion for selection. Despite the difficulties to explain the overestima-
tion by GDOM in July, the results obtained in August and September are feasible to
be used as selection criterion. The interpretation of the differences between FDOM
and GDOM in August and September with regard to selection imply that no or only
little selection occurred and that there were no differences between grazing intensi-
ties.
5. Conclusions
Although herbage on offer became limited in the high grazing intensities and thus
dietary selection should have been limited, no significant differences in FDOM,
CDOM or GDOM were observed between grazing intensities. Due to the uniform
quality structure of herbage on offer, which was especially demonstrated for the
vertical quality structure, it can be concluded that dietary selection, when it oc-
curred, did not essentially improve the quality of herbage ingested. This argument
is furthermore supported by the fact that the green herbage proportion of herbage
on offer was constant between grazing intensities, implying that degree of selectiv-
ity did not differ between grazing intensities.
The applied equation to estimate OMD by CT seemed to be inadequate for the
herbage from Inner Mongolia, as the constant overestimation of FDOM in all sam-
pling periods is a strong indicator for a systematic prediction error. The GDOM did
not or only marginally differ from FDOM in August and September, in July however
also an overestimation of FDOM was observed. Despite the difficulty to interpret
estimates from July, the results from August and September indicate that there
were no significant differences between herbage on offer and herbage ingested.
Thus, the conclusion that no dietary selection was detected in 2005 in the investi-
gated natural semi-arid grassland was underlined once more.
Comparing in vivo and in vitro digestibility 101
6. References
Andrighetto, I., Gruber, L., Cozzi, G., Uray, G., Guidetti, G., Buchgraber, K., 1992.
Prediction of digestible organic matter in dry matter in vivo from the chemical
composition, in vitro and in situ measurements on native mountain forages.
Animal Feed Science and Technology 39, 323-333.
Animut, G., Goetsch, A.L., Aiken, G.E., Puchala, R., Detweiler, G., Krehbiel, C.R.,
Merkel, R.C., Sahlu, T., Dawson, L.J., Johnson, Z.B., Gipson, T.A., 2005. Per-
formance and forage selectivity of sheep and goats co-grazing grass/forb pas-
tures at three stocking rates. Small Ruminant Research 59, 203-215.
Arnold, G.W., 1960. The effect of the quantity and quality of pasture available to
sheep on their grazing behaviour. Australian Journal of Agricultural Research
11, 1034-1043.
Arnold, G.W., 1981. Grazing Behaviour. In: Morley, F.H.W. (Ed.), World Animal
Science - Grazing Animals. Elsevier, Amsterdam, pp. 79-104.
Bakker, J.P., De Leeuw, J., Van Wieren, S.E., 1983. Micro-patterns in grassland
vegetation created and sustained by sheep-grazing. Vegetatio 55, 153-161.
Bartolomé, J., Franch, J., Plaixats, J., Seligman, N.G., 1998. Diet selection by
sheep and goats on Mediterranean heath-woodland range. Journal of Range
Management 51, 383-391.
Blaser, R.E., Hammes, R.C.Jr., Bryant, H.T., Hardison, W.A., Fontenot, J.P., Engel,
R.W., 1960. The effect of selective grazing on animal output. In: Skidmore C.L.
(Ed.), Proceedings of the 8th International Grassland Congress, Reading, UK,
pp. 601-606.
Boval, M., Archimède, H., Fleury, J., Xandé, A., 2003. The ability of faecal nitrogen
to predict digestibility for goats and sheep fed with tropical herbage. Journal of
Agricultural Science 140, 443-450.
Broom, D.M., Arnold, G.W., 1986. Selection by grazing sheep of pasture plants at
low herbage availability and responses of the plants to grazing. Australian
Journal of Agricultural Research 37, 527-538.
Bryant, H.T., Blaser, R.E., Hammes, R.C.Jr., Fontenot, J.P., 1970. Symposium on
pasture methods for maximum production in beef cattle: effect of grazing
management on animal and area output. Journal of Animal Science 30, 153-
158.
Comparing in vivo and in vitro digestibility 102
Buxton, D.R., Mertens, D.R., Fisher, D.S., 1996. Forage quality and ruminant utili-
zation. In: Moser, L.E., Buxton, D.R., Casler, M.D. (Eds.), Cool-Season For-
age Grasses. ASA-CSSA-SSSA, Madison, pp. 229-267.
Chacon, E., Stobbs, T.H., 1976. Influence of progressive defoliation of a grass
sward on the eating behaviour of cattle. Australian Journal of Agricultural Re-
search 27, 709-727.
Cherney, D.J.R., Mertens, D.R., Moore, J.E., 1990. Intake and digestibility by weth-
ers as influenced by forage morphology at three levels of forage offering.
Journal of Animal Science 68, 4387-4399.
Coates, D.B., Penning, P., 2000. Measuring animal performance. In: ‘t Mannetje, L.,
Jones, R.M. (Eds.), Field and laboratory methods for grassland and animal
production research. Cabi Publishing, Wallingford, pp. 353-402.
Cook, C.W., Stoddart, L.A., Harris, L.E., 1953. Effects of grazing intensity upon the
nutritive value of range forage. Journal of Range Management 6, 51-54.
Corbett, J.L., 1960. Faecal-index techniques for estimating herbage consumption
by grazing animals. In: Skidmore, C.L. (Ed.), Proceedings of the 8th Interna-
tional Grassland Congress, Reading, UK, pp. 438-442.
De Boever, J.L., Cottyn, B.G., Buysse, F.X., Wainman, F.W., Vanacker, J.M., 1986.
The use of an enzymatic technique to predict digestibility, metabolizable and
net energy of compound feedstuffs for ruminants. Animal Feed Science and
Technology 14, 203-214.
De Boever, J.L., Cottyn, B.G., Andries, J.I., Buysse, F.X., Vanacker, J.M, 1988. The
use of a cellulase technique to predict digestibility, metabolizable and net en-
ergy of forages. Animal Feed Science and Technology 19, 247-260.
Delagarde, R., Peyraud, J.L., Delaby, L., Faverdin, P., 2000. Vertical distribution of
biomass, chemical composition and pepsin-cellulase digestibility in a peren-
nial ryegrass sward: interaction with month of year, regrowth age and time of
day. Animal Feed Science and Technology 84, 49-68.
Dove, H., Coombe, J.B., 1992. A comparison of methods for estimating supplement
intake and diet digestibility in sheep. Animal Production in Australia 19, 239-
241.
Garcia, F., Carrere, P., Soussana, J.F., Baumont, R., 2003. The ability of sheep at
different stocking rates to maintain the quality and quantity of their diet during
the grazing season. Journal of Agricultural Science 140, 113-124.
Comparing in vivo and in vitro digestibility 103
Glindemann, T., Wang, C., Tas, B.M., Susenbeth, A., 2007. Influence of grazing
intensity on herbage mass, digestibility, feed intake, and live weight gain of
sheep on the Inner Mongolian steppe. Proceedings of the Society of Nutrition
Physiology 16, 106.
Grant, S.A., Milne, J.A., Barthram, G.T, Souter, W.G., 1982. Effects of season and
level of grazing on the utilization of heather by sheep. 3. Longer-term re-
sponses and sward recovery. Grass and Forage Science 37, 311-320.
Greenhalgh, J.F.D., Corbett, J.L., 1960. The indirect estimation of the digestibility of
pasture herbage. I. Nitrogen and chromogen as faecal index substances.
Journal of Agricultural Science 55, 371-376.
Hamilton, B.A., Hutchinson, K.J., Annis, P.C., Donnelly, J.B., 1973. Relationships
between the diet selected by grazing sheep and the herbage on offer. Austra-
lian Journal of Agricultural Research 24, 271-277.
Horn, M., Vollandt, R., 1995. Multiple Tests und Auswahlverfahren. Gustav Fischer
Verlag, Stuttgart.
Iantcheva, N., Steingass, H., Todorov, N., Pavlov, D., 1999. A comparison of in
vitro rumen fluid and enzymatic methods to predict digestibility and energy
value of grass and alfalfa hay. Animal Feed Science and Technology 81, 333-
344.
Jamieson, W.S., Hodgson, J., 1979. The effect of variation in sward characteristics
upon the ingestive behaviour and herbage intake of calves and lambs under
continuous stocking management. Grass and Forage Science 34, 273-282.
Jones, D.I.H., Hayward, M.V., 1975. The effect of pepsin pretreatment of herbage
on the prediction of dry matter digestibility from solubility in fungal cellulase
solutions. Journal of the Science of Food and Agriculture 26, 711-718.
Jung, H.G., Sahlu, T., 1989. Influence of grazing pressure on forage quality and
intake by sheep grazing smooth bromegrass. Journal of Animal Science 67,
2089-2097.
Jung, H.G., Bennett, G.L., Sahlu, T.,1989. Magnitude of diet selection by sheep
grazing smooth bromegrass. Journal of Animal Science 67, 2106-2115.
Lancaster, R.J., 1949. The measurement of feed intake by grazing cattle and sheep.
I. A method of calculating the digestibility of pasture based on the nitrogen
content of faeces derived from the pasture. New Zealand Journal of Science
and Technology 25, 31-38.
Comparing in vivo and in vitro digestibility 104
Laredo, M.A., Minson, D.J., 1975. The voluntary intake and digestibility by sheep of
leaf and stem fractions of Lolium perenne. Journal of the British Grassland
Society 30, 73-77.
Leigh, J.H., Mulham, W.E., 1967. Selection of diet by sheep grazing semi-arid pas-
tures on the Riverine Plain. 3. A bladder saltbush (Atriplex vesicaria) - pigface
(Disphyma australe) community. Australian Journal of Experimental Agricul-
ture 7, 421-425.
Lu, C.D., 1988. Grazing behaviour and diet selection of goats. Small Ruminant Re-
search 1, 205-216.
Lukas, M., Südekum, K.H., Rave, G., Friedel, K., Susenbeth, A., 2005. Relationship
between fecal crude protein concentration and diet organic matter digestibility
in cattle. Journal of Animal Science 83, 1332-1344.
McLeod, M.N., Minson, D.J., 1978. The accuracy of the pepsin-cellulase technique
for estimating the dry matter digestibility in vivo of grasses and legumes. Ani-
mal Feed Science and Technology 3, 277-287.
Menke, K.H., Steingass, H., 1988. Estimation of the energetic feed value obtained
from chemical analysis and in vitro gas production using rumen fluid. Animal
Research and Development 28, 7-55.
Menke, K.H., Raab, L., Salewski, A., Steingass, H., Fritz, D., Schneider, W., 1979.
The estimation of the digestibility and metabolizable energy content of rumi-
nant feedingstuffs from the gas production when they are incubated with ru-
men liquor in vitro. Journal of Agricultural Science 93, 217-222.
Milne, J.A., Bagley, L., Grant, S.A., 1979. Effects of season and level of grazing on
the utilization of heather by sheep. 2. Diet selection and intake. Grass and
Forage Science 34, 45-53.
Minson, D.J., 1990. Forage in ruminant nutrition. Academic Press, Inc., San Diego.
Minson, D.J., Kemp, C.D., 1961. Studies in the digestibility of herbage. IX. Herbage
and fecal nitrogen as indicators of herbage organic matter digestibility. Jour-
nal of the British Grassland Society 16, 76-79.
Naumann, K., Bassler, R., 1993. Methodenbuch III, 3. Erg., Die chemische Unter-
suchung von Futtermitteln. Verlag J. Neumann – Neudann, Melsungen.
Nelson, C.J., Moser, L.E., 1994. Plant factors affecting forage quality. In : Fahey,
G.C.Jr. (Ed.), Forage Quality, Evaluation and Utilization. ASA-CSSA-SSSA,
Madison., pp.115-154.
Comparing in vivo and in vitro digestibility 105
Pell, A.N., Schofield, P., 1993. Computerized monitoring of gas production to
measure forage digestion in vitro. Journal of Dairy Science 76, 1063-1073.
Penning, P.D., Parsons, A.J., Orr, R.J., Treacher, T.T., 1991. Intake and behaviour
responses by sheep to changes in sward characteristics under continuous
stocking. Grass and Forage Science 46, 15-28.
Rymer, C., 2000. The measurement of forage digestibility in vivo. In: Givens, D.I.,
Owen, E., Axford, R.F.E., Omed, H.M. (Eds.), Forage evaluation in ruminant
nutrition. Cabi Publishing, Wallingford, pp. 113-134.
Schiborra, A., Gierus, M., Wan, H.W., Bai, Y.F., Taube, F., 2006. Herbage yield
and quality as influenced by cutting frequency of natural grassland of Inner
Mongolia. In: Lloveras, J., et al. (Eds.), Sustainable Grassland Productivity.
EGF – Grassland Science in Europe 11, 592-594.
Schlecht, E., Susenbeth, A., 2006. Estimating the digestibility of Sahelian rough-
ages from faecal crude protein concentration of cattle and small ruminants.
Journal of Animal Physiology and Animal Nutrition 90, 369-379.
Schlecht, E., Sangaré, M., Becker, K., 1999. Supplementation of Zebu cattle graz-
ing Sahelian pasture. I. Diet selection and intake. Journal of Agricultural Sci-
ence 133, 69-81.
Schlegel, M.L., Wachenheim, C.J., Benson, M.E., Ames, N.K., Rust, S.R., 2000.
Grazing methods and stocking rates for direct-seeded alfalfa pastures: 2.
Pasture quality and diet selection. Journal of Animal Science 78, 2202-2208.
Schmidt, L., Jentsch, W., 1994. Die Schätzung der Verdaulichkeit von Konservat-
futterrationen für Rinder anhand des Stickstoffgehaltes im Rinderkot. FNB
Schriftenreihe, Dummerstorf 7, 179-184.
Schmidt, L., Weissbach, F., Hoppe, T., Kuhla, S., 1999. Untersuchungen zur Ver-
wendung der Kotstickstoff-Methode für die Schätzung des energetischen Fut-
terwertes von Weidegras und Nachweis der selektiven Futteraufnahme auf
der Weide. Landbauforschung Völkenrode 49, 123-135.
Senft, R.L., 1989. Hierarchical foraging models: effects of stocking and landscape
composition on simulated resource use by cattle. Ecological Modelling 46,
283-303.
Terry, R.A., Tilley, J.M., 1964. The digestibility of the leaves and stems of perennial
ryegrass, cocksfoot, timothy, tall fescue, lucerne and sainfoin, as measured
by an in vitro procedure. Journal of the British Grassland Society 19, 363-372.
Comparing in vivo and in vitro digestibility 106
Theodorou, M.K., Williams, B.A., Dhanoa, M.S., McAllen, A.B., France, J., 1994. A
simple gas production method using a pressure transducer to determine the
fermentation kinetics of ruminant feeds. Animal Feed Science and Technol-
ogy 48, 185-197.
Thomas, S., Campling, R.C., 1976. Relationship between digestibility and faecal
nitrogen in sheep and cows offered herbage ad libitum. Journal of the British
Grassland Society 31, 69-72.
Tilley, J.M., Terry, R.A., 1963. A two-stage technique for the in vitro digestion of
forage crops. Journal of the British Grassland Society 18, 104-111.
Van Dyne, G.M., Torell, D.T., 1964. Development and use of oesophageal fistula: a
review. Journal of Range Management 17, 7-19.
Van Soest, P.J., 1994. Nutritional ecology of the ruminant. Cornell University Press,
New York.
Van Soest, P.J., Robertson, J.B., Lewis, B.A., 1991. Methods for dietary fiber, neu-
tral detergent fiber, and nonstarch polysaccharides in relation to animal nutri-
tion. Journal of Dairy Science 74, 3583-3597.
Wang, C., Glindemann, T., Schmidt, L., Weissbach, F., Tas, B.M., Susenbeth, A.,
2007. Fecal crude protein content as an estimate for the digestibility of or-
ganic matter ingested in sheep. Proceedings of the Society of Nutrition Physi-
ology 16, 65.
Wang, R.Z., Ripley, E.A., Zu, Y.G., Nie, S.Q., 2001. Demography of reproductive
and biomass allocation of grassland and dune Leymus chinensis on the
Songnen Plain, north-eastern China. Journal of Arid Environments 49, 289-
299.
Wang, S., Li, Y., Chen, Z., 1999. The optimal stocking rate on grazing system in
Inner Mongolia steppe. 1. Based on relationship between stocking rate and
aboveground net primary productivity. Acta Agrestia Sinica 7, 192-197 (in
Chinese, with English abstract)
Weissbach, F., Kuhla, S., Schmidt, L., Henkels, A., 1999. Schätzung der Verdau-
lichkeit und der Umsetzbaren Energie von Gras und Grasprodukten. Proceed-
ings of the Society of Nutrition Physiology 8, 72.
Wilkinson, S.R., Adams, W.E., Jackson, W.A., 1970. Chemical composition and in
vitro digestibility of vertical layers of Coastal Bermuda grass (Cynodon dacty-
lon L.). Agronomy Journal 62, 39-43.
Comparing in vivo and in vitro digestibility 107
Willms, W.D., Dormaar, J.F., Schaalje, G.B., 1988. Stability of grazed patches on
rough fescue grasslands. Journal of Range Management 41, 503-508.
Wilson, A.D., MacLeod, N.D., 1991. Overgrazing: present or absent? Journal of
Range Management 44, 475-482.
Yu, M., Ellis, J.E., Epstein, H.E., 2004. Regional analysis of climate, primary pro-
duction, and livestock density in Inner Mongolia. Journal of Environmental
Quality 33, 1675-1681.

Chapter 5
General discussion
General discussion 109
1. Introduction and summary of results
The degradation of grassland steppes due to overgrazing is the crucial ecological
and socio-economical problem in Inner Mongolia. The degradation process is ad-
dressed by the MAGIM-project in a multidisciplinary approach on plot as well as on
regional scale. The current thesis depicted the research results of sub-project 3,
which were obtained in two experiments.
A cutting-frequency experiment was conducted successively in 2004 and 2005 to
evaluate short-term responses to defoliation stress of a semi-arid grassland sward
in the Xilin River Basin, Inner Mongolia (chapters 2 and 3). A grazing experiment
was established in 2005 that is supposed to provide long-term information about
the impact of grazing on the grassland sward and about the role grazing plays in
the degradation process. One year data were available that provided the basis for a
comparison of in vivo and in vitro determined organic matter digestibility, offering
the possibility to assess differences in selective behaviour of the grazing animals in
the 6 different grazing intensities (chapter 4). Both experiments are based on
straight orthogonal experimental designs that build a strong basis for the statistical
evaluation of the results and allow a reliable interpretation of the latter.
Cutting-frequency experiment
The aim of the cutting-frequency experiment was to evaluate short-term effects of
defoliation stress on community and plant level, using plant-related parameters and
herbage quality parameters. In the short-term defoliation stress had a positive influ-
ence on herbage aboveground productivity, nitrogen uptake and therewith the
crude protein content. The positive effects on herbage productivity were confirmed
by the evaluation of leaf area development under defoliation stress. Short-term ef-
fects on root mass and root carbohydrate reserves were not observed, as well as
on species composition and tiller density. The herbage quality parameters cell wall
content and its composition, the digestibility of organic matter and the non-
structural carbohydrate content partly indicated short-term responses, but these
responses were not consistent between treatments and years. This demonstrated
that the herbage quality parameters were more susceptible to climatic fluctuations
and seasonal dynamics than to defoliation stress. Also the evaluation of plant-
related parameters revealed the strong impact of precipitation on the investigated
grassland sward, as herbage productivity was in fact stimulated by frequent defolia-
General discussion 110
tion in both experimental years, but simultaneously substantially reduced due to low
precipitation rate in 2005.
The increase in herbage productivity and crude protein content in response to fre-
quent defoliation in both experimental years shows that the steppe grassland is
resistant to defoliation stress in the short term, even under drought conditions.
Nevertheless, it has to be stressed again that these results are short-term results.
Grazing experiment
In this experiment it was hypothesised that when herbage on offer is abundant, i.e.
in the low grazing intensities, the in vitro estimated organic matter digestibility
(OMD) will underestimate the in vivo OMD, because herbage ingested by grazing
sheep will differ from herbage on offer due to selective grazing. But when herbage
on offer becomes limited, i.e. in the high grazing intensities, then herbage ingested
and herbage on offer will not differ very much from each other anymore, because
the grazing sheep are not able to select, but forced to ingest all herbage offered.
Therefore the in vivo OMD and in vitro OMD will converge in the high grazing inten-
sities. The differences between in vivo and in vitro OMD might be used as an index
for the selectivity of the grazing sheep in the grazing experiment.
Herbage on offer significantly decreased with increasing grazing intensity, as it was
expected. But the OMD was not significantly influenced by grazing intensity, neither
the in vivo OMD, nor the in vitro OMD. Therefore the hypothesised convergence of
in vivo and in vitro OMD in high grazing intensities was not observed. This result
suggested that herbage ingested and herbage on offer were similar and that selec-
tivity was not very pronounced in 2005. This argument is supported by the results
that firstly, the quality structure of herbage on offer was rather homogenous, espe-
cially the vertical quality structure, and that secondly, the green herbage proportion
of herbage on offer remained constant across the grazing intensities. A difference
in selectivity between grazing intensities was therefore not observed in 2005.
It appears rather difficult to draw collective conclusions from the cutting-frequency
experiment and the grazing experiment, as they are substantially different in design
and objectives. Cutting- and grazing-induced defoliation stress differs markedly in
the impact on the grassland ecosystem. These basic differences will be addressed
in section 2 of the general discussion as well as the question, whether the short-
term effects observed in the cutting-frequency experiment, namely the stimulatory
General discussion 111
effect on herbage productivity, could also be observed in the grazing experiment in
the first experimental year.
In all chapters however, one unifying conclusion was drawn: climatic fluctuations,
especially in precipitation rate, had a fundamental influence on the grassland sward.
Herbage productivity was substantially reduced (chapter 2) and short-term effects
of defoliation stress, whether due to cutting or grazing, were likely to cover effects
on herbage quality (chapters 3 and 4). These results are in line with results ob-
tained in other semi-arid grasslands; therefore an overview of the influence of pre-
cipitation on semi-arid grassland ecosystems and its implications in connection with
grazing stress are discussed in section 3 of the general discussion.
The present thesis was conducted in the framework of the MAGIM-project, so that
section 4 will refer to the relationships of the current thesis to other sub-projects of
MAGIM.
2. Cutting vs. grazing – is herbage productivity stimulated by grazing in
the short-term?
Cutting and grazing are two substantially different ways of defoliation. Cutting im-
plies an even defoliation of the whole grass sward to the same stubble height.
Grass biomass is uniformly removed and only few nutrients are slowly recycled
through senescent biomass (litter) which escaped harvesting. If the grass sward
gets no supplementary nutrients through fertilization, the constant nutrient removal
will deplete the soil nutrient pool and biomass production will decease in the long-
term.
In contrast, grazing is a dynamic process. Herbivores are known to select their diet
from herbage on offer (Arnold, 1981; Milne, 1991). Palatable, highly digestible
herbages are preferred to unpalatable, highly lignified or toxic plants, which are less
severely or not grazed at all (Broom and Arnold, 1986). Because palatable herb-
ages are grazed more frequently they suffer more from defoliation-induced stress
than less grazed herbages. Li (1989), Wang et al. (2001) and Wang (2004) for ex-
ample report that L. chinensis is highly palatable and that the preference of herbi-
vores for L. chinensis resulted in reduction and finally disappearance of L. chinen-
sis from intensively grazed grassland swards in Inner Mongolia.
Grazing also involves the development of vertical and horizontal structures within a
sward. It was demonstrated that animals graze the upper strata of a sward first, as
more leaves, that are higher digestible, can be found in the upper strata (Chacon
General discussion 112
and Stobbs, 1976). In the horizontal direction grazing animals re-graze areas that
have been grazed previously, because the re-growing juvenile herbage is of higher
nutritional value; this results eventually in a mosaic of more or less intensively
grazed and ungrazed patches (Bakker et al., 1983; Willms et al., 1988; O’Reagain
and Schwartz, 1995; Laca and Lemaire, 2000). Especially continuously grazed
swards show patchy structures, other grazing management strategies like strip
grazing or rotational grazing impose a high, but short-term grazing pressure on
herbage swards, similar to cutting systems. Selective grazing becomes limited due
to restricted amounts of herbage on offer and the sward is more evenly defoliated
(Black and Kenney, 1984), what was extensively discussed in chapter 4.
Besides the influence of selection another very important difference to cutting is the
recycling of nutrients. Grazing animals recycle approx. 70-85% of the ingested
herbage mass to the grazing area by faeces and urine (Russelle, 1992; Tamminga,
1996). The nutrients in faeces and urine are more readily available to soil microbes,
providing rapidly available nutrients to plants. But grazing does not only influence
the nutrient status of the soil, it also influences the soil bulk density. Through animal
trampling considerable compaction of the soil can be observed in intensively
grazed areas; this was also confirmed for Inner Mongolia grasslands by Krümmel-
bein (2007) within the MAGIM-project. Besides soil compaction trampling does also
exert additional destructive stress to the herbage plants.
Taking all this differences between defoliation through cutting or grazing respec-
tively, into account it must be concluded that cutting and grazing experiments are
hardly comparable. However, cutting experiments as a model for grazing-induced
effects have and will keep their eligibility, as they are less laborious and expensive
and offer the possibility to distinguish between the different components of grazing
that influence a grassland sward. Therefore comparisons between cutting and graz-
ing treatments have been conducted to investigate, if relationships can be found
that are generally valid and allow the extrapolation of results from cutting experi-
ments to grazing situations. The comparisons of herbage productivity in cut and
grazed swards of Frame and Hunt (1971) and Binnie and Chestnutt (1991) are
considered exemplarily, although obtained in temperate-humid grasslands. Studies
addressing this question in semi-arid grasslands were not found in literature so far.
The results are contradicting, whilst Frame and Hunt (1971) observed 14-16%
more OM-yield in grazed swards, did Binnie and Chestnutt (1991) obtain an 11%
increase in DM production in the cutting treatments. Besides these two studies,
General discussion 113
several others were conducted on the matter, but no general relationship between
grazing and cutting could be confirmed (Wolton, 1963; Aldrich and Elliot, 1974).
In chapter 2 the short-term differences in DM productivity under cutting were pre-
sented and discussed. In both experimental years the more frequently defoliated
treatments outyielded the treatment cut only once. The higher productivity resulted
from over-compensatory growth of the frequently cut swards, the mechanisms and
controversies on this topic were also discussed in chapter 2. However, the question
arises if the stimulatory effect of defoliation on herbage productivity observed in the
cutting-frequency experiment can be also detected in the grazing experiment in
2005. This question will be discussed in the following.
It was briefly explained in chapter 1 that 6 grazing intensities and two grazing sys-
tems are compared in the grazing experiment. Per grazing intensity one plot con-
sists of two paddocks, one is exclusively grazed and the other one exclusively used
for hay making (one cut per year) in the traditional system, while in the mixed sys-
tems the two paddocks are grazed in one year and used for hay making in the
other year. The whole experiment was divided in 2 blocks, whereas one block is
located in the flat part of the experimental area and the other block in slope part;
therefore both systems are replicated two times. The cutting-frequency experiment
was as well situated in the slope part of the experimental area, so that the results
obtained in this experiment can be compared to the results obtained in the slope
block of the grazing experiment. As 2005 was the first experimental year, no differ-
ences existed between the two systems, i.e. traditional and mixed system, so that
the different systems could be used as replicates of the grazing intensities for the
calculation of cumulative dry matter yield (cDMY) in 2005. The cDMY was meas-
ured by means of moveable exclosure cages in the grazing experiment (McNaugh-
ton et al., 1996). All paddocks were sampled in the beginning of June, July, August
and September 2005 and the exclosure cages were moved after each sampling.
Per paddock three cages were used, sampling 0.5 m² per cage by clipping all
standing herbage (inclusive standing dead herbage) to 1 cm stubble height.
The cumulative herbage production was calculated as follows:
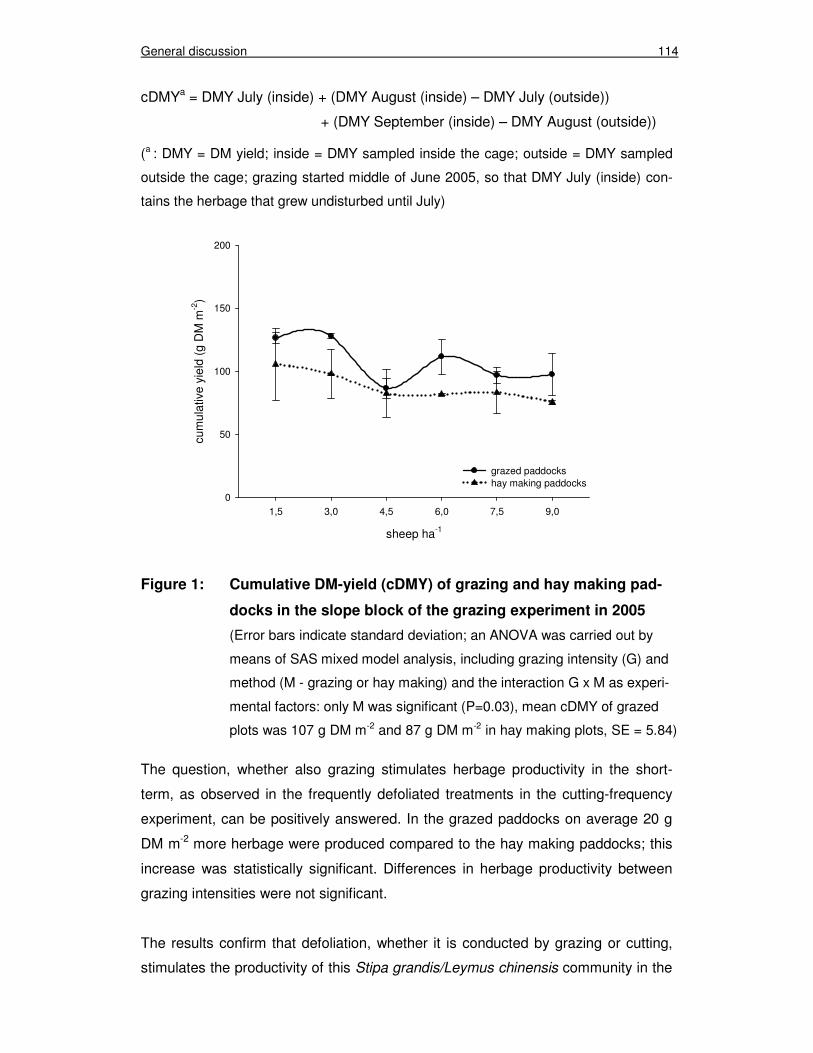
General discussion 114
cDMYa = DMY July (inside) + (DMY August (inside) – DMY July (outside))
+ (DMY September (inside) – DMY August (outside))
(a : DMY = DM yield; inside = DMY sampled inside the cage; outside = DMY sampled
outside the cage; grazing started middle of June 2005, so that DMY July (inside) con-
tains the herbage that grew undisturbed until July)
Figure 1: Cumulative DM-yield (cDMY) of grazing and hay making pad-
docks in the slope block of the grazing experiment in 2005
(Error bars indicate standard deviation; an ANOVA was carried out by
means of SAS mixed model analysis, including grazing intensity (G) and
method (M - grazing or hay making) and the interaction G x M as experi-
mental factors: only M was significant (P=0.03), mean cDMY of grazed
plots was 107 g DM m-2 and 87 g DM m-2 in hay making plots, SE = 5.84)
The question, whether also grazing stimulates herbage productivity in the short-
term, as observed in the frequently defoliated treatments in the cutting-frequency
experiment, can be positively answered. In the grazed paddocks on average 20 g
DM m-2 more herbage were produced compared to the hay making paddocks; this
increase was statistically significant. Differences in herbage productivity between
grazing intensities were not significant.
The results confirm that defoliation, whether it is conducted by grazing or cutting,
stimulates the productivity of this Stipa grandis/Leymus chinensis community in the
sheep ha-1
1,5 3,0 4,5 6,0 7,5 9,0
cum
ulat
ive
yiel
d (g
DM
m-2
)
0
50
100
150
200
grazed paddockshay making paddocks
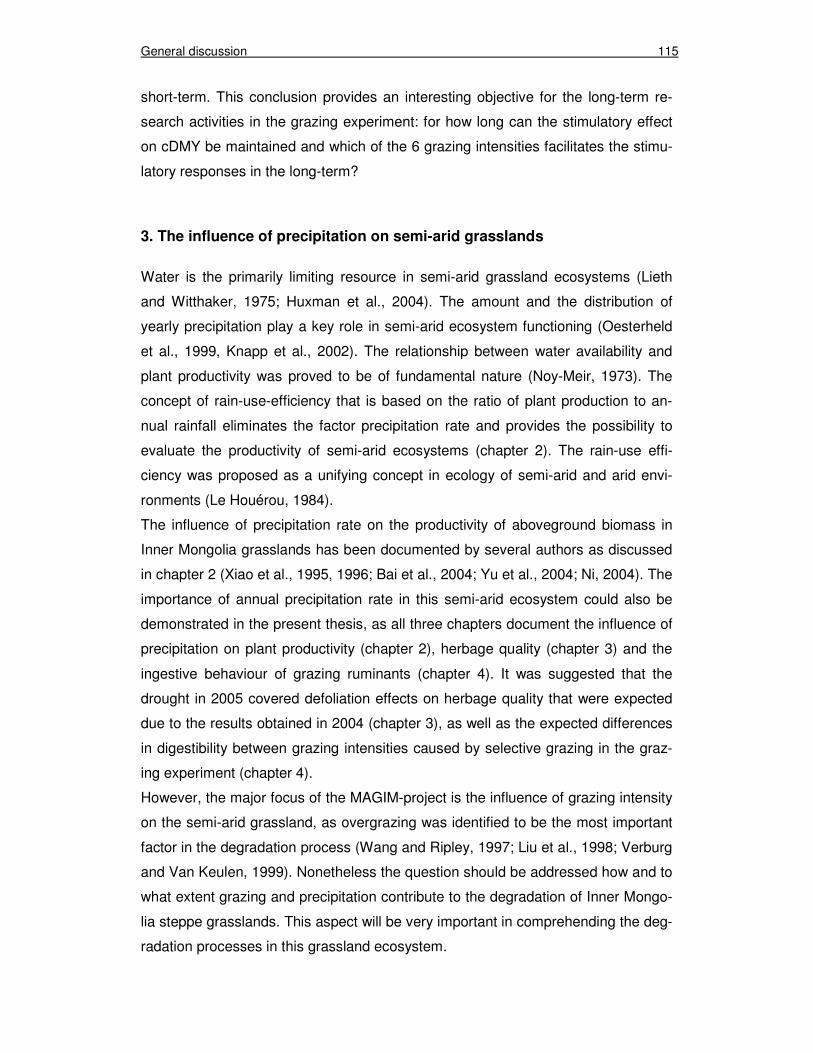
General discussion 115
short-term. This conclusion provides an interesting objective for the long-term re-
search activities in the grazing experiment: for how long can the stimulatory effect
on cDMY be maintained and which of the 6 grazing intensities facilitates the stimu-
latory responses in the long-term?
3. The influence of precipitation on semi-arid grasslands
Water is the primarily limiting resource in semi-arid grassland ecosystems (Lieth
and Witthaker, 1975; Huxman et al., 2004). The amount and the distribution of
yearly precipitation play a key role in semi-arid ecosystem functioning (Oesterheld
et al., 1999, Knapp et al., 2002). The relationship between water availability and
plant productivity was proved to be of fundamental nature (Noy-Meir, 1973). The
concept of rain-use-efficiency that is based on the ratio of plant production to an-
nual rainfall eliminates the factor precipitation rate and provides the possibility to
evaluate the productivity of semi-arid ecosystems (chapter 2). The rain-use effi-
ciency was proposed as a unifying concept in ecology of semi-arid and arid envi-
ronments (Le Houérou, 1984).
The influence of precipitation rate on the productivity of aboveground biomass in
Inner Mongolia grasslands has been documented by several authors as discussed
in chapter 2 (Xiao et al., 1995, 1996; Bai et al., 2004; Yu et al., 2004; Ni, 2004). The
importance of annual precipitation rate in this semi-arid ecosystem could also be
demonstrated in the present thesis, as all three chapters document the influence of
precipitation on plant productivity (chapter 2), herbage quality (chapter 3) and the
ingestive behaviour of grazing ruminants (chapter 4). It was suggested that the
drought in 2005 covered defoliation effects on herbage quality that were expected
due to the results obtained in 2004 (chapter 3), as well as the expected differences
in digestibility between grazing intensities caused by selective grazing in the graz-
ing experiment (chapter 4).
However, the major focus of the MAGIM-project is the influence of grazing intensity
on the semi-arid grassland, as overgrazing was identified to be the most important
factor in the degradation process (Wang and Ripley, 1997; Liu et al., 1998; Verburg
and Van Keulen, 1999). Nonetheless the question should be addressed how and to
what extent grazing and precipitation contribute to the degradation of Inner Mongo-
lia steppe grasslands. This aspect will be very important in comprehending the deg-
radation processes in this grassland ecosystem.
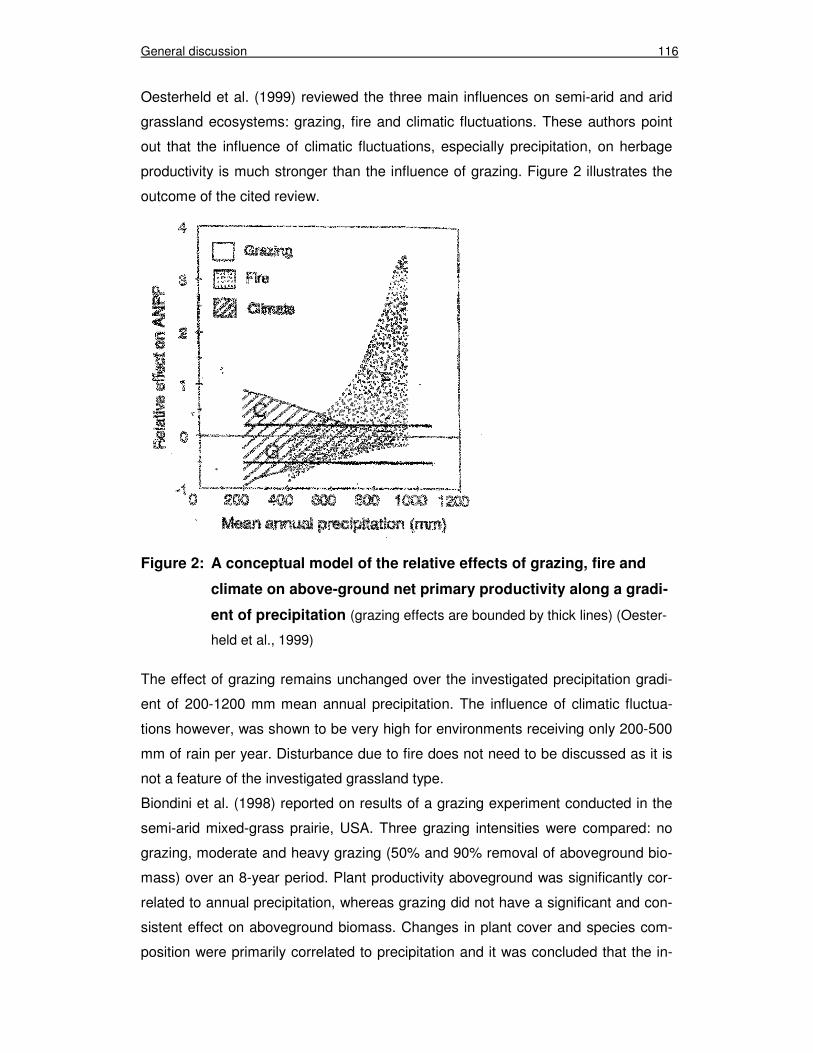
General discussion 116
Oesterheld et al. (1999) reviewed the three main influences on semi-arid and arid
grassland ecosystems: grazing, fire and climatic fluctuations. These authors point
out that the influence of climatic fluctuations, especially precipitation, on herbage
productivity is much stronger than the influence of grazing. Figure 2 illustrates the
outcome of the cited review.
Figure 2: A conceptual model of the relative effects of grazing, fire and
climate on above-ground net primary productivity along a gradi-
ent of precipitation (grazing effects are bounded by thick lines) (Oester-
held et al., 1999)
The effect of grazing remains unchanged over the investigated precipitation gradi-
ent of 200-1200 mm mean annual precipitation. The influence of climatic fluctua-
tions however, was shown to be very high for environments receiving only 200-500
mm of rain per year. Disturbance due to fire does not need to be discussed as it is
not a feature of the investigated grassland type.
Biondini et al. (1998) reported on results of a grazing experiment conducted in the
semi-arid mixed-grass prairie, USA. Three grazing intensities were compared: no
grazing, moderate and heavy grazing (50% and 90% removal of aboveground bio-
mass) over an 8-year period. Plant productivity aboveground was significantly cor-
related to annual precipitation, whereas grazing did not have a significant and con-
sistent effect on aboveground biomass. Changes in plant cover and species com-
position were primarily correlated to precipitation and it was concluded that the in-
General discussion 117
vestigated grassland has a high degree of resistance against drought and grazing
effects. Substantial changes in productivity or species composition are only ex-
pected when drought events coincide with prolonged periods of overgrazing. A
similar conclusion was drawn by Christensen et al. (2003) after the simulation of
degradation processes for the Xilin River Basin using the Savanna ecosystem
model (Coughenour, 1993; see chapter 2). Model simulations suggested that when
intensive heavy grazing and drought events overlap the grassland ecosystem is
vulnerable to loss of productivity and species diversity. The predominance of envi-
ronmental variables, i.e. precipitation, rather than grazing was also emphasized in
other studies conducted in semi-arid grassland ecosystems (Milchunas et al., 1989;
Milchunas and Lauenroth, 1993; Biondini and Manske, 1996; Fynn and O’Connor,
2000). Fynn and O’Connor (2000) stated that the variance in aboveground biomass
due to rainfall variability was almost twice as large as the variance accounted for by
grazing in a semi-arid savanna in South Africa, but they also point out that if the
condition of a grassland sward is already poor, due to persistent drought and over-
grazing, the impact of grazing is much more pronounced than in grassland swards
of good condition.
In contrast, Zhou et al. (2002) could not find a relationship between aboveground
biomass and precipitation in grazed grassland sites of the North-East China Tran-
sect (NECT), but in ungrazed and mown sites. These findings implicate that the
influence of precipitation is substituted by an increasing influence of grazing inten-
sity. However, this conclusion has to be discussed with caution, as this study is
based on one year data and failed to define what the experimental treatments,
grazing, mowing and non-grazing, actually were and in what condition these sites
have been during and before measurements were made.
The major impact of precipitation on the grassland ecosystem of the Xilin River Ba-
sin was clearly demonstrated in the current thesis, as for example the cumulative
DM-yield which was reduced by more than 50% in 2005 compared to 2004 (chapter
2) or the retarded herbage quality development (chapter 3 and 4).
The grazing experiment offers the opportunity to investigate the interrelations of
precipitation and grazing intensity more closely in the future, but this can only be
achieved over a long time period, as the inter-annual variability in precipitation is
high and extreme precipitation years influence the ecosystem function not only in
the current year, but also in the following years (Frank and McNaughton, 1993;
Fynn and O’Connor, 2000).
General discussion 118
4. Relationships to other MAGIM sub-projects
As already described in chapter 1, the MAGIM-project follows a multidisciplinary
approach to which 9 sub-projects contribute with their results obtained in different
research fields. The results will be added up to a broad perspective of the grass-
land ecosystem in the Xilin River Basin and the influence of grazing on this ecosys-
tem and its role in the degradation process. The main focus of the research group
is the evaluation of matter fluxes, including water cycle, carbon and nitrogen cycling
in the plant-soil-animal system, but also the atmospheric gas exchange. Further, a
basic assessment of the ecosystem processes was intended, e.g. description of
grassland vegetation and growth rate, assessment of the stability of soil organic
matter, or the dimension of wind and water erosion. Eventually the data obtained by
the 9 sub-project will be combined and used in biogeochemical, hydrological and
erosion models, but as well in scenario analysis of grazing management systems.
Most sub-projects investigate the grassland ecosystem in end-point evaluations,
comparing areas that had been classified to represent different levels of utilisation
intensity (ungrazed since 1979 or 1999, moderate grazing during the vegetation
period or during winter, overgrazing). The end-point evaluations provide valuable
information about the current status of the grassland and the effects of different
utilization intensities in the long-term. What can not be assessed in these studies is
the process of degradation. It remains unclear what the determinants of degrada-
tion actually are, and how they interact. In contrast, the aim of our sub-project is the
evaluation of the degradation process in its formation and development, distin-
guishing short-, mid- and long-term effects. This process-oriented evaluation will
provide a better understanding of the degradation process and the involvement and
interactions of different environmental influences and management factors.
In this we are closely connected to sub-project 4 (Institute of Animal Nutrition and
Physiology, University of Kiel), as we have together established the grazing ex-
periment and use the results obtained in this experiment mutually, like in chapter 4
or in the theses of Glindemann (2007) and Wang (2007).
The principle objective of sub-project 4 is examining the impact of grazing intensity
on biomass availability, feed intake and feed quality, as well as on animal produc-
tivity. The definition of an “optimal stocking rate” that facilitates high animal produc-
tivity due to high herbage productivity and high herbage quality in a long-term sus-
tainable grazing system is the unifying intention of the two sub-projects. The basic
comprehension of the degradation process is essential to define such a long-term
General discussion 119
sustainable management system. Management tools that can be used by local au-
thorities or even farmers to assess the current carrying capacity of the grassland,
with regard to environmental influences, are urgently needed to actively prevent the
semi-arid grasslands from degradation. The results that will be obtained in the graz-
ing experiment in the next years will provide basic data to design the needed man-
agement tools.
The identification of short-term responses of the steppe grassland to defoliation
stress was the main objective of the chapters 2 and 3, as a first step in the as-
sessment of the degradation process. It was shown that defoliation had a stimula-
tory effect on herbage productivity, what was also demonstrated for the grazing
experiment. Sub-project 2 (Institute of Soil Science and Plant Nutrition, University
of Kiel) as well determined above- and belowground productivity in order to evalu-
ate ecological and physiological mechanisms of varying productivity under different
utilization intensities. Gao (2007) showed in an end-point evaluation (as described
above) that aboveground- and belowground productivity were significantly reduced
in areas subjected to high grazing intensity compared to moderately or ungrazed
areas, what is in line with many other studies conducted in semi-arid grasslands
(see discussion chapter 2). One of the conclusions of Gao (2007) is that neither
compensatory nor overcompensatory plant growth of aboveground biomass occurs
in more intensively used areas compared to ungrazed areas. This conclusion how-
ever, has to be limited to long-term observations, as we have found overcompensa-
tory plant growth in the short-term. Both Gao (2007) and the present study agree
on the fundamental influence of precipitation on this grassland ecosystem, espe-
cially on the aboveground productivity.
5. References
Aldrich, D.T.A., Elliot, C.S., 1974. A comparison of the effects of grazing and of
cutting on the relative herbage yields of six varieties of perennial ryegrass
(Lolium perenne). Proceedings of the XII Intern. Grassland Congress, Mos-
cow 1974, Vol. III part 1, pp. 17-24.
General discussion 120
Arnold, G.W., 1981. Grazing Behaviour. In: Morley, F.H.W. (Ed.), World Animal
Science - Grazing Animals. Elsevier, Amsterdam, pp. 79-104.
Bai, Y., Han, X., Wu, J., Chen, Z., Li, L., 2004. Ecosystem stability and compensa-
tory effects in the Inner Mongolia grassland. Nature 431, 181-184.
Bakker, J.P., De Leeuw, J., Van Wieren, S.E., 1983. Micro-patterns in grassland
vegetation created and sustained by sheep-grazing. Vegetatio 55, 153-161.
Binnie, R.C., Chestnutt, D.M.B., 1991. Effect of regrowth interval on the productivity
of swards defoliated by cutting and grazing. Grass and Forage Science 46,
343-350.
Biondini, M.E., Manske, L., 1996. Grazing frequency and ecosystem processes in a
northern mixed prairie, USA. Ecological Applications 6, 239-256.
Biondini, M.E., Patton, B.D., Nyren, P.E., 1998. Grazing intensity and ecosystem
processes in a northern mixed-grass prairie, USA. Ecological Applications 8,
469-479.
Black, J.L., Kenney, P.A., 1984. Factors affecting diet selection by sheep. 2. Height
and density of pasture. Australian Journal of Agricultural Research 35, 565-
578.
Broom, D.M., Arnold, G.W., 1986. Selection by grazing sheep of pasture plants at
low herbage availability and responses of the plants to grazing. Australian
Journal of Agricultural Research 37, 527-538.
Chacon, E., Stobbs, T.H., 1976. Influence of progressive defoliation of a grass
sward on the eating behaviour of cattle. Australian Journal of Agricultural Re-
search 27, 709-727.
Christensen, L., Coughenour, M.B., Ellis, J.E., Chen, Z., 2003. Sustainability of In-
ner Mongolian Grasslands: Application of the Savanna Model. Journal of
Range Management 56, 319-327.
Coughenour, M.B., 1993. Savanna-Landscape and regional ecosystem model.
Natural Resource Ecology Laboratory. Colorado State University, Ft. Collins,
USA.
Frame, J., Hunt, I.V., 1971. The effects of cutting and grazing systems on herbage
production from grass swards. Journal of the British Grassland Society 26,
163-171.
General discussion 121
Frank, D.A., McNaughton, S.J., 1993. Evidence for the promotion of aboveground
grassland production by native large herbivores in Yellowstone National Park.
Oecologia 96, 157-161.
Fynn, R.W.S., O'Connor, T.G., 2000. Effect of stocking rate and rainfall on range-
land dynamics and cattle performance in a semi-arid savanna, South Africa.
Journal of Applied Ecology 37, 491-507.
Gao, Y.Z., 2007. Influences of different land use management on net primary pro-
ductivity and belowground carbon allocation in a semi-arid Inner Mongolia
steppe. PhD-Thesis, University of Kiel.
Glindemann, T., 2007. Effect of grazing intensity on feed intake and productivity of
sheep in the Inner Mongolian steppe. PhD-Thesis, University of Kiel.
Huxman, T.E., Smith, M.D., Fay, P.A., Knapp, A.K., Shaw, M.R., Loik, M.E., Smith,
S.D., Tissue, D.T., Zak, J.C., Weltzin, J.F., Pockman, W.T., Sala, O.E.,
Haddad, B.M., Harte, J., Koch, G.W., Schwinning, S., Small, E.E., Williams,
D.G., 2004. Convergence across biomes to a common rain-use effciency. Na-
ture 429, 651-654.
Knapp, A.K., Fay, P.A., Blair, J.M., Collins, S.L., Smith, M.D., Carlisle, J.D., Harper,
C.W., Danner, B.T., Lett, M.S., McCarron, J.K., 2002. Rainfall variability, car-
bon cycling, and plant species diversity in a mesic grassland. Science 298,
2202-2205.
Krümmelbein, J., 2007. Influence of various grazing intensities on soil stability and
water balance of a steppe soil in Inner Mongolia, P.R. China. PhD-Thesis,
University of Kiel.
Laca, E.A., Lemaire, G., 2000. Measuring sward structure. In: ‘t Mannetje, L., Jones,
R.M. (eds.), Field and laboratory methods for grassland and animal produc-
tion research. Cabi Publishing, Wallingford, UK, pp. 103-122.
Le Houérou, H.N., 1984. Rain use efficiency: a unifying concept in arid-land ecol-
ogy. Journal of Arid Environments 7, 213-247.
Li, Y.H., 1989. Impact of grazing on Aneurolepidium chinense steppe and Stipa
grandis steppe. Acta Oecologica/Oecologia Applicata 10, 31-46.
Lieth, H., Witthaker, R.H., 1975. Primary productivity of the biosphere. Springer
Verlag, Berlin.
General discussion 122
Liu, Z.L., Wang, W., Liang, C.Z., Hao, D.Y., 1998. The regressive succession pat-
tern and its diagnostic of Inner Mongolia steppe in sustained and super-strong
grazing. Acta Agrestia Sinica 6, 244-251. (in Chinese, with English abstract)
McNaughton, S.J., Milchunas, D.G., Frank, D.A., 1996. How can net primary pro-
ductivity be measured in grazing ecosystems? Ecology 77, 974-977.
Milchunas, D.G., Lauenroth, W.K., 1993. Quantitative effects of grazing on vegeta-
tion and soils over a global range of environments. Ecological Monographs 63,
327-366.
Milchunas, D.G., Lauenroth, W.K., Chapman, P.L., Kazempour, M.K., 1989. Effects
of grazing, topography, and precipitation on the structure of a semiarid grass-
land. Vegetatio 80, 11-23.
Milne, J.A., 1991. Diet selection by grazing animals. Proceedings of the Nutrition
Society 50, 77-85.
Ni, J., 2004. Estimating net primary productivity of grassland from field biomass
measurements in temperate northern China. Plant Ecology 174, 217-234.
Noy-Meir, I., 1973. Desert ecosystems: environment and producers. Annual Review
of Ecology and Systematics 4, 25-51.
O’Reagain, P.J., Schwartz, J., 1995. Dietary selection and foraging strategies of
animals on rangeland. Coping with spatial and temporal variability. Intern.
Symposium on the nutrition of herbivores 4, 407-423.
Oesterheld, M., Loreti, J., Semmartin, M., Paruelo, J.M., 1999. Grazing, fire, and
climate effects on primary productivity of grasslands and savannas. In:
Walker, L.R., Goodall, D.W. (eds.), Ecosystems of the world 16 – Ecosystems
of disturbed ground. Elsevier Science, Amsterdam, pp. 287-306.
Russelle, M.P., 1992. Nitrogen cycling in pasture and range. Journal of Production
Agriculture 5, 13-23.
Tamminga, S., 1996. A review on environmental impacts of nutritional strategies in
ruminants. Journal of Animal Science 74, 3112-3124.
Verburg, P.H., Van Keulen, H., 1999. Exploring changes in the spatial distribution
of livestock in China. Agricultural Systems 62, 51-67.
Wang, C., 2007. Development and Application of a method to estimate feed di-
gestibility in sheep grazing differently managed grasslands in Inner Mongolia,
China. PhD-Thesis, University of Kiel.
General discussion 123
Wang, R.Z., 2004. Responses of Leymus chinensis (Poaceae) to long-term grazing
disturbance in the Songnen grasslands of north-eastern China. Grass and
Forage Science 59, 191-195.
Wang, R.Z., Ripley, E.A., 1997. Effects of grazing on a Leymus chinensis grassland
on the Songnen plain of north-eastern China. Journal of Arid Environments 36,
307-318.
Wang, R.Z., Ripley, E.A., Zu, Y.G., Nie, S.Q., 2001. Demography of reproductive
and biomass allocation of grassland and dune Leymus chinensis on the
Songnen Plain, north-eastern China. Journal of Arid Environments 49, 289-
299.
Willms, W.D., Dormaar, J.F., Schaalje, G.B., 1988. Stability of grazed patches on
rough fescue grasslands. Journal of Range Management 41, 503-508.
Wolton, K.M., 1963. An investigation into the simulation of nutrient returns by the
grazing animal in grassland experimentation. Journal of the British Grassland
Society 18, 213-219.
Xiao, X.M., Wang, Y.F., Jiang, S., Ojima, D.S., Bonham, C.D., 1995. Interannual
variation in the climate and above-ground biomass of Leymus chinensis
steppe and Stipa grandis steppe in the Xilin River basin, Inner Mongolia,
China. Journal of Arid Environments 31, 283-299.
Xiao, X.M., Jiang, S., Wang, Y.F., Ojima, D.S., Bonham, C.D., 1996. Temporal
variation in aboveground biomass of Leymus chinensis steppe from species
to community levels in the Xilin River Basin, Inner Mongolia, China. Vegetatio
123, 1-12.
Yu, M., Ellis, J.E., Epstein, H.E., 2004. Regional analysis of climate, primary pro-
duction, and livestock density in Inner Mongolia. Journal of Environmental
Quality 33, 1675-1681.
Zhou, G., Wang, Y., Wang, S., 2002. Responses of grassland ecosystems to pre-
cipitation and land use along the Northeast China Transect. Journal of Vege-
tation Science 13, 361-368.

Chapter 6
Summary
Summary 125
6.1 Summary
The degradation of grassland steppes due to overgrazing is the crucial ecological
and socio-economical problem in Inner Mongolia. The degradation of grasslands is
addressed by the MAGIM-project (Matter fluxes in Grasslands of Inner Mongolia as
influenced by stocking rate) in a multidisciplinary approach, in close collaboration
with Chinese Scientists. The degradation of Inner Mongolia grasslands was mainly
described retrospectively by ecological studies, but the formation and development
of degradation were only rarely examined. The present thesis was prepared within
MAGIM sub-project 3, whose main focus is evaluating the degradation process in
Inner Mongolia steppe grasslands with regard to short-, mid- and long-term effects
of increasing grazing intensity. The objectives of the present thesis were to de-
scribe short-term effects of defoliation stress (i) by plant-related parameters known
from classical growth analysis, as well as (ii) by herbage quality parameters, both
obtained in a cutting-frequency experiment. A further objective was the comparison
of the digestibility of herbage ingested and herbage on offer in a grazing experi-
ment, comprising a gradient of 6 grazing intensities, in order to assess the selectiv-
ity of grazing sheep.
The cutting-frequency experiment was conducted in 2004 and 2005 in a semi-arid
grassland sward of the Xilin River Basin, Inner Mongolia. The sward was subjected
to three different cutting-frequencies to compare the effects of increasing defoliation
stress.
Defoliation stress positively influenced the herbage aboveground productivity, the
nitrogen uptake and therewith the crude protein content in both years. The positive
effects on herbage productivity were confirmed by increased specific leaf area and
increased leaf area index under defoliation stress. Short-term effects on root mass
and root carbohydrate reserves were not observed, as well as on species composi-
tion and tiller density, what confirmed the expectation that species composition and
tiller density are not changing in the short-term. The herbage quality parameters
cell wall content and its composition, the digestibility of organic matter and the non-
structural carbohydrate content partly indicated short-term responses, but these
responses were not consistent between treatments and years. This demonstrated
that the herbage quality parameters were more susceptible to climatic fluctuations
and seasonal dynamics than to defoliation stress.
Summary 126
The strong impact of precipitation on the investigated grassland sward became also
apparent in the evaluation of plant-related parameters, as herbage productivity was
in fact stimulated by frequent defoliation, but simultaneously substantially reduced
due to low precipitation rate. The increase in herbage productivity and crude protein
content in response to frequent defoliation in both experimental years shows that
the steppe grassland is resistant to defoliation stress in the short term, even under
drought conditions.
The grazing experiment was started in June 2005 in the same study area as the
cutting-frequency experiment. Besides the future objectives of this experiment re-
garding the assessment of the degradation process, it was tested on the basis of
one-year data from 2005, whether the in vitro estimated organic matter digestibility
(OMD) of herbage on offer differs from the in vivo determined OMD of herbage in-
gested, as it can be expected due to selective grazing. As six grazing intensities
were compared it was hypothesised that the differences between herbage on offer
and herbage ingested were high in low grazing intensities, because grazing ani-
mals were able to select and low in high grazing intensities, as selectivity was lim-
ited due to reduced herbage on offer. The differences between in vivo and in vitro
OMD might be used as an index for the selectivity of the grazing sheep in the graz-
ing experiment in 2005.
Herbage on offer significantly decreased with increasing grazing intensity, as it was
expected. But the OMD was not significantly influenced by grazing intensity, neither
the in vivo OMD, nor the in vitro OMD. Therefore the hypothesised convergence of
in vivo and in vitro OMD in high grazing intensities was not observed. This result
suggests that herbage ingested and herbage on offer were similar and that selectiv-
ity was not very pronounced in 2005. This argument is supported by the results that
firstly, the quality structure of herbage on offer was rather homogenous, especially
the vertical quality structure, and that secondly, the green herbage proportion of
herbage on offer remained constant across the grazing intensities. A difference in
selectivity between grazing intensities was therefore not observed in 2005.
It can be concluded that defoliation stress has a positive effect on productivity, and
partly on herbage quality, in the short-term. Furthermore, the fundamental impact of
climatic fluctuations, especially precipitation rate and distribution, on the investi-
gated grassland ecosystem was revealed.
Summary 127
6.2 Zusammenfassung
Überbeweidung führte in letzten Jahrzehnten zu starker Degradation der Grasland-
Steppen der Inneren Mongolei, so dass heute die Degradation das vordringlichste
ökologische und sozio-ökonomische Problem in dieser Region ist. Die Forscher-
gruppe MAGIM (Matter fluxes in Grasslands of Inner Mongolia as influenced by
stocking rate) befasst sich mit diesem Problem in einem multi-disziplinären Ansatz
in enger Kooperation mit chinesischen Wissenschaftlern. Bisher wurde die Degra-
dation der Grasland-Steppen in ökologischen Studien zumeist rückblickend be-
schrieben, wohingegen die Entstehung und der Entwicklungsprozess nur selten
beschrieben wurden. Die vorliegende Arbeit entstand innerhalb des MAGIM-
Teilprojekts 3, dessen Hauptziel die Evaluierung des Degradierungsprozesses ins-
gesamt und der kurz-, mittel- und langfristigen Effekte von zunehmender Bewei-
dungsintensität ist. Das Ziel dieser Arbeit war es, kurzfristige Effekte von Bewei-
dungsstress durch (i) pflanzenbaulich relevante Parameter, sowie (ii) Futterquali-
tätsparameter zu beschreiben. Diese Untersuchungen wurden in einem Schnittver-
such durchgeführt, in dem Beweidungsstress durch verschiedene Schnittintensitä-
ten simuliert wurde. Des Weiteren wurde in einem Beweidungsexperiment, das
insgesamt 6 Beweidungsintensitäten umfasste, die Verdaulichkeit des aufgenom-
men und des angebotenen Futters verglichen, um die erwarteten Unterschiede im
Hinblick auf selektive Futteraufnahme zu interpretieren.
Der Schnittversuch wurde in den Jahren 2004 und 2005 im semi-ariden Grasland
des Xilin-Flussbeckens in der Inneren Mongolei durchgeführt. Der Graslandbestand
wurde drei verschieden Schnittintensitäten ausgesetzt, um den Einfluss zuneh-
mender Schnittintensität zu prüfen.
Die Produktion oberirdischer Biomasse, sowie die Stickstoffaufnahme und damit
der Rohproteingehalt, wurden durch zunehmende Schnittintensität in beiden Ver-
suchsjahren signifikant gesteigert. Die positiven Effekte auf die Produktivität wur-
den auch durch die gesteigerte spezifische Blattfläche und den Blattflächenindex
bestätigt. Kurzfristige Veränderungen der Wurzelmasse und der Kohlenhydratre-
serven in der Wurzel wurden nicht beobachtet, ebenso wie Veränderungen der
Artzusammensetzung und der Triebdichte, was der Erwartung entsprach, dass Art-
zusammensetzung und Triebdichten sich kurzfristig nicht verändern würden. Die
Futterqualitätsparameter Zellwandgehalt und -zusammensetzung, sowie die Ver-
daulichkeit der Organischen Masse (OMD) und die Gehalte an Nicht-
Summary 128
Strukturkohlenhydraten zeigten zum Teil kurzfristige Veränderungen, allerdings
waren diese weder zwischen den Behandlungen, noch zwischen den Jahren kon-
stant. Dies zeigte deutlich, dass die Futterqualitätsparameter mehr durch witte-
rungsbedingte Schwankungen und Saisoneinflüsse beeinflusst wurden, als durch
unterschiedliche Schnittintensitäten. Der starke Einfluss der Niederschläge auf das
untersuchte Grasland zeigte sich ebenfalls deutlich in den pflanzenbaulich relevan-
ten Parametern, z.B. in der Tatsache dass die Biomasseproduktivität 2005 zwar
durch häufigere Schnittnutzung gesteigert wurde, aber gleichzeitig um mehr als
50%, im Vergleich zu 2004, reduziert wurde. Der Anstieg des Biomasseertrags und
des Rohproteingehalts durch intensivere Schnittnutzung zeigte, dass die Grasland-
Steppe kurzfristig einer intensiven Nutzung widerstehen kann, sogar unter Tro-
ckenstress wie im Jahr 2005.
Das Beweidungsexperiment startete im Juni 2005 im gleichen Untersuchungsge-
biet wie der Schnittversuch. Neben den in Zukunft zu prüfenden Fragestellungen
hinsichtlich des Degradierungsprozesses, war die Hypothese, die anhand einjähri-
ger Daten geprüft wurde, das die OMD des tatsächlich aufgenommen Futters durch
die in-vitro ermittelte OMD des angebotenen Futters unterschätzt wird, wenn das
Futterangebot ausreichend ist, da den Weidetieren die Möglichkeit zur selektiven
Futteraufnahme gegeben wird. Wenn dass Futterangebot sinkt, z.B. durch höheren
Beweidungsdruck, dann sollte die OMD des angebotenen Futters ungefähr dem
des aufgenommenen Futters entsprechen, da den Weidetieren kaum Möglichkeit
zur Selektion bleibt. Diese Differenzen zwischen der OMD des aufgenommen und
des angebotenen Futters können als Maß für die Selektivität der Weidetiere in den
verschiedenen Beweidungsintensitäten genutzt werden.
Das Futterangebot war, wie erwartet, in den hohen Beweidungsintensitäten signifi-
kant geringer. Die OMD war zwischen den Beweidungsintensitäten allerdings nicht
signifikant verschieden, weder die in vivo OMD noch in-vitro OMD. Die erwartete
Annährung der beiden OMD-Werte wurde daher nicht beobachtet. Das Ergebnis,
dass das aufgenommene Futter sich kaum vom angebotenen Futter unterschied,
wurde durch zwei weitere Ergebnisse gestützt. Erstens, die Qualitätsstruktur des
angebotenen Futters war in sich sehr homogen, besonders die vertikale Struktur,
und zweitens war der Anteil an nekrotischer Biomasse im angebotenen Futter über
alle Beweidungsintensitäten hinweg relativ konstant. So kann für das Jahr 2005
festgehalten werden, dass die Weidetiere kaum selektiert haben, bzw. selektieren
konnten.

Summary 129
Höhere Nutzungsintensitäten haben kurzfristig einen positiven Effekt auf die Pro-
duktivität, und z.T. auch auf die Futterqualität der natürlichen Graslandvegetation
der Inneren Mongolei. Es zeigte sich, dass witterungsbedingte Schwankungen,
insbesondere die Menge und die Verteilung der Niederschläge, einen sehr großen
Einfluss auf das gesamte Grasland-Ökosystem haben.
Lebenslauf
Persönliche Daten: Anne Kathrin Schiborra
geboren am 20. Oktober 1977 in Lengerich/Westf.
ledig
Staatsangehörigkeit: deutsch
Schulausbildung:
1984 - 1988 Grundschule Stadtfeldmark, Lengerich/Westf.
1988 - 1991 Städt. Gymnasium, Lengerich/Westf.
1991 - 1992 Graf-Adolf-Gymnasium, Tecklenburg
1992 - 1994 Fr.-v. Bodelschwingh Realschule,
Lengerich/Westf., Abschluss: Mittlere Reife
1994 - 1997 Hannah-Arendt-Gymnasium, Lengerich/Westf.
(vormals Städt. Gymnasium) Abschluss: Abitur
Berufsausbildung:
9/1997 - 8/1998 Jahrespraktikum im Betrieb Klack, Versmold
Abschluss: Praktikantenprüfung
10/1998 - 7/2000 Grundstudium der Agrarwissenschaften an der
Rheinischen Friedrich-Wilhelms-Universität, Bonn
11/2000 - 5/2001 Praktikum auf einer Milchviehfarm in Rakaia,
Neuseeland
10/2001 - 1/2004 Hauptstudium der Agrarwissenschaften an der
Rheinischen Friedrich-Wilhelms-Universität, Bonn
Studienrichtung: Tierwissenschaften
Abschluss: Diplom-Agraringenieurin
4/2004 – 9/2007 Wissenschaftliche Mitarbeiterin/Doktorandin am
Institut für Pflanzenbau und Pflanzenzüchtung
-Grünland und Futterbau/Ökologischer Landbau-
Christian-Albrechts-Universität zu Kiel
Acknowledgement/Danksagung
Ich danke meinem Doktorvater Prof. Dr. Taube für die Überlassung des Themas,
die Chance in dieser spannenden Forschergruppe arbeiten zu dürfen und die fach-
liche und menschliche Unterstützung bei der Entstehung dieser Arbeit.
Ich danke meinem Betreuer Dr. Martin Gierus für die gute Zusammenarbeit, die
ständige Diskussionsbereitschaft und das stete Interesse an meiner Arbeit.
Ich danke Prof. Dr. Susenbeth für die Übernahme des Co-Referats, sowie die inte-
ressanten und inspirierenden Diskussionen.
Ich danke meinen Eltern und meiner Schwester für ihre moralische Unterstützung
und ihre stets „offenen Ohren“.
Ich danke besonders Karin Makoben für die Analysen meiner zahlreichen „Mongo-
leiproben“ und Petra Voss für die Unterstützung bei der „Zuckerforschung“, sowie
Marita Krumbholz und Rita Kopp.
I am indebted to the numerous field workers helping to sample, separate and mill
all the grass samples in Inner Mongolia, thank you!
Thanks to all MAGIM colleagues for the good team work, especially to Wan Hong-
wei for carrying out together the “small experiment”. I had a lot of fun and especially
appreciate to have had the chance to learn so much about life in Inner Mongolia.
Danke Thomas für die gute Zusammenarbeit, die mir immer sehr viel Spaß ge-
macht hat, und deine Unterstützung in „kritischen Zeiten“.
Danke all den „Mitdoktoranden“ im Institut für die tolle Arbeitsatmosphäre und die
Kameradschaft. Besonders danken möchte ich Heba und Marc, den nettesten und
unterhaltsamsten Kollegen aller Zeiten!
Und zu guter letzt danke ich Martin, meinem Freund, der immer für mich da ist, auf
den ich mich immer verlassen kann … ich danke dir!!