Short and long term prognosis of disability in Multiple Sclerosis Some Tools, Models and Validation...
46
Short and long term prognosis of disability in Multiple Sclerosis Some Tools, Models and Validation A. Neuhaus, M. Daumer
-
date post
19-Dec-2015 -
Category
Documents
-
view
214 -
download
0
Transcript of Short and long term prognosis of disability in Multiple Sclerosis Some Tools, Models and Validation...
Short and long term prognosis of disability in Multiple Sclerosis
Some Tools, Models and Validation
A. Neuhaus, M. Daumer
Outline
Background about MS
Online Analytical Processing Tool “Risk Profile” Segmented Regression and Correction for Error
Validation Strategy & examples
Multiple Sclerosis (MS)
common neurological degenerative disease
2.5 million people affected worldwide
drugs have shown efficacy on short-term outcomes
agents are by no means ‘cure’ – many patients have disease activity
long term determination of efficacy is necessary
Background
Multiple Sclerosis (MS)
Multiple Sclerosis
Disease courses
Disability
Relapse
MRI
Cause
CNS
Background
Disease courses
Disability
Relapse
MRI
Cause
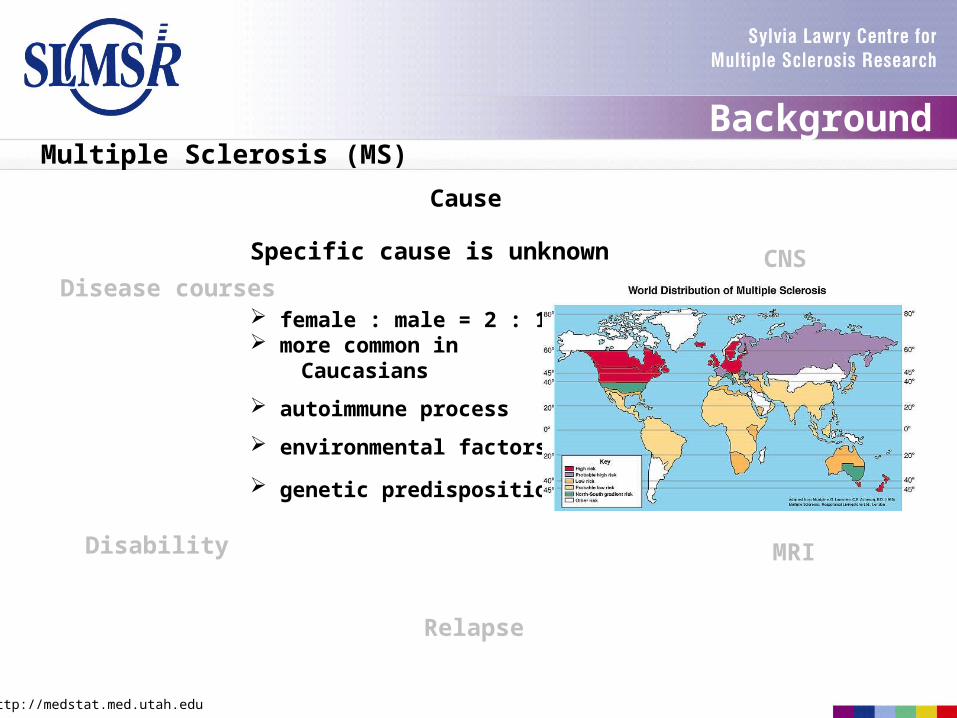
CNSSpecific cause is unknown
female : male = 2 : 1 more common in Caucasians
autoimmune process
environmental factors
genetic predisposition
MRI
http://medstat.med.utah.edu
BackgroundMultiple Sclerosis (MS)
Relapse
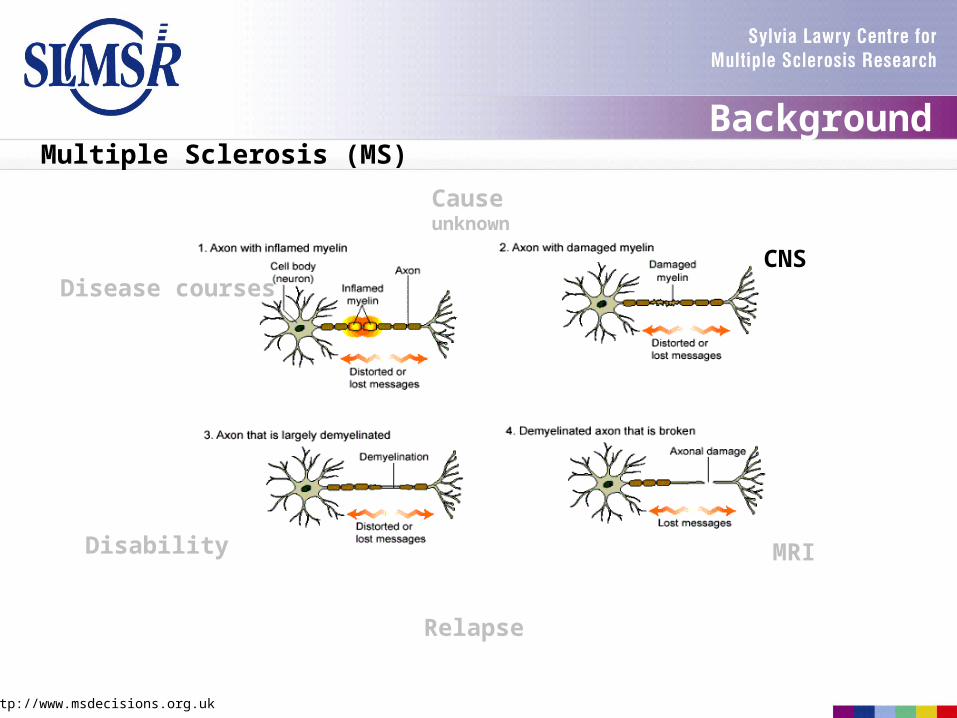
Causeunknown
Disability
Disease courses
MRI
CNS
http://www.msdecisions.org.uk
Multiple Sclerosis (MS)Background
Disease courses
Disability
Relapse
MRI
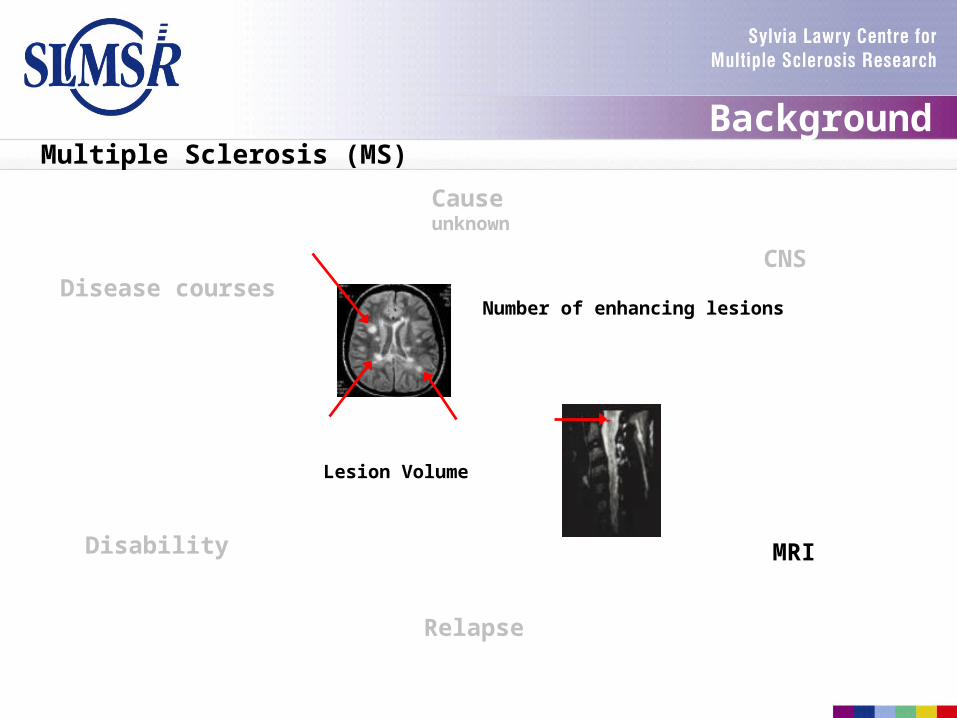
Causeunknown
CNS
Lesion Volume
Number of enhancing lesions
BackgroundMultiple Sclerosis (MS)
Disease courses
Disability
Relapse
MRI
Causeunknown
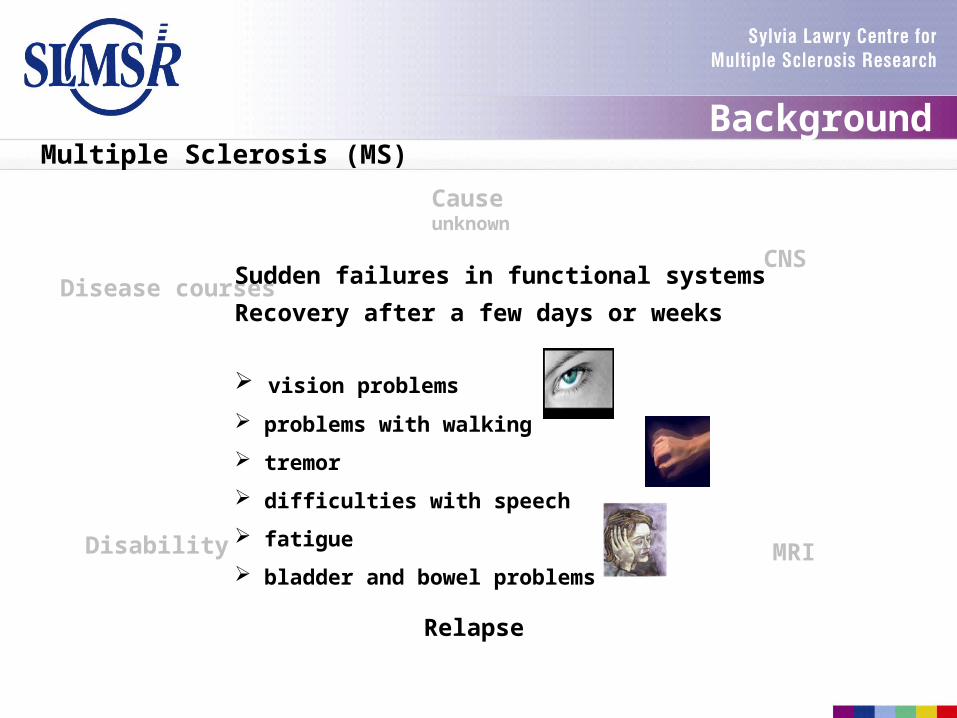
CNSSudden failures in functional systems
Recovery after a few days or weeks
vision problems
problems with walking
tremor
difficulties with speech
fatigue
bladder and bowel problems
BackgroundMultiple Sclerosis (MS)
Disease courses
Disability
Relapse
MRI
Causeunknown
CNS
sudden failures
BackgroundMultiple Sclerosis (MS)
Disease courses
Disability
Relapse
MRI
Causeunknown
CNS
sudden failures
EDSS
time
dis
ab
ilit
y Relapsing Remitting
time
dis
ab
ilit
y Secondary Progressive
timed
isa
bil
ity Primary Progressive
time
dis
ab
ilit
y Clinically Isolated Syndrome
BackgroundMultiple Sclerosis (MS)
Outline
Background
OnLine Analytical Processing Tool Segmented Regression and Correction for Error
Improvement of Outcome Measures
Validation Strategies
Make the database of the SLCMSR (20.000 patients, 45 data sets)available to health care professionals via the internet
Identification of database subgroups based on clinical parameters
Statistical analyses of subgroups
Illustration of future disease course of subgroups
AimOLAP
Tool
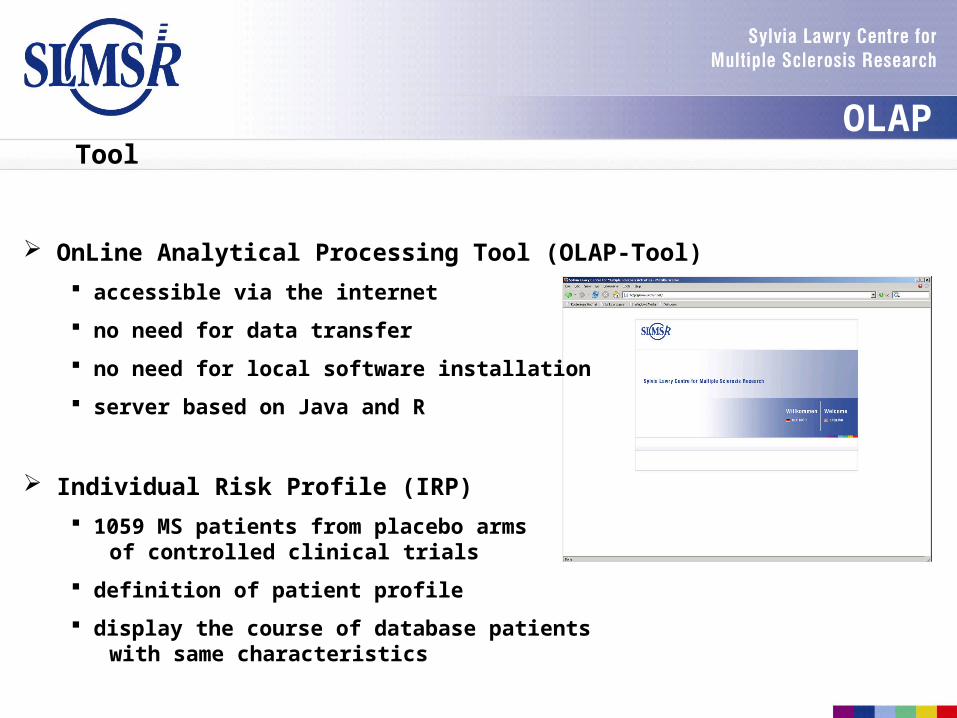
OnLine Analytical Processing Tool (OLAP-Tool)
accessible via the internet
no need for data transfer
no need for local software installation
server based on Java and R
Individual Risk Profile (IRP)
1059 MS patients from placebo arms of controlled clinical trials
definition of patient profile
display the course of database patients with same characteristics
OLAP
Hurdles
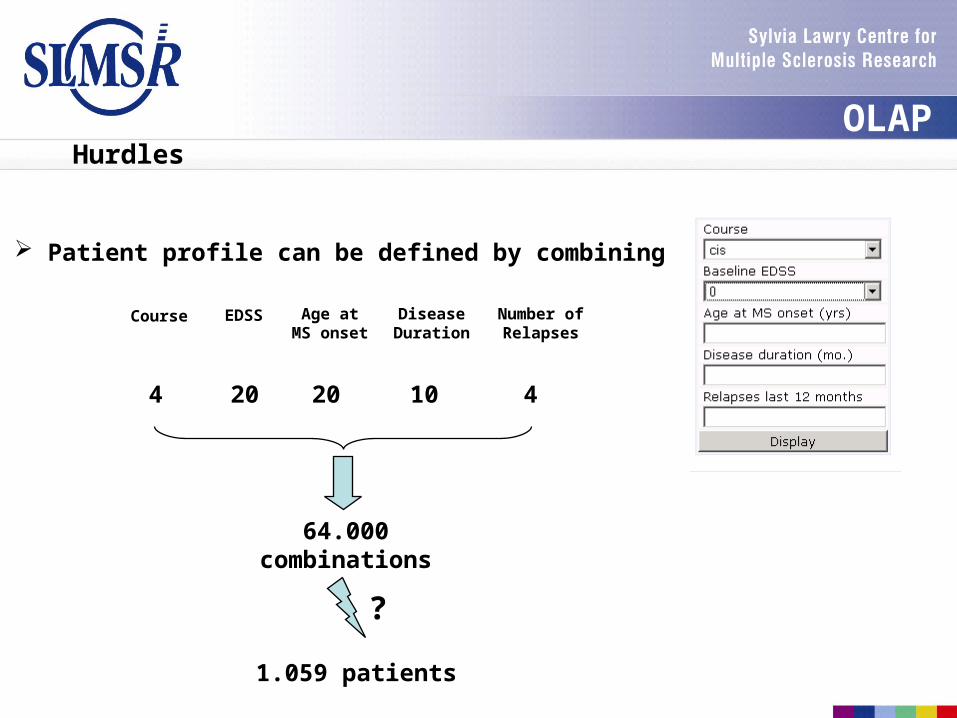
Patient profile can be defined by combining
Course EDSS Age atMS onset
DiseaseDuration
Number ofRelapses
4 20 420 10
64.000combinations
1.059 patients
?
OLAP
Hurdles
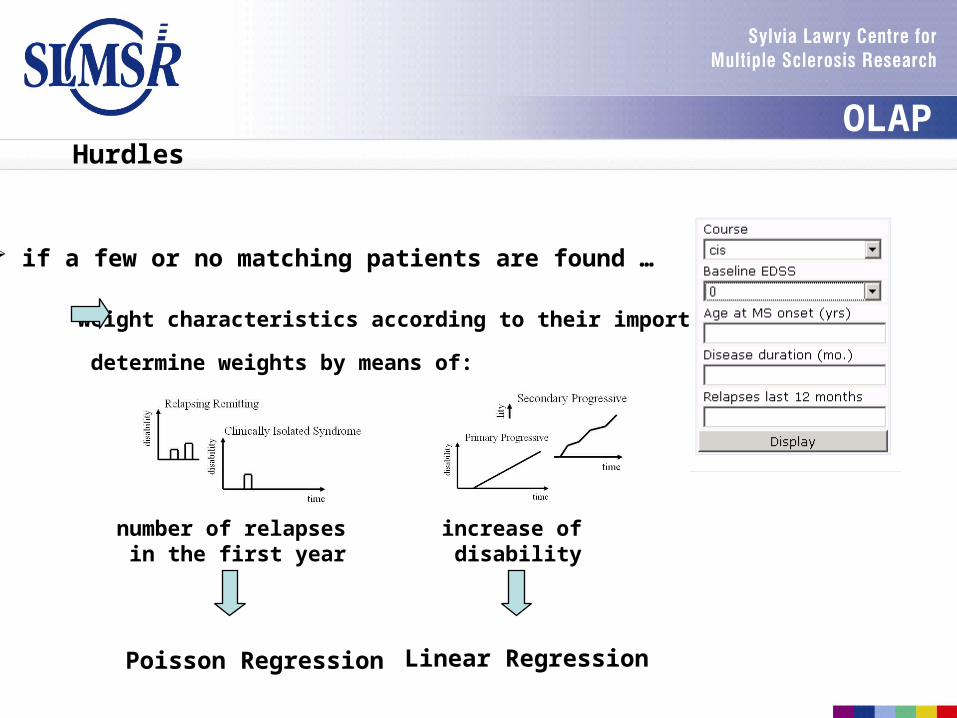
if a few or no matching patients are found …
weight characteristics according to their importance
determine weights by means of:
number of relapses in the first year
increase of disability
Poisson Regression Linear Regression
OLAP
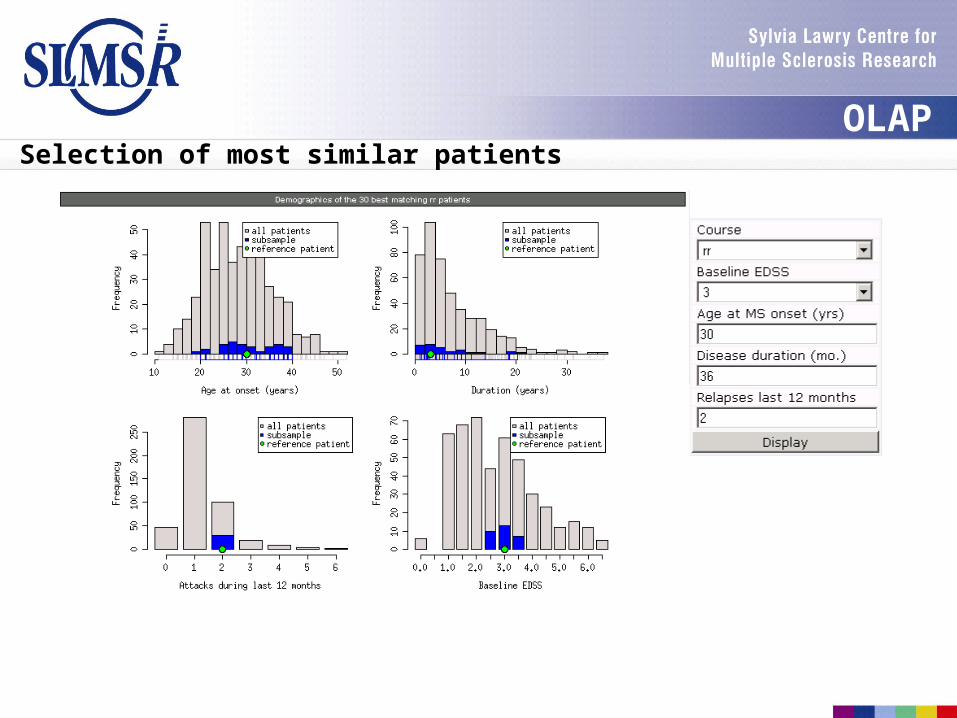
Selection of most similar patientsOLAP
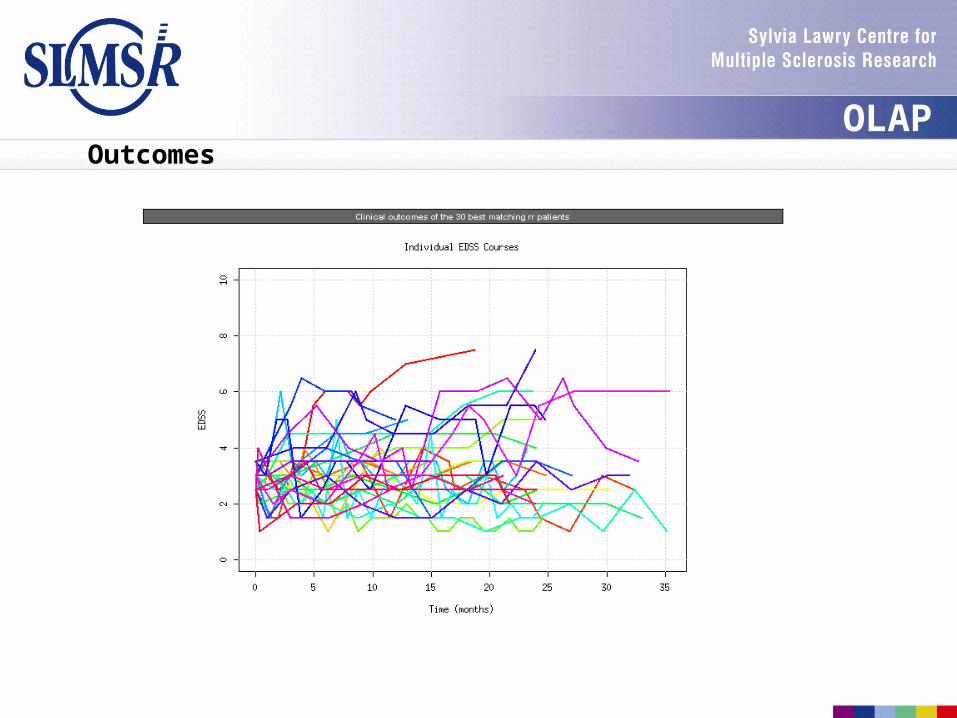
OutcomesOLAP
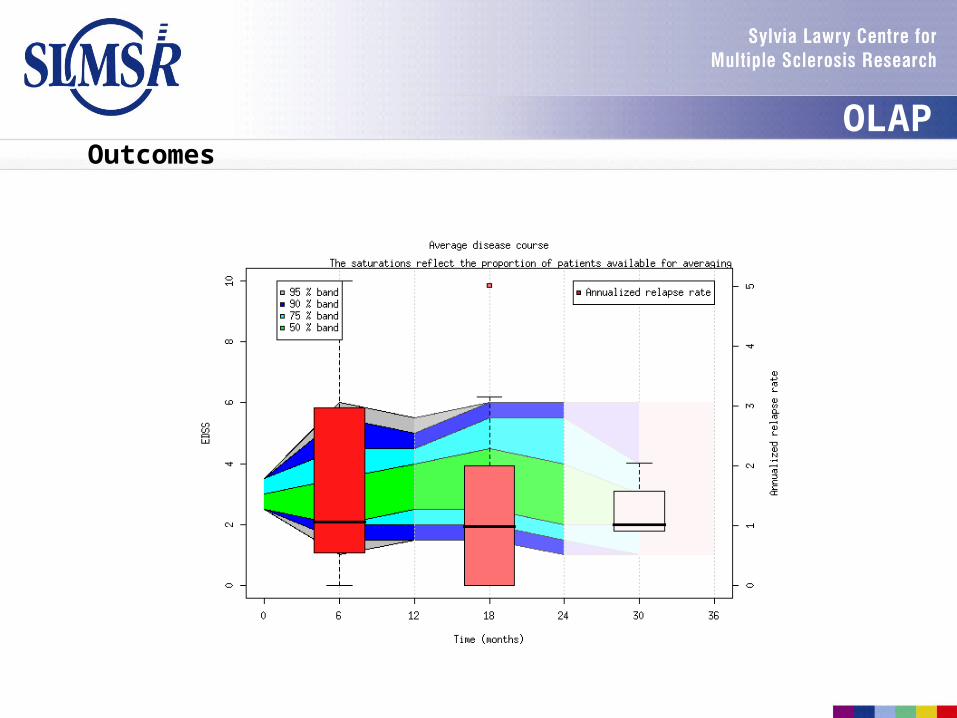
OutcomesOLAP
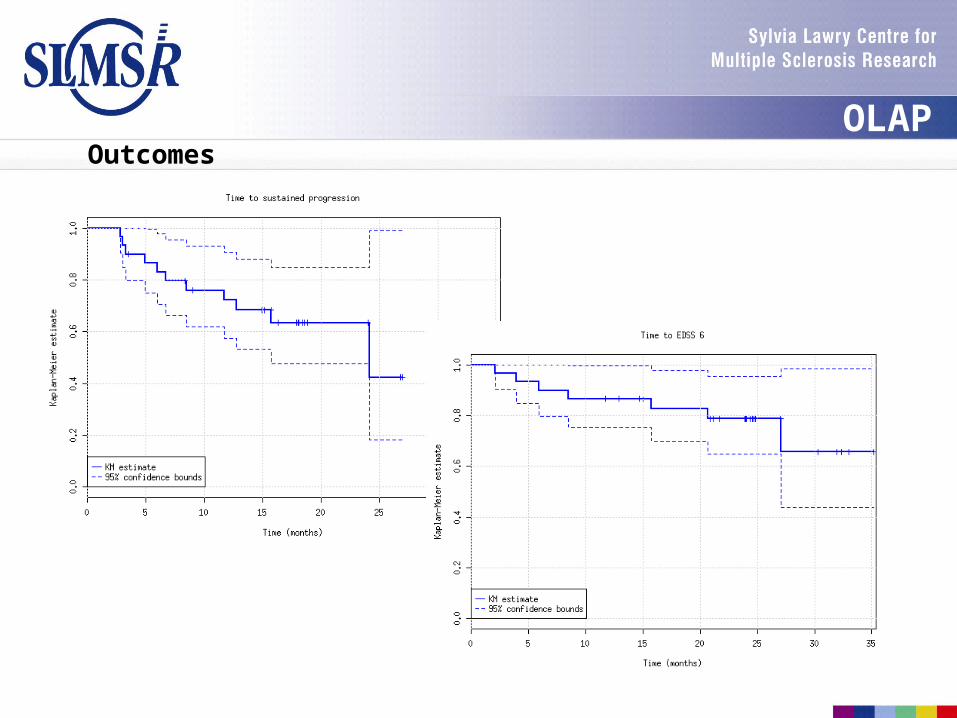
OutcomesOLAP
OLAPNext steps
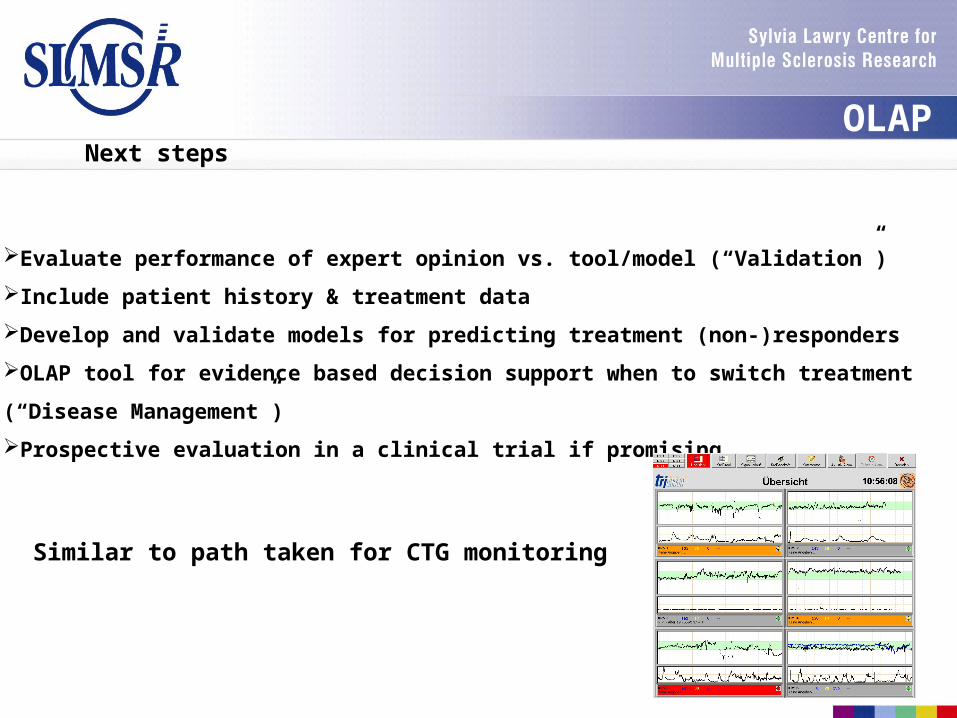
Evaluate performance of expert opinion vs. tool/model (“Validation”)
Include patient history & treatment data
Develop and validate models for predicting treatment (non-)responders
OLAP tool for evidence based decision support when to switch treatment
(“Disease Management”)
Prospective evaluation in a clinical trial if promising
Similar to path taken for CTG monitoring
Outline
Background
OnLine Analytical Processing Tool Segmented Regression and Correction for Error
Improvement of Outcome Measures
Validation Strategies
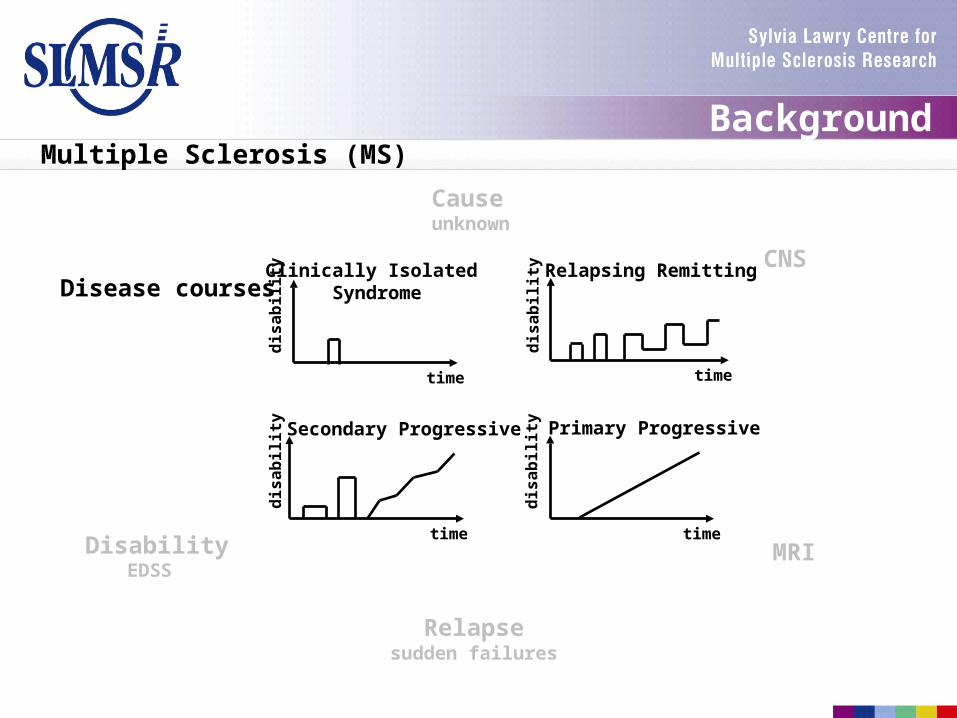
secondary progressive phase
time
dis
ab
ilit
y relapsing remitting phase
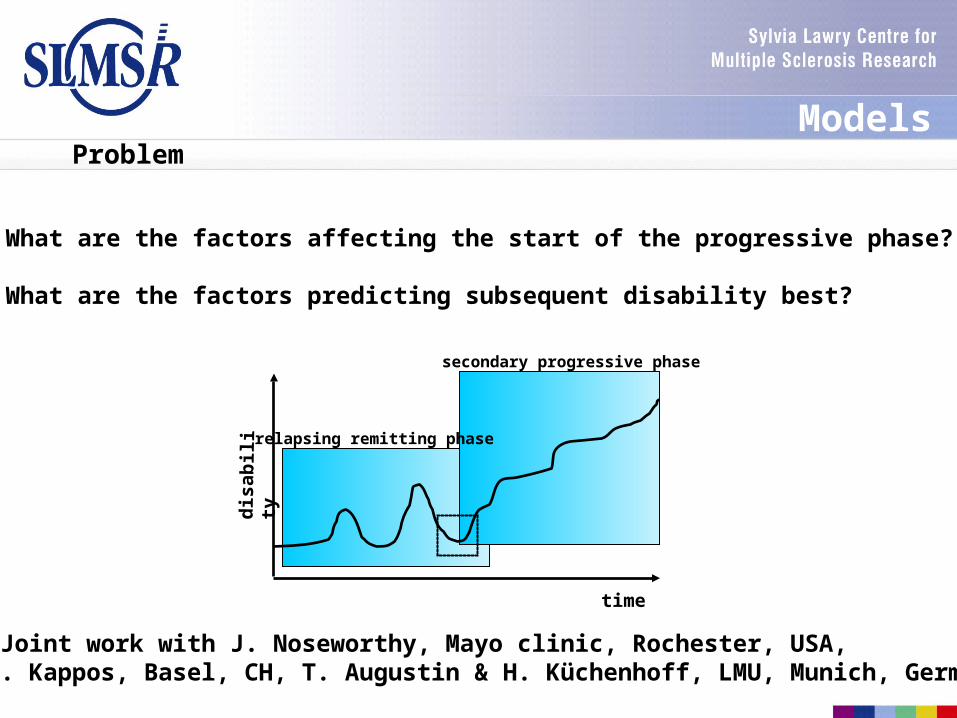
What are the factors affecting the start of the progressive phase?
What are the factors predicting subsequent disability best?
Problem Models
Joint work with J. Noseworthy, Mayo clinic, Rochester, USA, L. Kappos, Basel, CH, T. Augustin & H. Küchenhoff, LMU, Munich, Germany
Restrictions to data
Patients in the first phase of the disease (RRMS)
disability level < 6.5
inclusion in a controlled clinical trial
at least 4 observations in longitudinal data
complete data in covariates
355 RRMS patients from placebo arms of 16 clinical trials
Models
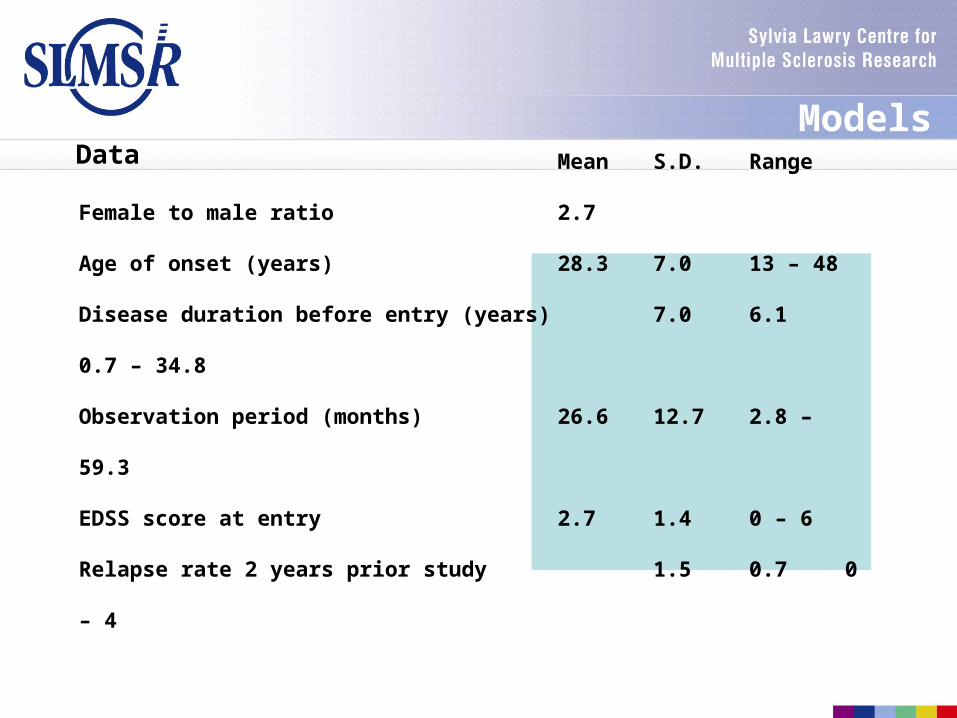
Data
Mean S.D. Range
Female to male ratio 2.7
Age of onset (years) 28.3 7.0 13 – 48
Disease duration before entry (years) 7.0 6.1 0.7 – 34.8
Observation period (months) 26.6 12.7 2.8 – 59.3
EDSS score at entry 2.7 1.4 0 – 6
Relapse rate 2 years prior study 1.5 0.7 0 – 4
Models
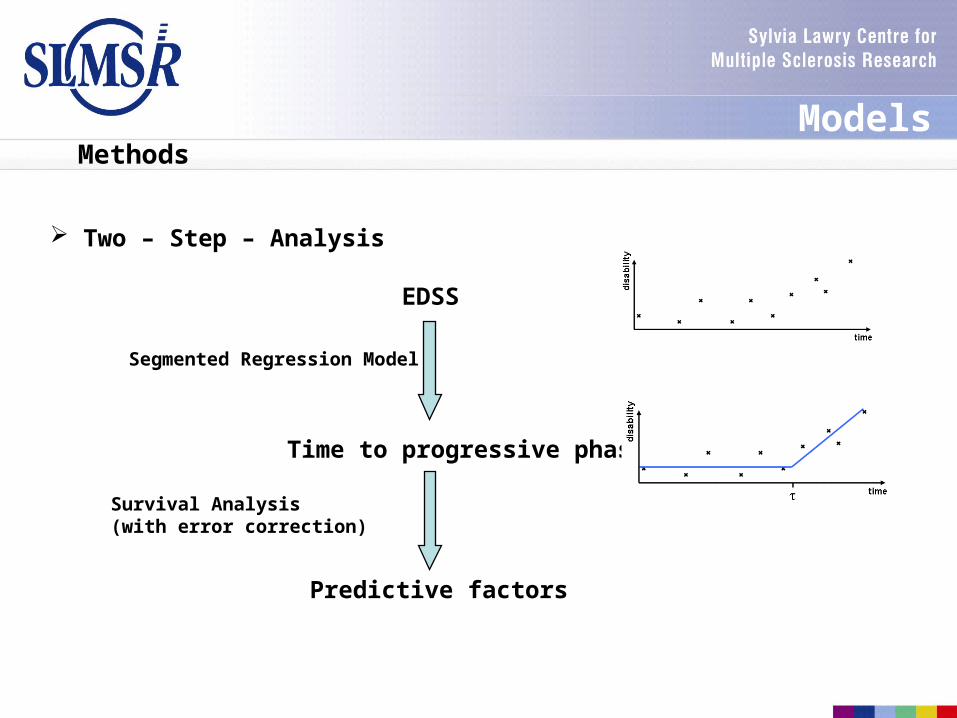
Methods
Two – Step – Analysis
EDSS
Time to progressive phase
Segmented Regression Model
Predictive factors
Survival Analysis(with error correction)
Models
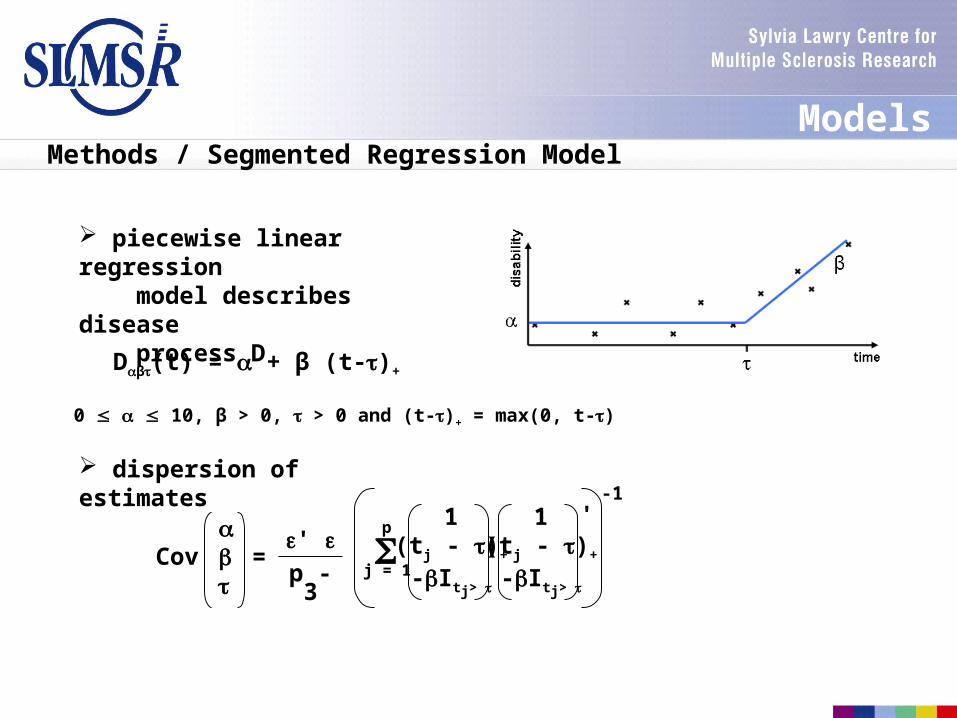
Methods / Segmented Regression Model
piecewise linear regression model describes disease process D
Dβ(t) = + β (t-)+
dispersion of estimates
Cov
' p - 3
1(tj - )+
-Itj>
1(tj - )+
-Itj>
j = 1
p
=
'-1
0 10, β > 0, > 0 and (t-)+ = max(0, t-)
Models

Methods / Survival Analysis
Correct determination of time of change is impossible
• , estimated time to progression, is overlaid by an error e
• magnitude of the error will be considered in the survival model
Assumptions:
• true, but unknown, event times t follow a Weibull distribution
• relation between and e: = t · e, t e
log = log t + log e
log = x´β + ( + ), = -1 log e
• exp - ~ (,)
Survival function follows a Burr distribution
S() = [1 + {exp(-x')}-1 -2 2]- 2-2
2 = var (log ) and = 2 -2
Models
Methods / Survival Analysis
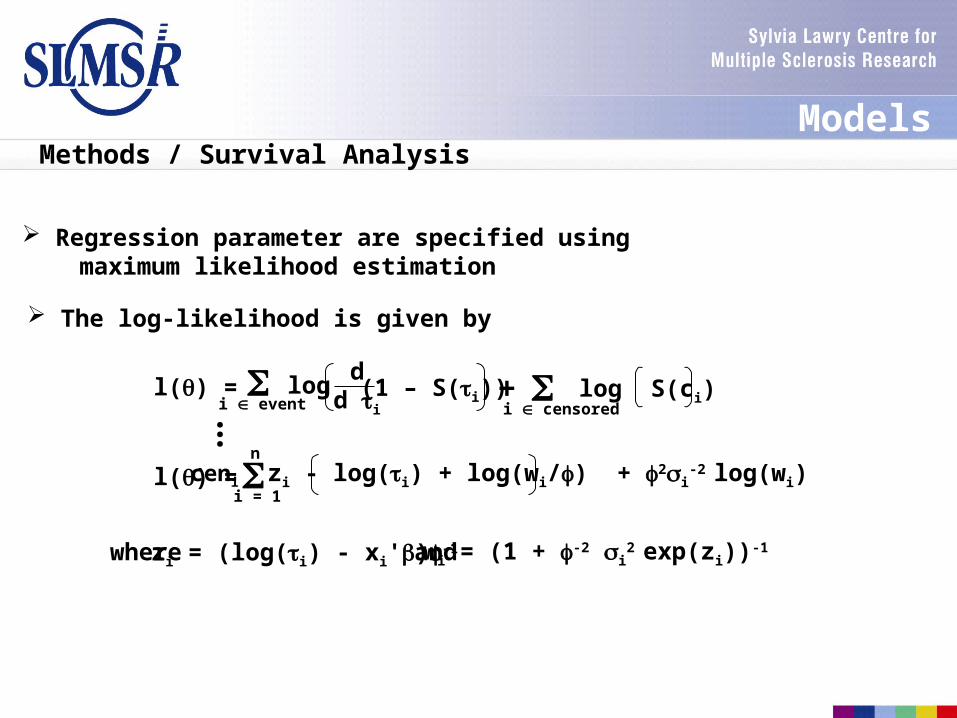
Regression parameter are specified using maximum likelihood estimation
The log-likelihood is given by
l() = (1 – S(i))d
d i
logi event
i censored
log S(ci)+...
l() = i = 1
nceni zi - log(i) + log(wi/) + 2i
-2 log(wi)
zi = (log(i) - xi')-1 wi = (1 + -2 i2 exp(zi))-1 where and
Models
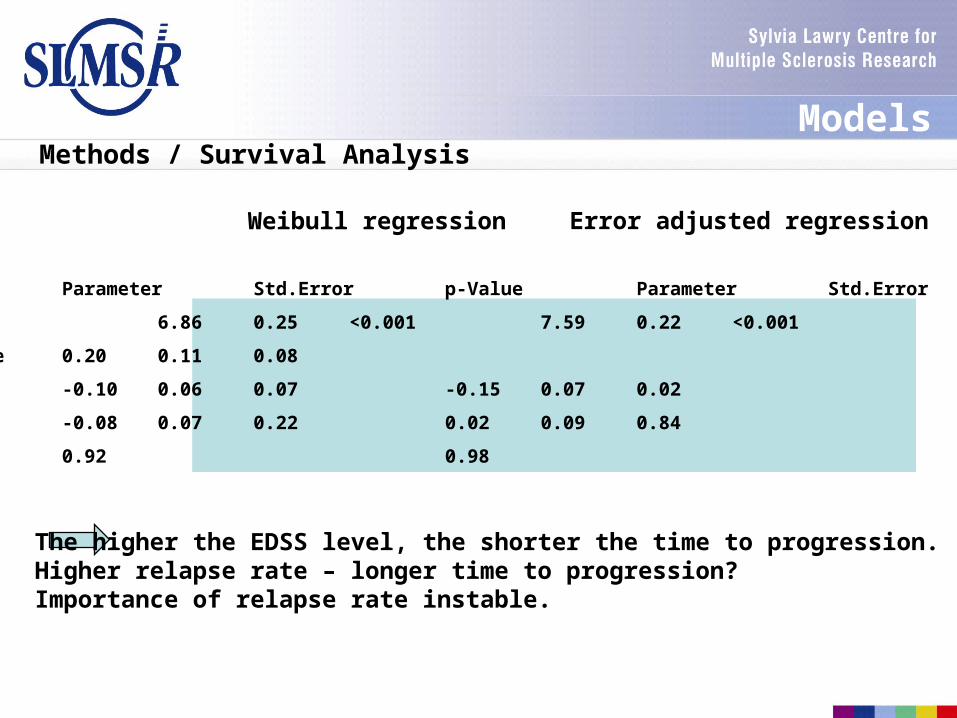
Methods / Survival Analysis
Weibull regression Error adjusted regression
Parameter Std.Error p-Value Parameter Std.Error p-Value
Intercept 6.86 0.25 <0.001 7.59 0.22 <0.001
Relapse rate 0.20 0.11 0.08
EDSS -0.10 0.06 0.07 -0.15 0.07 0.02
Log (scale) -0.08 0.07 0.22 0.02 0.09 0.84
Scale 0.92 0.98
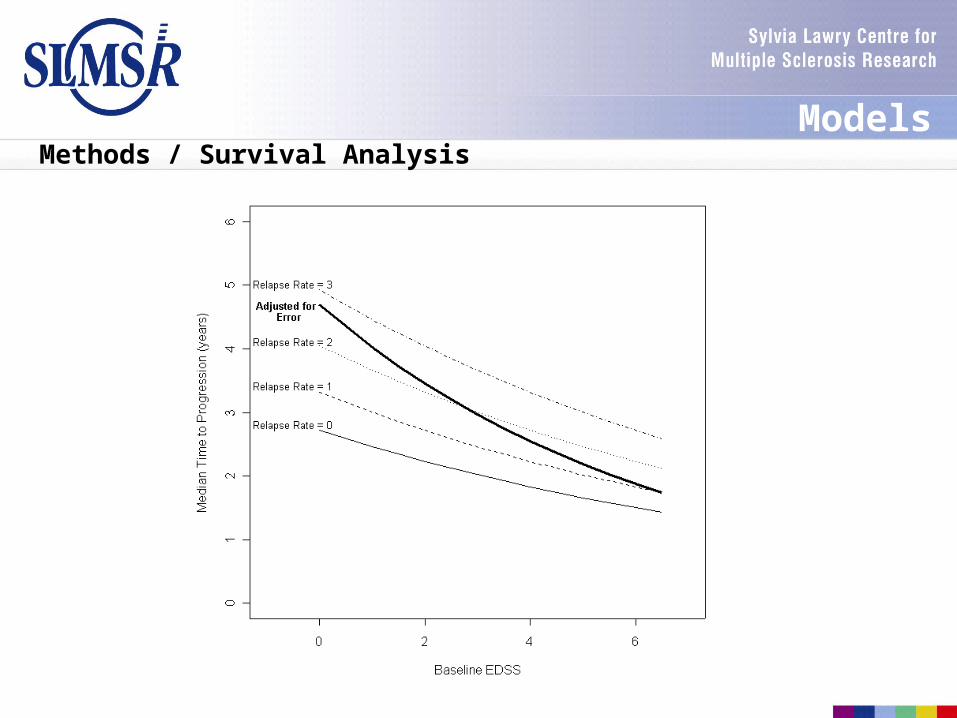
The higher the EDSS level, the shorter the time to progression. Higher relapse rate – longer time to progression?Importance of relapse rate instable.
Models
Methods / Survival AnalysisModels
Outline
Background
OnLine Analytical Processing Tool Segmented Regression and Correction for Error
Improvement of Outcome Measures
Validation Strategies
Need for validation – Model selection
Over-fitting of data
Scenario
Many models checked for describing data set
Model with best fit is used for further analyses
Model fit is tested using standard statistical methodology
Result
Danger of over-fitting since model selection
and model validation is based on same dataset
Danger enhanced if method applied to small subgroups
Validation
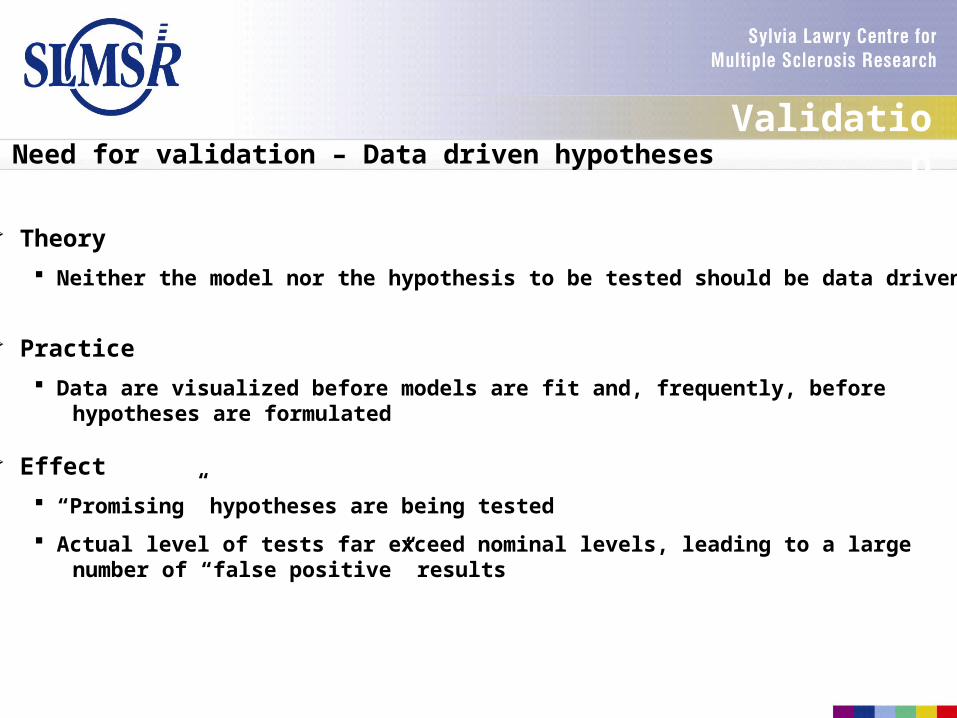
Need for validation – Data driven hypothesesValidation
Theory
Neither the model nor the hypothesis to be tested should be data driven
Practice
Data are visualized before models are fit and, frequently, before hypotheses are formulated
Effect
“Promising” hypotheses are being tested
Actual level of tests far exceed nominal levels, leading to a large number of “false positive” results
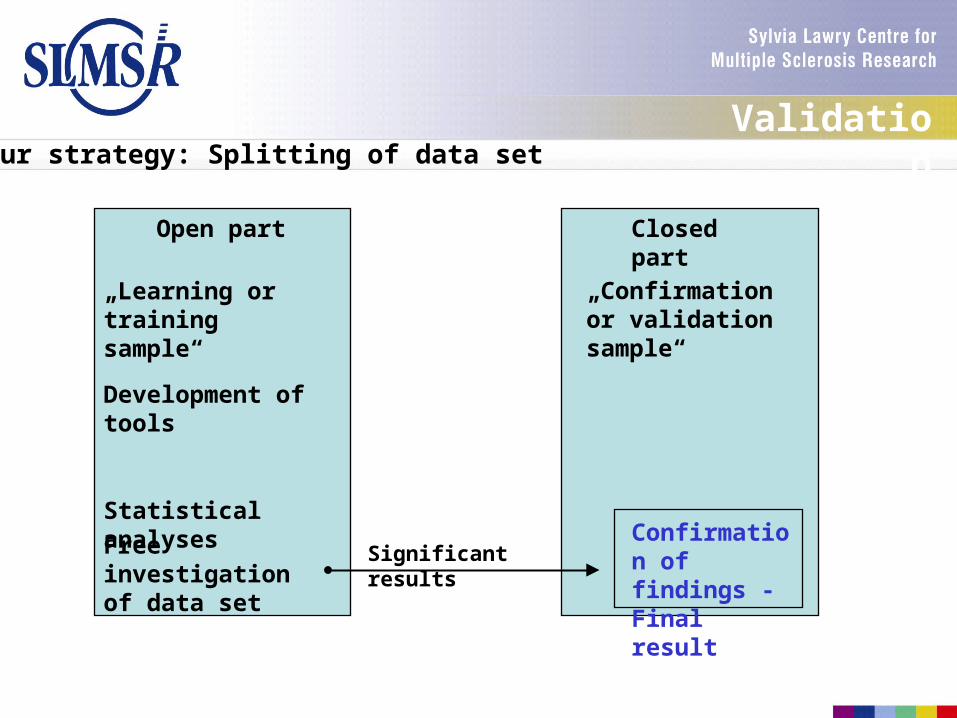
Our strategy: Splitting of data set
Open part Closed part
„Learning or training sample“
„Confirmation or validation sample“
Confirmation of findings - Final result
Development of tools
Statistical analyses
Significant results
Validation
Free investigation of data set
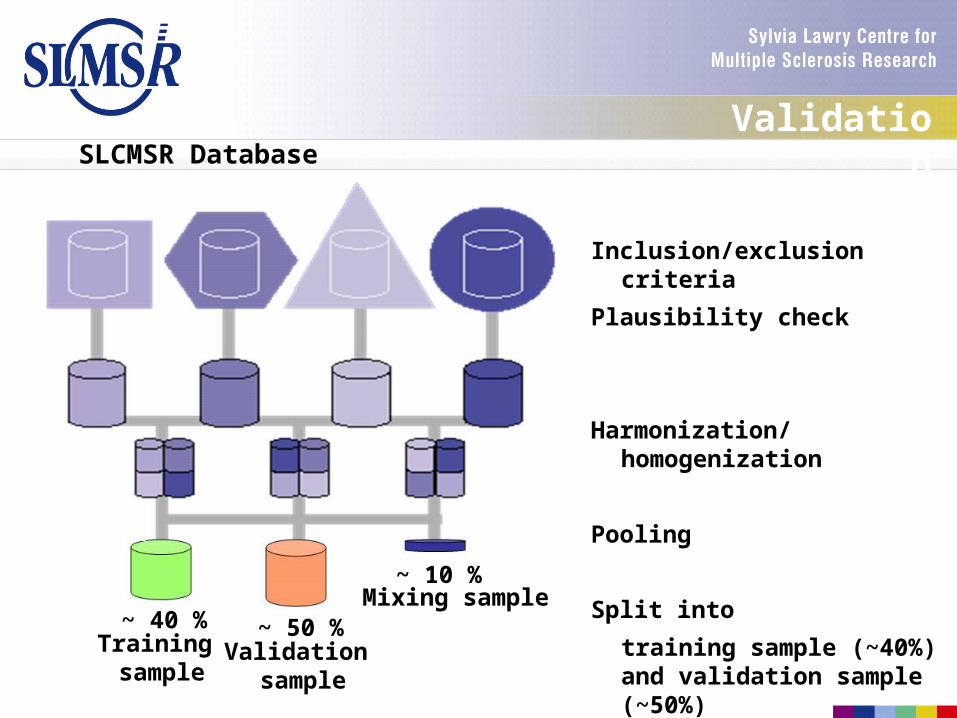
SLCMSR Database
~ 40 %
~ 10 %
~ 50 %Training sample
Mixing sample
Inclusion/exclusion criteria
Plausibility check
Harmonization/homogenization
Pooling
Split into
training sample (~40%) and validation sample (~50%)
Analysis / modeling
Validation
Validation sample
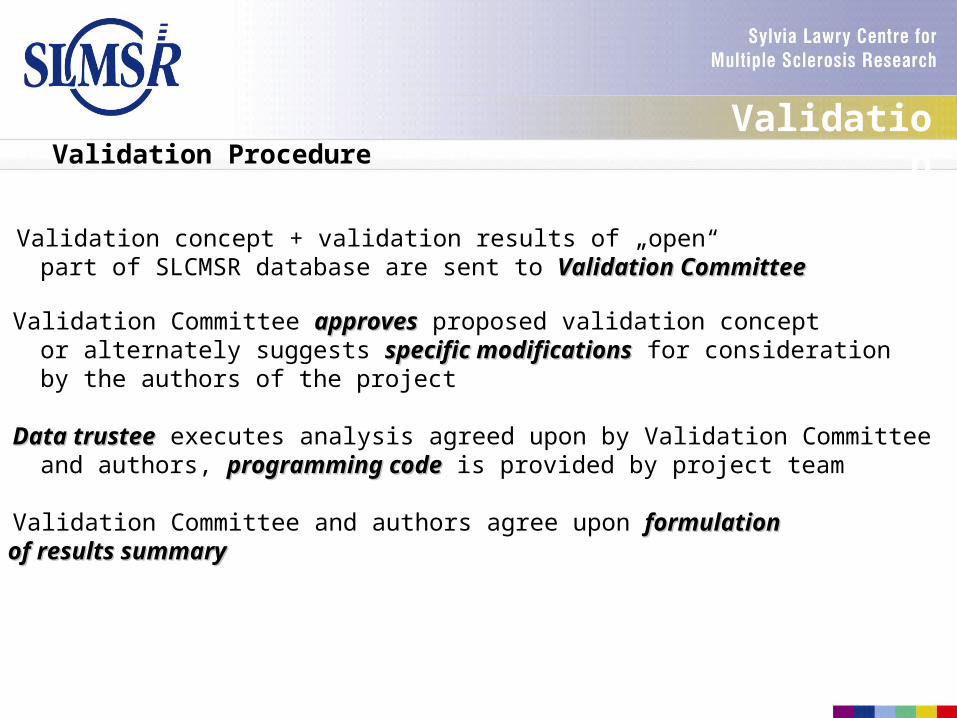
Validation ProcedureValidation
Validation concept + validation results of „open“ part of SLCMSR database are sent to Validation CommitteeValidation Committee
Validation Committee approvesapproves proposed validation concept or alternately suggests specific modificationsspecific modifications for consideration by the authors of the project
Data trusteeData trustee executes analysis agreed upon by Validation Committee and authors, programming codeprogramming code is provided by project team
Validation Committee and authors agree upon formulation formulation of results summaryof results summary
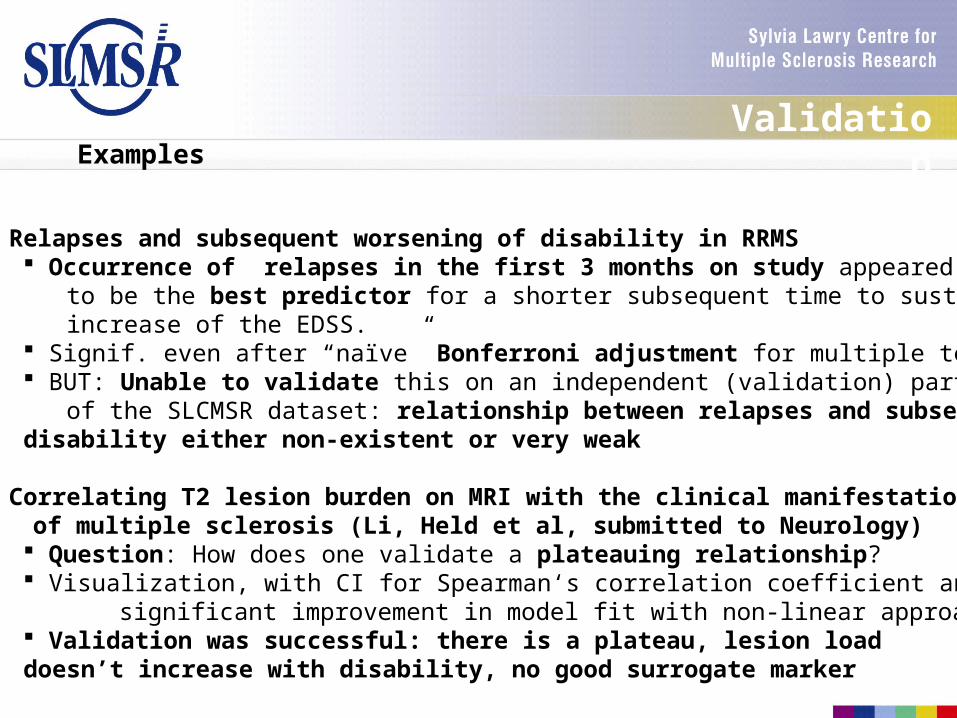
ExamplesValidation
Relapses and subsequent worsening of disability in RRMS Occurrence of relapses in the first 3 months on study appeared to be the best predictor for a shorter subsequent time to sustained increase of the EDSS. Signif. even after “naïve” Bonferroni adjustment for multiple testing. BUT: Unable to validate this on an independent (validation) part of the SLCMSR dataset: relationship between relapses and subsequent disability either non-existent or very weak
Correlating T2 lesion burden on MRI with the clinical manifestations of multiple sclerosis (Li, Held et al, submitted to Neurology)
Question: How does one validate a plateauing relationship? Visualization, with CI for Spearman‘s correlation coefficient and
significant improvement in model fit with non-linear approach Validation was successful: there is a plateau, lesion load doesn’t increase with disability, no good surrogate marker
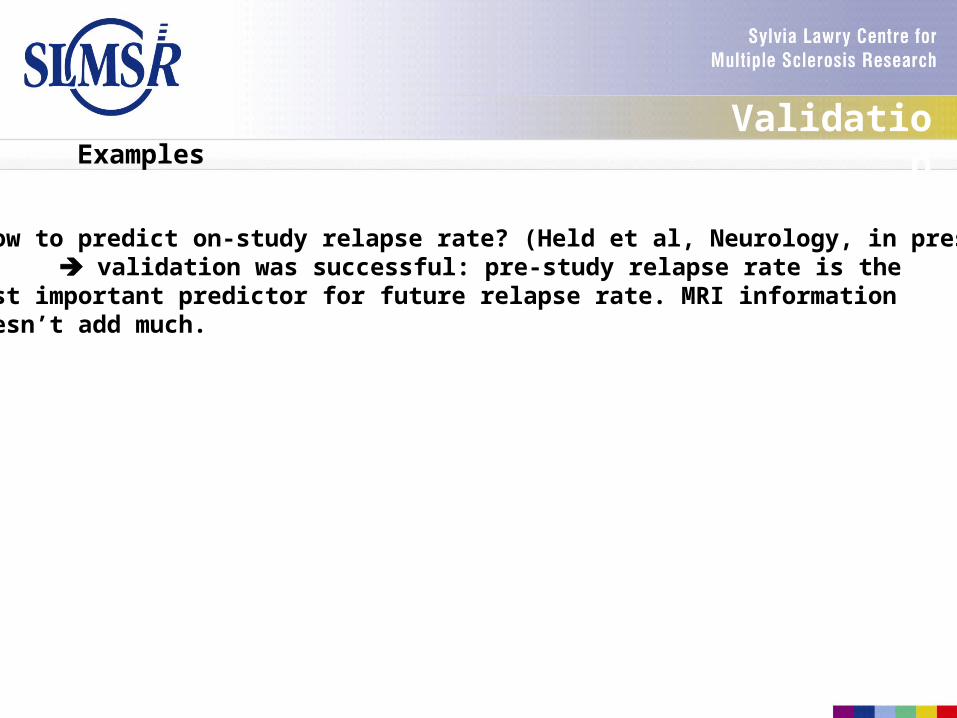
ValidationExamples
How to predict on-study relapse rate? (Held et al, Neurology, in press) validation was successful: pre-study relapse rate is the
most important predictor for future relapse rate. MRI information doesn’t add much.

Invited Session for IBC 2006, MontrealValidation
Session organizers: M. Daumer, U. Held (SLCMSR)
Discussant: John Petkau (Prof. of Statistics, UBC, Vancouver)
Speakers: Trevor Hastie (Prof. of Statistics, Stanford University)
„Validation in Genomics“
Ulrike Held (SLCMSR)
„Validation Procedure of the SLCMSR: Methodological and Practical Aspects“
Martin Schumacher (Prof. of Biometry, Freiburg University, GER)
„Assessment and Validation of Risk Prediction Models“
Validation
Barkhof F, Held U, Simon JH, Daumer M, Fazekas F, Filippi M, Frank JA, Kappos L, Li D, Menzler S, Miller DH, Petkau J, Wolinsky J. Predicting gadolinium-enhancement status in MS patients eligible for randomized clinical trials. Neurology in press
Compston A, Ebers G, Lassmann H, McDonald I, Matthews B, Wekerle H. Mc Alpines Multiple Sclerosis 3rd Edition, Churchill Livingstone, 1998.
Freedman MS, Patry DG, Grand'Maison F, Myles ML, Paty DW, Selchen DH. Treatment optimization in multiple sclerosis, Can J Neurol Sci 33 (2):157-68, 2004.
Held U, Heigenhauser L, Shang C, Kappos L, Polman C. Predictors of relapse rate in MS clinical trials. Neurology in press
Küchenhoff H. An exact algorithm for estimating breakpoints in segmented generalized linear models, Computational Statistics 12, 235 – 247, 1997.
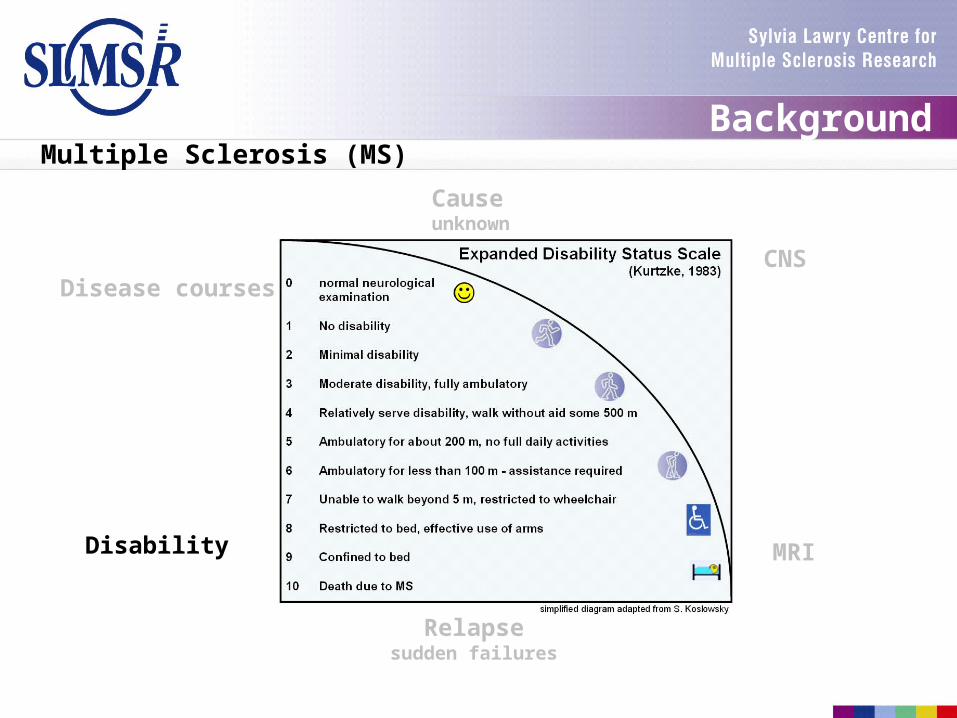
Kurtzke JF. Rating neurologic impairment in multiple sclerosis: An expanded disability status scale (EDSS), Neurology 33(11):1444-52, Nov. 1983.
Pittock SJ, Mayr WT, McClelland RL, Jorgensen NW, Weigand SD, Noseworthy JH, Weinshenker BG, and Rodriguez M. Change in MS-related disability in a population-based cohort: A 10-year follow-up study. Neurology 62: 51-59, 2004.
Hellriegel B, Daumer M, Neiß A. Analysing the course of multiple sclerosis with segmented regression models, Tech. rep., Ludwig-Maximilians-University Munich, SFB Discussion Paper, 2003.
Skinner CJ, Humphreys K. Weibull Regression for Lifetimes Measured with Error, Lifetime Data Analysis 5, 23-37, 1999.
Neuhaus A. Modelling Time to Progression in Multiple Sclerosis, Diploma Thesis, Ludwig-Maximilians-University Munich, http://www.slcmsr.org, 2004
Schach S, Daumer M, Neiß A. Maintaining high quality of statistical evaluations based on the SLCMSR data base - Validation Policy, http://www.slcmsr.org.
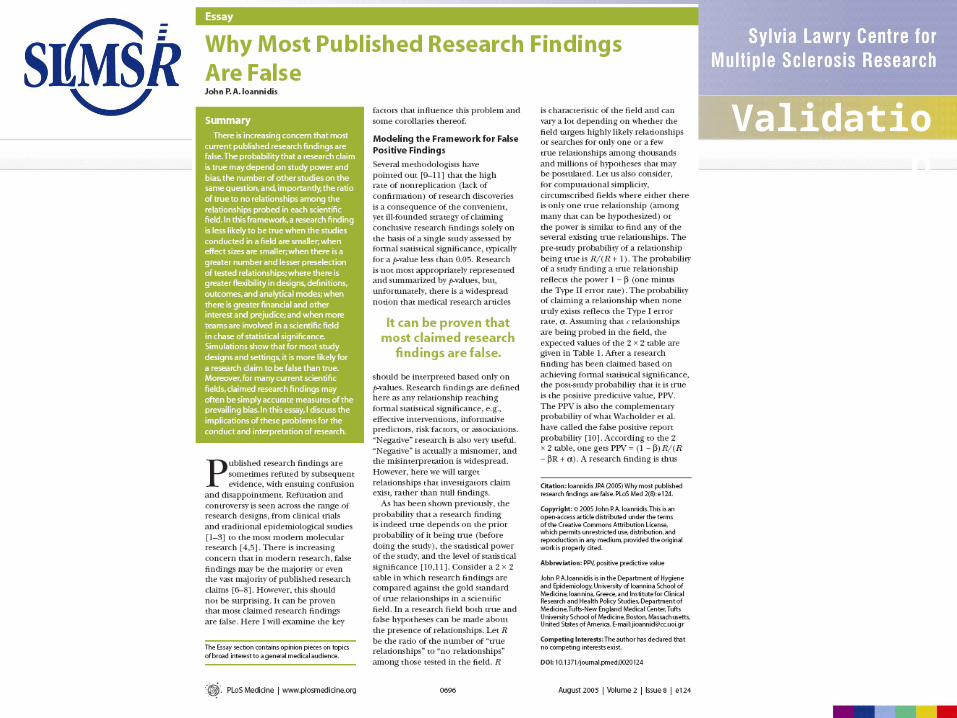
Ioannidis PDA. Why most publishes research findings are false, PLoS Med 2(8): e124, 2005.
Ioannidis PDA. Microarrays and molecular research: noise discovery?, Lancet 365: 454-55, 2005.
Literature
Outline
Background
OnLine Analytical Processing Tool Segmented Regression and Correction for Error
Improvement of Outcome Measures
Validation Strategies
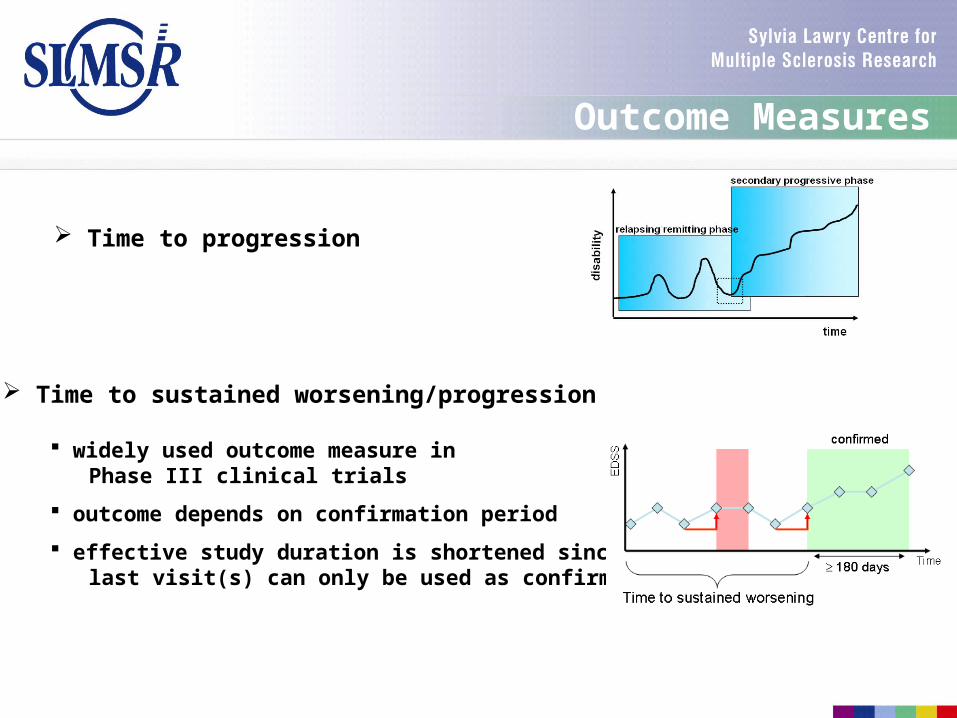
Time to progression
Time to sustained worsening/progression
widely used outcome measure in Phase III clinical trials
outcome depends on confirmation period
effective study duration is shortened since last visit(s) can only be used as confirmation
Outcome Measures
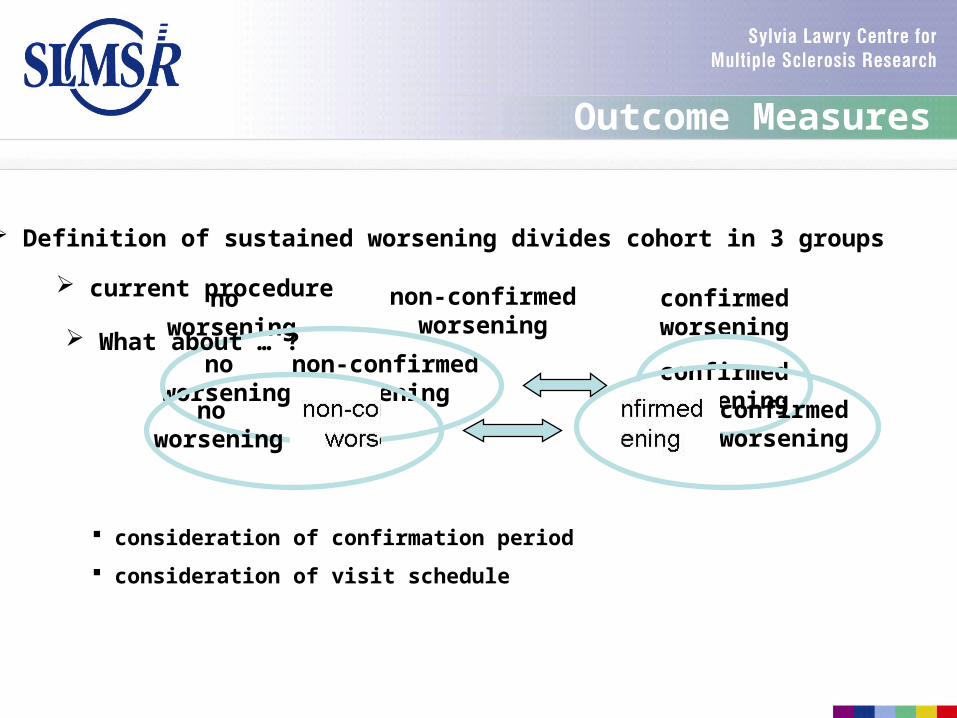
Definition of sustained worsening divides cohort in 3 groups
current procedureno worsening
confirmedworsening
non-confirmedworsening
non-confirmedworsening
no worsening
confirmedworsening
What about … ?
confirmedworsening
no worsening
consideration of confirmation period
consideration of visit schedule
Outcome Measures

random matching of ‘non-confirmed worsening’ to one of the other groups
Proportion matched toconfirmed worsening
Proportion matched toconfirmed worsening
Cox Model
Proportion matched toconfirmed worsening
Proportion matched toconfirmed worsening
Logit Model
room forimprovement
Estimation based on standard definition
Estimation without non-confirmed patients
Outcome Measures
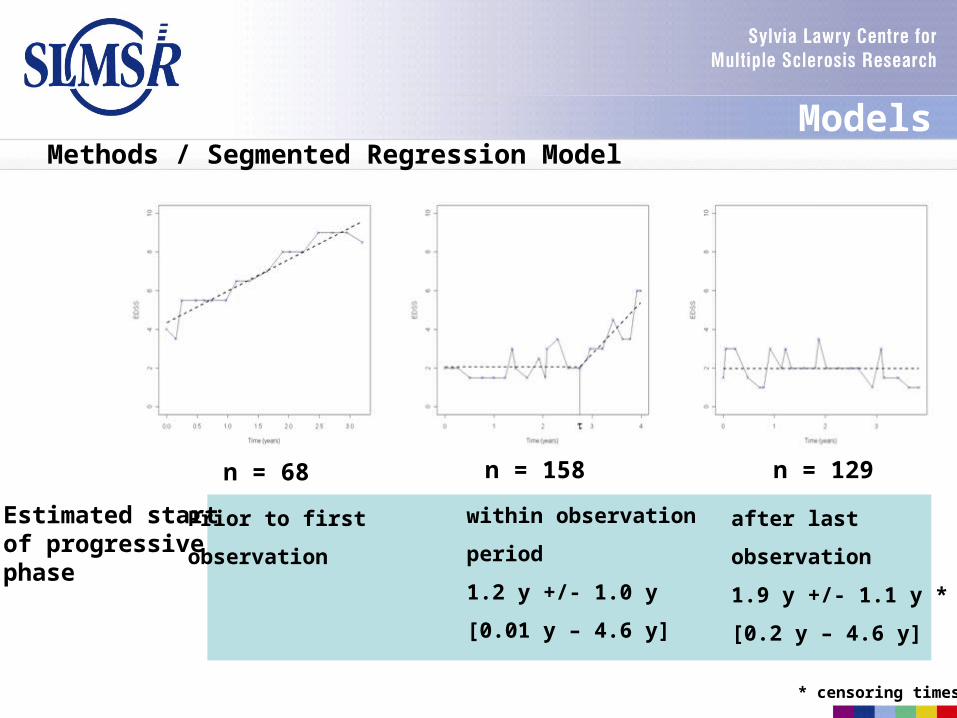
Methods / Segmented Regression Model
n = 68 n = 158 n = 129
Prior to first
observation
Estimated start of progressive phase
within observation
period
1.2 y +/- 1.0 y
[0.01 y – 4.6 y]
after last
observation
1.9 y +/- 1.1 y *
[0.2 y – 4.6 y]
* censoring times
Models