SENSITIVITY OF TREATING PLANT PERFORMANCE TO TOWER … LRGCC... · 2016-06-20 · SENSITIVITY OF...
13
SENSITIVITY OF TREATING PLANT PERFORMANCE TO TOWER INTERNALS Laurance Reid Gas Conditioning Conference February 21-24, 2016 – Norman, Oklahoma USA Ralph H. Weiland, Optimized Gas Treating Inc. 12237 Jones Rd., Suite 432 Houston, TX 77070 +1 281 970 2700 [email protected] Michael Schultes Raschig GmbH. Mundenheimer Str. 100 D-67061 Ludwigshafen Germany +49 621 56 18 648 [email protected] Mark Pilling Sulzer Chemtech USA, Inc. 1 Sulzer Way Tulsa, OK 74131 +1 918 760 2202 [email protected] Juan Portillo Sulzer Chemtech USA, Inc. 1 Sulzer Way Tulsa, OK 74131 +1 918 447-7640 [email protected] Dan Summers Sulzer Chemtech USA, Inc. 1 Sulzer Way Tulsa, OK 74131 [email protected] Glenn Shiveler, Sulzer Chemtech USA, Inc. 1 Sulzer Way Tulsa, OK 74131 +1 918 447 7623 [email protected] Markus Duss, Sulzer Chemtech Ltd. Sulzer-Allee 48 P.O. Box 65 CH-8404 Winterthur Switzerland +41 (0) 52 262 67 14 [email protected] Erik Stewart INEOS Oxide 2305 Brazosport Blvd B-1465 Building Amines Road Freeport, Texas 77541 +1 979 415 8505 [email protected] Attilio J. Praderio, ConocoPhillips LNG Process Group Houston, TX, +1 713 351 9904 Attilio.J.Praderio@ conocophillips.com ABSTRACT One of the most neglected areas in gas treating is the proper and methodical selection and comparison of tower internals. The performance of tower internals has been studied predominantly from the perspective of hydraulic capacity. Apart from efficiency measurements, notably by FRI and almost exclusively in the context of distillation, mass transfer performance has tended to receive relatively scant attention. In distillation, the dominant resistance to mass transfer is almost always in the gas or vapor phase. In gas absorption, on the other hand, the absorption rate of some components under many different conditions of operation lies in the liquid phase. Furthermore, in acid gas removal, chemical reactions play a decisive role in determining the separation. These factors alone set absorption apart from distillation. A further dissimilarity is the usually large density difference
Transcript of SENSITIVITY OF TREATING PLANT PERFORMANCE TO TOWER … LRGCC... · 2016-06-20 · SENSITIVITY OF...
SENSITIVITY OF TREATING PLANT PERFORMANCE
TO TOWER INTERNALS
Laurance Reid Gas Conditioning Conference
February 21-24, 2016 – Norman, Oklahoma USA
Ralph H. Weiland,
Optimized Gas Treating Inc.
12237 Jones Rd., Suite 432
Houston, TX 77070
+1 281 970 2700
Michael Schultes
Raschig GmbH.
Mundenheimer Str. 100
D-67061 Ludwigshafen
Germany
+49 621 56 18 648
Mark Pilling
Sulzer Chemtech USA, Inc.
1 Sulzer Way
Tulsa, OK 74131
+1 918 760 2202
Juan Portillo
Sulzer Chemtech USA, Inc.
1 Sulzer Way
Tulsa, OK 74131
+1 918 447-7640
Dan Summers
Sulzer Chemtech USA, Inc.
1 Sulzer Way
Tulsa, OK 74131
Glenn Shiveler,
Sulzer Chemtech USA, Inc.
1 Sulzer Way
Tulsa, OK 74131
+1 918 447 7623
Markus Duss,
Sulzer Chemtech Ltd.
Sulzer-Allee 48
P.O. Box 65
CH-8404 Winterthur
Switzerland
+41 (0) 52 262 67 14
Erik Stewart
INEOS Oxide
2305 Brazosport Blvd
B-1465 Building
Amines Road
Freeport, Texas 77541
+1 979 415 8505
Attilio J. Praderio,
ConocoPhillips
LNG Process Group
Houston, TX,
+1 713 351 9904
Attilio.J.Praderio@
conocophillips.com
ABSTRACT
One of the most neglected areas in gas treating is the proper and methodical selection and
comparison of tower internals. The performance of tower internals has been studied
predominantly from the perspective of hydraulic capacity. Apart from efficiency measurements,
notably by FRI and almost exclusively in the context of distillation, mass transfer performance
has tended to receive relatively scant attention.
In distillation, the dominant resistance to mass transfer is almost always in the gas or vapor
phase. In gas absorption, on the other hand, the absorption rate of some components under many
different conditions of operation lies in the liquid phase. Furthermore, in acid gas removal,
chemical reactions play a decisive role in determining the separation. These factors alone set
absorption apart from distillation. A further dissimilarity is the usually large density difference

between phases in gas absorption; in high pressure distillation the vapor phase density can be a
large fraction of the liquid density but in acid gas removal they are widely separated.
Hydrocarbons also have different wetting characteristics on metal packing surfaces than aqueous
systems. All too often, distillation data do not apply well to absorption.
When parts-per-million specifications on product gases must be met, selecting the wrong
packing size or bed depth can result in a failed design. For many years, packing has had a bad
reputation in absorption and distillation at high pressure. A large part of the reason was
inattention to proper distributor design. Another was the persistent and still unresolved difficulty
in translating ideal stages into actual packed bed depths and the selection of a particular
commercial packing, especially in amine treating. One of the benefits of true mass transfer rate-
based simulation (using ProTreat
for example) is that the concepts of ideal stages and HETPs
are completely avoided, so translation from ideality to reality is a non-issue—no translation is
needed. The separation is simulated directly and a large area of uncertainty is removed.
In this contribution, a case study is used to reveal the important tower-internals parameters that
determine an absorber’s mass transfer performance. This is done in the context of an LNG
project, and it compares a structured packing with three random packings of different size and
type, and with two types of commercially proven valve trays.
SENSITIVITY OF TREATING PLANT PERFORMANCE
TO TOWER INTERNALS
Ralph Weiland, Optimized Gas Treating Inc., Houston, Texas
Michael Schultes, Raschig GmbH, Ludwigshafen, Germany
Mark Pilling, Sulzer Chemtech USA, Inc., Tulsa, Oklahoma
Juan Portillo, Sulzer Chemtech USA, Inc., Tulsa, Oklahoma
Dan Summers, Sulzer Chemtech USA, Inc., Tulsa, Oklahoma
Glenn Shiveler, Sulzer Chemtech USA, Inc., Tulsa, Oklahoma
Markus Duss , Sulzer Chemtech, Winterthur, Switzerland
Erik Stewart, INEOS Americas LLC, Houston, Texas
Attilio Praderio, ConocoPhillips, LNG Process Group, Houston, Texas
Back to Basics: Understanding the Difference
Tower internals have natural hydraulic capacity limits imposed by such parameters as jet
flooding, downcomer backup, downcomer choke flood, packed column flooding, etc. These
parameters can generally be assessed through software freely available from each internals
provider or through the Design and Rating Program available from Fractionation Research Inc.
(FRI). All the various tools use different input and output data panels, reflecting the various
differences that pertain to the different types of internals that can be selected for a particular
service.
All tower internals have geometries that manipulate the hydraulics to promote contact across the
interface between counter-currently flowing vapor and liquid phases. However, from the point
of view of mass transfer, the rates of transfer of components between phases depend on the
interfacial area available, the turbulence level created in each phase, the physical and transport
properties of the phases, their flow rates, and concentration differences between phases and
across phase boundaries. Of great underlying importance is the fact that mechanically different
internals create different levels of turbulence for every type and size of internal even at the same
flow rates using the same fluids. Turbulence levels determine phase mass transfer coefficients
just like turbulence levels on the shell and tube sides of heat exchangers determine heat transfer
coefficients. Equally important is the interfacial area between the gas and liquid through which
the transferring species must be transported to effect a separation. An example is the behavior of
packing.
As the solvent flow rate to a packed bed is increased, the wetted interfacial area rises as well, and
the mass transfer rate therefore increases with solvent flow. This is shown by the right side of
Figure 1 where increasing liquid rates cover more and more of the packing surface with a film of
liquid. Treating improves until the tower operation runs up against another limitation, in this
case a lean end pinch in which the treated gas reaches an equilibrium state with the lean solvent.
Beyond that point, more solvent does not result in any change in absorber mass transfer
performance. On the left side of this plot, yet another limitation is encountered, namely a solvent
capacity limit where insufficient solvent is being provided to remove enough CO2, and
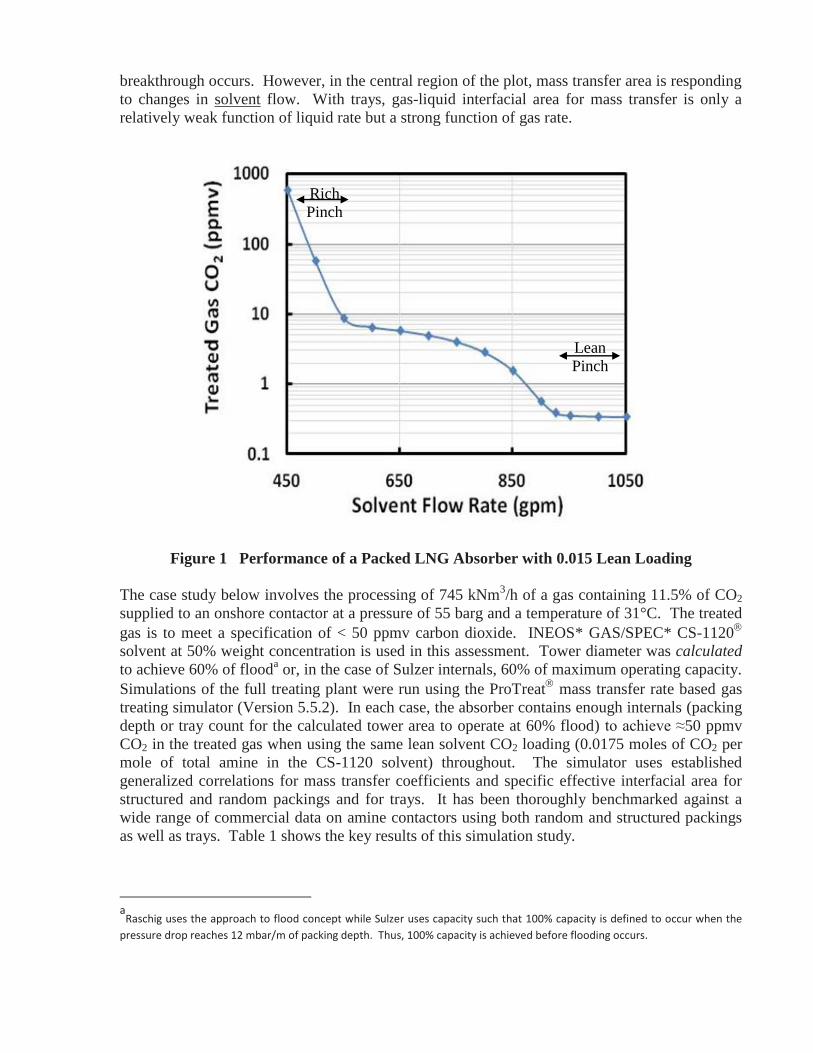
breakthrough occurs. However, in the central region of the plot, mass transfer area is responding
to changes in solvent flow. With trays, gas-liquid interfacial area for mass transfer is only a
relatively weak function of liquid rate but a strong function of gas rate.
Figure 1 Performance of a Packed LNG Absorber with 0.015 Lean Loading
The case study below involves the processing of 745 kNm3/h of a gas containing 11.5% of CO2
supplied to an onshore contactor at a pressure of 55 barg and a temperature of 31°C. The treated
gas is to meet a specification of < 50 ppmv carbon dioxide. INEOS* GAS/SPEC* CS-1120
solvent at 50% weight concentration is used in this assessment. Tower diameter was calculated
to achieve 60% of flooda or, in the case of Sulzer internals, 60% of maximum operating capacity.
Simulations of the full treating plant were run using the ProTreat
mass transfer rate based gas
treating simulator (Version 5.5.2). In each case, the absorber contains enough internals (packing
depth or tray count for the calculated tower area to operate at 60% flood) to achieve ≈50 ppmv
CO2 in the treated gas when using the same lean solvent CO2 loading (0.0175 moles of CO2 per
mole of total amine in the CS-1120 solvent) throughout. The simulator uses established
generalized correlations for mass transfer coefficients and specific effective interfacial area for
structured and random packings and for trays. It has been thoroughly benchmarked against a
wide range of commercial data on amine contactors using both random and structured packings
as well as trays. Table 1 shows the key results of this simulation study.
a
Raschig uses the approach to flood concept while Sulzer uses capacity such that 100% capacity is defined to occur when the
pressure drop reaches 12 mbar/m of packing depth. Thus, 100% capacity is achieved before flooding occurs.
Rich
Pinch
Lean
Pinch
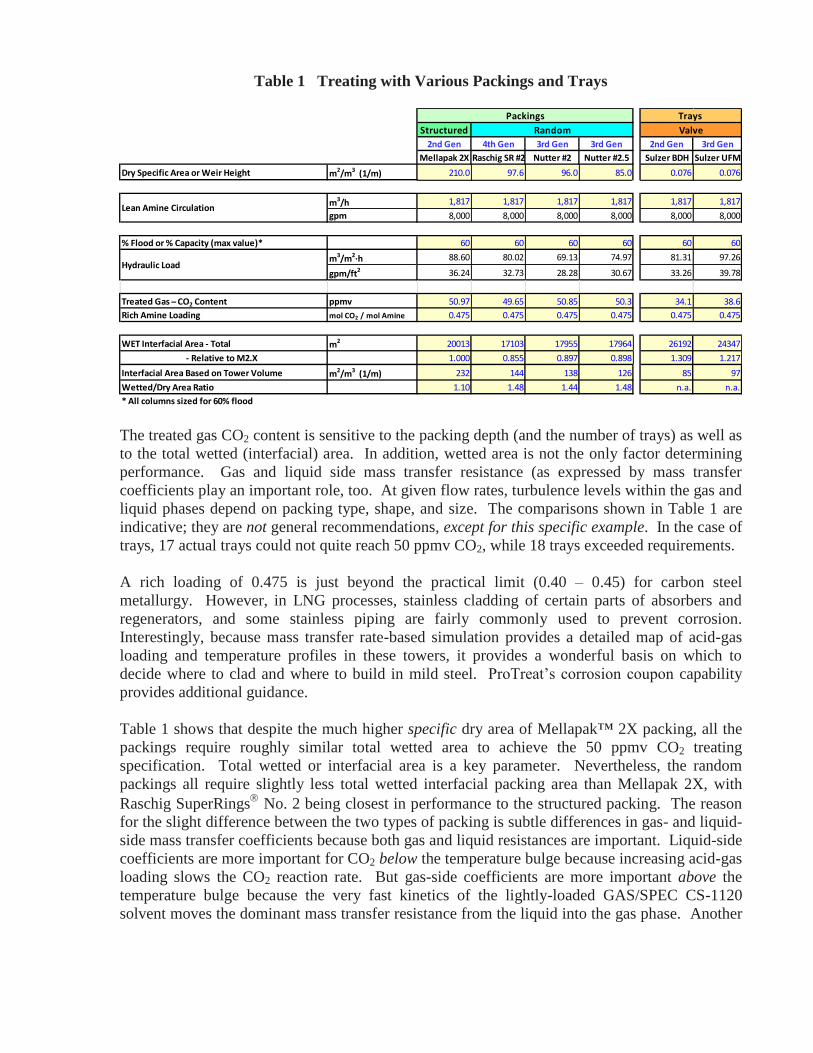
Table 1 Treating with Various Packings and Trays
The treated gas CO2 content is sensitive to the packing depth (and the number of trays) as well as
to the total wetted (interfacial) area. In addition, wetted area is not the only factor determining
performance. Gas and liquid side mass transfer resistance (as expressed by mass transfer
coefficients play an important role, too. At given flow rates, turbulence levels within the gas and
liquid phases depend on packing type, shape, and size. The comparisons shown in Table 1 are
indicative; they are not general recommendations, except for this specific example. In the case of
trays, 17 actual trays could not quite reach 50 ppmv CO2, while 18 trays exceeded requirements.
A rich loading of 0.475 is just beyond the practical limit (0.40 – 0.45) for carbon steel
metallurgy. However, in LNG processes, stainless cladding of certain parts of absorbers and
regenerators, and some stainless piping are fairly commonly used to prevent corrosion.
Interestingly, because mass transfer rate-based simulation provides a detailed map of acid-gas
loading and temperature profiles in these towers, it provides a wonderful basis on which to
decide where to clad and where to build in mild steel. ProTreat’s corrosion coupon capability
provides additional guidance.
Table 1 shows that despite the much higher specific dry area of Mellapak™ 2X packing, all the
packings require roughly similar total wetted area to achieve the 50 ppmv CO2 treating
specification. Total wetted or interfacial area is a key parameter. Nevertheless, the random
packings all require slightly less total wetted interfacial packing area than Mellapak 2X, with
Raschig SuperRings
No. 2 being closest in performance to the structured packing. The reason
for the slight difference between the two types of packing is subtle differences in gas- and liquid-
side mass transfer coefficients because both gas and liquid resistances are important. Liquid-side
coefficients are more important for CO2 below the temperature bulge because increasing acid-gas
loading slows the CO2 reaction rate. But gas-side coefficients are more important above the
temperature bulge because the very fast kinetics of the lightly-loaded GAS/SPEC CS-1120
solvent moves the dominant mass transfer resistance from the liquid into the gas phase. Another
Structured
2nd Gen 4th Gen 3rd Gen 3rd Gen 2nd Gen 3rd Gen
Mellapak 2X Raschig SR #2 Nutter #2 Nutter #2.5 Sulzer BDH Sulzer UFM
Dry Specific Area or Weir Height m2/m3 (1/m) 210.0 97.6 96.0 85.0 0.076 0.076
m3/h 1,817 1,817 1,817 1,817 1,817 1,817
gpm 8,000 8,000 8,000 8,000 8,000 8,000
% Flood or % Capacity (max value)* 60 60 60 60 60 60
m3/m2∙h 88.60 80.02 69.13 74.97 81.31 97.26
gpm/ft2 36.24 32.73 28.28 30.67 33.26 39.78
Treated Gas ̶ CO2 Content ppmv 50.97 49.65 50.85 50.3 34.1 38.6
Rich Amine Loading mol CO2 / mol Amine 0.475 0.475 0.475 0.475 0.475 0.475
WET Interfacial Area - Total m2 20013 17103 17955 17964 26192 24347
- Relative to M2.X 1.000 0.855 0.897 0.898 1.309 1.217
Interfacial Area Based on Tower Volume m2/m3 (1/m) 232 144 138 126 85 97
Wetted/Dry Area Ratio 1.10 1.48 1.44 1.48 n.a. n.a.
* All columns sized for 60% flood
Hydraulic Load
Trays
Random Valve
Lean Amine Circulation
Packings
cause of differences is temperature dependent transport properties that change in response to
differing temperature profiles. There are many influences.
As shown in Table 1, Mellapak 2X structured packing has more than twice the dry specific area
of any of the random packings, and 60 – 80 % the tower volume specific interfacial area.
Therefore, given that all the internals need roughly equal effective interfacial area, one might
expect that, in this case, a comparatively smaller total packing volume is needed for Mellapak
2X than for random packings. But this is not the case because the gas and liquid side mass
transfer coefficients are different, as already described. In this case study it results in a relevant
smaller packing height for Mellapak 2X compared to random packings. One might well ask the
question then, if the physical volume of structured packing in an absorber can be made lower
than random packings, why isn’t structured packing used all the time? The answer doesn’t
necessarily lie in mass transfer performance, but rather in the hydraulics. Amine treating can be
a fairly dirty service (especially in refineries) so structured packing, particularly small crimp
packing, should be used only if the operator is prepared to give undivided attention to ensuring
excellent amine hygiene. One might recommend, for example, full-flow particulates filtration
accompanied by charcoal filtration to remove surface active agents. The deposition of solids and
gelatinous substances means early death to structured packing, and the smaller the crimp, the
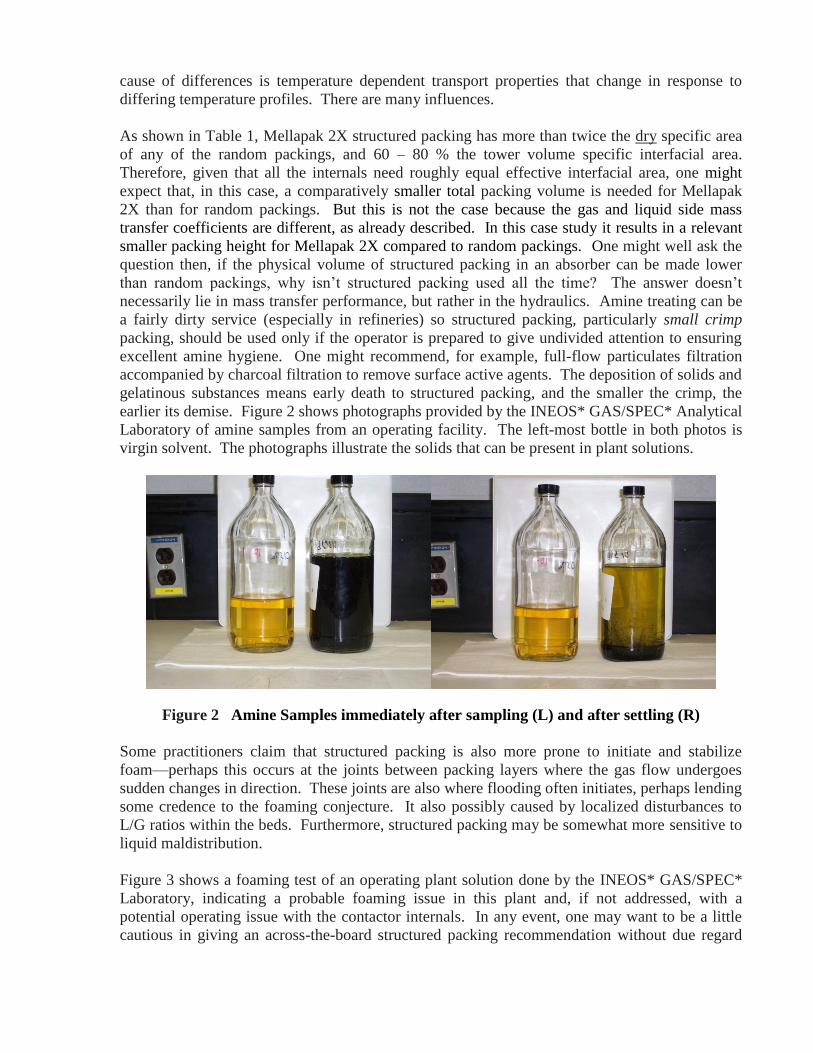
earlier its demise. Figure 2 shows photographs provided by the INEOS* GAS/SPEC* Analytical
Laboratory of amine samples from an operating facility. The left-most bottle in both photos is
virgin solvent. The photographs illustrate the solids that can be present in plant solutions.
Figure 2 Amine Samples immediately after sampling (L) and after settling (R)
Some practitioners claim that structured packing is also more prone to initiate and stabilize
foam—perhaps this occurs at the joints between packing layers where the gas flow undergoes
sudden changes in direction. These joints are also where flooding often initiates, perhaps lending
some credence to the foaming conjecture. It also possibly caused by localized disturbances to
L/G ratios within the beds. Furthermore, structured packing may be somewhat more sensitive to
liquid maldistribution.
Figure 3 shows a foaming test of an operating plant solution done by the INEOS* GAS/SPEC*
Laboratory, indicating a probable foaming issue in this plant and, if not addressed, with a
potential operating issue with the contactor internals. In any event, one may want to be a little
cautious in giving an across-the-board structured packing recommendation without due regard

for the particulars of the application. Close attention must be paid to installation of distributors,
redistributors, wall wipers and other design/installation issues recommended by structured
packing suppliers. All in all, it is necessary to have excellent design and installation of liquid
and vapor distributors to get the best performance from structured and random packings alike.
Figure 3 Foam Test of an Amine Sample following Settling
The type of analysis described here can be carried out for any type and brand of packing
contained within the ProTreat database and, of course, findings will differ from packing to
packing. It should be noted that the analysis for a contactor located offshore or on a floating
facility will include additional considerations and, therefore, any conclusion from this work
cannot directly be extrapolated to those situations. For example, on FPSOs rocking motion is a
serious consideration—even here there are applications where structured packings are preferred
but there are also applications where random packings are favored. Flow maldistribution must
be considered in all such applications. However, even greater attention to distributor design is
mandatory. ProTreat can be used to assist in troubleshooting performance issues in contactors.
INEOS uses an Infrared Camera to check for distributor and maldistribution issues in a packed
column after plant simulation indicates poorer than expected treating performance. Figure 4
shows a thermal image (cf. Shiveler et al.1 and Teletzke and Bickham
2) of the liquid flow and
reaction (indicated by the red region) occurring down the wall of the contactor but with very
little reaction in the packed bed. This may indicate poor distribution of amine solution or, in a
large diameter column, poor gas distribution.
Figure 4 Infrared Camera Photo of Distribution Issue in Packed Tower

One purpose of this paper is to point out the controlling, underlying physical and chemical
factors to which one should pay attention in selecting packed tower internals from a mass
transfer performance standpoint. In that spirit, no endorsement of one packing over another is
being made. There are always multiple choices, and indeed, multiple good choices. The best
choice will depend on many factors, and in some cases mass transfer performance may not even
be decisive. In any event, there is no one better qualified to help in making the best packing
decisions than a reputable internals supplier.
Turning now to trays, Table 1 also shows a comparison with Sulzer BDH and Sulzer UFM
(Umbrella Floating Mini-Valve) trays where it is immediately apparent that the total interfacial
areas needed to achieve a specified separation using trays are similar to, albeit somewhat higher
than, those needed for packings. Note also that the interfacial area in the table is based on the
total tower volume occupied by the internals, not the volume over the active deck or tray
bubbling area (i.e., exclusive of downcomers). In the case of the UFM tray deck, the total
interfacial area is closest to structured packing and is sufficient to treat satisfactorily under these
conditions because the gas-side mass transfer coefficient in the froth over the trays is a little
higher than for random packing. If 17 trays had produced 50 ppmv CO2 rather than 56 ppmv
actually predicted, the area would be even closer
Considering that the cost of a high-pressure vessel has more to do with its diameter than its
length, it is worth noting that these trayed towers have diameters that are about 4% larger than
the structured packing option for the classical BDH rectangular floating valve and about 5%
smaller than the structured packing option for the newest UFM valve. This is not a large
difference. For this specific application, the use of a four-pass layout is demanded by the high
liquid weir loads (heavily loaded downcomers); however, this could limit turndown when
compared with the packing options because multi-pass trays tend to have more limited turndown
capabilities. The turndown limitation on packed beds, on the other hand, generally depends
more on the distributors than on the packings themselves.
The Need and Importance of Performing a Sensitivity Analysis
A normal expectation in the course of operating an amine plant is that small changes in operating
conditions should result in correspondingly small changes in plant performance. However this
expectation is not always well founded3. Therefore, an analysis of performance sensitivity to all
significant operating parameters should always be performed. This is especially recommended
for amine systems operating near what is known as temperature pinch conditions where there can
be stable operating regions demarcated by steep boundaries outside of which performance
degrades precipitously. In other words, operationally mass transfer instabilities manifest as a
sudden loss in treating, but there may be little or no accompanying effect on hydraulic
performance per se. This can make treating failures hard to diagnose without a true mass
transfer rate based simulation tool.
The main cause of sudden loss in treating is attempting to operate with the bare minimum of
solvent absorptive capacity, whether from too low a solvent flow rate, too high a gas flow rate,
too high temperature, or too high a CO2 (or H2S) concentration in the raw gas. With fast
reactions, the reaction zone in the absorber extends only over a narrow band around the
maximum temperature found in the absorber (bulge) — temperature is a strong indicator of the
rate of reaction. Under the specified operation condition, this reaction zone with its telltale bulge

lies close to the bottom of the absorber. These profiles are illustrated in Figure 5. But, unlike
slowly reacting solvents like DEA where the reaction zone is broader and more gradually
emerges from the top of the tower (with decreasing solvent flow rate for example), a narrow
reaction zone gives no warning of its impending emergence until it suddenly pops out the top of
the column, and treating goes wildly off specification. Temperature bulges are also where
towers find themselves hydraulically limited.
Figure 5 Bulge Pinched and Lean-end Pinched Temperature Profiles
For example, a treated gas exhibiting a carbon dioxide concentration of 10 ppmv can suddenly
go to thousands of ppmv with less than a 0.1% drop in solvent flow rate4. Figure 6 shows an
example of such a stability boundary. The design point in this particular plant is 115°F but a
temperature excursion of 10°F will throw treating into a tailspin. Note too, that although 50
ppmv CO2 may be the targeted treating level, stable operation at that value is impossible, at least
by manipulating lean amine temperature. In fact, in this case treating degenerates very rapidly
from 10’s of ppmv CO2 to several 1000’s of ppmv with a temperature increase less of than 1°F.
The detailed reasons for the shape of the curve in Figure 6 (and Figure 1) are complex and are
discussed in full detail by Hatcher et al.5 However, the primary cause for the sudden loss in
treating performance is CO2 breakthrough when the lean amine temperature no longer permits all
the CO2 to be absorbed because of higher carbon dioxide backpressures over the solvent.
A profile of carbon dioxide concentration in the gas versus distance down the bed would show
that under normal operating conditions (120°F, for example) the part of the absorber just above
the bulge and very close to the bottom is where most of the absorption takes place. The upper
part of the bed (more than half) merely polishes the gas. As the lean solvent is made hotter, the
temperature bulge creeps up the column, the polishing section gets shorter, and eventually, with
a seemingly very small further increase in lean temperature, the polishing section disappears
entirely, and a high CO2 concentration pops out the top of the bed. This event tends to occur
rather unannounced because polishing deals with only a few parts per million so the treated gas
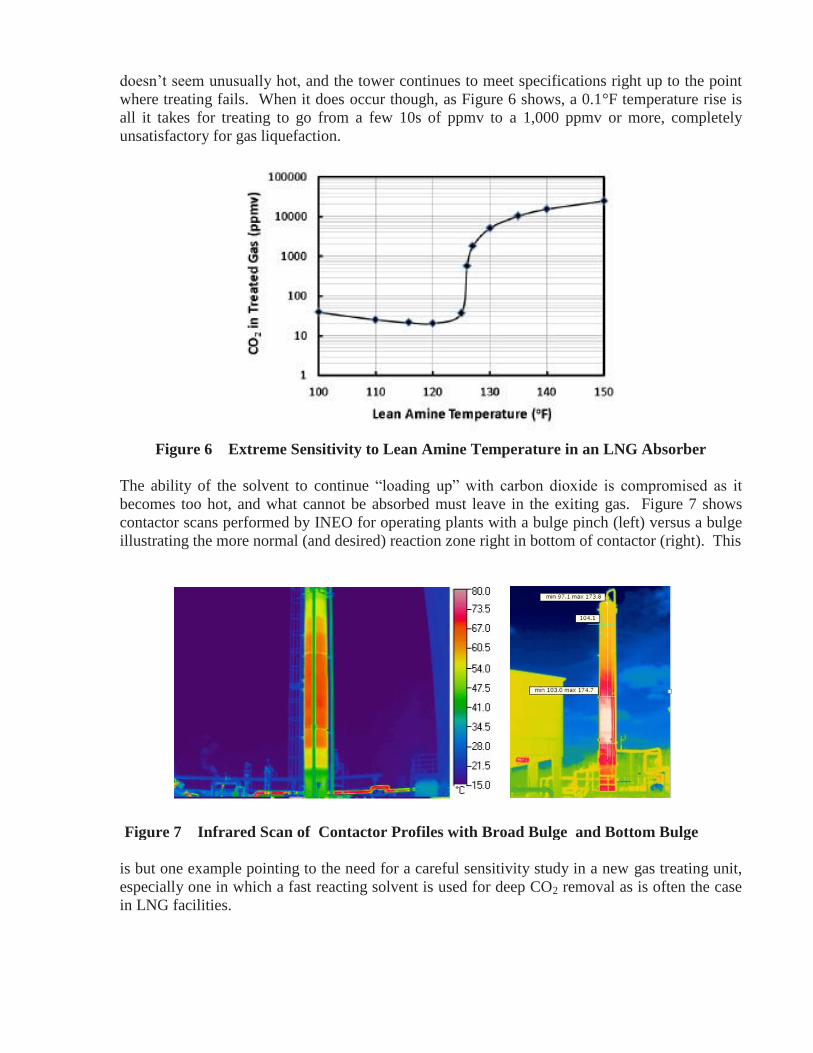
doesn’t seem unusually hot, and the tower continues to meet specifications right up to the point
where treating fails. When it does occur though, as Figure 6 shows, a 0.1°F temperature rise is
all it takes for treating to go from a few 10s of ppmv to a 1,000 ppmv or more, completely
unsatisfactory for gas liquefaction.
Figure 6 Extreme Sensitivity to Lean Amine Temperature in an LNG Absorber
The ability of the solvent to continue “loading up” with carbon dioxide is compromised as it
becomes too hot, and what cannot be absorbed must leave in the exiting gas. Figure 7 shows
contactor scans performed by INEO for operating plants with a bulge pinch (left) versus a bulge
illustrating the more normal (and desired) reaction zone right in bottom of contactor (right). This
Figure 7 Infrared Scan of Contactor Profiles with Broad Bulge and Bottom Bulge
is but one example pointing to the need for a careful sensitivity study in a new gas treating unit,
especially one in which a fast reacting solvent is used for deep CO2 removal as is often the case
in LNG facilities.
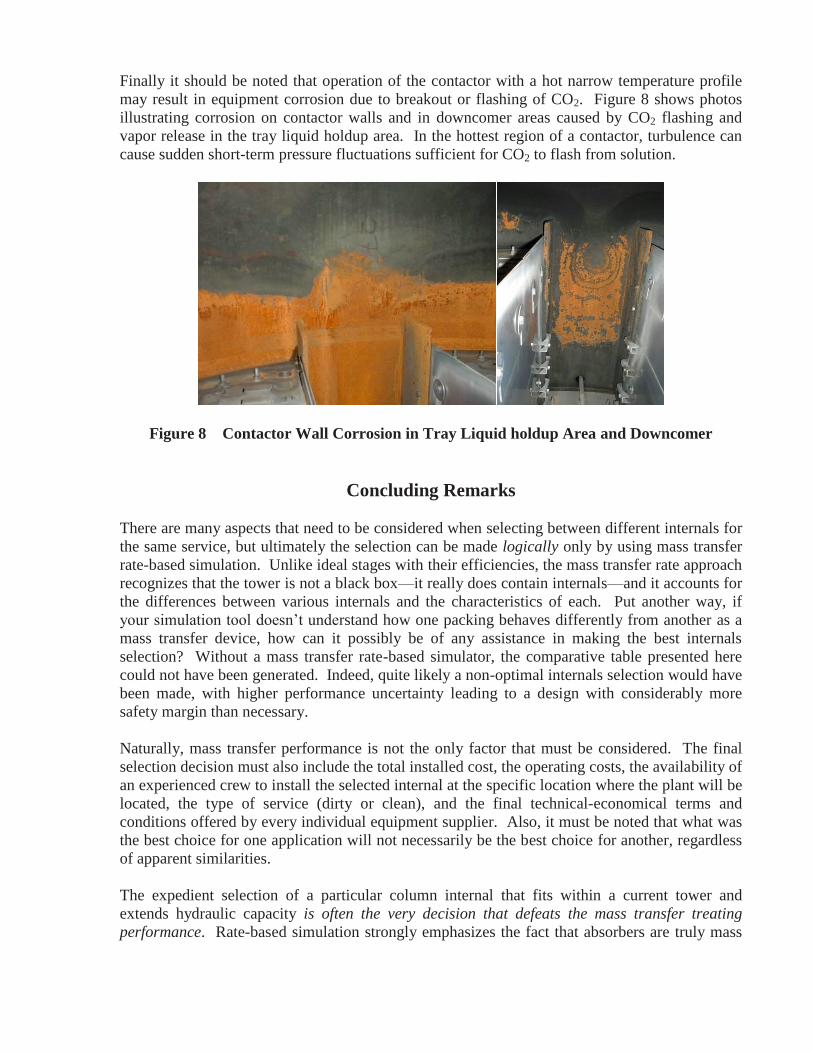
Finally it should be noted that operation of the contactor with a hot narrow temperature profile
may result in equipment corrosion due to breakout or flashing of CO2. Figure 8 shows photos
illustrating corrosion on contactor walls and in downcomer areas caused by CO2 flashing and
vapor release in the tray liquid holdup area. In the hottest region of a contactor, turbulence can
cause sudden short-term pressure fluctuations sufficient for CO2 to flash from solution.
Figure 8 Contactor Wall Corrosion in Tray Liquid holdup Area and Downcomer
Concluding Remarks
There are many aspects that need to be considered when selecting between different internals for
the same service, but ultimately the selection can be made logically only by using mass transfer
rate-based simulation. Unlike ideal stages with their efficiencies, the mass transfer rate approach
recognizes that the tower is not a black box—it really does contain internals—and it accounts for
the differences between various internals and the characteristics of each. Put another way, if
your simulation tool doesn’t understand how one packing behaves differently from another as a
mass transfer device, how can it possibly be of any assistance in making the best internals
selection? Without a mass transfer rate-based simulator, the comparative table presented here
could not have been generated. Indeed, quite likely a non-optimal internals selection would have
been made, with higher performance uncertainty leading to a design with considerably more
safety margin than necessary.
Naturally, mass transfer performance is not the only factor that must be considered. The final
selection decision must also include the total installed cost, the operating costs, the availability of
an experienced crew to install the selected internal at the specific location where the plant will be
located, the type of service (dirty or clean), and the final technical-economical terms and
conditions offered by every individual equipment supplier. Also, it must be noted that what was
the best choice for one application will not necessarily be the best choice for another, regardless
of apparent similarities.
The expedient selection of a particular column internal that fits within a current tower and
extends hydraulic capacity is often the very decision that defeats the mass transfer treating
performance. Rate-based simulation strongly emphasizes the fact that absorbers are truly mass

transfer equipment—not ideal stages of hydraulic contact—and simulating this way provides
important support for engineers working on industrial tower designs and retrofits where mistakes
may be very costly and career limiting..
This paper has focused on the sensitivity analysis that should be performed for the design of a
new amine absorber, in this case in an LNG plant. However, a sensitivity analysis should also be
included in retrofitting projects: no amine treating plant should ever consider a revamp from
trays to packing before fully understanding the limitations already existing in the plant, including
current design, and operating problems. For example, being unaware of the effect of heat stable
salts (HSSs) on performance can lead to a failed revamp because the HSSs may be the real cause
of poor performance, not the tower internals. In another example, when moving from trays to
packing to relieve a limitation caused by vapor hydraulics, care must be taken to selecting the
correct packing type to compensate for the tower volume now occupied by support and liquid
distributor internals, without serious loss of mass transfer performance. This can be a terrible
oversight when moving from trays to packing. Making the wrong choice of packing type,
packing size, packing support, and liquid and vapor distribution for the conversion can result in
unacceptable loss of mass transfer performance. Thus, the retrofit of any absorber or other mass
transfer equipment must also focus on the mass transfer aspect, too, even though originally the
exercise may have been driven to relieve hydraulic capacity limitations or to increase throughput.
Finally, by working in a collaborative environment, sharing common proven simulation tools,
and the non-substitutable value of the experience of “lessons learned” by equipment and solvent
providers, internals suppliers, process engineers, process designers, troubleshooters and plant
operators, an initial design can be made much more solid with correspondingly less uncertainty,
less design margin, better plant operability, and lower risk of unpleasant surprises.
There are many different opinions for designing tower internals for use in amine services, and
because absorption and distillation are partly art and partly science, differing opinions can be
shown to be equally serviceable in the field. Trays and packings can both be utilized for amine
services. The key to a successful design or retrofit is the proper selection and application of the
tower internals to the specific project conditions been assessed. The selection must be done
from both a hydraulic and a mass transfer viewpoint. This paper is offered as an illustration of
key facts that need to be considered in order to develop practical, serviceable column designs for
amine treating systems, where operating experience must be included as one of the key factors.
Consequently, this paper is a compilation of the views of authors from a variety of backgrounds,
and it does not necessarily represent completely the views of the five corporations which the
authors represent professionally.
References
1. Shiveler, G., Solis, G. S., Gonzales, G. H. P., Bueno, M. L., Retrofit of a H2S Selective Amine
Absorber Using MellapakPlus™ Structured Packing, paper presented at Spring AIChE
Meeting, Atlanta, Georgia, USA, April 10–13, 2005.
2. Teletzke, E., Bickham, C., Troubleshoot Acid Gas Removal Systems, Chemical Engineering
Progress, pp. 47–52, July, 2014.
3. Hatcher, N. A., Alvis, R. S., Weiland, R. H., Simulate Gas Treating Holistically: Part One,
Hydrocarbon Engineering, December, 2012. [Available from
http://www.protreat.com/files/publications/Treating_Holistically_3_part_Series_HE.pdf]

4. Weiland, R. H., and Hatcher, N. A., Foundations of Failure, Hydrocarbon Engineering,
December, 2011. [Available from http://www.protreat.com/files/publications/Reprint.pdf].
5. Hatcher, N. A., Alvis, R. S., Weiland, R. H., Simulate Gas Treating Holistically: Part Three,
Hydrocarbon Engineering, May, 2013. [Available from
http://www.protreat.com/files/publications/Treating_Holistically_3_part_Series_HE.pdf]