Selected Results on Health from CHARLS · Xiaoyan Le i CCER, National School of Developmen Peking...
35
Xiaoyan Lei CCER, National School of Development Peking University Prepared for the Workshop on China NCD burden, Stanford Center at Peking University, Beijing March 19 th , 2015 Selected Results on Health from CHARLS 1
Transcript of Selected Results on Health from CHARLS · Xiaoyan Le i CCER, National School of Developmen Peking...

Xiaoyan Lei CCER, National School of Development
Peking University
Prepared for the Workshop on China NCD burden, Stanford Center at Peking University, Beijing
March 19th, 2015
Selected Results on Health from CHARLS
1

China Health and Re-rement Longitudinal Study 中国健康与养老追踪调查
Biennial survey representa-ve of the residents of China aged 45 and older
2

• China is one of the most rapidly aging countries in the world
• With rapid economic growth and social changes, elderly in China face different challenges and opportuni-es than elderly in higher income countries
• China is revamping many policies affec-ng the elderly and evalua-ng their impacts is important
3
Significance
• Provide a high quality HRS-‐type data for behavioural and policy research – Mul--‐disciplinary – Survey methodology
• Harmonize survey instruments with HRS-‐type surveys (e.g. HRS, ELSA, SHARE, KLOSA, JSTAR) to enable cross-‐country compara-ve studies – combine extensive socioeconomic data with high quality data on physical and psychological health (and cogni-on)
– longitudinal studies including pre-‐re-rement cohorts that follow the same individuals over many years
– well-‐documented and publicly accessible 4
Aims
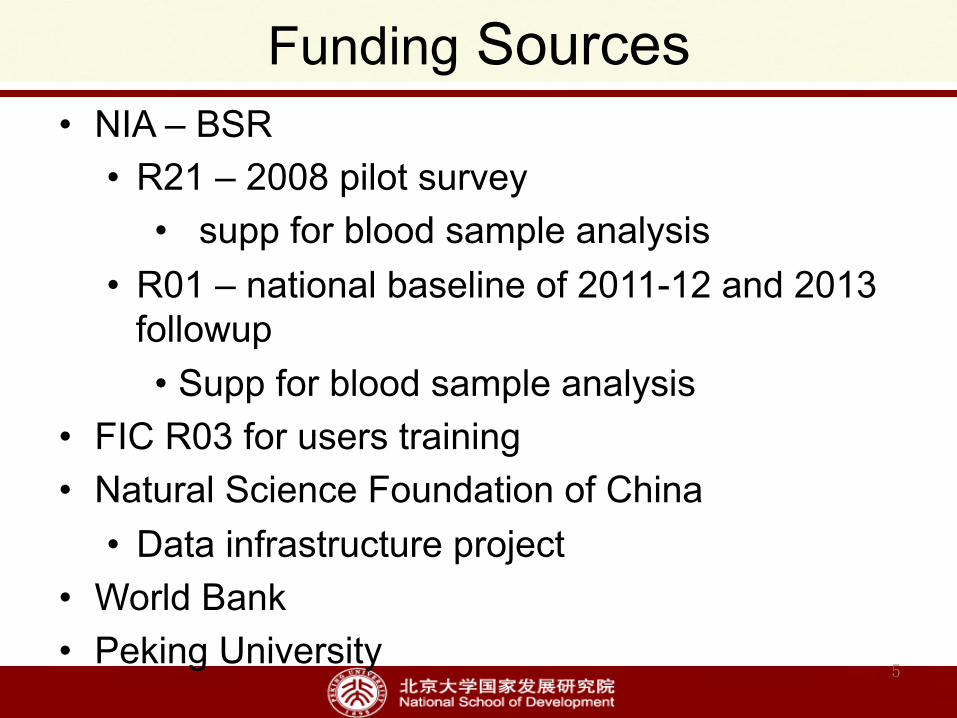
• NIA – BSR • R21 – 2008 pilot survey
• supp for blood sample analysis • R01 – national baseline of 2011-12 and 2013
followup • Supp for blood sample analysis
• FIC R03 for users training • Natural Science Foundation of China
• Data infrastructure project • World Bank • Peking University
5
Funding Sources

• Yaohui Zhao (PKU) • John Strauss (USC) • Gonghuan Yang (China CDC)
6
Co - PIs

7
International Advisors • James Smith, Director of the Center for Chinese Aging
Studies, RAND Corporation • David Wise, Harvard University and Director of Aging
Studies, NBER • Robert Wills, University of Michigan • David Weir, University of Michigan • Axel Borsch Supan, University of Mannheim • James Banks, University College London • Lisa Berkman, Harvard University • Arie Kapteyn, Director of Labor and Population Studies,
Rand Corporation • David Bloom, Harvard University
8
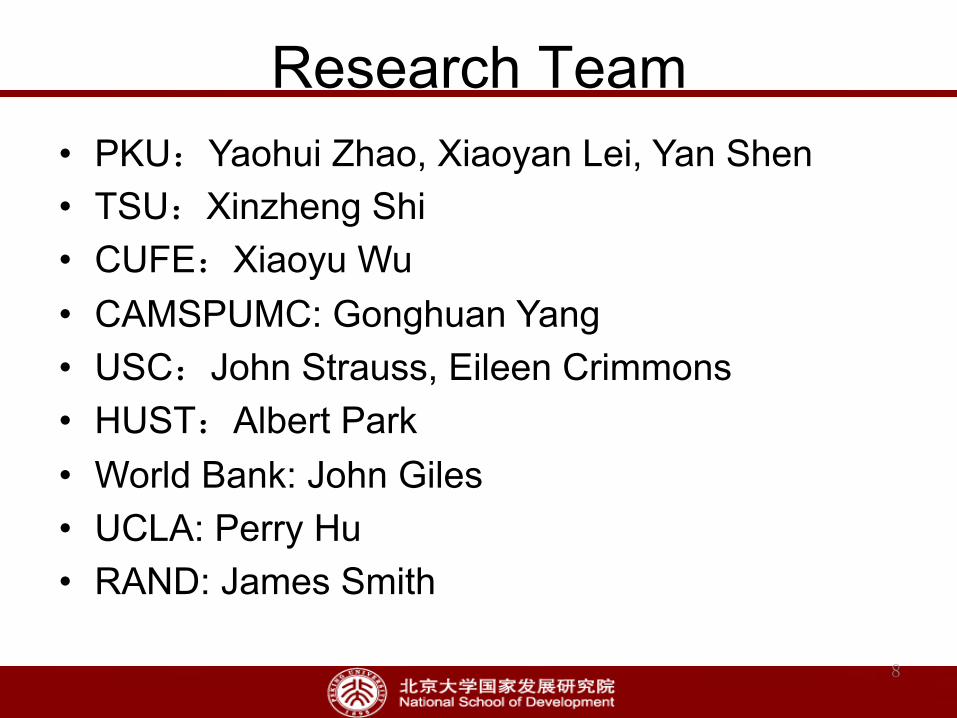
Research Team • PKU:Yaohui Zhao, Xiaoyan Lei, Yan Shen • TSU:Xinzheng Shi • CUFE:Xiaoyu Wu • CAMSPUMC: Gonghuan Yang • USC:John Strauss, Eileen Crimmons • HUST:Albert Park • World Bank: John Giles • UCLA: Perry Hu • RAND: James Smith

• Cover screen • Household roster • Demographics • Family structure/transfer • Health status and functioning and care giving • Biomarkers • Health care and insurance • Work, retirement and pension • Income and consumption • Assets • Housing conditions
• Community survey
• Policy survey 9
Questionnaire

• Anthropometric measurements: – height, weight, waist circumference, lower right leg length and upper arm length
• Lung capacity, grip strength, -med sit and stand, -med walk, balancing
• Hypertension • Blood sample as part of a sister survey of CHARLS-‐to be analyzed for: – Complete Blood Count (hemoglobin, etc.) – R01 supp: CRP, HbA1c, Lipids (total, LDL and HDL cholesterol, Triglycerides), Cysta-n C
10
Biomarkers

• Telephone Interview of Cogni-on Status (TICS): • day, day of week, season • sequen-al subtrac-on of 7s from 100 • copying a picture (of intersec-ng pentagons)
11
Cognition

Pilot
Na(onal Baseline
Pilot Resurvey
2008 : 2 provinces; 32 counties/districts 95 villages/communities 2,850 respondents
2011.05-2012.03: national random sampling 150 counties/districts across 28 provinces 17,708 respondents
2012.07-08: Follow-up survey of pilot sample
Na(onal baseline Resurvey
2013 .07- Follow-up survey of
national baseline sample
12
CHARLS Timeline
Life History survey 2014 Life history of national sample

• 2008 Pilot • Survey finished in 09/2008 • Released in 04/2009
• Na-onal baseline • Survey finished in 03/2012 • Released on 02/2013
• Pilot resurvey • Survey finished in 08/2012 • Released in 08/2013
• 2013 na-onal follow-‐up • Survey finished in 12/2013 • Released in 01/2015
13
Data Release
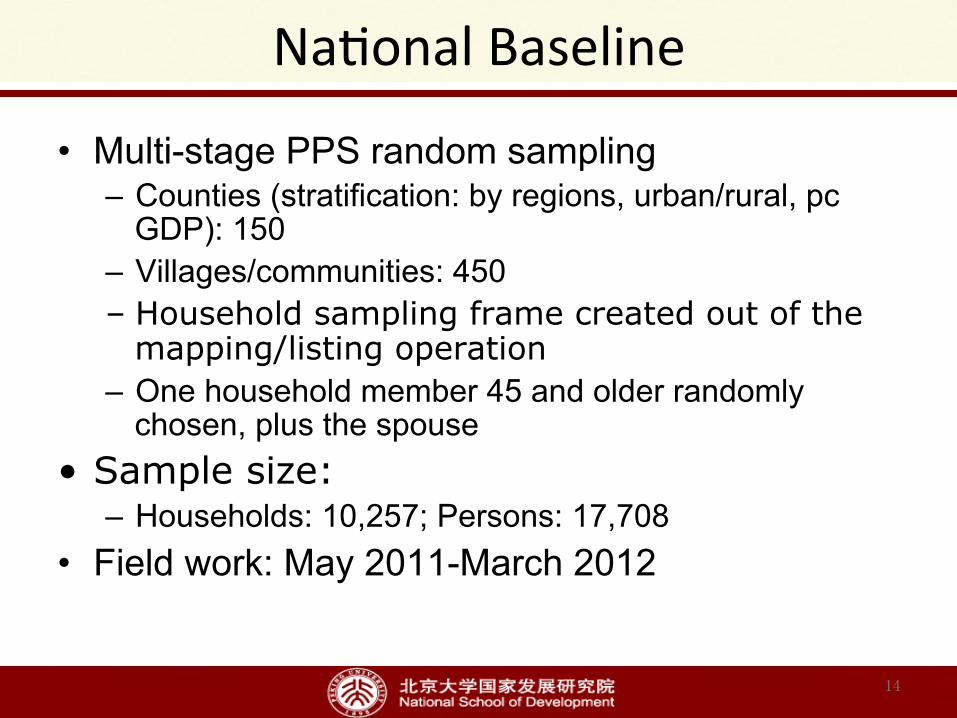
• Multi-stage PPS random sampling – Counties (stratification: by regions, urban/rural, pc
GDP): 150 – Villages/communities: 450 – Household sampling frame created out of the
mapping/listing operation – One household member 45 and older randomly
chosen, plus the spouse • Sample size:
– Households: 10,257; Persons: 17,708 • Field work: May 2011-March 2012
14
Na-onal Baseline

Selected results on health
15

BMI by Age and Sex
16
• Undernourishment is less of a problem than over-nutrition
BMI %BMI %BMI %BMI BMI %BMI %BMI %BMIMean <18.5 >=25.0 >=30.0 Mean <18.5 >=25.0 >=30.0
45-‐49 24.2 3.2 35.3 5.4 25.0 3.5 42.2 8.750-‐54 23.5 3.7 29.8 3.4 24.6 3.0 40.6 6.355-‐59 23.1 3.6 24.5 3.0 25.6 5.4 42.2 14.660-‐64 23.2 6.8 28.5 3.6 24.2 6.0 37.5 7.565-‐69 23.2 7.0 30.2 2.5 23.9 8.6 36.3 5.470-‐74 22.6 12.2 24.2 2.3 23.8 10.2 31.2 6.875+ 21.8 17.3 19.5 1.8 22.5 17.0 25.0 5.2Total 23.2 6.5 28.1 3.4 24.5 6.6 38.1 8.6Sample include respondents not younger than 45.
Men Women
Prevalence of Hypertension
17
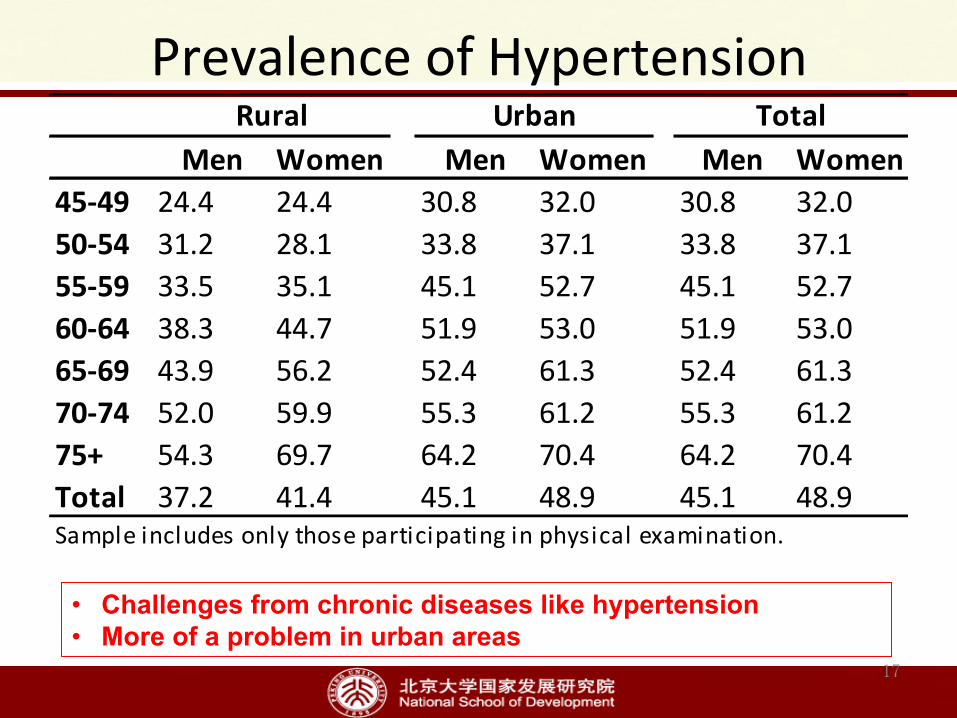
• Challenges from chronic diseases like hypertension • More of a problem in urban areas
Men Women Men Women Men Women45-‐49 24.4 24.4 30.8 32.0 30.8 32.050-‐54 31.2 28.1 33.8 37.1 33.8 37.155-‐59 33.5 35.1 45.1 52.7 45.1 52.760-‐64 38.3 44.7 51.9 53.0 51.9 53.065-‐69 43.9 56.2 52.4 61.3 52.4 61.370-‐74 52.0 59.9 55.3 61.2 55.3 61.275+ 54.3 69.7 64.2 70.4 64.2 70.4Total 37.2 41.4 45.1 48.9 45.1 48.9Sample includes only those participating in physical examination.
Rural Urban Total

Underdiagnosis of Hypertension
18
• Under-diagnosis is serious, more than 40% unaware of their condition
• Rural men are the least likely to be diagnosed
Men Women Men Women Men Women45-‐49 53.7 45.8 45.2 50.7 49.0 48.850-‐54 53.7 38.2 41.5 40.7 47.8 39.655-‐59 42.4 32.8 55.4 46.1 50.0 41.260-‐64 36.9 33.0 29.3 37.1 33.0 35.165-‐69 46.5 36.6 28.3 24.5 37.2 31.070-‐74 43.0 44.7 36.7 38.0 40.0 41.175+ 46.2 45.8 38.4 43.7 42.1 44.7Total 45.4 39.3 40.5 41.6 42.8 40.6Sample includes only those who are hypertensive.
Rural Urban Total

Hypertension Medica-on or Treatment
19
• Treatment is not high among those who are diagnosed • Rural people are less likely to take medication/treatment
Men Women Men Women Men Women45-‐49 57.9 72.2 62.0 88.2 60.3 81.650-‐54 74.7 75.9 74.5 80.9 74.6 78.755-‐59 70.3 76.3 87.7 87.9 79.3 83.060-‐64 77.4 81.7 80.2 78.0 78.9 79.965-‐69 78.4 79.9 89.8 82.5 85.0 81.370-‐74 70.2 79.2 85.9 89.3 78.2 84.975+ 83.5 80.6 90.0 89.8 87.1 85.3Total 73.8 78.4 82.1 85.4 78.4 82.2Sample includes only those who are diagnosed
Rural Urban Total

20
• Depression symptom increases with age and is more serious among women in all cohorts

Female Deficit in Cogni-ve Func-on, by Age
21
Mental Intactness Cohort Number Overall Female Male Difference
45-49 2,715 8.991 8.686 9.382 -0.697***
50-54 1,997 8.647 8.295 9.013 -0.718***
55-59 2,751 8.386 7.802 8.973 -1.171***
60-64 2,250 8.286 7.721 8.814 -1.092***
65-74 2,428 7.77 6.976 8.441 -1.466***
75 + 920 6.505 5.784 7.273 -1.489***
All 13,061 8.283 7.782 8.795 -1.013***
• Women have lower mental intactness , and the difference declines for the younger cohorts
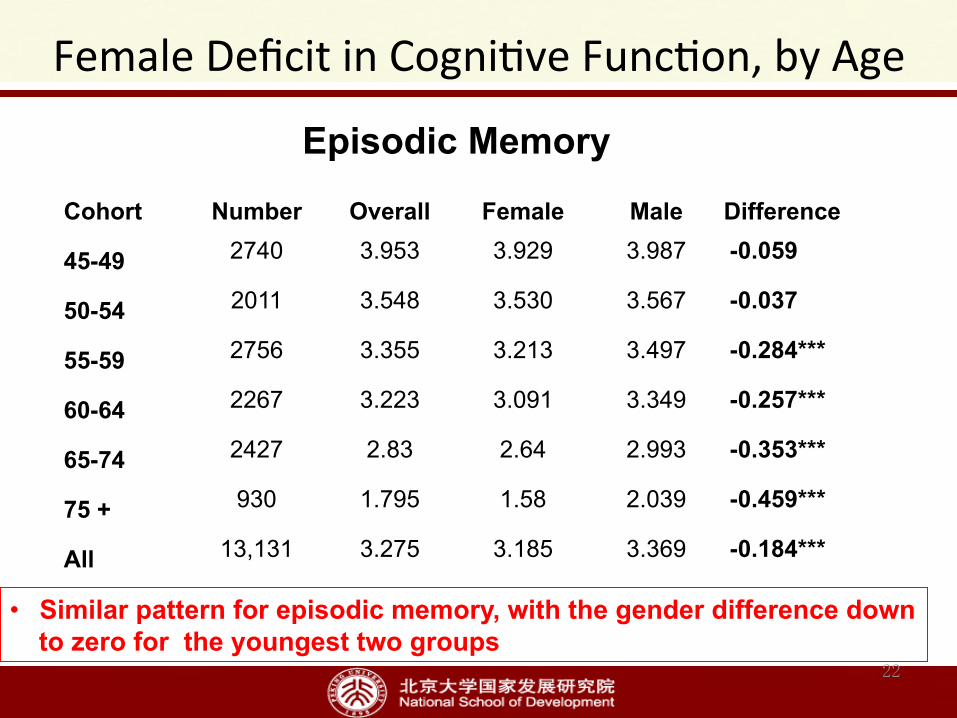
Female Deficit in Cogni-ve Func-on, by Age
22
• Similar pattern for episodic memory, with the gender difference down to zero for the youngest two groups
Episodic Memory
Cohort Number Overall Female Male Difference
45-49 2740 3.953 3.929 3.987 -0.059
50-54 2011 3.548 3.530 3.567 -0.037
55-59 2756 3.355 3.213 3.497 -0.284***
60-64 2267 3.223 3.091 3.349 -0.257***
65-74 2427 2.83 2.64 2.993 -0.353***
75 + 930 1.795 1.58 2.039 -0.459***
All 13,131 3.275 3.185 3.369 -0.184***
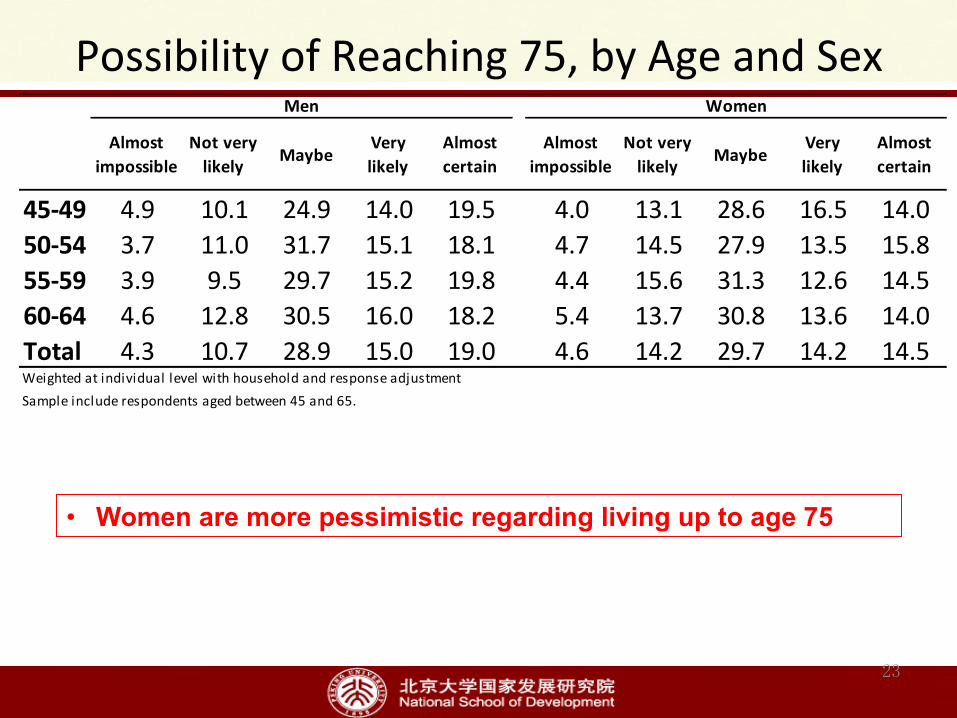
Possibility of Reaching 75, by Age and Sex
23
Almostimpossible
Not verylikely Maybe
Verylikely
Almostcertain
Almostimpossible
Not verylikely Maybe
Verylikely
Almostcertain
45-‐49 4.9 10.1 24.9 14.0 19.5 4.0 13.1 28.6 16.5 14.050-‐54 3.7 11.0 31.7 15.1 18.1 4.7 14.5 27.9 13.5 15.855-‐59 3.9 9.5 29.7 15.2 19.8 4.4 15.6 31.3 12.6 14.560-‐64 4.6 12.8 30.5 16.0 18.2 5.4 13.7 30.8 13.6 14.0Total 4.3 10.7 28.9 15.0 19.0 4.6 14.2 29.7 14.2 14.5Weighted at individual level with household and response adjustmentSample include respondents aged between 45 and 65.
Men Women
• Women are more pessimistic regarding living up to age 75

• Very strong education gradient 24

Any ADL/IADLs Difficulty
25
• ADL/IADL difficulty is more serious for women and for the rural • For rural women 75 and older, the fraction reaches 70%
Men Women Men Women Men Women45-‐49 13.6 22.1 7.6 9.2 10.5 15.350-‐54 16.7 27.5 9.9 13.7 13.4 20.455-‐59 24.0 34.4 14.3 18.0 19.2 26.060-‐64 27.9 42.2 17.1 22.7 22.9 32.965-‐69 33.7 48.5 21.9 34.1 28.6 41.870-‐74 42.7 55.0 25.9 29.6 34.5 41.375+ 57.4 70.2 47.6 57.7 52.4 64.2Total 27.5 39.2 17.8 22.6 22.8 30.8Weighted at individual level with household and response adjustmentSample include respondents not younger than 45.
Rural Urban Total

• Also very sharp educational gradient for both genders • Given education, women are slightly better in this measure
26
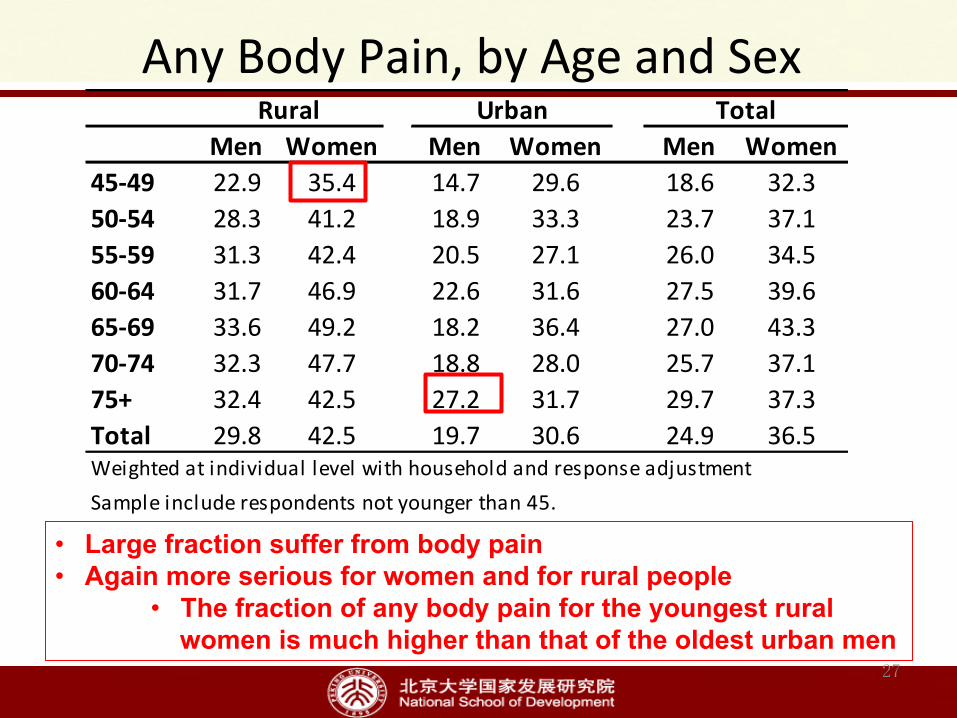
Any Body Pain, by Age and Sex
27
• Large fraction suffer from body pain • Again more serious for women and for rural people
• The fraction of any body pain for the youngest rural women is much higher than that of the oldest urban men
Men Women Men Women Men Women45-‐49 22.9 35.4 14.7 29.6 18.6 32.350-‐54 28.3 41.2 18.9 33.3 23.7 37.155-‐59 31.3 42.4 20.5 27.1 26.0 34.560-‐64 31.7 46.9 22.6 31.6 27.5 39.665-‐69 33.6 49.2 18.2 36.4 27.0 43.370-‐74 32.3 47.7 18.8 28.0 25.7 37.175+ 32.4 42.5 27.2 31.7 29.7 37.3Total 29.8 42.5 19.7 30.6 24.9 36.5Weighted at individual level with household and response adjustmentSample include respondents not younger than 45.
Rural Urban Total

Toothless, by Age
• People lose all of their teeth very quickly as they age 28

Toothless, by Educa-on
• Again strong educational gradient for both genders • Given education, women are better in this measure
29
Health insurance and health care cost
30
31
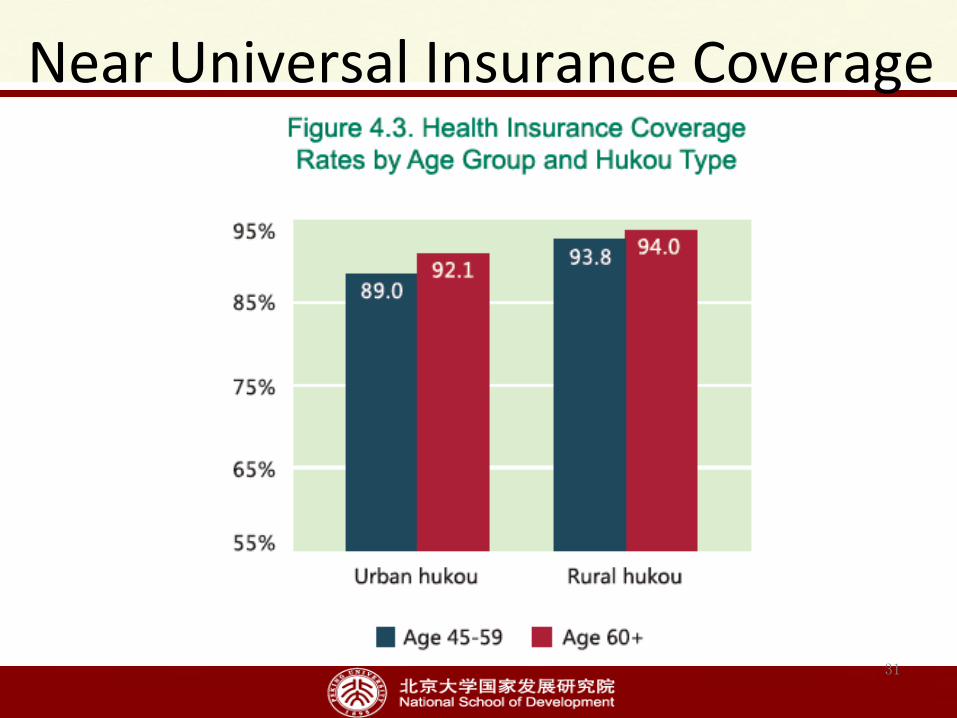
Near Universal Insurance Coverage

�
Figure 1 Reimbursement Rates from Any Insurance for Inpatients by Total Cost
32
.2.3
.4.5
.6
Rei
mbu
rsem
ent r
ates
0 10000 20000 30000Total cost of inpatient for the last visit in the last year
Urban Hukou Rural Hukou
• For urban people, the reimbursement rate increases with inpatient care cost and become stable at relatively higher level
• For rural people, the reimbursement rate remains low even at very high inpatient cost

33
Segmented Programs
• People with rural insurance have similar or lower OCP, but it takes up much higher fraction of their total PCE, much larger fraction spent half of PCE on inpatient care

• Challenges from chronic diseases • Women have poorer health in almost all
categories of health, physical, mental and cognition
• Rural people generally have poorer health • Strong SES gradients are found in many
dimensions of health • Insurance coverage is near universal, but
medical burden is still high, especially for the rural
34
Some Pagerns Found

Thank you!hgp://charls.ccer.edu.cn/en
35