Securitized Products: An Overview of Mortgage- and Asset-Backed · PDF fileSecuritized...
32
Securitized Products: An Overview of Mortgage- and Asset-Backed Securities Jim Womack, CFA Managing Director & Principal March 12, 2015 Monte Carlo Resort & Casino Las Vegas, Nevada
Transcript of Securitized Products: An Overview of Mortgage- and Asset-Backed · PDF fileSecuritized...

Securitized Products: An Overview of Mortgage- and Asset-Backed Securities
Jim Womack, CFAManaging Director & Principal
March 12, 2015Monte Carlo Resort & Casino
Las Vegas, Nevada

Mortgage-Backed & Asset-Backed Securities:What Are They and How Are They Different From Other Bonds?
• Bonds backed by many ( th d ) f b
Generally Speaking:
(or thousands) of borrowers.
• Credit worthiness is often independent of the issuer.
• Significant credit support at issuance that builds over time
St dit fil t• Strong credit profile not reliant on asset valuations.
Unique Advantages of MBS / ABS:
• Efficiently Achieve Greater Creditand Economic Diversity
• Gain Credit Stability Through Even the Worst of Market Conditions
- 2 -
• Reduce or Eliminate the Event Risk Inherent in Single Credit Issues
• Attractive Yields vs. Other Types of Lower Rated Bonds

High Credit Quality and Cash Flow StabilityAn “Apples to Apples” Comparison of Historical Excess Returns
SECTOR INDEX DURATION
ANNUALEXCESS RETURN
Merrill Lynch AAA Credit Card ABS 2.3 Years 0.89%* **
Merrill Lynch AAA Auto ABS 1.3 Years 0.84%
Merrill Lynch 1-3 Year Agency CMO PAC 1.9 Years 0.84%*
*
**
**
Merrill Lynch 1-3 Year Corporate (AAA-A) 1.9 Years 0.75%
Merrill Lynch 1-5 Year Corporate (AAA-A) 2.8 Years 0.67%
*
*
**
**Merrill Lynch 1 5 Year Corporate (AAA A) 2.8 Years 0.67%
Merrill Lynch 1-3 Year Callable Agencies 1.4 Years 0.14%* ***
- 3 -
* Data as of December 31, 2014** Annualized duration adjusted excess return vs. Treasuries since December 1996 (earliest available excess return data on ABS)*** Annualized duration adjusted excess return vs. Treasuries since December 1998 (earliest available excess return data on Callable Agencies)
Source: Merrill Lynch & Bloomberg
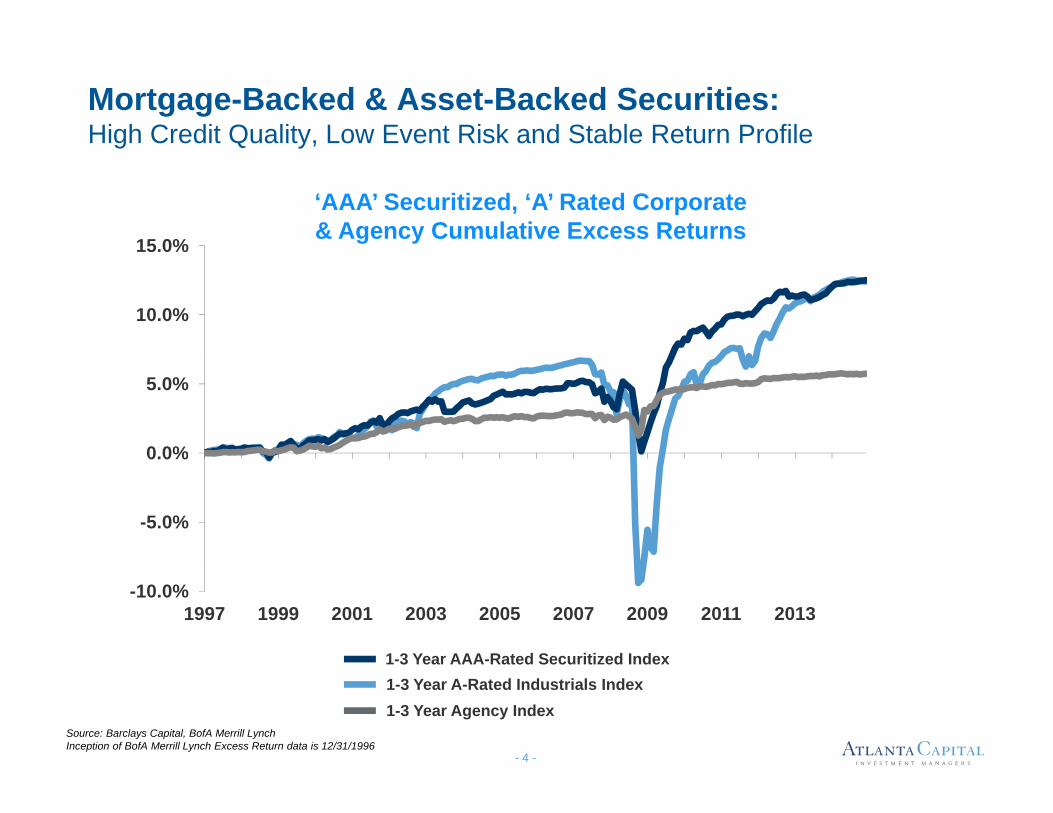
Mortgage-Backed & Asset-Backed Securities:High Credit Quality, Low Event Risk and Stable Return Profile
15.0%
‘AAA’ Securitized, ‘A’ Rated Corporate& Agency Cumulative Excess Returns
10.0%
0.0%
5.0%
-5.0%
0.0%
-10.0%1997 1999 2001 2003 2005 2007 2009 2011 2013
1-3 Year AAA-Rated Securitized Index
- 4 -
1 3 Year AAA Rated Securitized Index1-3 Year A-Rated Industrials Index
Source: Barclays Capital, BofA Merrill LynchInception of BofA Merrill Lynch Excess Return data is 12/31/1996
1-3 Year Agency Index

Asset-Backed Securities: The Basics Non-Housing Related Receivables in Bankruptcy Remote Structures
AAA AAA AAA AAA RatedRated
ABS TrustABS Trust
A RatedA Rated
AA RatedAA Rated
- 5 -
BBB RatedBBB Rated

Asset-Backeds: Remembering The Great Financial CrisisNot The Headlines You Remember!
“Most Senior GMAC prime auto ABS ratings able to withstand ‘depression’ unemployment scenario.”
Moody’s Investor Service 5 12 09
“Moody’s has placed fifteen tranches from eight loan securitizations sponsored by Ford Motor Company in 2006 and 2007 on review for
- Moody s Investor Service, 5-12-09
sponsored by Ford Motor Company in 2006 and 2007 on review forpossible upgrade. The build up of credit enhancement more than offsets modest increases in lifetime cumulative losses observed in the underlying collateral pools.” - Moody’s Investor Service 8-21-09y g p Moody s Investor Service, 8 21 09
“Auto-loan Backing is Popular; Investors Like These Tried and Tested Securities” - Headline Wall Street Journal 9-16-2009
“Due to available credit enhancement and structural protections, ratings for prime senior tranches of ABS auto loan transactions have
Tested Securities - Headline, Wall Street Journal, 9-16-2009
- 6 -
ratings for prime senior tranches of ABS auto loan transactions have remained stable year-to-date.” - Fitch Ratings, 10-26-09

Asset-Backeds: How The Typical Auto Structure WorksTwo Types of Credit Support: Overcollateralization & Subordination
Overcollateralization
L A t f
Pool of Auto Loans
Lesser Amount ofBonds Backed by Loans
Subordination
Still Lesser AmountOf Senior (AAA Rated)
Bonds Backed by LoansLesser Amount of
Subordination
- 7 -
Lesser Amount ofBonds Backed by Loans

Asset-Backeds: How The Typical Auto Structure WorksSubordination Protects The Senior Note Holders 5 Ways
Class Rating Size PercentA1
A2-AAAAAAA
210,000,000400,000,000A2 A
A2-BA3A4
AAA AAAAAAAAA
400,000,000450,000,000592,000,000249,260,000 93.0%
B AA 60,200,000 5th Loss Protection 3.0%
C A 40,135,000 4th Loss Protection 2.0%
D BBB 40,135,000 3th Loss Protection 2.0%
Reserve Account 2nd Loss Protection 0.8%
R A t 1 t L P t ti 1 0%Reserve Account 1st Loss Protection 1.0%
8.8%Total Subordination For Senior Note Holders5.7%Overcollateralization at Origination
- 8 -
g
14.5%Total Credit Support to Senior Bondholders
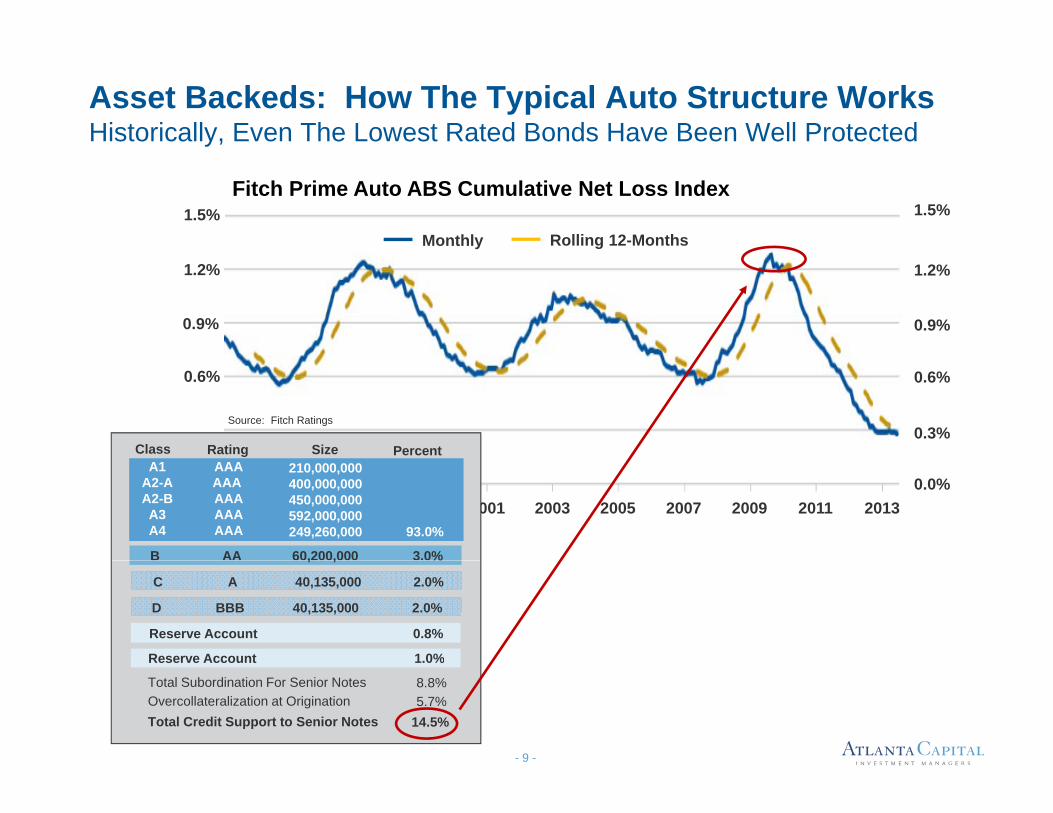
Asset Backeds: How The Typical Auto Structure WorksHistorically, Even The Lowest Rated Bonds Have Been Well Protected
1.5%Fitch Prime Auto ABS Cumulative Net Loss Index
1.5%
Monthly Rolling 12-Months
1.2%
0.9%
1.2%
0.9%
0.6%
0.2%
0.6%
0.3%Class Rating Size Percent
Source: Fitch Ratings
0.0%9/93 9/94 9/95 9/96 9/97 9/98 2001 2003 2005 2007 2009 2011 2013
0.0%Source: Fitch Ratings
B AA 60,200,000 3.0%
A1A2-AA2-BA3A4
AAAAAA AAAAAAAAA 93.0%
210,000,000400,000,000450,000,000592,000,000249,260,000
Reserve Account 0.8%
Reserve Account 1.0%
D BBB 40,135,000 2.0%
C A 40,135,000 2.0%
, , %
- 9 -
%
8.8%Total Subordination For Senior Notes5.7%Overcollateralization at Origination
14.5%Total Credit Support to Senior Notes

Asset-Backeds: How The Typical Auto Structure WorksNatural Deleveraging: The Credit Enhancement Grows As Bonds Pay Down
AAACredit Support 14.5% 15.9% 24.7% 65.2%Credit Support 14.5% 15.9% 24.7% 65.2%
A1 A2 A
Total Credit Support to A1
AAA0.3 YearWAL
A2-AA2-BAAA1.1 Year WAL
A3AAA2.2 Year WAL
A4AAA3.8 Year WAL
B T h AA R t d 4 4 Y WAL
Support to Senior
BondholdersAt Origination
B Tranche, AA Rated, 4.4 Year WAL
C Tranche, A Rated, 4.7 Year WAL
D Tranche, BBB Rated, 4.9 Year WAL14.5%
- 10 -
Reserve Accounts

Still a Need For A Structured Approach to InvestingBeyond the Rating: Ensuring High Credit Quality and Cash Flow Stability
Factors to Analyze at Purchase (e.g., New Issue):
Overcollateralization Overcollateralization
Subordination
Underlying Loan Characteristics Underlying Loan Characteristics~ Fico Scores (Credit Profile of Borrowers)~ Loan Terms (Length, LTV, etc.)~ Distribution of Loan Terms~ Geographic Distribution
Collateral Characteristics~ New Autos vs Used Autos New Autos vs. Used Autos~ Cars vs. SUVs
Sponsor/Servicer (e.g., Ford, GE, etc.)E i ( biliti t t d d f l iti ti )
- 11 -
~ Experience (capabilities, strategy and procedures for loss mitigation)~ Financial Condition

Still a Need For A Structured Approach to InvestingBeyond the Rating: Ensuring High Credit Quality and Cash Flow Stability
Factors for Ongoing Analysis:
Deal Specific Credit Metrics~ Delinquencies (30, 60, 90+ Days)~ Cumulative Net Losses~ Changes in Credit Enhancement
Economic Fundamentals~ Collateral Values (i.e., Used Auto Prices) Collateral Values (i.e., Used Auto Prices)~ Economic Environment (unemployment, housing, gas prices, etc.)~ Fleet Age
Financial Market Conditions Financial Market Conditions~ ABS Spreads (particularly on lower rated tranches)~ Equity Performance (stock prices of issuer/servicers )~ Corporate Debt Performance (spreads on corporate debt or CDS)
- 12 -
p ( p p )

Mortgage-Backed SecuritiesThe Mortgage Market Is One of the Deepest and Most Liquid Markets
Marketable Debt Outstanding12 Average Daily Trading Volume
600$11 9
8
10
400
500$11.9
$8 7
$505
6
8
$ Tr
illion
s
300
400
$ Bi
llions
$8.7$7.5
2
4
100
200$2.1 $179
$200 0
$20 $5
- 13 -Source: The Securities Industry and Financial Markets Association Data as of December 31, 2014

Mortgage-Backeds: More Yield Than Corporates…But Why? Comparing Yield of MBS vs. A Rated Corporate Bonds
30-Year MBS Pass-Through & Like Maturity A Rated Corporate Yields10.0
6.0
8.0
rcen
t
4.0
Yiel
d in
Per
0.0
2.0
30 Year MBS Pass-through Average Yield:A R t d C t B d A Yi ld
5.69%5 01%
MBS Yield Advantage:
1992 1994 1996 1998 2000 2002 2004 2006 2008 2010 2012 2014
0 68%
- 14 -
A Rated Corporate Bond Average Yield: 5.01% Advantage: 0.68%
Source: Merrill Lynch, Bloomberg Data as of December 31, 2014
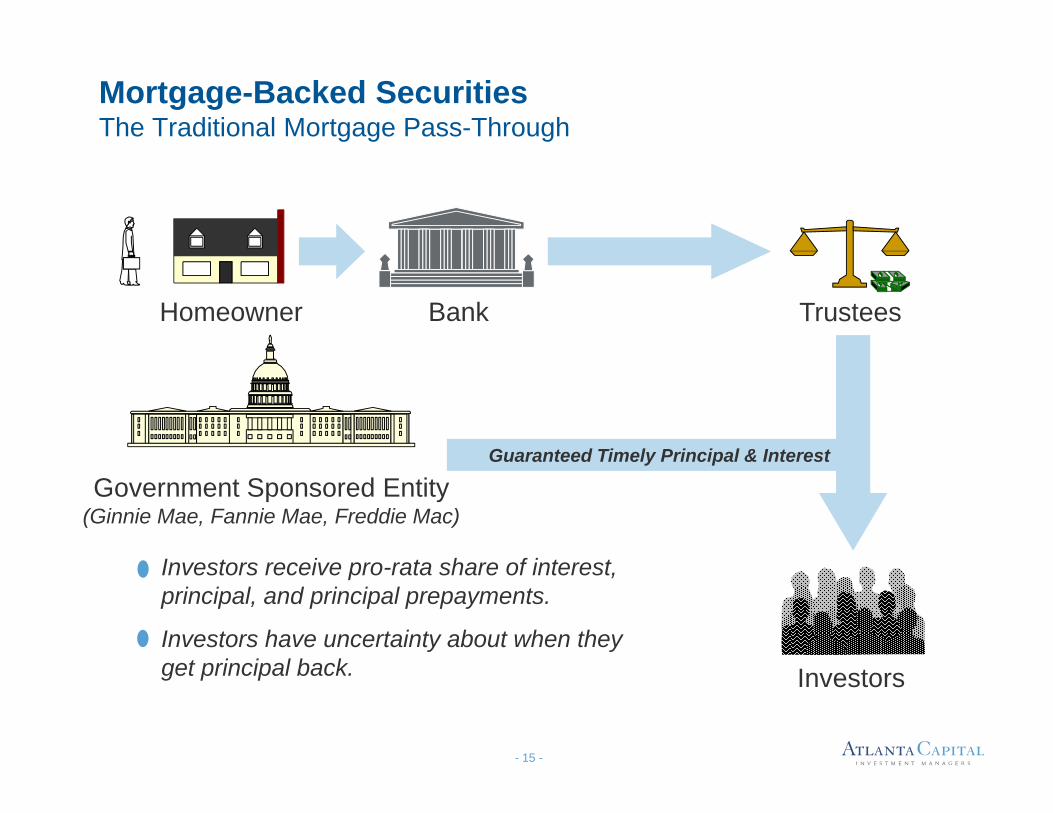
Mortgage-Backed SecuritiesThe Traditional Mortgage Pass-Through
Homeowner Bank Trustees
Guaranteed Timely Principal & Interest
Government Sponsored Entity (Ginnie Mae, Fannie Mae, Freddie Mac)
Guaranteed Timely Principal & Interest
I t i t h f i t tInvestors receive pro-rata share of interest, principal, and principal prepayments.
Investors have uncertainty about when they get principal back
- 15 -
Investorsget principal back.

Mortgage-Backed SecuritiesTraditional GSE Guaranteed Mortgage-Backed Securities
Key Characteristics of MBS:
Bonds Receive Principal and Interest Monthly Because Borrowers Bonds Receive Principal and Interest Monthly, Because Borrowers Make Monthly Mortgage Payments
Borrowers Can Repay Their Loans Without Penalty and at Any Time
They Refinance, Get Transferred, Death, Divorce, Buy Bigger/Smaller Home, Etc. People Prepay Their Mortgages For a Variety of Reasons
PSA = Prepayment Speed Assumption, CPR = Constant Prepayment Rate
The Speed of Loan Prepayment is Measured by PSA & CPR
100 PSA or 100% of the PSA model rate, calls for prepayments to start slowly and build to a 6% constant prepayment rate (CPR) after 24 months.
However: If mortgage rates declined, the prepayment rate could jump because
- 16 -
However: If mortgage rates declined, the prepayment rate could jump because homeowners are refinancing (i.e., +200 PSA or 24CPR).
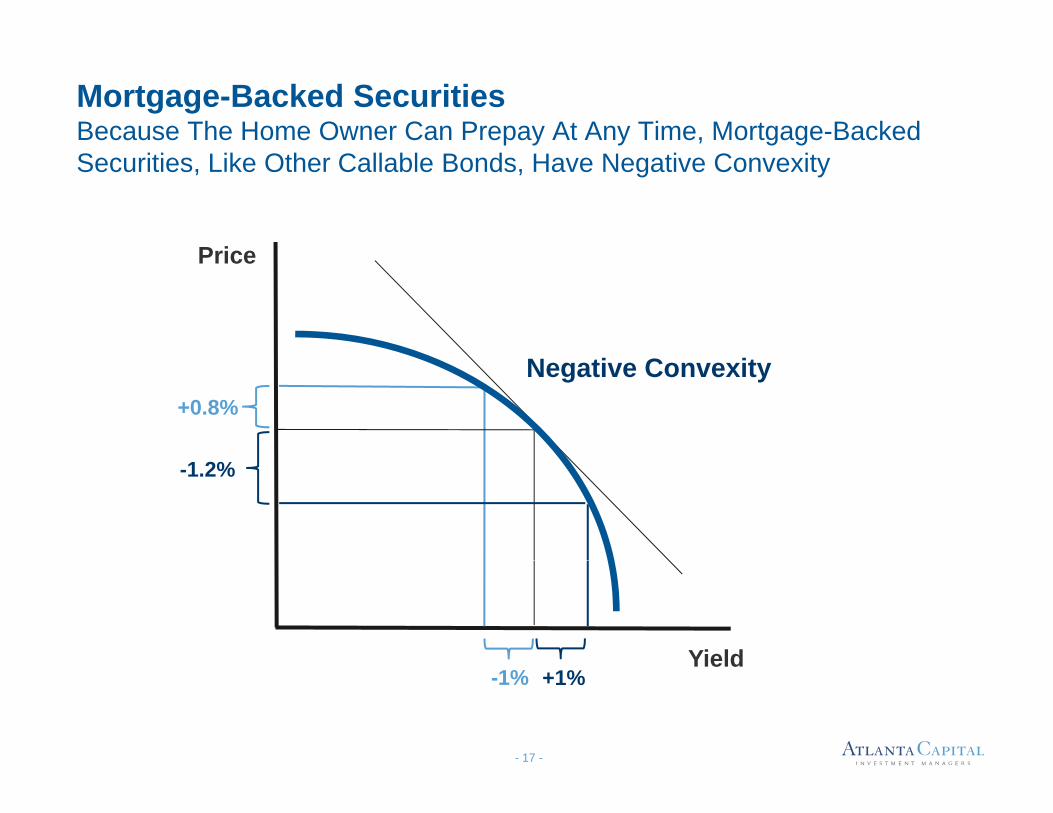
Mortgage-Backed SecuritiesBecause The Home Owner Can Prepay At Any Time, Mortgage-Backed
Price
Securities, Like Other Callable Bonds, Have Negative Convexity
Price
Negative Convexity+0.8%
-1.2%
Yield
- 17 -
Yield+1%-1%

Mortgage-Backed SecuritiesTraditional 30-Year Mortgage Lending
30-Year Loans Spread Payments Out to Reduce Monthly Payment
Key Characteristics of 30-Year Loans & MBS:
Nearly All of The Payment In The Early Years Is Interest
p y y y
The Interest Rate Level Impacts The Monthly Payment For the Borrower
So 30 Year Borrowers Are Typically Very Rate Sensitive
e te est ate e e pacts e o t y ay e t o t e o o eon a 30-Year Loan More Than on a 15-Year or 10-Year Loan(A Key Reason Why People Don’t Refinance Their Cars)
Borrowers Can Repay Their Loans Without Penalty and at Any Time
So 30-Year Borrowers Are Typically Very Rate Sensitive
Bondholders Recei e An Attracti e Yield Abo e Treas ries Agenc Iss ed Bondholders Receive An Attractive Yield Above Treasuries, Agency Issued Debentures and Other Types of Securities Because Borrowers Can Repay Their Loans Without Penalty and at Any Time
S
- 18 -
Agency MBS are Backed by The Homeowner, by The Agency, and byThe Implied Guarantee Of The Government

Mortgage-Backed SecuritiesTraditional 30-Year Mortgage Pass-Through & Cash Flow Profile
Mortgage Rates UNCHANGED
Mortgage RatesHIGHER
Mortgage Rates LOWER
NO REFINANCELESS Trading UpLESS RenovationESS D i i
Trading UpMajor Renovation
Downsizing
REFINANCEMORE Trading UpMORE Renovation
LESS DownsizingGet Transferred
Death, Divorce, Etc.
DownsizingGet Transferred
Death, Divorce, Etc.MORE Downsizing
Get TransferredDeath, Divorce, Etc.
12% CPRPer Year
6% CPRPer Year
25% CPRPer Year
8 YearBond
5 YearBond
2 YearBond
- 19 -3 Year Extension 3 Year Contraction

Mortgage-Backed SecuritiesTraditional 15-Year and 10-Year Mortgage Lending
Key Characteristics of 15-Year & 10-Year Loans & MBS: 15-Year & 10-Year Loans Are For People Who Want To Pay Debt Back Fastp y
More of the Payment Is Principal, So The Interest Rate Has Less of an Impact on The Monthly Payment
So 15-Year & 10-Year Borrowers Are Typically LESS Rate Sensitive
The Shorter The Loan, The Less Variability The Cash Flows Are At a Given Prepayment Speed
Borrowers Can Repay Their Loans Without Penalty and at Any Time
They Have The Same Credit Backing as Bonds Backed by 30-Year Loans
15-Year and 10-Year Pass-throughs Receive An Attractive Yield Above Treasuries, Agency Issued Debentures and Other Types of Securities,
- 20 -
, g y yp ,But Less Than a 30-Year Pass-through

Mortgage-Backed SecuritiesTraditional 10-Year Mortgage Pass-Through & Cash Flow Profile
Mortgage Rates UNCHANGED
Mortgage RatesHIGHER
Mortgage Rates LOWERREFINANCE
MORE Trading UpMORE RenovationMORE D i i
Trading UpMajor Renovation
Downsizing
NO REFINANCELESS Trading UpLESS RenovationLESS Downsizing MORE Downsizing
Get TransferredDeath, Divorce, Etc.
gGet Transferred
Death, Divorce, Etc.LESS DownsizingGet Transferred
Death, Divorce, Etc.
12% CPRPer Year
7% CPRPer Year
25% CPRPer Year
4.0 YearBond
3.4 YearBond
2.9 YearBond
- 21 -
0.6 Year Extension 0.5 Year Contraction

Mortgage-Backed SecuritiesCollateralized Mortgage Obligations (CMOs) & Cash Flow Profile
Homeowner Bank Trustees
Guaranteed Timely Principal & Interest
Government Sponsored Entity (Ginnie Mae, Fannie Mae, Freddie Mac) Classes Increase Cash Flow Certainty
Investor certainty is increased
Class 3Class 2
$$
$
Class 1$
$$ $
$$
Investor certainty is increased.
Investors in short-term, intermediate-term and long-term securities can now participate in the mortgage backed
- 22 -
participate in the mortgage-backed securities market.
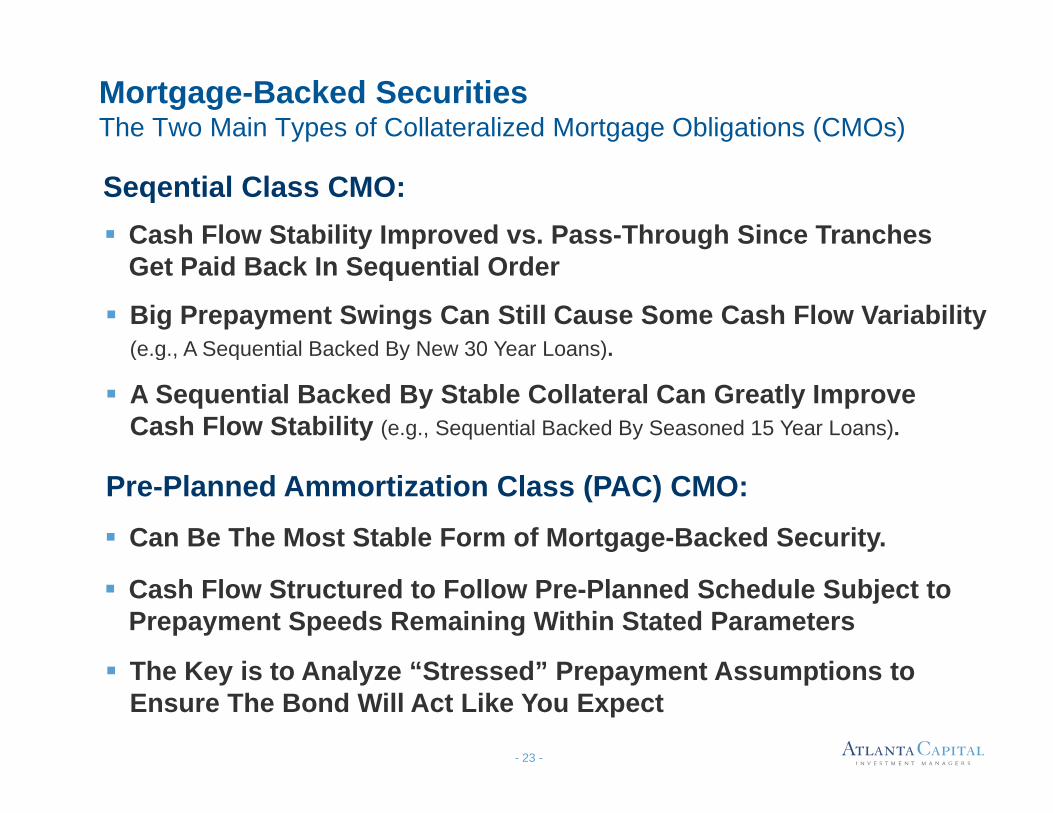
Mortgage-Backed SecuritiesThe Two Main Types of Collateralized Mortgage Obligations (CMOs)
Seqential Class CMO: Cash Flow Stability Improved vs. Pass-Through Since Tranches
Get Paid Back In Sequential Order
Big Prepayment Swings Can Still Cause Some Cash Flow Variability(e.g., A Sequential Backed By New 30 Year Loans).(e.g., A Sequential Backed By New 30 Year Loans).
A Sequential Backed By Stable Collateral Can Greatly Improve Cash Flow Stability (e.g., Sequential Backed By Seasoned 15 Year Loans).
Pre-Planned Ammortization Class (PAC) CMO: Can Be The Most Stable Form of Mortgage-Backed Security.
Cash Flow Structured to Follow Pre-Planned Schedule Subject to Prepayment Speeds Remaining Within Stated Parameters
Th K i t A l “St d” P t A ti t
- 23 -
The Key is to Analyze “Stressed” Prepayment Assumptions to Ensure The Bond Will Act Like You Expect

Mortgage-Backed SecuritiesAnalyzing The PAC CMO Structure
The PAC Can Have Stability Because Other Support Bonds Make It So.
If Prepayments Are Greater Than Expected, The Support Classes Will Take The Additional Prepayments So The PAC Doesn’t Have To.
If Prepayments Are Less Than Expected, The Support Classes Will Forego Principal So The PAC Gets The Desired Amount.
$ $ $
Forego Principal So The PAC Gets The Desired Amount.
PACCMO
$$
$
Support Class 1
$$
$ $$
$
SupportClass 2
Investors Typically Run “Stress Tests” To Ensure The Support Classes
- 24 -
yp y ppAre Adequate To Provide The Required Stability For The PAC Class.

Mortgage-Backed SecuritiesThe Well Structured PAC CMO Structure
Consistent Payment History Well Within Wide PAC Bands
2 Year Bond at +50 bps Over Treasuries
- 25 -
• Often Greater Yield and Cash Flow Stability Than Callable Agencies• Yields Comparable or Higher than A-Rated Corporate Bonds.
Source: Bloomberg

Mortgage-Backed SecuritiesThe Key Factors That Drive Cash Flow Stability
Collateral Characteristics:
L T Sh t E l M St bilitLoan Term: Shorter Equals More StabilityLoan Balance: Lower Equals More StabilitySeasoning (Loan Age): Longer Equals More Stability
S i S
Seasoning (Loan Age): Longer Equals More StabilityMortgage Rate: Out-of-money Equals More Stability
Security Structure:Structure Often Enhances Collateral Characteristics, But There Is No Substitute For Careful Analysis.
Pre-Planned Amortization (PAC) CMO More StabilitySequential Amortization (SEQ) CMO Some Stability
y
Generally Speaking:
- 26 -
Sequential Amortization (SEQ) CMO Some StabilityMortgage Pass-through Least Stability

Mortgage-Backed Securities: Why So Much On Cash Flow Stability: Minimizing Extension (And Call) Risk
“Taper Tantrum”
Sample (Actual)MBS & CMO
Portfolio
TypicalMortgageCollateral
Duration: 2.1 Years
Yield-to-Maturity: 1.3%
3.2 Years
1.3%SHORTER
LOANS
Wtd. AverageOriginal Loan Term: 16 Years 30 Years
Wtd. Average $ Price: $104.2 $107.3
MORESEASONED
Avg. Origination Date: 2004
Current Avg Balance: $79K
2012
$300KCurrent Avg. Balance: $79K $300KLOWER LOAN
BALANCEAvg. Time to Maturity: 9 Years 30 Years
- 27 -
Impact of 50 Basis PointRate Decline on Payment: $19 / mo $85 / mo
MORE STRUCTURE
Source: Merrill Lynch, Bloomberg, Atlanta Capital Data as of September 2012
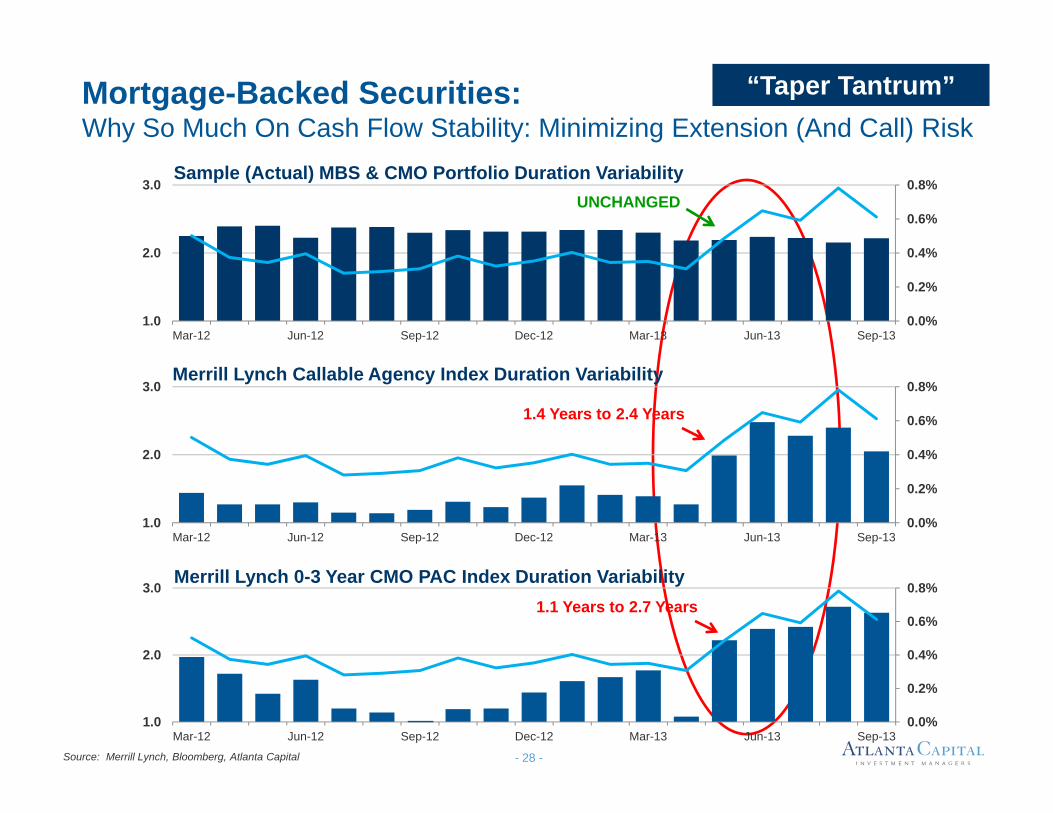
Mortgage-Backed Securities: Why So Much On Cash Flow Stability: Minimizing Extension (And Call) Risk
“Taper Tantrum”
0 4%
0.6%
0.8%
2 0
3.0Sample (Actual) MBS & CMO Portfolio Duration Variability
UNCHANGED
0.0%
0.2%
0.4%
1.0
2.0
Mar-12 Jun-12 Sep-12 Dec-12 Mar-13 Jun-13 Sep-13
0.4%
0.6%
0.8%
2.0
3.0Merrill Lynch Callable Agency Index Duration Variability
1.4 Years to 2.4 Years
0.0%
0.2%
0.4%
1.0
2.0
Mar-12 Jun-12 Sep-12 Dec-12 Mar-13 Jun-13 Sep-13
0.4%
0.6%
0.8%
2.0
3.0Merrill Lynch 0-3 Year CMO PAC Index Duration Variability
1.1 Years to 2.7 Years
- 28 -
0.0%
0.2%
1.0Mar-12 Jun-12 Sep-12 Dec-12 Mar-13 Jun-13 Sep-13
Source: Merrill Lynch, Bloomberg, Atlanta Capital

Mortgage-Backed Securities: Why So Much On Cash Flow Stability: Minimizing Extension (And Call) Risk
“Taper Tantrum”
Negative Convexity (e.g., The 1-Year, Non-Call, 5-Year Callable Bond)
1 Year 5 Year
y y g ( )
Purchase Call Maturity D t
1 Year 5 Year
Date Date Date
April 30 Yield(Yield to Call)
Duration(Duration to Call)
May-AugustReturn
1-Year T-Note Index Return:1-Year, NC 5-Year Callable Bond:
(Yield to Call) (Duration to Call) Return0.14% 1.0 yr 0.07%
1.0 yr0.97% (2.96%)
Reaching for Yield Adding yield almost always means adding some form of risk (credit risk,
- 29 -
duration, negative convexity, etc.). It’s important to understand the riskswith each investment and how they impact the overall portfolio.
Source: Merrill Lynch, Bloomberg
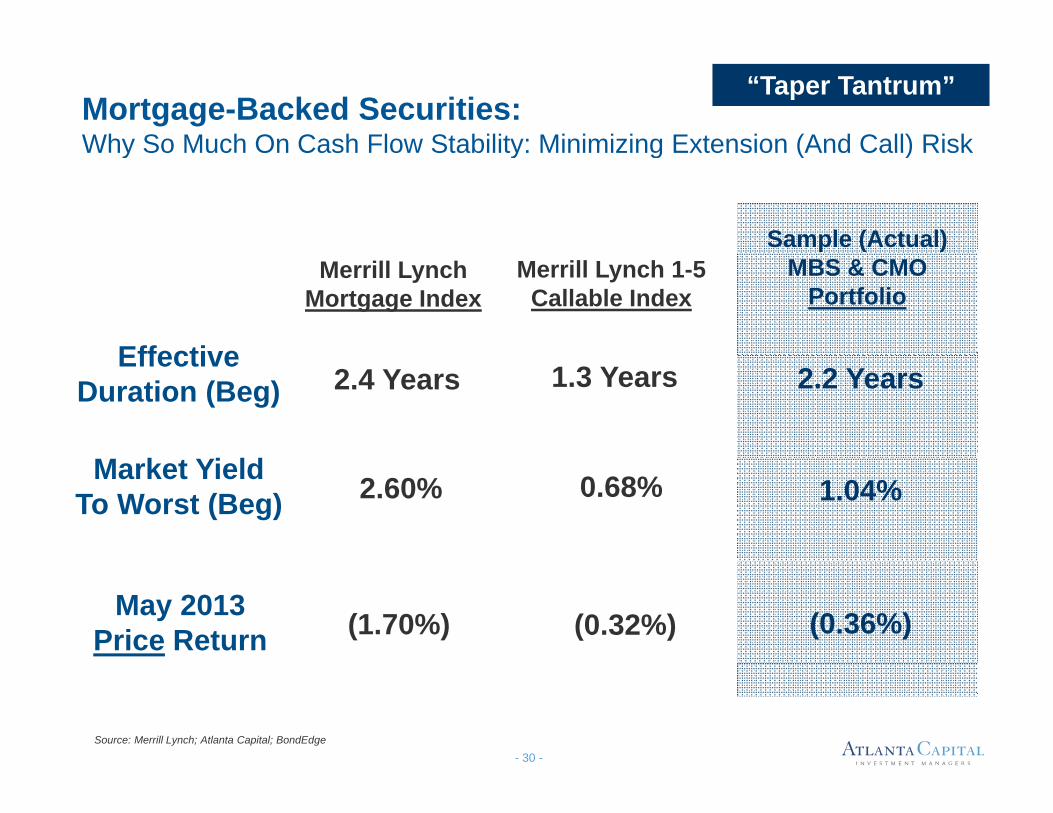
Mortgage-Backed Securities: Why So Much On Cash Flow Stability: Minimizing Extension (And Call) Risk
“Taper Tantrum”
Sample (Actual)
Why So Much On Cash Flow Stability: Minimizing Extension (And Call) Risk
Merrill Lynch 1-5Callable Index
Effective
MBS & CMOPortfolio
Merrill LynchMortgage Index
Effective Duration (Beg)
M k Yi ld
1.3 Years 2.2 Years2.4 Years
Market YieldTo Worst (Beg) 0.68% 1.04%2.60%
May 2013Price Return (0.32%) (0.36%)(1.70%)
- 30 -Source: Merrill Lynch; Atlanta Capital; BondEdge

Mortgage-Backed & Asset-Backed SecuritiesSummary: High Yield and High Quality Are Not Mutually Exclusive
The Mortgage-Backed and Asset-Backed Sectors Can Offer Attractive Investments That Can Add Significant Yield and T t l R t O TiTotal Return Over Time
Premiums Are Comparable to or Higher Than Many ‘A’ Rated Corporate Bonds and the Return Profile Is More StableCorporate Bonds and the Return Profile Is More Stable
Traditional Mortgage Bonds and Many ABS Structures Have A Proven Track Record of Maintaining The Highest Credit QualityProven Track Record of Maintaining The Highest Credit Quality In Even The Deepest Economic Downturns
Cash Flow Stability Is Achieved Primarily By Collateral Type and Cash Flow Stability Is Achieved Primarily By Collateral Type and Security Structure
When High Credit Quality and Cash Flow Stability Are Properly
- 31 -
When High Credit Quality and Cash Flow Stability Are Properly Combined, Event Risk Can Be All But Eliminated

Thank You!Thank You!
- 32 -