SCHOOL OF MANAGEMENT - Universiti Sains...
37
SCHOOL OF MANAGEMENT MASTER IN BUSINESS ADMINISTRATION RELATIONSHIP OF CUSTOMER LOYALTY AND SATISFACTION PERCEPTION STUDY ON THE MOBILE INDUSTRY IN OMAN–A CASE OF OMAN MOBILE Supervisors Main Supervisor: Dato Associate Professor Dr Ishak Ismail Co- supervisor: Datin Professor Dr Hasnah Haron Student Name Dhahi Saleh Jameel Al- Darey P-EM0118/07 (2009)
Transcript of SCHOOL OF MANAGEMENT - Universiti Sains...

SCHOOL OF MANAGEMENT
MASTER IN BUSINESS ADMINISTRATION
RELATIONSHIP OF CUSTOMER LOYALTY AND
SATISFACTION PERCEPTION STUDY ON THE MOBILE
INDUSTRY IN OMAN–A CASE OF OMAN MOBILE
Supervisors
Main Supervisor: Dato Associate Professor Dr Ishak Ismail
Co- supervisor: Datin Professor Dr Hasnah Haron
Student Name
Dhahi Saleh Jameel Al- Darey
P-EM0118/07
(2009)

i
RELATIONSHIP OF CUSTOMER LOYALTY AND SATISFACTION PERCEPTION
STUDY ON THE MOBILE INDUSTRY IN OMAN–A CASE OF OMAN MOBILE
BY
DHAHI SALEH JAMEEL AL DAREY
Research Report in Partial Fulfillment of the Requirement for the Degree of Master of
Business Administration (MBA)
UNIVERSITI SAINS MALAYSIA
2009

ii
DEDICATION
From The deep of My Heart,
Especially Dedicate This Thesis to My Lovely
My Wife (Am Salaah)
My Mother
My Sons
(Salaah and Khalifa)
&
My Daughters
Matheer, Atheer and Tharaa)(
DHAHI AL –DAREY
2009

iii
ACKNOWLEDGEMENT
Alhamdulillah I am thankful to ALLAH (S.W.T) for giving me the strength to realize my goal
and complete this study. I do strongly think my supervisors, Associate Professor Dato Ishak
Ismail and Datin Professor Hasnah Haron for full insight, attention, encouragement and
guidance to support me to complete this research project. I also would like to strongly thank
my mother, my Wife, my children and my brothers ,my family especially Mahfood Al-
Masroori & Salima Al-Darey and all my friends in Oman for all the support and love they
have given to me. I also would like to strongly thank all my lectures of the USM (MBA)
program and all my friends in USM especially Tawfiq (Yemen),Ismai (Palestine), Yudhi
(Indonesia ) , Dr Salem Al Seeqati (Oman )and all my friends who supported me directly or
indirectly along my life in USM.I also would like to strongly thank my general manager in the
Public Authority for Stores and Food Reserved Sheikh Merdaas Al- Harthi (Oman) and
Sheikh Saeed Al- Sawai( Oman) and Nassir Al- Shokily (Oman ) Last but not last to all
respondents who were ever willing to answer my questionnaire .
DHAHI AL DAREY
2009

iv
TABLE OF CONTENTS
ACKNOWLEDGEMENT iii
TABLE OF CONTENTS iv
LIST OF TABLES ix
LIST OF FIGURES x
ABSTRAK xi
ABSTRACT xii
Chapter 1 INRODUCTION
1.1 Introduction 1
1.2 Background 1
1.3 Problem Statement 4
1.4 Research Objectives 6
1.5 Research Questions 6
1.6 Significance of the Research 6
1.7 Definition of Key Terms 8
1.7.1 Service Quality 8
1.7.2 Perception Quality 8
1.7.3 Customer Loyalty 8
1.7.4 Customer Expectation 8
1.7.5 Customer Satisfaction 9
1.8 Organization of this Chapter 9
Chapter 2 LITERATURE REVIEW
2.1 Introduction 10
2.2 Oman 10
2.2.1Oman Demographics 11
2.3 Education in Oman 13
v
2.4The Human Resources and Employment Statuses in Oman 16
2.5 Telecom Overview in Oman 21
2.5.1 Oman Telecommunication Company (SAOG) 21
2.5.2 Oman Mobile 22
2.5.3 Nawras 22
2.5.4 Mobile Growth Trend in Oman 22
2.5.5 SMS 25
2.5.6 International Roaming 26
2.5.7 Third Generation (3G) 26
2.5.8Telecom Financial Performance 27
2.5.9 Average Revenue per User (ARPU) 27
2.5.10 Regulating the Competition 28
2.5.11 Mobile Traffic 28
2.5.12 Promotional Offers 31
2.6 Several Models of Service Quality 32
2.6.1 GAP Model 32
2.6.2Model of perceived service quality and satisfaction 36
2.6.3 Antecedents and mediator model 37
2.7 Service Quality 38
2.8 Customer Perceptions vs expectations 40
2.9 Customer Satisfaction 40
2.10 Customer Loyalty 42
2.11 Relationships between Perceived Service Quality, Customer Satisfaction, 43
and Customer Loyalty
2.12 Convenient location of service provider 45
2.13 Customer Education 48
2.14 The Quality Dimensions 49
2. 15The Theoretical Framework 51
vi
2.16 Hypotheses Development 52
2.16.1 Relationship between Service Quality and Customer Loyalty 53
2.16.2 Influence of moderating variable for mobile Phone Users on the 54
Relationship between Customer Satisfaction and Customer Loyalty
2.17 Summary 56
Chapter 3 METHODOLOGY
3.1 Introduction 57
3.2 Research Design 57
3.3 Population and Sample Size 58
3.4 Questionnaire Development 58
3.5 The Variables 58
3.6 The Measurements 59
3.6.1 Perception of Service quality dimensions 59
3.6.2 Service quality, customer perception and customer expectation 59
3.6.3 Customer loyalty 60
3.7 Data Collection 60
3.8 Data Analysis 61
3.8.1. Descriptive Statistics 62
3.8.2. Factor Analysis 62
3.8.3. Reliability Analysis 62
3.8.4. Correlation Analysis 62
3.8.5 Multiple Regression Analysis 62
3.9 Summary 63
Chapter 4 DATA ANALYSIS AND RESULTS
4.1 Introduction 64
4.2 Descriptive analysis 64

vii
4.2.1 Profile of Respondents 64
4.3Factor Analysis 66
4.4 Reliability Analysis 69
4.5 Descriptive Analysis 70
4.6Correlation Analysis 73
4.7Regression Analysis 75
4.8 Moderating Effect of Demographic Profile on Customer Loyalty 76
4.9 Simple Slope of the Moderating Effect 79
4.10 Summary 81
Chapter 5 DECUSSIONS AND CONCLUSIONS
5.1 Introduction 85
5.2Recapitulation of the Study 85
5.3 Discussions of the Findings 87
5.3.1 Relationship between perceived service qualities with customer loyalty 87
5.3.2 Customer Location, education level and employment status of mobile phone 90
users will have an influence on the relationship between service quality
and customer loyalty.
5.4 Implications of the Study. 91
5.5 Limitations of the Study. 92
5.6 Recommendations for Future Research. 93
REFERENCES 94
APPENDIXES
Appendix A Questionnaire Sample
Appendix B Frequencies Tables

viii
Appendix C Factor Analysis
Appendix D Reliability Analysis
Appendix E Descriptive Analysis
Appendix F Correlation Analysis
Appendix G Regression Analysis
ix
LIST OF TABLES
2.1 Indicators of Oman Population Census (2003) 12
2.2 Educational Status in Oman 16
2.3 labor force Indicators in Oman 20
2.4 Tariff Approval by Operator 30
2.5 Promotional Offers 31
3.1 Service Quality Dimensions 59
3.2 Customer Perception and Customer Perception 59
3.3 Customer Loyalty 60
3.4 Distribution of Questionnaires 61
4.1 Profile of respondents 65
4.2 Factor Analysis for Perceived Service Quality 67
4.3Factor Loading for Customer Loyalty 69
4.4 Result of the Reliability Test 70
4.5 Descriptive of the Major Variables 71
4.6 Comparison of Satisfaction Gap in Major Service Quality Dimension 71
4.7Comparison of mean responses for expectation, perception and 72
gap scores among respondents
4.8 Correlation among major Variables 74
4.9 Result of Regression Analysis for Perceived Service Quality 76
4.10 Result of Regression Analysis 78
4.11 Summary of Results of the Analyses 82
x
LIST OF FIGURES
2.1 Map of Oman 10
2.2 Mobile Subscriber’s Growth Trend in Oman Market During 23
(2001- 2007).
2.3Mobile Penetration Rate (Country Comparison 2006). 24
2.4 Post Paid Subscribers 25
2.5 Pre Paid Subscribers 25
2.6 Telecom Revenues by Sectors (Thousand OR) (2005-2007) 27
2.7 Mobile, Fixed line Internet ARPU (2005- 2007) (in OR) 28
2.8 Gap analysis model 34
2.9 Extended Model of Service Quality 36
2.10 Satisfactions-Service Quality Model 37
2.11 Antecedents and Mediator Model 38
2.12 Conceptual Framework 52
4.1 The interaction graph between tangibility and customer loyalty 79
4.2 The interaction graph between reliability and customer loyalty 80
4.3 The interaction graph between assurance and customer loyalty 81
xi
ABSTRAK
Tujuan kajian ini adalah untuk memahami tanggapan kualiti perkhidmatan dan meneliti
perhubungan di antara dimensi kualiti perkhidmatan, kepuasan pelanggan dan kesetiaan
pelanggan terhadap perkhidmatan yang diberikan oleh pembekal perkhidmatan telefon bimbit
di pasaran Oman. Model SERVQUAL telah digunakan untuk mengukur tanggapan dan
harapan pelanggan terhadap perkhidmatan yang diberikan oleh pembekal perkhidmatan
telefon bimbit tersebut. Dua ratus lima puluh soal selidik telah dihantarkan kepada 4 lokasi di
Oman (bandar, kampung, gunung dan padang pasir.) Kaedah persampelan mudah telah
digunakan. Dua ratus responden telah memberikan maklumbalas di dalam masa yang
ditetapkan. Dapatan kajian menunjukkan perhubungan yang positef di antara dimensi kualiti
perkhidmatan dan kesetiaan pelanggan. Hanya empati mempunyai perhubungan dengan
kesetiaan pelanggan. Sebagai tambahan, lokasi, tahap pendidikan dan status pekerjaan
pengguna telefon mobile di dapati mempunyai perhubungan signifikan di antara kepuasan
kualiti perkhidmatan dan kesetiaan pelanggan. Pihak pengurusan haruslah meminta pekerja
mereka memberi lebih perhatian kepada empati . empati adalah elemen penting kualiti
perkhidmatan dan menjadi sebab utama kesetiaan pelanggan kepada pembekal perkhidmatan
telefon bimbit tersebut. Dapatan kajian juga menunjukkan responden yang tinggal di bandar
mempunyai kesan positif terhadap perhubungan di antara kualiti perkhidmatan dan kesetiaan
pelanggan.

xii
ABSTRACT
The purpose of this research is to find a better understanding of perceived service quality
level and to examine the relationship between service quality dimensions, customer
satisfaction and customer loyalty with the service offered by the mobile service provider in
Oman market . SERVQUAL model was used to measure the mobile service provider
customers perception and expectation with the mobile service provider services received. Two
hundred and fifty questionnaires were distributed to mobile phone users in four locations in
Oman (urban, villages, mountains, deserts). Two hundred respondents had given their
feedback within the suggested time frame. Research findings showed a positive relationship
between service quality satisfaction dimensions and customer loyalty. Only empathy was
found not to have a relationship with customer loyalty. Management needs to emphasize the
importance of empathy to all employees. Empathy is an essential element of service quality
and is the main for the loyalty of customers to the mobile phone service provider. It was also
found that respondents’ staying in urban was found to have a positive influence on the
relationship between service quality and customer loyalty.

1
Chapter One
INTRODUCTION
1.1 Introduction
This chapter introduces the present study by highlighting the background, the problem
statement, the research objectives, the research questions, the significance of the study, the
definition of key terms, and the organization of the remaining chapters.
1.2 Background of the Study
Today, every business organization throughout the world, ranging from small
business owners to large corporations, is constantly seeking unique and innovative ways to
improve their quality of service to achieve competitive advantage and enhance customer
satisfaction.
Service quality has become a major area of attention to practitioners, managers, and
researchers owing to its strong impact on business performance, lower costs, customer
satisfaction, customer loyalty, and profitability (Leonard & Sasser, 1982; Cronin & Taylor,
1992; Gammie, 1992; Hallowell, 1996; Chang & Chen, 1998; Gummesson, 1998; Lasser et
ci., 2000; Silvestro & Cross, 2000; Newman, 2001; Sureshchander et ci., 2002; Guru, 2003
etc.).
The construct ‘quality’ as conceptualized in many service literatures and as measured
by SERVQUAL focuses on perceived quality. In this study, perceived quality is defined as
the consumers' judgments about an entity's overall excellence or superiority.

2
The term ‘expectations’ is used differently in the consumer satisfaction literature and
the service quality literature since it is a significant source of potential confusion. In the
satisfaction literature, expectations are viewed as predictions made by consumers about what
is likely to happen during an impending transaction or exchange. On the other hand, in the
service quality a literature, expectations are viewed as desires or wants of consumers or what
they feel a service should offer rather than would offer to them.
Organizations seek to improve the customers’ satisfaction, which can help them
achieve a sustainable competitive advantage with the realization that high service quality
results in higher customer retention and increased market share (Buzzell & Gale, 1987;
Danaher & Rust, 1996; Rust… et., 1994). Customers’ satisfaction is how customers feels after
purchasing a product or service and, in particular, whether or not that product or service meets
their expectations.
The concept ‘customer loyalty’ is used to describe the behavior of repeat customers as
well as those that offer good ratings, reviews, or testimonials. Some customers do a particular
organization a great service by offering favorable word of mouth publicity regarding a
product. They tell their friends and family and thus add them to the number of customers who
may become loyal sooner or later. However, customer loyalty does not take place by having
heard about a certain product or service; it is much more than that. It is a process, a program,
or a group of programs geared towards keeping a customer happy so that he or she will
provide more business. Customer loyalty can be achieved in some cases by offering a quality
of service or product with a firm guarantee. Customer loyalty is also achieved through free
offers, coupons, low interest rates on financing, high value trade-ins, extended warranties,
rebates, and other rewards and incentive programs. The ultimate goal of customer loyalty
programs is to make happy customers return to purchase again and persuade others to use that
3
company's products or services. This equates to profitability as well as to happy stakeholders.
Customers’ loyalty increases sales by purchasing a wider variety of the organization services
and products and by making more frequent purchases. Bowen & Shoemaker (1998) found
loyal hotel customers had higher food and beverage purchases than non-loyal customers.
Finally, loyal customers cost less to serve, because they know the product and require less
information.
The service of telecommunications market in Oman is dominated by state-controlled
incumbent operator, Oman Telecommunications Company (Omantel). It is the sole licensed
operator of public fixed-line telecommunications services including local, long-distance, and
international telephone calls in addition to data communications, value-added services, and
Internet access services. Having launched a digital cellular network in 1996, the company was
also the only mobile services provider in Oman until March 2005 when new entrant Nawras
Telecom launched its offering.
Nawras won a tender for the second cellular license in June 2004 and received the
license in February 2005. Omantel's cellular subsidiary, Oman Mobile, was given a formal
cellular license in February 2004. Both companies operated in the cellular market under a
three-year period of exclusivity that had expired in February 2008. However, both companies
are still working in the market until now.
The Telecommunications Regulatory Authority of Oman (TRA) expects to license a
second national public fixed-line network operator and a second national public data network
operator in "the near future", but has yet to set a schedule for offering these licenses. It was
widely expected that some announcements will be made in early-2007.

4
As part of its agreement with the World Trade Organization (WTO) concerning the
liberalization of the telecommunications sector, the government of Oman has completed the
privatization of Omantel. A 30% stake in the company was sold on the Omani stock market in
June/July 2005 with 9% sold to specific pension and charitable funds. Foreign investors were
not able to purchase Omantel shares at that time, but they have been able to do so since
October 2005. There is a 49% gap on the level of foreign ownership in Omantel, although no
single shareholder can presently hold more than 5% of the company's shares.
This study is purposed to assist the Oman Mobile Telecom companies in the Oman
market for measuring customer satisfaction. Customer satisfaction is operationlized through
the gap of customers’ perceptions – their expectations. This study seeks to determine the
customers view (mobiles provider companies) of service quality and it tries to determine
some SERVQUAL model dimensions and other factors that are relevant to mobiles provider
companies in Oman market. This study also tries to test the relationship between service
quality dimensions and customer satisfaction as a guide to customer loyalty in the mobile
service industry in Oman.
1.3 Problem Statement
Service quality has been the subject of considerable interest by both practitioners and
researchers in recent years after its first appearance in the original work of Parasuraman et
at. (1985). An important reason for the interest in service quality by practitioners results
from the belief that service quality has a beneficial effect on bottom-line performance for the
firm. Service quality can help an organization to differentiate itself from other organizations
5
and gain a competitive advantage. Superior service quality is a key to improved profitability
(Ghobadian et at, 1994).
However, practitioners often tend to use the terms service quality and customer
satisfaction interchangeably. Among academics, the satisfaction construct is recognized as
being distinct and has developed along fairly independent lines from service quality (e.g.
Oliver, 1980). The concepts ‘service quality’, ‘customer satisfaction’, and ‘service loyalty’
are related to each other. There are consistent findings across different industries that service
quality leads to customer satisfaction. Rust & Zahorik (1993) & Storbacka et al. (1994)
studied the impact of service quality on satisfaction, and satisfaction on customer loyalty.
They found service quality to be positively correlated with satisfaction that will lead to
increased purchase (customer loyalty). Sauss B & Neuhaus (1997) in their study found a
significant positive relationship between customer satisfaction and customer loyalty. In short,
they argued that a satisfied customer tends to be more loyal to the organization than a
dissatisfied of customer. This current study seeks to study the link between service quality,
customer satisfaction, and customer loyalty.
In fact, the government of Oman is to open the Omani market for the new international
mobile companies to invest in the telecommunication business in the Oman. This study would
try to determent the factors that influence customer satisfaction and the effects of
demographic factors namely: (location, education level, and employment status) on customer
satisfaction and customer loyalty.
6
1.4 Research Objectives
The objectives of this study are:
1. To examine the relative importance of each of the service quality dimensions.
2. To examine the difference between perception & expectation for each service quality
dimension.
3. To examine the relationship between customer satisfaction & customer loyalty.
4. To examine the influence of customer’s location, educational level, & employment
status on the relationship of customer satisfaction and customer loyalty.
1.5 Research Questions
This study will try to answer the following questions:
1. What is the relative importance of each of the service quality dimensions?
2. What are the gaps of perception and expectation for each service quality dimension?
3. What is the relationship between customer satisfaction and customer loyalty?
4. What is the influence of customers’ location, education level, and employment status
on the relationship between customer satisfaction and customer loyalty?
1.6 Significance of the Research
In regard to the increasing competition faced by many service providers especially in
the mobile service industry, this study will shed the light on some of the most important
factors that contribute to customer satisfaction, which leads to customer loyalty in order to
help the managers of mobile service providers maintain a pool of loyal customers which will
in turn help the business organizations to sustain in this competitive business environment.

7
Rust & Zahorik (1993) & Storbacka et al. (1994) studied the impact of service quality
on satisfaction and the impact of satisfaction on customer loyalty. They found service quality
to be positively correlated with satisfaction, which will lead to increased purchase {customer
loyalty). Selnes (1993) argues that it is satisfaction with a brand that leads to customer
loyalty. This view is also supported by Dick & Basu (1994). LaBarbera & Mazursky (1983)
show empirically that brand loyal customers had a lower probability to switch brands due to
higher levels of satisfaction. In general, research in this area suggests that service quality is
an important indicator of customer satisfaction (Spreng & Mackoy, 1996). Satisfaction and
quality are closely linked to market share and customer retention (Fornell, 1992; Rust &
Zahorik, 1993; Patterson & Spreng, 1997).
In addition, there were no studies conducted in Oman that are concerned with making
a comparison among mobile companies in Oman market or that which measure service
quality level in the mobile service. Understanding a new concept in business is very important
for having an effective marketing strategy. This study will contribute to the existing literature
by incorporating new variables to the conceptual frame work to test their impacts on customer
satisfaction and customer loyalty with respect to mobile service providers industry in Oman
market. from this study, the Management of mobile service providers they will be able to
enhance the service quality dimensions that the customers are not satisfied with. It would also
help them to develop their marketing strategy.
8
1.7 Definition of Key Terms
1.7.1 Service Quality:
Service Quality is a relativistic and cognitive discrepancy between experience-based
norms and performances concerning service benefits (Roest & Pieters’ 1997).
1.7.2 Perceived Quality:
Perceived Quality is a total judgment of evaluation with respect to a product or a
service bearing on the relative superiority of this product/service (Rust & Oliver, 1994;
Taylor & Bakker, 1994; Bitner & Hubert, 1994) or the degree and direction of discrepancy
between consumer’s perceptions and expectations (Parazuraman, Zeithaml & Berry (1985,
1988).
1.7.3 Customer loyalty:
Customer Loyalty is the degree to which a customer repeats purchasing behavior from
a service provider, possesses a positive attitudinal disposition towards the provider, and
considers using only this provider when a need for this service exists (Gremler & Brown,
1996).
1.7.4 Customer Expectation:
Customer Expectation is conceptualized as a normative standard of future wants
(Boulding et aL,1993, p. 8).

9
1.7.5 Customer Satisfaction:
Customer Satisfaction is a psychological concept that involves the feeling of well-
being and pleasure that results from obtaining what one hopes for and expects from an
appealing product and/or service (WTO, 1985).
1.8 Organization of the Remaining Chapters
In order to conduct this study in an efficient way, five chapters were presented.
Chapter one presents an overview of the study and reasons of conducting the study have been
explained. The second chapter presents and discusses the previous studies conducted in the
service quality and customer satisfaction; it also presents the theoretical framework and
hypotheses of this study. Chapter 3 looks at the research mythology, research design,
variables and measurements, population, data collection, and data analysis. Chapter 4 presents
the goodness of measurement used and the results of the tested hypotheses. Chapter 5 is the
last chapter. It presents the overall findings and implication of the research. Some suggestions
and recommendations are presented in this chapter as well.

10
Chapter Two
LITERATURE REVIEW
2.1 Introduction
This chapter introduces the present study by highlighting the background of Oman,
telecom market overview in Oman, several models of service quality, definition of service
quality, definition of customer satisfaction, impact of customer perception and expectation on
customer satisfaction, the definition of customer loyalty, the relationship between service
quality and customer satisfaction , the relationship between customer satisfaction and
customer loyalty , the SERVQUAL model, and the theoretical framework for this study .
2.2 Oman
Figure 2.1 Map of Oman

11
Oman (Arabic: عمان transliteration: Umān), officially the Sultanate of Oman (Arabic: عمان
transliteration: Salṭanat Umān), is an Arab country in southwest Asia on the southeastسلطنة
coast of the Arabian Peninsula. In the northwest, Oman is facing the United Arab Emirates.
Saudi Arabia is facing Oman from the west and Yemen from the southwest. The coast is
formed by the Arabian Sea on the south and east and the Gulf of Oman on the northeast. The
country also contains Madha, an exclave enclosed by the United Arab Emirates, and
Musandam, an exclave separated by Emirati territory. Oman covers an area of about 309,500
sq km (about 119,500 sq mi) and its capital city is Muscat.
2.2.1 Oman Demographics
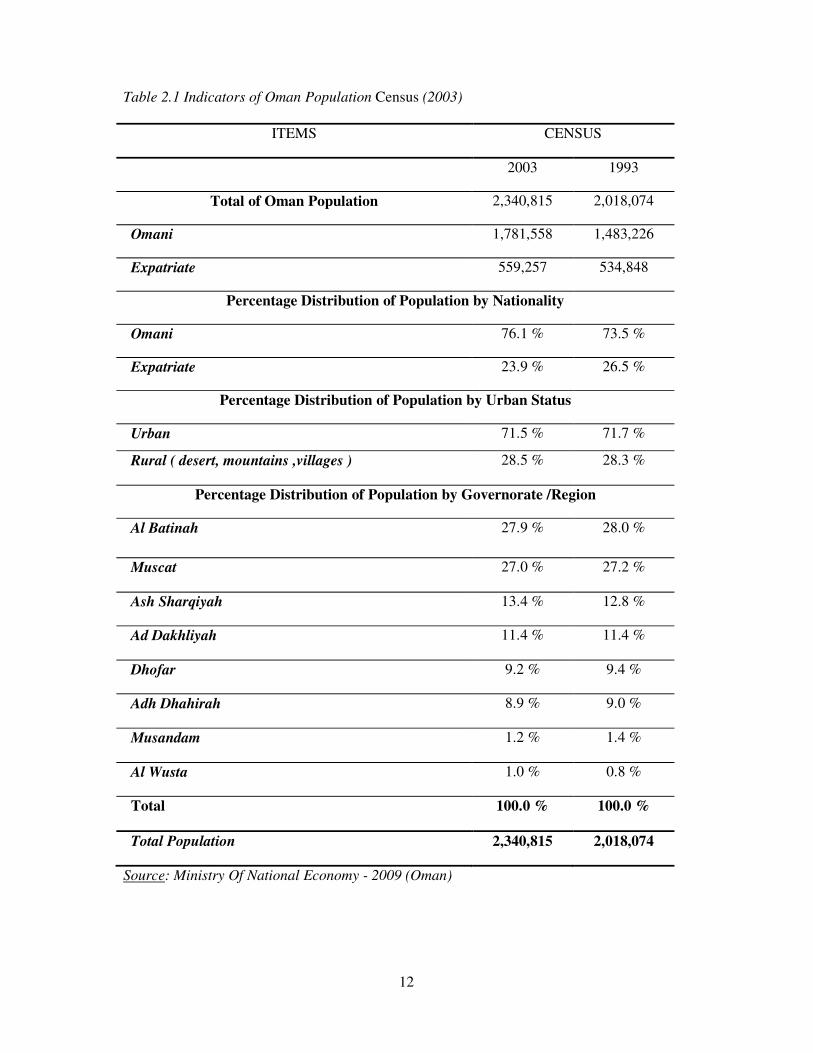
Based on the Indicators of Oman Population Census 2003 (see table 2.1), the Ministry
of Economy estimated that in mid 2006, the total population was 2.577 million. Of those,
1.844 million were Omanis. The population has grown from 2.018 million in the 1993 census
to 2.340 million in the 2003 census. In Oman, about 50% of the population lives in Muscat
and the Batinah coastal plain northwest of the capital; about 200,000 live in the Dhofar
(southern) region, and about 30,000 live in the remote Musandam Peninsula on the Strait of
Hormuz. Some 600,000 expatriates live in Oman, most of whom are guest workers from
Pakistan, Bangladesh, Egypt, Jordan, India, and the Philippines. The age structure of Omani
population is between 0-14 years: 42.2% (male 603,664; female 580,469), 15-64 years: 55.4%
(male 934,621; female 620,158) and 65 years and over: 2.4% (male 36,504; female 31,709).
12
Table 2.1 Indicators of Oman Population Census (2003)
ITEMS CENSUS
2003 1993
Total of Oman Population 2,340,815 2,018,074
Omani 1,781,558 1,483,226
Expatriate 559,257 534,848
Percentage Distribution of Population by Nationality
Omani 76.1 % 73.5 %
Expatriate 23.9 % 26.5 %
Percentage Distribution of Population by Urban Status
Urban 71.5 % 71.7 %
Rural ( desert, mountains ,villages ) 28.5 % 28.3 %
Percentage Distribution of Population by Governorate /Region
Al Batinah 27.9 % 28.0 %
Muscat 27.0 % 27.2 %
Ash Sharqiyah 13.4 % 12.8 %
Ad Dakhliyah 11.4 % 11.4 %
Dhofar 9.2 % 9.4 %
Adh Dhahirah 8.9 % 9.0 %
Musandam 1.2 % 1.4 %
Al Wusta 1.0 % 0.8 %
Total 100.0 % 100.0 %
Total Population 2,340,815 2,018,074
Source: Ministry Of National Economy - 2009 (Oman)

13
2.3 Education in Oman
Is provided free of charge up to the end of secondary education, though attendance is
not mandatory at any level. In 1970 there were only three formal schools with 900 students in
the whole country. Oman's national educational program expanded rapidly during the 1970s
and the 1980s. In 2006–2007 about 560,000 students attended 1053 public schools. The
number of students in private schools is about 20,000. Sultan Qaboos University, the only
national university near Muscat, was established in 1986. In 2006, it had 13,500 students. The
2006 Human Development Report found adult literacy rate to be 81.4% in adults (older than
15) up from 54.7% in 1990. For the same period, the youth (15-24) literacy rate increased
from 85.6 to 97.3%. Public expenditure on education was reported to be 4.6% of GDP and
26.1% of total government spending.
The Omani higher education system is relatively young since the Sultan Qaboos
University, the first public university in Oman, was founded in 1986. Prior to the
establishment of SQU, the government sent some students to pursue higher education studies
in neighboring Arab countries like UAE, Kuwait, Jordan, and Egypt. Some students were also
awarded scholarships to study in the UK and America.
Currently, the Ministry of Higher Education operates the SQU, Rustaq Education
College for preparing teachers and five specialist colleges in Ibri, Nizwa, Salalah, Sohar and
Sur (until recently all five used to be Education Colleges). The Law College and College of
Banking and Financial Studies are also run by the Ministry of Higher Education. The Ministry
of Manpower operates the Higher College of Technology in Muscat and five colleges of
technology in Al-Mussana, Ibra, Nizwa, Salalah and Shinas. The Ministry of Health runs a
number of health institutes to prepare assisting medical staff like nurses, paramedics and

14
pharmacists. As the number of students finishing secondary school rises each year; 44,000
students are expected to finish in 2008. SQU and other public colleges became unable to
cope with demand as places were limited. Competition for acceptance in public higher
teaching was (and is still) very fierce. Since private colleges were very limited in the mid
nineties, more and more parents sent their kids overseas to study in countries like UAE,
Jordan, and Egypt. The government became aware of the trend and decided to encourage the
private sector to form universities and colleges in the country. The first private college was
established in 1994. Since this date, Oman has seen quite a lot of new foundations. Most of
the colleges focus on business administration and computer sciences. They are usually
affiliated with European, Australian or American institutions. The language of instruction is
mainly English. As part of the Oman initiative, applications for 2006/2007 higher education
(public and private) places have been merged under one unified online system (Higher
Education Admissions Center).
Each higher education institute publishes the minimum entry requirements for each of
its degrees and the students select their choices in order of preference. When the Ministry of
Education publishes secondary school results in mid July, these results are fed automatically
into the system and offers are made in early August. Prior to the new system, the students had
to submit their papers to the different institutes by themselves after the publication of results.
The process was very inconvenient for the students and the admission departments because
there was very little time and students had to travel a lot.
Sultan Qaboos University and other private universities offer both Bachelor and
Master degrees but not in all subjects. Starting from September 2008, SQU will introduce Phd
studies in four of its colleges namely: (Agriculture and Marine Sciences, Medicine,

15
Engineering, and Natural Sciences). A Bachelor degree takes about five years as the first year
of is spent in studying English, the second year is spent in studying relevant science subjects,
and the last three years are dictated to core degree units. A medicine degree takes seven years.
The public university is normally visited by Omani students only. Expatriates go - as a
general rule - to private universities or study abroad. Dhofar University is famous for
welcoming international students. At the moment, colleges are mostly concerned with
teaching in the undergraduate area. Only a few colleges have started to offer Masters’
degrees. At these colleges, the students receive their first vocational graduation. The first year
ends normally with a "Higher National Certificate (HNC)". The second year concludes with
the "Higher National Diploma (HND)". The third year leads to an academic grade of a
Bachelors’ degree.
In year 2003, Omani Ministry of Higher Education approved the merger of five
private run colleges in order to form the Muscat University. However, the plan to merge Fire
Safety Engineering College, Majan College, Modern College of Business & Science, Middle
East College of Information Technology, and Mazoon College for Management and Applied
Sciences failed (source: Oman Observer 18.7.2005). Currently, there is some hope that the
plan to form Muscat University may be revived.

16
Table 2.2 Educational Status in Oman
ITEMS CENSUS
2003 1993
Percentage distribution of Omani Population (10 years and over) by Educational
Status
Illiterate 17.8 % 31.8 %
Can read and write 19.8 % 27.9 %
Primary /First stage of education 20.9 % 21.5 %
Preparatory /Second stage of basic education 17.5 % 10.4 %
Secondary 17.9 % 5.5 %
Post secondary non-tertiary 2.5 % 1.5 %
University 3.1 % 1.1 %
Master \ PhD 0.3 % 0.1 %
Not stated 0.2 % 0.2 %
Total 100.0 % 100.0 %
Omani Population (10 years and over) 1,328,546 958,953
Source: Ministry of National Economy -2009 (Oman)
2.4 The Human Resources and Employment Statuses in Oman
Based on the indicators of labor force in Oman (see table 2.3), the government of
Sultan of Oman, has adopted a wider definition of human resources development. The
concept adopted considers this as the aim and ultimate goal of the development process. On
the basis of this broad perception, all previous development plans have therefore attached
significant importance to human resources development. The focus on human resources has
been strengthened further and now it has become one of the main dimensions of the Vision
17
for Oman's Economy: Oman 2020. On the basis of the approved strategy for human
resources development, the Sultanate strives to create quantitative and qualitative
improvement in all fields of general and technical education, vocational training, higher
education, health services, labor market, and in the different demographic indicators.
The achievement of all the dimensions of the Vision for Oman's Economy relies on
accomplishing economic equilibrium and sustainable growth, the diversification of income
sources, and the private sector development. This cannot be realized without formulating a
realistic and flexible strategy for human resources development. Through the adoption of
practical integrated policies and mechanisms for human resources development the Sultanate
can prepare the Omani society to enter the 21st century. Competition in the next century will
be based upon the industries that depend on science and knowledge. The success of nations
in the coming century will be closely linked to the potentialities and skills of their people to
cope with technological and scientific advances. This calls for creativity understanding and
scientific invention. It is important to emphasize that caring for mothers results in the
creation of a model nation. As women represent half of Omani population, the government
has accorded special care to them since the commencement of the development process. As
one of the fundamental bases of the development efforts, equal employment opportunities in
all fields have been provided for women by the sultanate of Oman. Social indicators in the
fields of education, health, and labor market reflect the significant gains made by women in
this respect. Girls now represent 48% of total students at primary stage, 46% at a preparatory
stage and more than half of the students in the academic year 1995-96 at Sultan Qaboos
University. These percentages remain unchanged until 2005.For historical and traditional
reasons, the participation of women in the formal economic and a social sector is still
modest. However, women's participation in informal sectors such as handicrafts and
18
traditional industries is relatively significant. Through this strategy, the government will
strive to develop the role of Omani women and their contribution to the national economy
within the next phase. In spite the pronounced improvement in the indicators related to
labour market and human resources development during the period (1970-1995), there was
still a group of challenges that face the labour and Omanization sector. To overcome theses
challenges, the vision for Oman's Economy: Oman 2020 gave a special attention to human
resources development and qualification of national labor force. The vision for human
resources involves: (creation of well developed Omani human resources with capacities and
skills that conform to the technical and technological development and characterized by high
efficiency for management of changes. This is in order to face the regional and international
continuously changing conditions and ensure maintenance of Omani traditions and customs.
The objectives of the labor and Omanization sector vision in the Vision for Oman's
Economy: Oman 2020 involve provision of employment opportunities in both Omani public
and private sectors and their training and qualification in a manner suitable to the labor
market. This can be achieved by:
• Providing employment opportunities for Omanis to avoid unemployment and provide
them with training and qualification in order to conform to the labour market needs.
• Substituting expatriate labor with highly qualified Omani labor. This is to shift the
economy from low value added economy to one with high value added. Furthermore,
this will increase the participation of the Omanis in the labor market in general and
increasing the Omani women participation in particular.
• Increasing the efficiency of the Omani labor market through reducing the differentials
in allowances between the public and private sectors.
• Omanizing the ratio in the private sector, which increased from (14.7%) in 1995 to
(16.6%) in 2000 due to increased employment rate of Omanis compared to non-
Omanis by (5.1%) relative to (2.3%). Hence, it appears that the planned Omanization

19
ratio in private sector employment by the end of the plan in 2000, which was
estimated to be (25%), has not been accomplished.
• In the civil public sectors, the Omanization rate slightly increased from (68.5%) to
(74%) during the period (1995-2000). This increase is attributable to the increasing
number of Omani employees at a growth rate of (1.5%) and the negative growth for
non-Omanis during the period at a rate reaching (3.8%)
• Regarding the total employees in the two sectors, it was noticed that the Omanization
ratio did not change much as it increased from (34%) to (34.3%) between 1995 and
2000. Therefore, the planned Omanization ratio for total labor in 2000, which was
estimated at (38.9%), has not been achieved.
Qualifying and training the Omani people received special attention and support in the
plan as tangible steps have been taken to expand the technical education and vocational
training. This has led to increased enrolment in technical and vocational training institution.
However, despite this step, the enrolment rate in technical education and Vocational Framing
relative to the total enrolment in higher education is still low and did not exceeded (20.1%) in
2000. In addition, the qualification and training processes in the plan had faced some
difficulties. The most apparent problems involved the obstacles that faced the
implementation of the General National Vocational Qualifications (GNVQ). To deal with
this, the adoption of improved technical education in the technical and industrial colleges was
proposed in the form of a High National Diploma (HND).
20
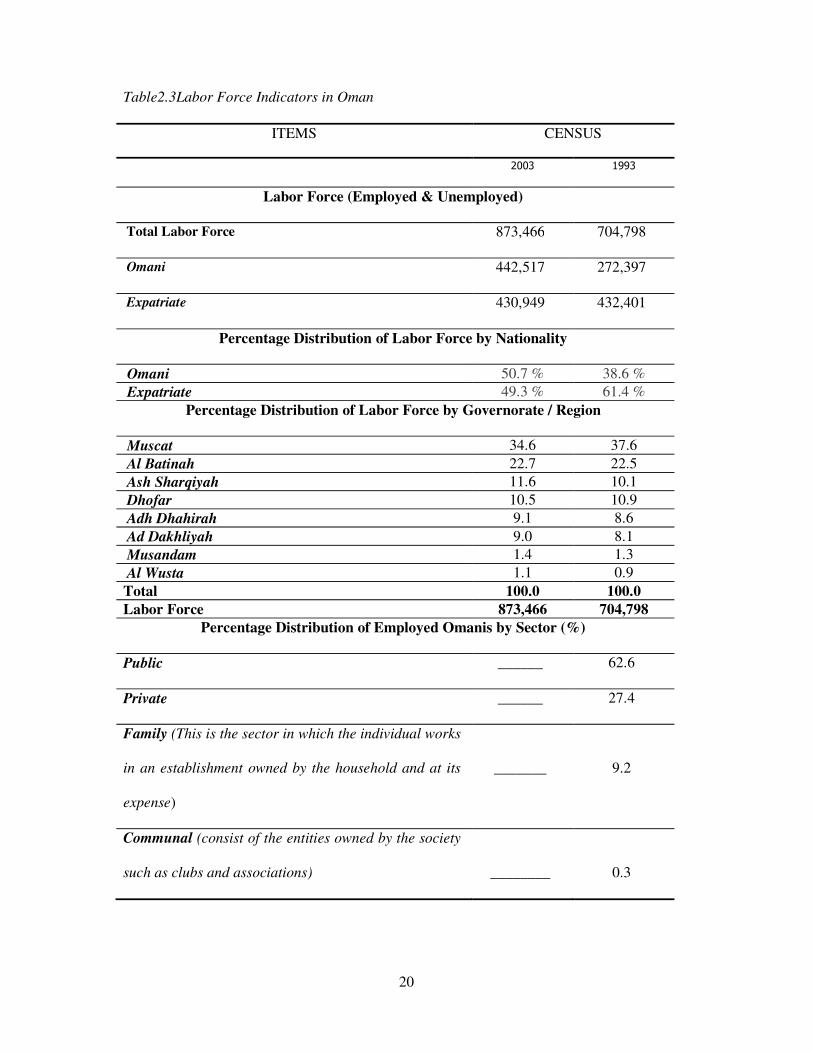
Table2.3Labor Force Indicators in Oman
ITEMS CENSUS
2003 1993
Labor Force (Employed & Unemployed)
Total Labor Force 873,466 704,798
Omani 442,517 272,397
Expatriate 430,949 432,401
Percentage Distribution of Labor Force by Nationality
Omani 50.7 % 38.6 %
Expatriate 49.3 % 61.4 %
Percentage Distribution of Labor Force by Governorate / Region
Muscat 34.6 37.6
Al Batinah 22.7 22.5
Ash Sharqiyah 11.6 10.1
Dhofar 10.5 10.9
Adh Dhahirah 9.1 8.6
Ad Dakhliyah 9.0 8.1
Musandam 1.4 1.3
Al Wusta 1.1 0.9
Total 100.0 100.0
Labor Force 873,466 704,798
Percentage Distribution of Employed Omanis by Sector (%)
Public ______ 62.6
Private ______ 27.4
Family (This is the sector in which the individual works
in an establishment owned by the household and at its
expense)
_______
9.2
Communal (consist of the entities owned by the society
such as clubs and associations)
________
0.3
21
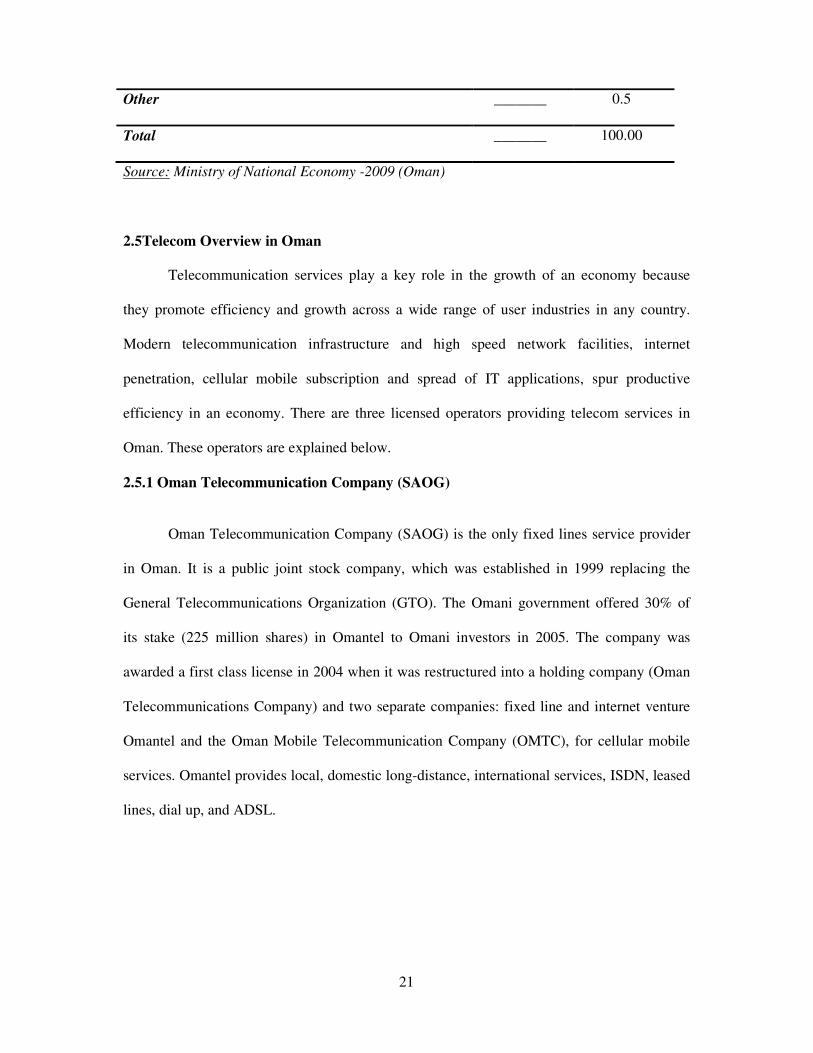
Other _______ 0.5
Total _______ 100.00
Source: Ministry of National Economy -2009 (Oman)
2.5Telecom Overview in Oman
Telecommunication services play a key role in the growth of an economy because
they promote efficiency and growth across a wide range of user industries in any country.
Modern telecommunication infrastructure and high speed network facilities, internet
penetration, cellular mobile subscription and spread of IT applications, spur productive
efficiency in an economy. There are three licensed operators providing telecom services in
Oman. These operators are explained below.
2.5.1 Oman Telecommunication Company (SAOG)
Oman Telecommunication Company (SAOG) is the only fixed lines service provider
in Oman. It is a public joint stock company, which was established in 1999 replacing the
General Telecommunications Organization (GTO). The Omani government offered 30% of
its stake (225 million shares) in Omantel to Omani investors in 2005. The company was
awarded a first class license in 2004 when it was restructured into a holding company (Oman
Telecommunications Company) and two separate companies: fixed line and internet venture
Omantel and the Oman Mobile Telecommunication Company (OMTC), for cellular mobile
services. Omantel provides local, domestic long-distance, international services, ISDN, leased
lines, dial up, and ADSL.
22
2.5.2 Oman Mobile
Oman Mobile Telecommunications Company (OMTC) was the first mobile operator
in Oman. It was awarded a first class telecom license and installed a GPRS platform across
the network with over 1.483 million subscribers and 95% population coverage till December
2007. The company provides a range of services on the GSM system including SMS, MMS,
roaming services and internet access. Oman mobile is the leader of mobile market with a
share of 59 percent at the end of 2007.
2.5.3 Nawras
In 2004, as a part of the liberalization policy, a new license was awarded. Nawras is a
joint venture of Qtel, TDC, and local Omani partners. Nawras launched a GSM service in
March 2005. With 1.016 milliion subscribers and 94 % population coverage till December
2007, the Nawras has achieved 41% mobile market share. Through National Roaming
arrangement with Oman Mobile, Nawras services are also available over Oman Mobile
network to places where Nawras infrastructure does not reach. It provides voice and data
services through its next generation mobile broadband network using EDGE (Enhanced Data
Rates for GSM Evolution) technology.
2.5.4 Mobile Growth Trend in Oman
Mobile market in Oman has shown tremendous growth over the last three years. The
mobile market crossed 2.5 million subscribers mark in December 2007 with a penetration rate
of 95 per cent. The mobile services were introduced in 1996 in Oman and since then mobile
subscribers have been increasing.

23
The award of two mobile licenses in 2005 stimulated the competition in mobile
cellular market. The mobile subscribers’ growth trend can be divided into two periods: pre-
competition and post competition. During pre competition period (2001-2004), the average
annual growth rate was 35% and on average I 61,000 subscribers. Where added per annum,
565,000 subscribers were added to the network after the introduction of competition in the
mobile market (2005-2007) with CAGR of 46 % per annum (Figure 2.2).
Figure 2.2 Mobile Subscriber’s Growth Trend in Oman Market During (2001- 2007).
Source: Omantel / Telecommunications Regulatory Authority -2007 (Oman).
The mobile penetration in Oman has jumped from 25% to 95% in just three yeas time.
This is considered a very high rate of growth compared to the neighboring countries but the
mobile penetration rate is still lower than the other regional countries (Figure 2.3).

24
Figure 2.3Mobile Penetration Rate (Country Comparison 2006)
Source: Arab Advisors Group Pyramids Research, Operators’ Annual Report (2006)
The reasons for remarkable growth in mobile sector have been the introduction of pre-
paid services, rapid network deployment, and competitive environment. The rapid rise of
mobile cellular into an alternative platform for voice communications is also attributed to the
drop in prices for mobile services and the introduction of wide range of additional services.
The prepaid segment is more attracted by the customers as evident from its growth and the
total number of pre-paid subscribers; the pre-paid service grows faster than the post paid one.
The pre-paid subscribers increased from 1,080,113 in 2005 to 2,206,378 in December 2007
with a growth of 104% in 2 years. There were 293,622 post paid subscribers by the end of
year 2007 compared to 240,707 in year 2005 with a growth of 22% during the same period.