
Saudi Arabia: Gateway to Mideast Investment Opportunities
25
SAUDI ARABIA, THE GATEWAY TO INVESTMENT OPPORTUNITIES IN THE MIDDLE EAST OCTOBER 2013
Transcript of Saudi Arabia: Gateway to Mideast Investment Opportunities

SAUDI ARABIA,THE GATEWAY TO INVESTMENT
OPPORTUNITIES IN THE MIDDLE EAST
OCTOBER 2013
CONTENTS
Saudi Arabia – Key indicators.
Saudi Arabia underlying strengths.
Investment in Saudi Arabia.
Foreign trade of Saudi Arabia.
Saudi estimated Budget - 2013.
Reforms to Enhance Saudi Economy
2
3
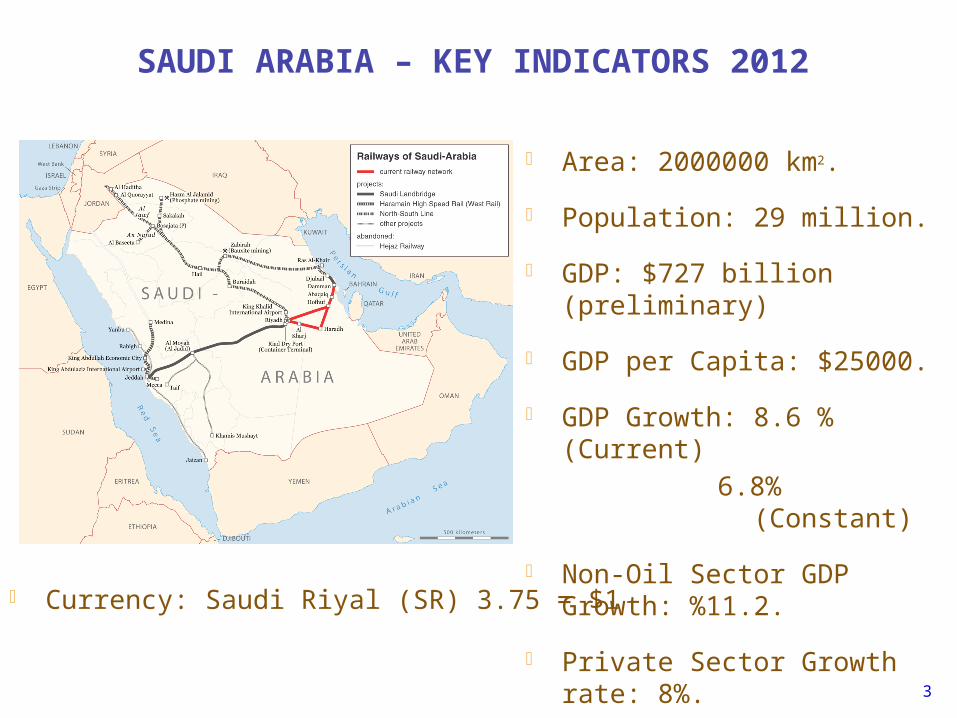
SAUDI ARABIA – KEY INDICATORS 2012
Area: 2000000 km2.
Population: 29 million.
GDP: $727 billion (preliminary)
GDP per Capita: $25000.
GDP Growth: 8.6 % (Current)
6.8% (Constant)
Non-Oil Sector GDP Growth: %11.2.
Private Sector Growth rate: 8%. Exports:$396 billion .Imports:$128
billion.
Currency: Saudi Riyal (SR) 3.75 = $1
SAUDI ARABIA -UNDERLYING STRENGTHS
4
Strong GDP growth.
Significant budget surplus.
Price level stability.
Owns 25% of world’s Oil reserve.
Fourth Largest Natural Gas reserve.
The largest economy in the Arab World, and among the top 20 Economies in the world (G20).
The Largest producer of Petrochemicals in the Arab World.
Open economy, a member of WTO.

5
SAUDI ARABIA -UNDERLYING STRENGTHS Cont….
Political stability, member of many Arab & International Organizations.
An attractive environment for investment, among the top 20 recipients of Foreign Direct Investment in the world.
Investment incentives, Income tax free, financial facilities.
Ranked 12th in ease of doing businesses in 2012.
10th largest worldwide Exporter (excluding intra-EU (27) trade).
21st largest worldwide Importer (excluding intra-EU (27) trade).
• 6
saudi Arabia
U.A.E Qatar Kuwait Oman Bahrain0
100
200
300
400
500
600
700
800
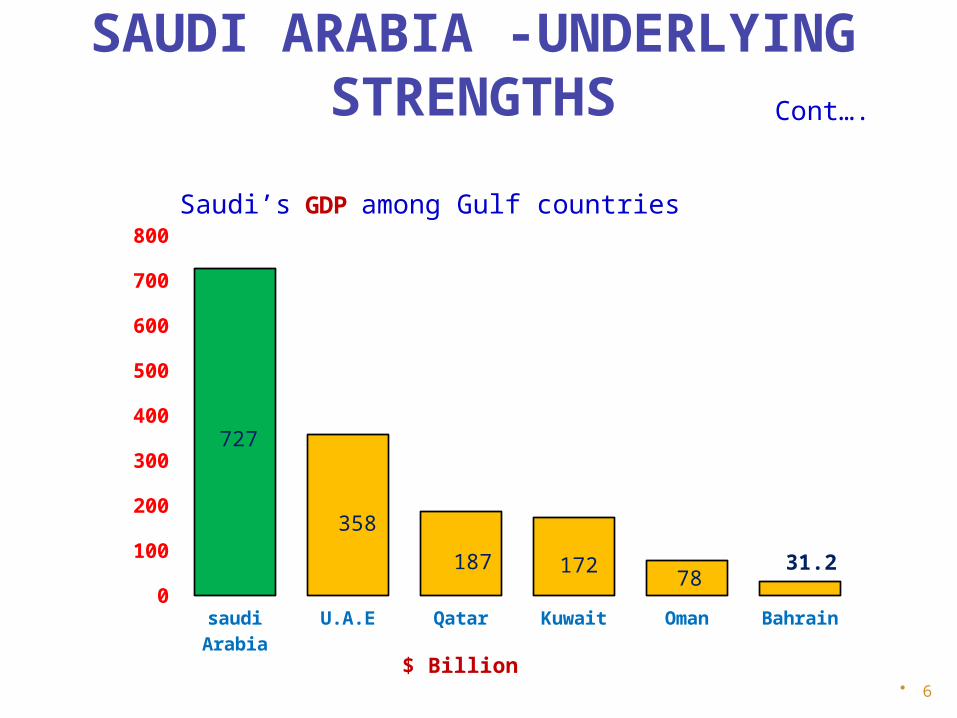
727
358
187 17278
31.2
$ Billion
Saudi’s GDP among Gulf countries
SAUDI ARABIA -UNDERLYING STRENGTHS Cont….

SAUDI ARABIA -UNDERLYING STRENGTHS
7
Cont….
Saudi Arabia’s Ranking in Global Competitiveness 2013/2014Indicator Ranking Among Arabic
CountriesRanking Among World Countries
Ease of doing businesses 1 12
Global competitiveness 3 20
Institutions 4 20Infrastructure 4 31Macroeconomic environment 2 4Property rights 5 27Health and primary education 5 53Higher education and training 3 48Goods market efficiency 4 27Financial market development 3 27Technological readiness 3 41Market Size 1 23Business sophistication 3 28Innovation 3 30
8
INVESTMENTS IN SAUDI ARABIA
• 9
Saudi Arabia
Egypt Emirates Qatar Oman Kuwait0
2
4
6
8
10
12
14
16
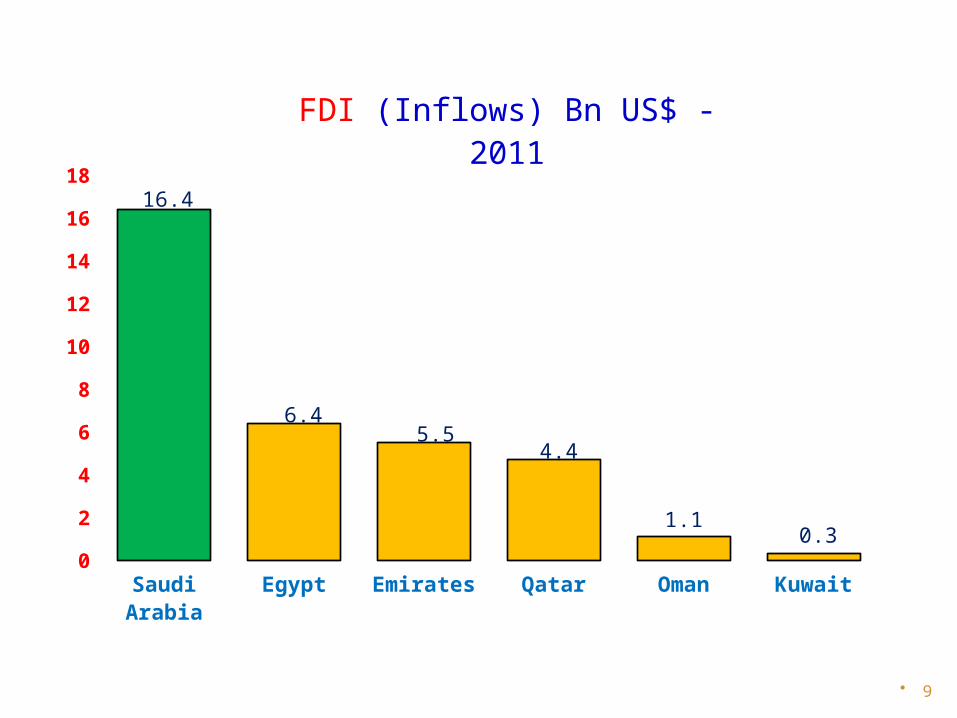
1816.4
6.45.5
4.4
1.10.3
FDI (Inflows) Bn US$ -2011
10
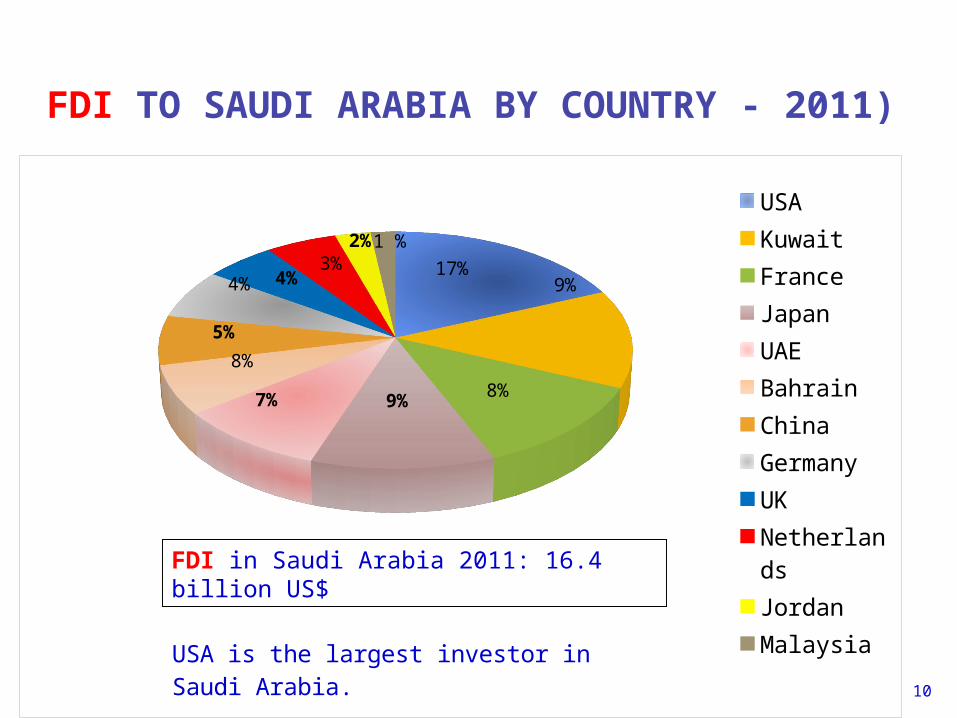
FDI TO SAUDI ARABIA BY COUNTRY - 2011)
17%9%
8%9%
8%5%
4% 4%3%
2%1 %
USA
Kuwait
France
Japan
UAE
Bahrain
China
Germany
UK
Nether-lands
Jordan
MalaysiaUSA is the largest investor in Saudi Arabia.
7%
FDI in Saudi Arabia 2011: 16.4 billion US$
11
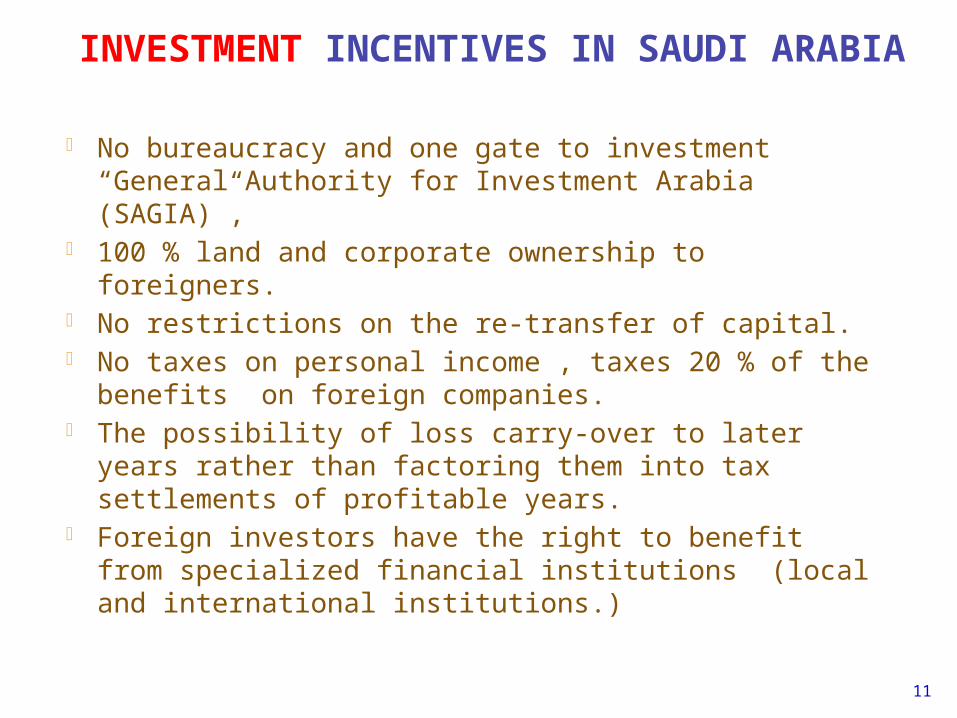
No bureaucracy and one gate to investment “General Authority for Investment Arabia (SAGIA)”,
100 % land and corporate ownership to foreigners. No restrictions on the re-transfer of capital. No taxes on personal income , taxes 20 % of the benefits on
foreign companies. The possibility of loss carry-over to later years rather than
factoring them into tax settlements of profitable years. Foreign investors have the right to benefit from specialized
financial institutions (local and international institutions.)
INVESTMENT INCENTIVES IN SAUDI ARABIA
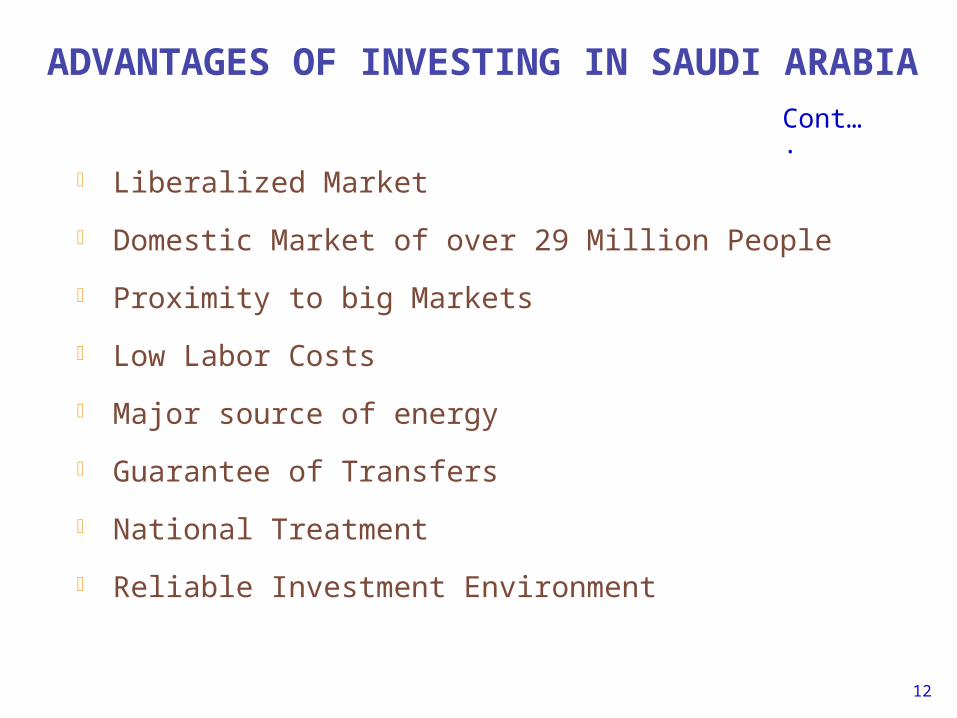
ADVANTAGES OF INVESTING IN SAUDI ARABIA
12
Liberalized Market
Domestic Market of over 29 Million People
Proximity to big Markets
Low Labor Costs
Major source of energy
Guarantee of Transfers
National Treatment
Reliable Investment Environment
Cont….
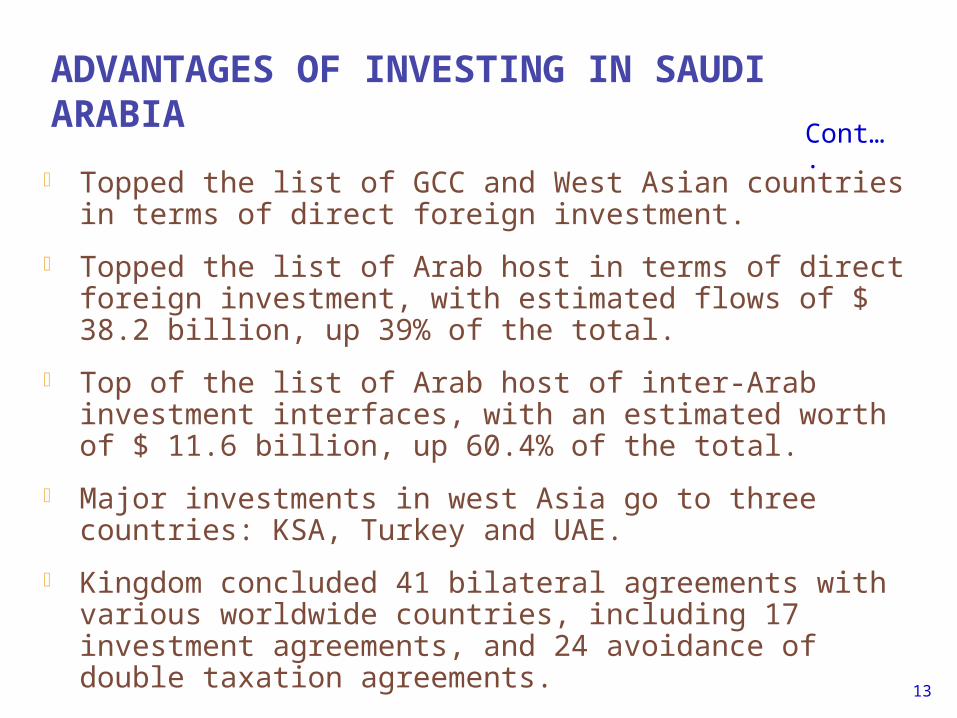
ADVANTAGES OF INVESTING IN SAUDI ARABIA
13
Cont….
Topped the list of GCC and West Asian countries in terms of direct foreign investment.
Topped the list of Arab host in terms of direct foreign investment, with estimated flows of $ 38.2 billion, up 39% of the total.
Top of the list of Arab host of inter-Arab investment interfaces, with an estimated worth of $ 11.6 billion, up 60.4% of the total.
Major investments in west Asia go to three countries: KSA, Turkey and UAE.
Kingdom concluded 41 bilateral agreements with various worldwide countries, including 17 investment agreements, and 24 avoidance of double taxation agreements.
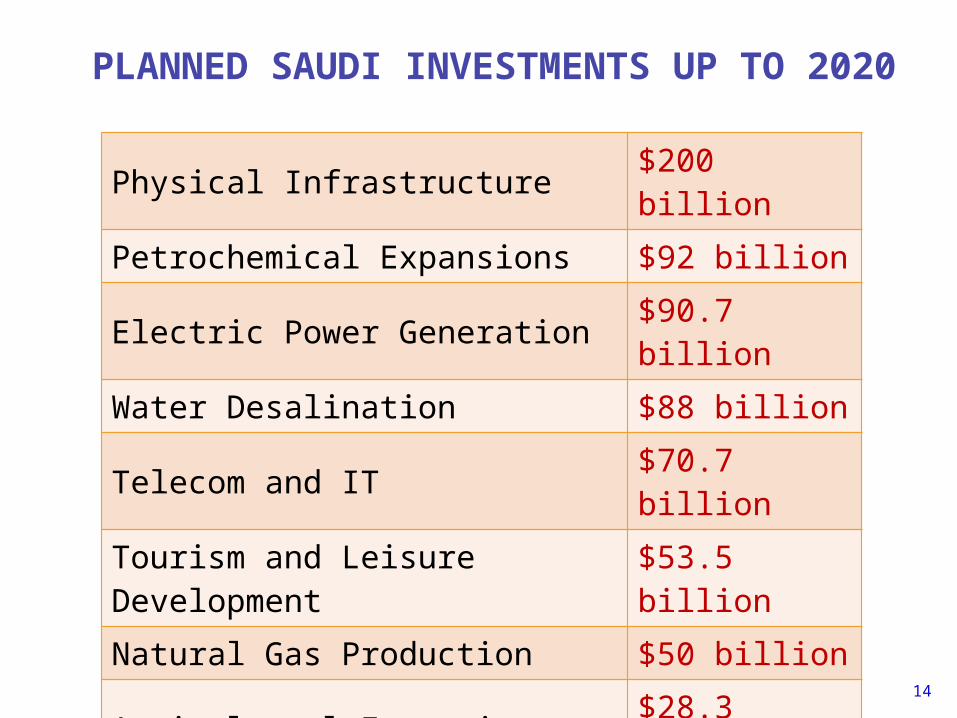
Physical Infrastructure $200 billion
Petrochemical Expansions $92 billion
Electric Power Generation $90.7 billion
Water Desalination $88 billion
Telecom and IT $70.7 billion
Tourism and Leisure Development
$53.5 billion
Natural Gas Production $50 billion
Agricultural Expansion $28.3 billion
Educational and Training $10.7 billion
Riyadh metro line $22 billion
PLANNED SAUDI INVESTMENTS UP TO 2020
14
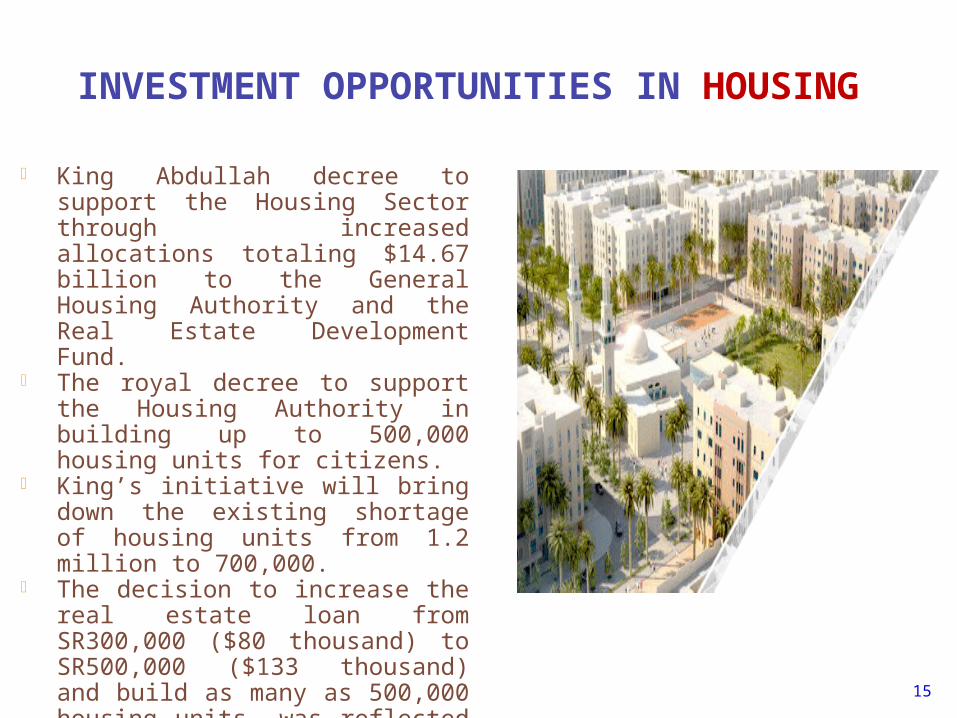
INVESTMENT OPPORTUNITIES IN HOUSING
15
King Abdullah decree to support the Housing Sector through increased allocations totaling $14.67 billion to the General Housing Authority and the Real Estate Development Fund.
The royal decree to support the Housing Authority in building up to 500,000 housing units for citizens.
King’s initiative will bring down the existing shortage of housing units from 1.2 million to 700,000.
The decision to increase the real estate loan from SR300,000 ($80 thousand) to SR500,000 ($133 thousand) and build as many as 500,000 housing units, was reflected in the market with a boost in demand for plots of land for building houses and increased activities in the real estate market.

INVESTMENT OPPORTUNITIES IN RIYADH METRO LINE
16
Riyadh’s population is projected to grow up to 8.5 million people in the next decade (from six million currently.)
Saudi Arabia awarded more than $22 billion in contracts to develop a metro line in Riyadh..
It is the biggest infrastructure project to be undertaken in the Kingdom of Saudi Arabia, and is a cornerstone of the bold future for Riyadh city.
Six lines will serve the capital city’s center, government facilities, universities, commercial areas, the airport and the financial district.
Construction of the 175-kilometer (109-mile), and 85-station network will be the longest metro line in the world under construction, and will create 15,000 jobs over five years.
17
FOREIGN TRADE OF SAUDI ARABIA
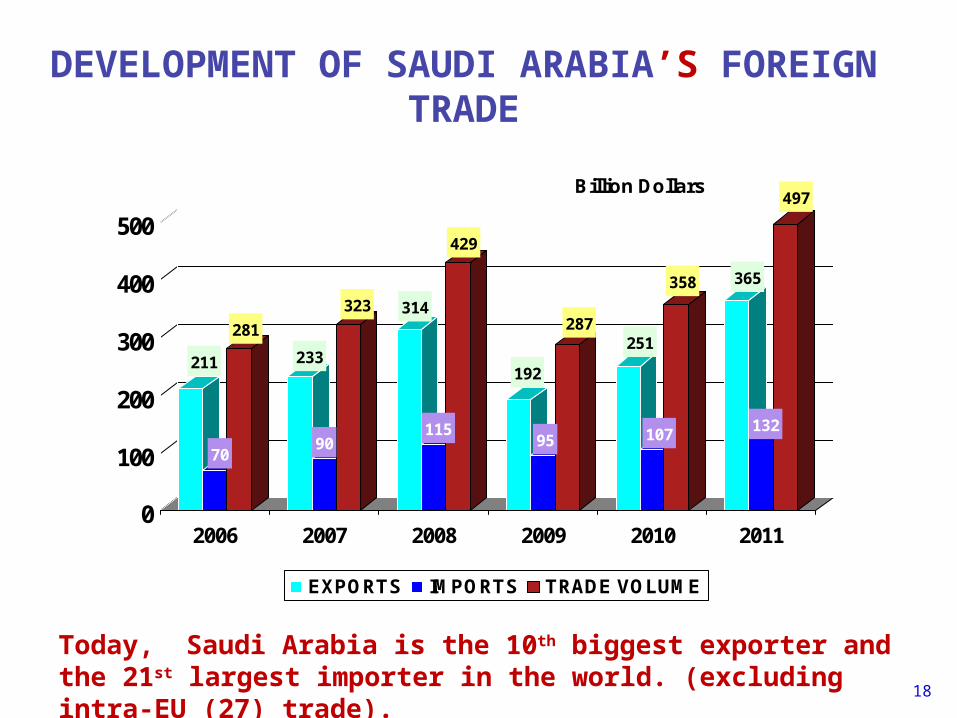
DEVELOPMENT OF SAUDI ARABIA’S FOREIGN TRADE
18
211
70
281
233
90
323 314
115
429
192
95
287251
107
358 365
132
497
0
100
200
300
400
500
2006 2007 2008 2009 2010 2011
Billion Dollars
EXPORTS IMPORTS TRADE VOLUME
Today, Saudi Arabia is the 10th biggest exporter and the 21st largest importer in the world. (excluding intra-EU (27) trade).
19
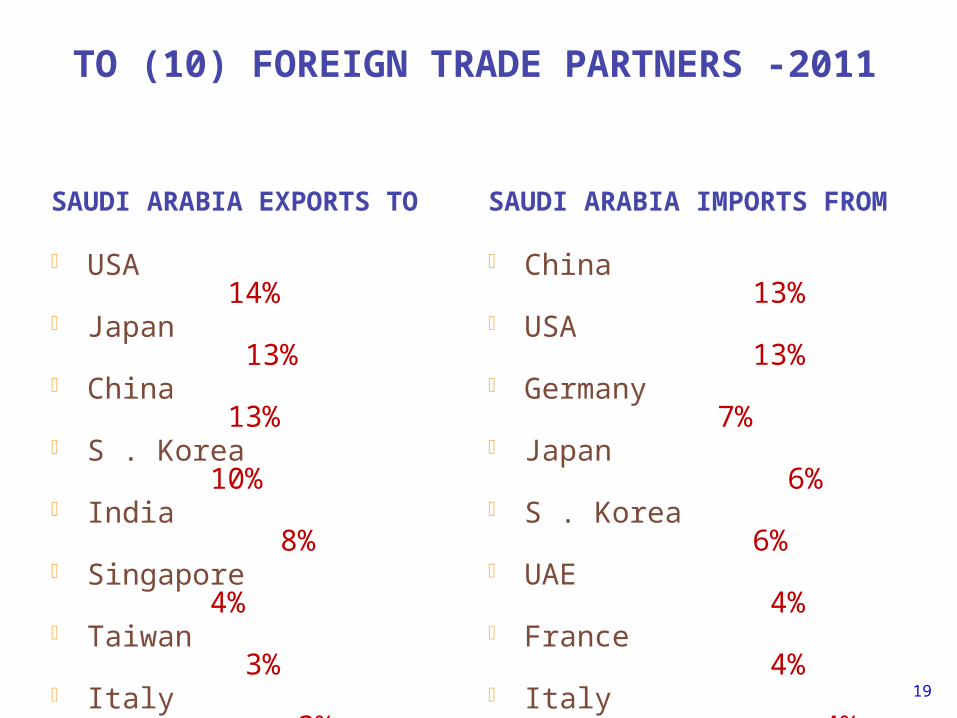
TO (10) FOREIGN TRADE PARTNERS -2011
SAUDI ARABIA EXPORTS TO
USA 14% Japan 13% China 13% S . Korea 10% India 8% Singapore 4% Taiwan 3% Italy 3% UAE 3% Bahrain 3%
SAUDI ARABIA IMPORTS FROM
China 13% USA 13% Germany 7% Japan 6% S . Korea 6% UAE 4% France 4% Italy 4% India 3% UK 3%
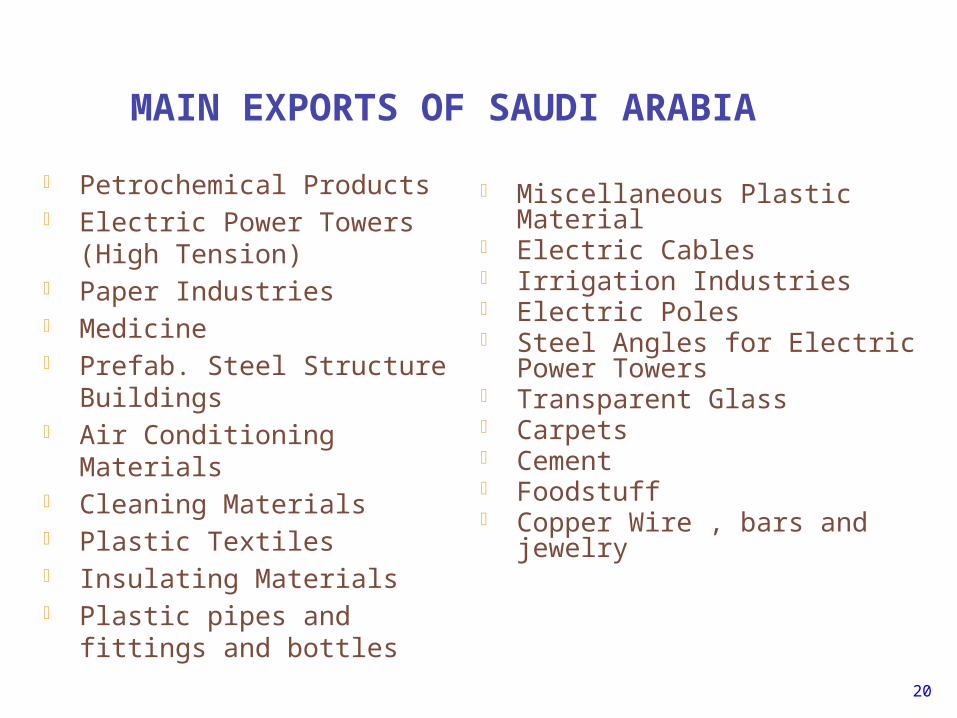
MAIN EXPORTS OF SAUDI ARABIA
20
Petrochemical Products Electric Power Towers (High
Tension) Paper Industries Medicine Prefab. Steel Structure Buildings Air Conditioning Materials Cleaning Materials Plastic Textiles Insulating Materials Plastic pipes and fittings and
bottles
Miscellaneous Plastic Material Electric Cables Irrigation Industries Electric Poles Steel Angles for Electric Power
Towers Transparent Glass Carpets Cement Foodstuff Copper Wire , bars and jewelry
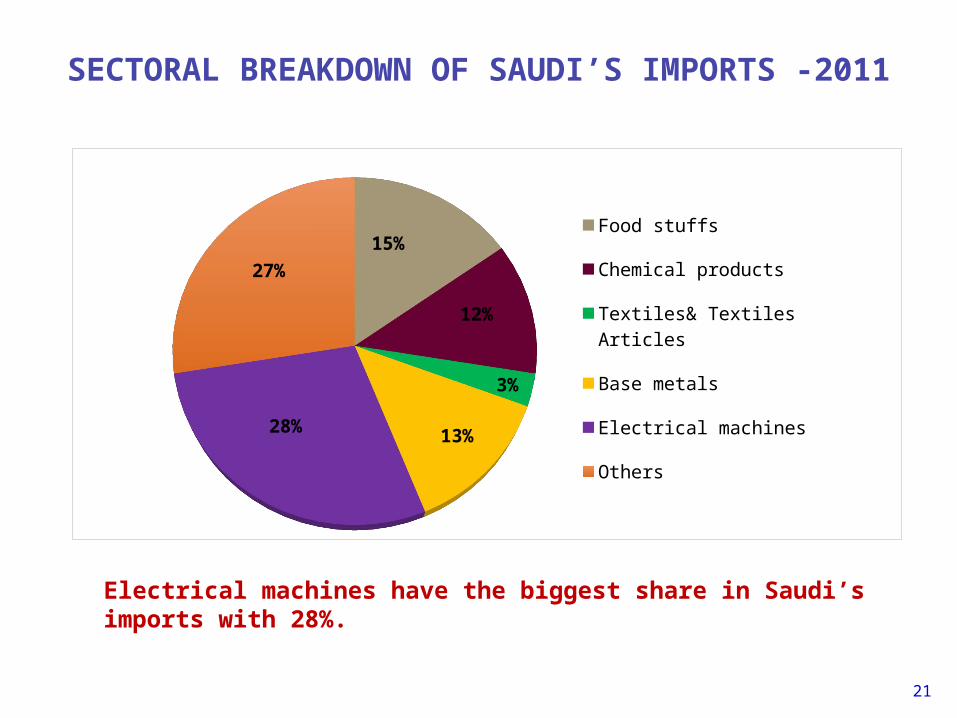
SECTORAL BREAKDOWN OF SAUDI’S IMPORTS -2011
21
15%
12%
3%
13%28%
27%
Food stuffs
Chemical products
Textiles& Textiles Articles
Base metals
Electrical machines
Others
Electrical machines have the biggest share in Saudi’s imports with 28%.
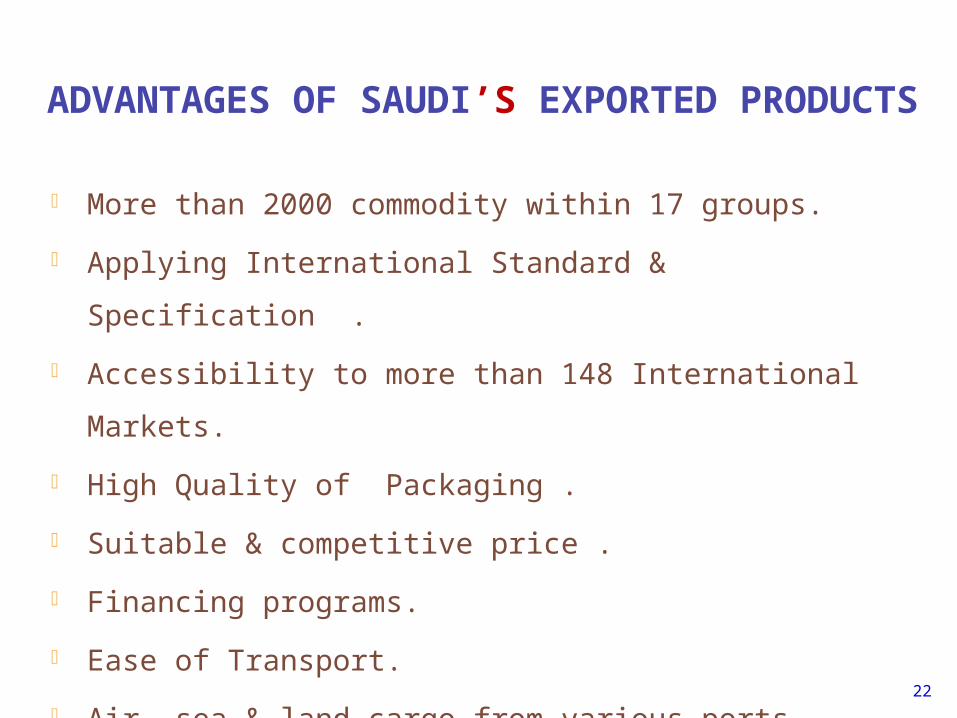
ADVANTAGES OF SAUDI’S EXPORTED PRODUCTS
22
More than 2000 commodity within 17 groups.
Applying International Standard & Specification .
Accessibility to more than 148 International Markets.
High Quality of Packaging .
Suitable & competitive price .
Financing programs.
Ease of Transport.
Air, sea & land cargo from various ports.

SAUDI ESTIMATED BUDGET - 2013
Expenditure $218.7 Billion
8%
14%
25%
12%
8%
Sectoral breakdown of expenditure) %(
Transport & Communications
Water, Agriculture, Industry
Education
Health & Social Development
Development Funds
23
Revenues $221 Billion
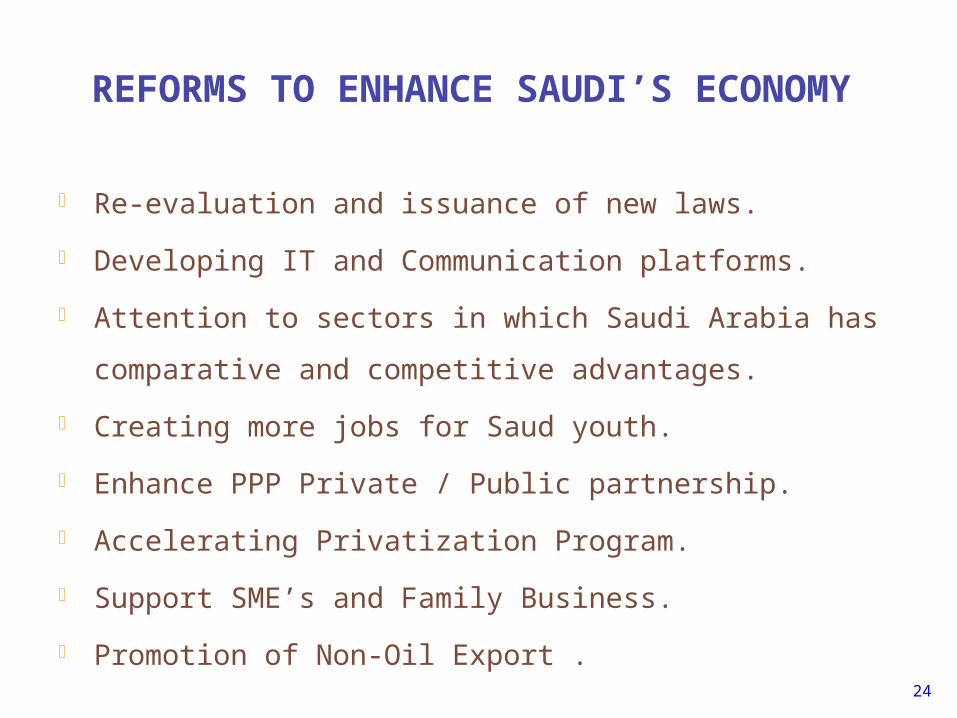
REFORMS TO ENHANCE SAUDI’S ECONOMY
24
Re-evaluation and issuance of new laws.
Developing IT and Communication platforms.
Attention to sectors in which Saudi Arabia has comparative and
competitive advantages.
Creating more jobs for Saud youth.
Enhance PPP Private / Public partnership.
Accelerating Privatization Program.
Support SME’s and Family Business.
Promotion of Non-Oil Export .