fuel cells in materials handling on-site hydrogen production
Safety and Operations of Hydrogen Fuel Infrastructure in Northern Climates �– A Collaborative Complex Systems Approach Final Project Report U.S. Department of Transportation, Office of the Secretary, Grant No. DTOS59-06-G-00048 Submitted by Dryver R. Huston �– Principal Investigator School of Engineering University of Vermont Burlington, VT 05405 With contributions from Zhejiang University, Hangzhou, China Tsinghua University, Beijing, China eVermont, Burlington, VT October 7, 2010
2
1. OVERVIEW This project examined the safety and operation of hydrogen (H2) fueling system infrastructure in northern climates. A multidisciplinary team lead by the University of Vermont (UVM), combined with investigators from Zhejiang and Tsinghua Universities in China and the nonprofit Burlington, VT-based energy research firm eVermont addressed this multifaceted problem. As testbeds for some of the research Zhejiang University operated the first H2 refueling station in China, and eVermont operated one of the only a handful of H2 refueling stations in northern climates in North America. The research foci included the development of technologies associated with the safety of hydrogen fuel storage, especially high-pressure H2 fuel storage; development of tools for fighting invisible-flame H2 fires; an examination of the organizational structure of safety codes surrounding the use of H2; and an investigation of the performance of a wind-to-wheels H2 production, storage and fueling facility in Burlington, VT. Specific outcomes include: 1. Development of self-sealing tank technologies that may have applicability to H2 fuel storage and other applications; 2. Development of methods of assessing the integrity of fiber-reinforced polymer (FRP) composite high-pressure on-vehicle H2 storage vessels using vibration modal analysis; 3. Testing of fatigue life from multiple refill cycles on FRP fuel tanks; 4. Developing physical models and testing the performance of fast-fueling techniques for vehicles at refueling stations; 5. Invention of passive-optic imaging systems for fighting invisible-flame H2 fires; 6. Examination of organization and complexity of H2 safety codes using network modeling techniques; and 7. Measured the performance of a wind-to-wheels H2 production, storage and fueling facility. The importance of H2 fuel safety practices was emphasized by an explosion at the Rochester, NY airport H2 ground vehicle fueling station on August 26, 2010. Outcomes from this research include 9 refereed journal publications (approved and pending), 15 conference publications and presentations, 2 patent disclosures and one trade journal publication. Attached as appendices are final project reports from the Zhejiang and Tsinghua University, and eVermont subonctracts. 2. BACKGROUND
2.1 H2 Infrastructure Due to renewable and pollution-free properties, H2 is favored by many as a fuel of the future [Ogden 1999]. Realizing such an outcome requires building the appropriate infrastructure, i.e. fuel generation, transportation, storage, efficient consumption, regulatory structure, and marketplace. H2 as a fuel has a long but specialized history in space exploration [Domashenko 2002]. H2 is also widely used in many chemical manufacturing processes. To date, the consumer use of H2 as a fuel has been limited to a handful of fueling stations worldwide. Most of these fueling stations use H2 that is created offsite by a methane decomposition technique (that releases CO2) and is trucked onsite with multitank trailers. Figure 1 shows a typical multitank refueling tank trailer at an H2 exposition in Albany, NY.

3
Figure 1 Multitank H2 refueling tank trailer at an exposition in Albany, NY, July 2007
2.2 H2 Storage Technology Fuel storage is a key component of H2 infrastructure. Since H2 is the lightest of gases, its storage requires special considerations. There are three primary competing H2 storage technologies: 1. High pressure (HP H2), 2. Liquified H2 (LH2), and 3. Metal hydride (MH). Of these three, HP H2 appears to be emerging as the leading contender for adoption. Multiple reasons support this trend, including thermodynamic efficiency advantages with respect to LH2, evaporation problems and the need for superinsulated tanks with LH2, and the non-availability of a viable recyclable MH solution. For these reasons HP H2, was chosen as the primary focus of the study of H2 storage systems in this project.
2.3 ZJU STRONG Tanks On-board H2 storage vessels with maximum operating pressures of 35 to 70MPa are required in order to meet the U. S. Department of Energy (DOE) targets about gravimetric density of H2 for driving ranges of approximately 200km-600km. The maximum operating pressure of stationary storage vessel is usually greater than that of on-board vessels so as to provide quick refueling times. Stationary H2 storage vessels that can store H2 65MPa are available. 100MPa H2 refueling stations may come into reality in the future as the compressor technology 100MPa H2 is

4
maturing. These pressures are at the upper end of the capabilities of modern pressure vessel technology. Both on-board HP H2 storage vessels and stationary HP H2 storage vessels have been developed and are the subject of active ongoing research in Zhejiang University (ZJU) in China. Much of this research has centered on the development of high-performance fail safe pressure vessels with a fail-safe multilayer construction. These vessels use the Steel Tape Reinforced Overlay Nonbursting Gas (STRONG) containment design. The design of the vessels combines explosion prevention with small leak containment functionality. At operating pressures, due to the low stress across the inner shell, the excellent performance of the inner shell and steel ribbon materials, as well as the crack arresting effect of frictional resistance of the steel ribbon layer, the failure mode of a STRONG storage vessel is �‘leakage only without explosion.�’ The design is virtually free of brittle failure hazards. It is currently possible with facilities in China to manufacture full multi-layer HP vessels with diameters up to 2500mm and lengths up to 25m. A competing vehicular onboard storage tank technology is the fiber composite wrapped tank. These tanks were originally developed for aerospace applications where weight reduction is a primary consideration. However, composite tanks may not be able to compete with the STRONG tanks in terms of storage capacity and graceful failure modes. Of particular note is the handling of leaks. The steel tape wrap in a STRONG tank provides channels between the steel seams to collect and manage minor leaks. The composite tanks lack such capability. Sensors sense the leakage and sound an alarm. Measures can be taken to avoid further leakage. The ZJU HP H2 research team is presently operating the first H2 refueling station in China, Figure 2 to Figure 4.
Figure 2 Refueling station in Hangzhou, China

5
Figure 3 STRONG HP H2 storage tank Figure 4 STRONG HP H2 tank
undergoing 52.5 MPa pressure test
2.4 H2 Safety HP H2 being a concentrated-energy fuel has safety issues associated with its use. The differences between H2 and conventional fuels make it necessary to perform a detailed risk identification, assessment and mitigation for the transport and storage of H2 at high pressure [Birgisson 2004]. The unique properties of H2, high pressure and rigorous weather in northern areas mandates the need for addressing the safety issues associated with the transport and storage of H2 fuels in northern climates. To date there has not been a comprehensive study of these issues related to H2. Northern climate infrastructure engineering techniques are well-established for other energy industries [Meng 1999]. The use of H2 for transportation has until recently been limited to high-performance applications. As such it has been associated with some spectacular accidents, most notably the Hindenberg Zeppelin accident and Space Shuttle Challenger accident. Historically, the Hindenberg accident was attributed to some sort of spontaneous combustion of H2, possibly caused by a spark. However, a careful analysis by Bain and Van Vorst at NASA led to the conclusion that the laquer used to coat the outer skin was highly flammable and was likely the primary source of the fire [Bain 1999]. Regardless of the cause, the damage to the reputation of H2 as a safe gas was severe. The Challenger exploded a few minutes after liftoff on January 28, 1986. Richard Feynman, quickly zeroed in on a possible root cause as being cold-weather induced failure of O-ring seals between segments on the solid rocker boosters, which ignited the liquid H2-oxygen tanks. Feynman recognized that the situation was considerably more complex and undertook a more in depth investigation. The close physical proximity of the solid rocket boosters to the liquid H2-oxygen fuel tank caused a tight coupling of the two subsystems and resulted in an unexpected and catastrophic change of events. In his report appended to the Rogers Commission report Feynman stated [Feynman 1986].
�“If a reasonable launch schedule is to be maintained, engineering often cannot be done fast enough to keep up with the expectations of originally conservative certification criteria designed to guarantee a very safe vehicle. In these situations, subtly, and often with apparently logical arguments, the criteria are altered so that flights may still be certified in time. They therefore fly in a relatively unsafe condition, with a chance of

6
failure of the order of a percent (it is difficult to be more accurate)�…For a successful technology, reality must take precedence over public relations, for nature cannot be fooled.�” (italics added)
An example of dangers of operating fueling systems in cold weather was encountered as part of a UVM study for the Vermont State Fire Marshall�’s Office [Huston 1995]. Twice in the period of one week during a cold winter snap pipes leading out of liquified natural gas tanks broke and caused very dangerous leaks. An examination of the failures concluded that several factors contributed to the accidents, but that a primary factor was that the mild steel used in the piping was unsuited for use below �–20°F. Since the use of this steel was endemic in Vermont, it was an issue of concern.
2.5 Rochester Airport Hydrogen Explosion �– August 26, 2010 The Rochester, NY airport has an H2 fueling station for a fleet of service vehicles at the airport. H2 is supplied to the fueling station from tank trucks. During a refueling operation H2 exploded at least twice, injured two people and ignited a fire that closed the Rochester Airport for several hours. The explosion consumed only a fraction of the available H2 fuel on site and was significantly smaller than if more of the fuel was involved. Numerous news reports have appeared on this event. At the moment, no official reports from controlling safety agencies have been published. Below is text from an article published on the internet by the ABC News affiliate WHAM and appearing at the site http://www.13wham.com/mostpopular/story/Security-Camera-Footage-of-Hydrogen-Explosion/qc5OE6mKtEaZ7WahHcbTHQ.cspx
A new look at the explosions of two hydrogen tanks on the airport grounds Thursday reaffirms what officials have been saying; that this incident could have been much worse. Two people were injured in the blasts that occurred at 12:48 p.m. A 61 year-old man involved in actually swapping out the two hydrogen fuel tanks suffered second degree burns and remains in satisfactory condition at Strong Memorial Hospital. Another woman working at the Burger King drive-thru window across the street from the blast was treated for minor ear pain. The new video released by county officials is captured by a nearby airport security camera. It shows in the upper lefthand portion of the frame a puff of white smoke that represents the first explosion according to officials. Then, a second blast rattles the camera and nearby structures; flames and smoke are suddenly visibile in the rear of the tanks. Work crews nearby can be seen quickly moving their vehicles away from the area. Friday morning, Praxair crews were on the scene surveying their tanks and beginning the process of emptying those tanks of the remaining hydrogen gas. Upwards of 2,500 pounds of compressed gas remained in the tanks and it was slowly released through a small hose. "The product will rapidly dissipate into the air," said Sam DeRosa, Monroe County's Fire Coordinator, of the operation. It's lighter than air, it's about 0.7 as far as density is concerned, which means it will readily dissipate into the air." New York State Department of Transportation officials required the tanks be emptied of all gas before they are moved onto new tractor trailers and transported on the open road. A Praxair spokeswoman said the company will take the tanks to its Niagara Falls facility

7
where the forensic investigation into what happened will continue. A preliminary investigation conducted by Monroe County Fire Officials and Praxair is giving a lot of credit to a one-inch thick steel plate that separates the hydrogen tanks from the manifolds nearby. That plate and other safety features on the trailers prevented potentially much more serious, and subsequent, explosions according to fire officials. "That steel plate helped immensely, as did the construction and the design of those trailers," DeRosa said. "They're actually made to do that. They're made to withstand fire damage and after a very detailed and thorough inspection throughout the night by the county fire investigators and the Praxair folks, there is no damage, no compromise to any of those cylinders." Praxair safely emptied the tanks of the compressed hydrogen by Friday afternoon and large cranes arrive at Monroe County's fueling station to move each of the tanks onto new flatbed trailers for transport. Fire and Haz-Mat crews remained nearby during the process incase any additional hazard presented itself.
Video of the explosion from an airport security camera appears at http://www.youtube.com/watch?v=wlyCPbmO7Ts&feature=player_embedded
2.6 HP H2 Risks and Failure Modes Some of the risks associated with HP H2 are: 1. Leak and combustion hazards, 2. Embrittlement of materials, 3. Overpressure explosion due to over-temperature and overfilling, 4. Fatigue failure, 5. H2 concentration control �– The STRONG tanks are especially amenable to handling this problem.
2.7 Safety Engineering and Management - Linear and Complex Systems Approaches
Many system failures and accidents often involve complex interactions between unexpected forces, material responses, mechanical couplings, societal pressures and human errors [Petroski 1992]. In the past century, primarily due to safety initiatives in the aviation, nuclear power, chemical and more recently medical industries, two schools of thought have emerged as how to analyze and explain failures or accidents. One is a set of linear or reductionist methods, often known as Root Cause Analysis (RCA). RCA attempts to find underlying root causes of accidents or failures, that if corrected will prevent failures. Contrasting with RCA is a set of nonlinear holistic approaches. Perhaps the most well known nonlinear description is Normal Accident Theory (NAT). The premise of NAT is that many situations are complex. The coupling of unexpected interactions inevitably leads to accidents [Perrow 1999] [Sagan 2002]. Doerner indicates that once a situation attains a sufficient level of complexity (this can be as few as a couple of interacting systems) humans lose the ability to predict and correct for these interactions [Doerner 1999]. Traditional methods of reducing complex interactions to simpler and more manageable levels is through hueristics and rigid hierarchical control. Initially NAT was a descriptive taxonomy of accidents or failures. NAT has evolved to a more general approach that also encompasses accidents or failures that are too complex to be decomposed effectively by RCA. Modern complex systems theory offers the possibility of quantifying and rationally directing these efforts.
8
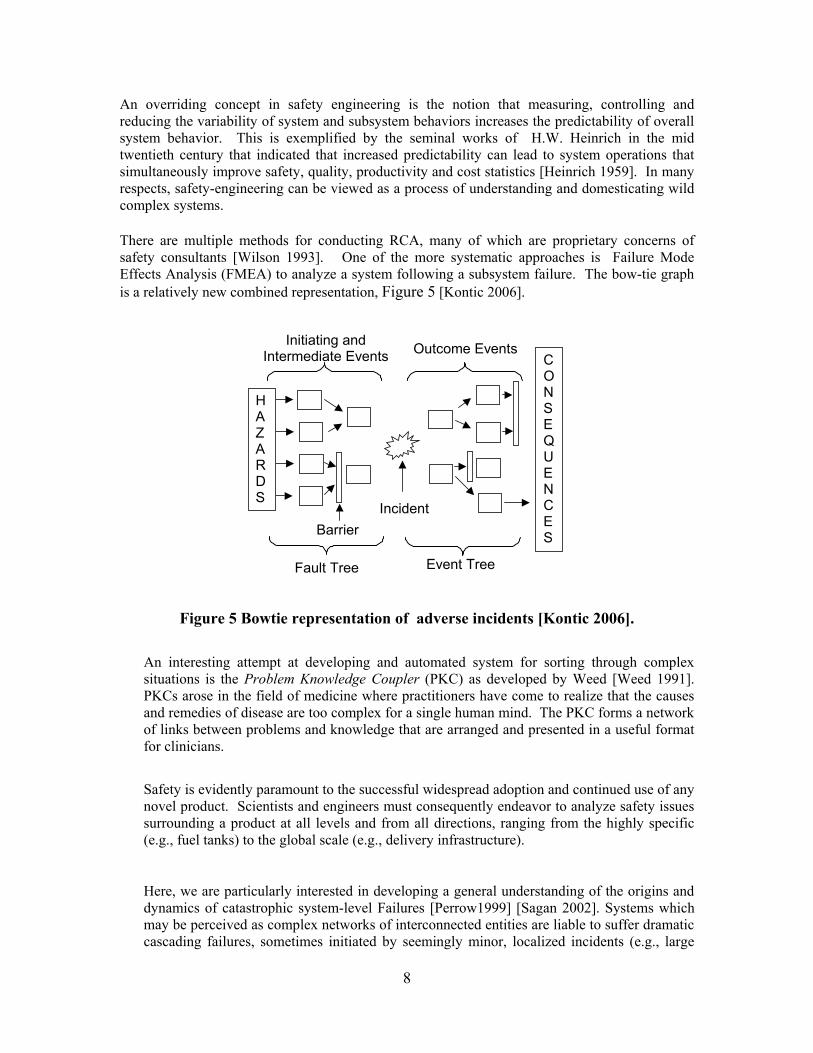
An overriding concept in safety engineering is the notion that measuring, controlling and reducing the variability of system and subsystem behaviors increases the predictability of overall system behavior. This is exemplified by the seminal works of H.W. Heinrich in the mid twentieth century that indicated that increased predictability can lead to system operations that simultaneously improve safety, quality, productivity and cost statistics [Heinrich 1959]. In many respects, safety-engineering can be viewed as a process of understanding and domesticating wild complex systems. There are multiple methods for conducting RCA, many of which are proprietary concerns of safety consultants [Wilson 1993]. One of the more systematic approaches is Failure Mode Effects Analysis (FMEA) to analyze a system following a subsystem failure. The bow-tie graph is a relatively new combined representation, Figure 5 [Kontic 2006].
H A Z A R D S
CONSEQUENCES
Initiating and Intermediate Events Outcome Events
Incident Barrier
Fault Tree Event Tree
Figure 5 Bowtie representation of adverse incidents [Kontic 2006].
An interesting attempt at developing and automated system for sorting through complex situations is the Problem Knowledge Coupler (PKC) as developed by Weed [Weed 1991]. PKCs arose in the field of medicine where practitioners have come to realize that the causes and remedies of disease are too complex for a single human mind. The PKC forms a network of links between problems and knowledge that are arranged and presented in a useful format for clinicians.
Safety is evidently paramount to the successful widespread adoption and continued use of any novel product. Scientists and engineers must consequently endeavor to analyze safety issues surrounding a product at all levels and from all directions, ranging from the highly specific (e.g., fuel tanks) to the global scale (e.g., delivery infrastructure).
Here, we are particularly interested in developing a general understanding of the origins and dynamics of catastrophic system-level Failures [Perrow1999] [Sagan 2002]. Systems which may be perceived as complex networks of interconnected entities are liable to suffer dramatic cascading failures, sometimes initiated by seemingly minor, localized incidents (e.g., large

9
scale power blackouts). Failure spreading may take on a simple disease-like quality [Murray 2002] where interaction between entities are independent, involve a threshold response function (wherein nodes fail when a certain fraction of their neighbors have failed), or some combination of both [Dodds 2004].
While in the above we are talking of networks of real components, abstract networks associated with a product may also be important. One such abstract network of interest here is induced by a product's set of safety codes. For example, in a case study the US DOE PNNL lists 24 primary safety codes that govern the permitting of an H2 refueling station with over two hundred specific code provisions [US DOE 2004]. If safety codes are related to each other in some fashion, we can naturally construct a network of codes. The relationship between codes will vary in strength and in nature from ones of contingency, complimentarity, mutual exclusion, partial overlap, and conflict. With such a network in hand, we will be able to perform a range of network analyses to test for robustness and potential fragility, redundancy, clustering or modularity of codes, and the importance of individual codes given their place in the overall network [Carlson 1999] [Dodds 2003] [Wasserman 1994]. Having a comprehensive understanding of a product's safety codes will enable us to estimate the impact of modifying existing or introducing new safety codes, and further address questions such as whether or not all codes can be satisfied at once. Note that unless the relationships between codes are systematically encoded, which is unlikely, we must first deduce the connections by inspection. This will be a suitable task for a student.
As an indication of the potential of this technique Figure 5 shows a generic space of possible complex networks [Dodds 2003]. It is not inconceivable that the bowtie FMEA graph in Figure 6 could be placed into this framework.
Figure 6 Space of a set of generic network classes [Dodds 2003]

10
2.8 H2 Generation in Northern Climates There are several competing techniques for the generation of H2. Two of the leading candidates, electrolysis and photoelectrocatalysis, both rely on water as the working medium. As a result both methods could be susceptible to the deleterious effects of freezing in northern climates. 3. STAFFING A multidisciplinary team of researchers from the University of Vermont, Zhejiang University and Tsinghua University in China, and eVermont participated in this project. Prof. Dryver Huston of UVM School of Engineering was the Principal Investigator. He was assisted by Asst. Prof. Peter Dodds of the UVM Dept. of Math and Stat. Prof. Dodds assisted with some of the early complex network models of H2 safety and operation. The China team was directed by Prof. Jinyang Zheng of the College of Materials Science and Chemical Engineering, Zhejiang University. He was assisted by Dr. Xu Ping and Dr. Chen Rui, also of the College of Materials Science and Chemical Engineering, Zhejiang University Associate Professor Dr. Xu Ping specializes in applied mechanics. Dr. Chen Rui specializes in the safety of high pressure H2 storage. Additional research expertise was provided by Professors Qin Quan, Chen Yong, and Sun Xiaoyan. Dr. Qin Quan is a Professor of Civil Engineering at Tsinghua University. He is an expert in solid mechanics and structural performance. Dr. Chen Yong and Dr. Sun Xiaoyan are Associate Professors in the Department of Civil Engineering, Zhejiang University. Dr. Chen Yong specializes structural dynamics and damage detection. Dr. Sun Xiaoyan is an expert in structural health monitoring and the reliability of concrete bridges in northern environments. The key personnel from eVermont were Dr. Greg Wight and Harold Garabedian. 4. RESEARCH RESULTS
4.1 Self-sealing Vessels (UVM as Lead Research Group) The storage of H2 as fuel onboard vehicles or in fueling stations poses hazards when leaks occur. One method of mitigating the hazards associated with leaking H2 is to implement self-sealing techniques into the high pressure H2 storage tanks. To this end, a series of technology developments were undertaken to demonstrate the potential viability of self-sealing fuel tanks. The self-sealing tests have included the construction and use of a low-pressure (100 psi) testbed for examining and demonstrating some self-sealing concepts. Figure 7 shows a plug extracted from a hole that was autonomically sealed by a commercially-available compound. Efforts were also undertaken to model the behavior using Molecular Dynamics simulations with Large-scale Atomic/Molecular Massively Parallel Simulator

11
(LAMMPS) open sourced code. This includes determining polymer and polymer interaction characteristics for entanglement, coagulation, and subsequent plugging of the orifice. The result of this study was the demonstration of some of the rudimentary action of polymer plug sealing at the molecular scale.
Figure 7 Plug formed autonomically to seal leak at low pressure
Passive leak plugging techniques are limited to the activation provided by the local material flowing into and constricting the hole. Active coordinated methods open up the possibility for more aggressive and effective leak sealing techniques. Coordinated �‘smart; healing requires sensors, controlled decision-making and activated self-sealing. Acoustic emission sensing was the primary damage detection method investigated. Acoustic emissions are small high-frequency elastic waves that propagate through solids due to events that include cracking, damage and leaks. Since the elastic waves can propagate through extended distances without significant attenuation, acoustic emission sensing is a potential choice for onboard damage detection and location. Figure 8 shows a low pressure pneumatic leak testbed with acoustic emission sensors mounted. Figure 9 is a picture of typical acoustic emission data from a self-sealing experiment on the low-pressure pneumatic leak testbed.

12
Figure 8 Low-pressure pneumatic leak testbed with acoustic emission sensors
Figure 9 Acoustic emission data from self-sealing experiment on low-pressure pneumatic testbed
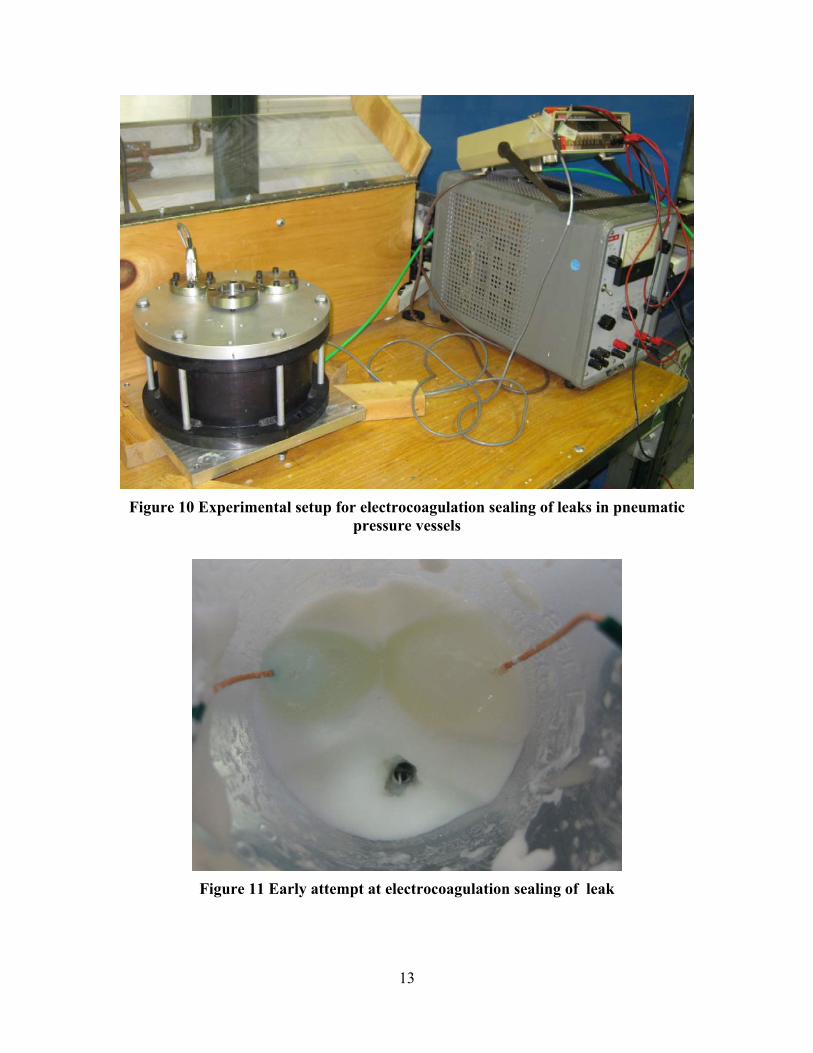
One of the smart sealing approaches is to combine acoustic emission sensing with controlled electrocoagulation of the sealing agent in a leak. Acoustic emission techniques detect the leak and then measure the action of the electrocoagulation sealing, Figure 10 and Figure 11.
13
Figure 10 Experimental setup for electrocoagulation sealing of leaks in pneumatic
pressure vessels
Figure 11 Early attempt at electrocoagulation sealing of leak
14
Activity continued in this area with the development of control technologies, with the potential for self-aware systems behaviors. One paper was submitted for peer review in a technical journal. Another paper on this topic was published as part of conference proceedings. High pressure hydrogen test equipment was recently acquired from the UVM Chemistry Department. It remains to be determined, but it is possible that this equipment will enable further testing in this line of research.
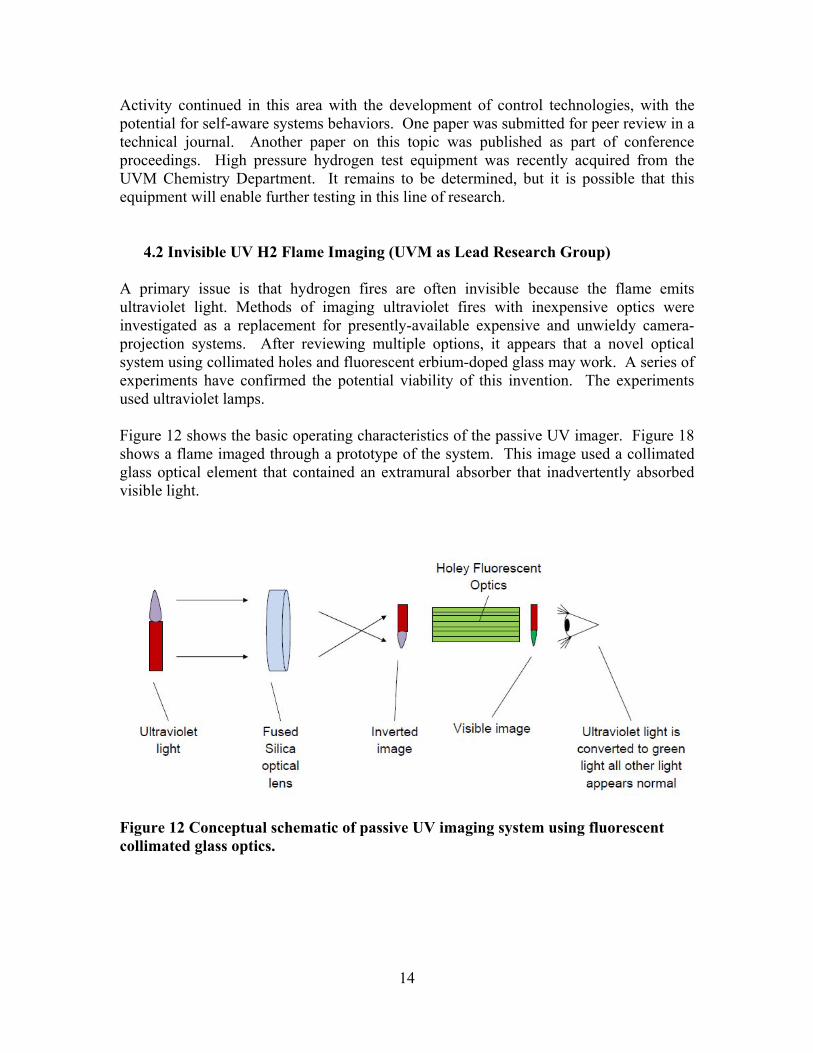
4.2 Invisible UV H2 Flame Imaging (UVM as Lead Research Group) A primary issue is that hydrogen fires are often invisible because the flame emits ultraviolet light. Methods of imaging ultraviolet fires with inexpensive optics were investigated as a replacement for presently-available expensive and unwieldy camera-projection systems. After reviewing multiple options, it appears that a novel optical system using collimated holes and fluorescent erbium-doped glass may work. A series of experiments have confirmed the potential viability of this invention. The experiments used ultraviolet lamps.
Figure 12 shows the basic operating characteristics of the passive UV imager. Figure 18 shows a flame imaged through a prototype of the system. This image used a collimated glass optical element that contained an extramural absorber that inadvertently absorbed visible light.
Figure 12 Conceptual schematic of passive UV imaging system using fluorescent collimated glass optics.
15
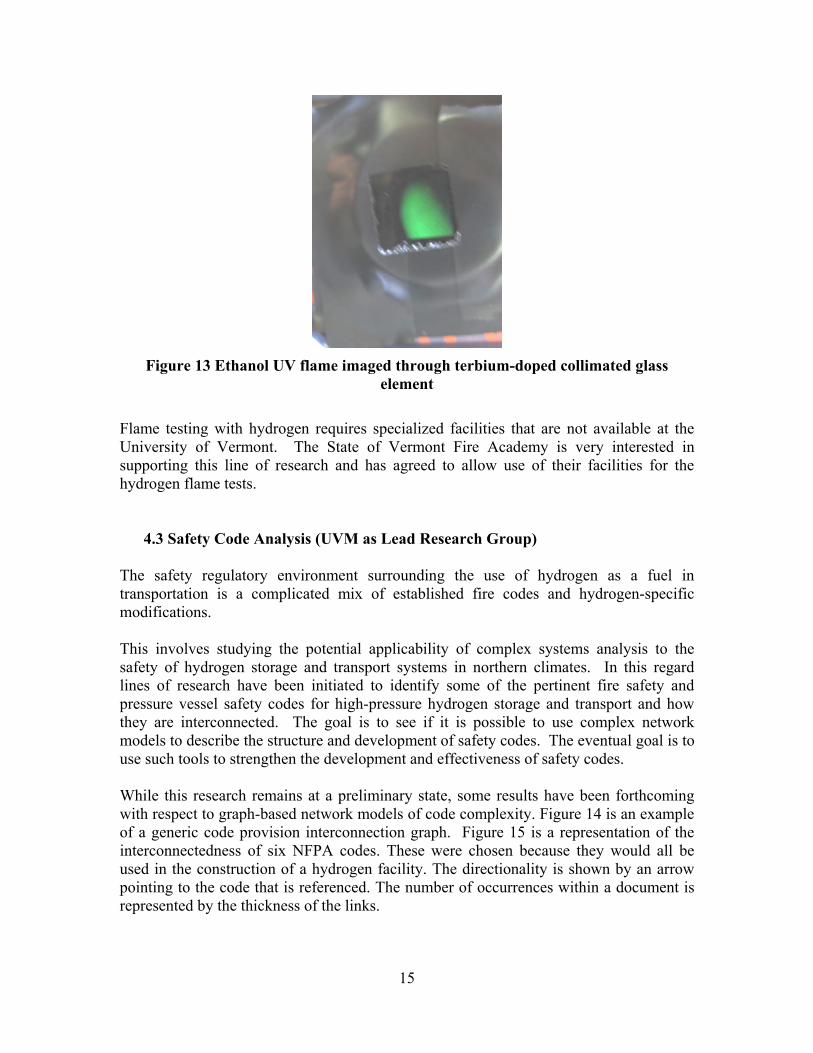
Figure 13 Ethanol UV flame imaged through terbium-doped collimated glass
element Flame testing with hydrogen requires specialized facilities that are not available at the University of Vermont. The State of Vermont Fire Academy is very interested in supporting this line of research and has agreed to allow use of their facilities for the hydrogen flame tests.
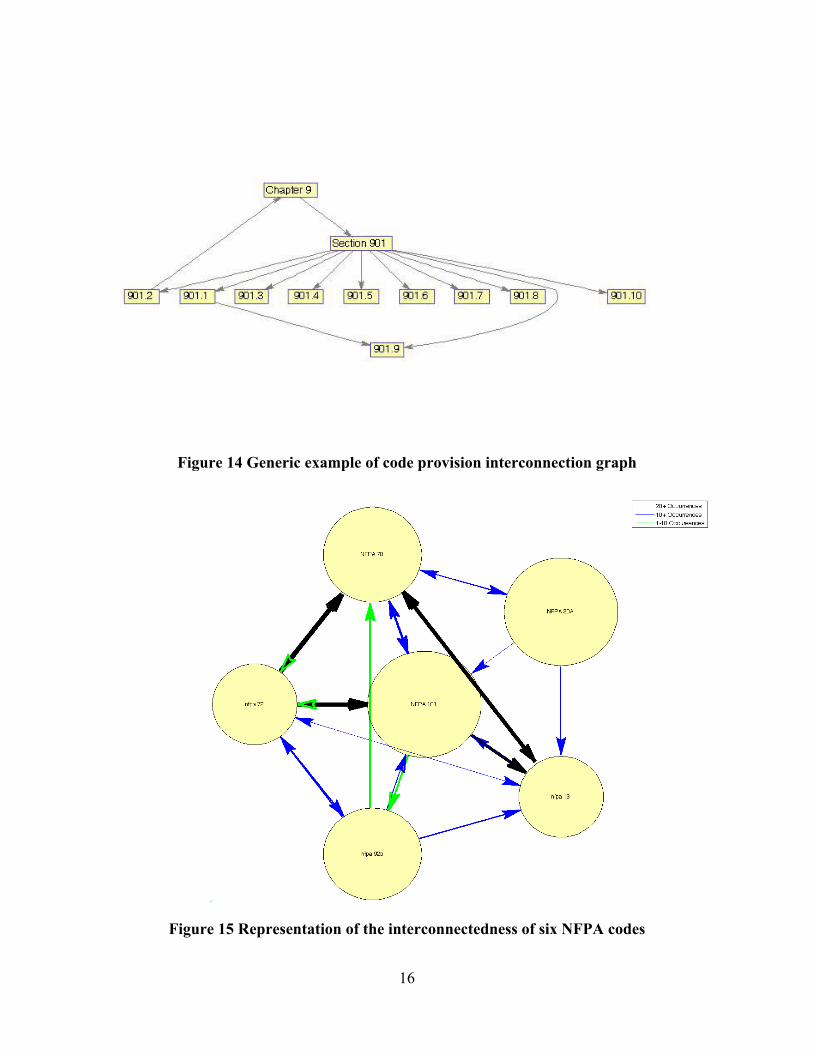
4.3 Safety Code Analysis (UVM as Lead Research Group) The safety regulatory environment surrounding the use of hydrogen as a fuel in transportation is a complicated mix of established fire codes and hydrogen-specific modifications. This involves studying the potential applicability of complex systems analysis to the safety of hydrogen storage and transport systems in northern climates. In this regard lines of research have been initiated to identify some of the pertinent fire safety and pressure vessel safety codes for high-pressure hydrogen storage and transport and how they are interconnected. The goal is to see if it is possible to use complex network models to describe the structure and development of safety codes. The eventual goal is to use such tools to strengthen the development and effectiveness of safety codes. While this research remains at a preliminary state, some results have been forthcoming with respect to graph-based network models of code complexity. Figure 14 is an example of a generic code provision interconnection graph. Figure 15 is a representation of the interconnectedness of six NFPA codes. These were chosen because they would all be used in the construction of a hydrogen facility. The directionality is shown by an arrow pointing to the code that is referenced. The number of occurrences within a document is represented by the thickness of the links.
16
Figure 14 Generic example of code provision interconnection graph
Figure 15 Representation of the interconnectedness of six NFPA codes

17
In Figure 16 the small dots are NFPA Codes. There are approximately 350 NFPA Codes. The links show the interconnectedness of each code. The links are created when one code references another. This does not represent the number of times a specific code is referenced, all links are weighted equally. Figure 17 is a zoomed in image of the NFPA Code connectedness graph.
Figure 16 Interconnectedness of the approximately 350 NFPA Codes
18
Figure 17 Zoomed image of the interconnectedness of the NFPA Codes.
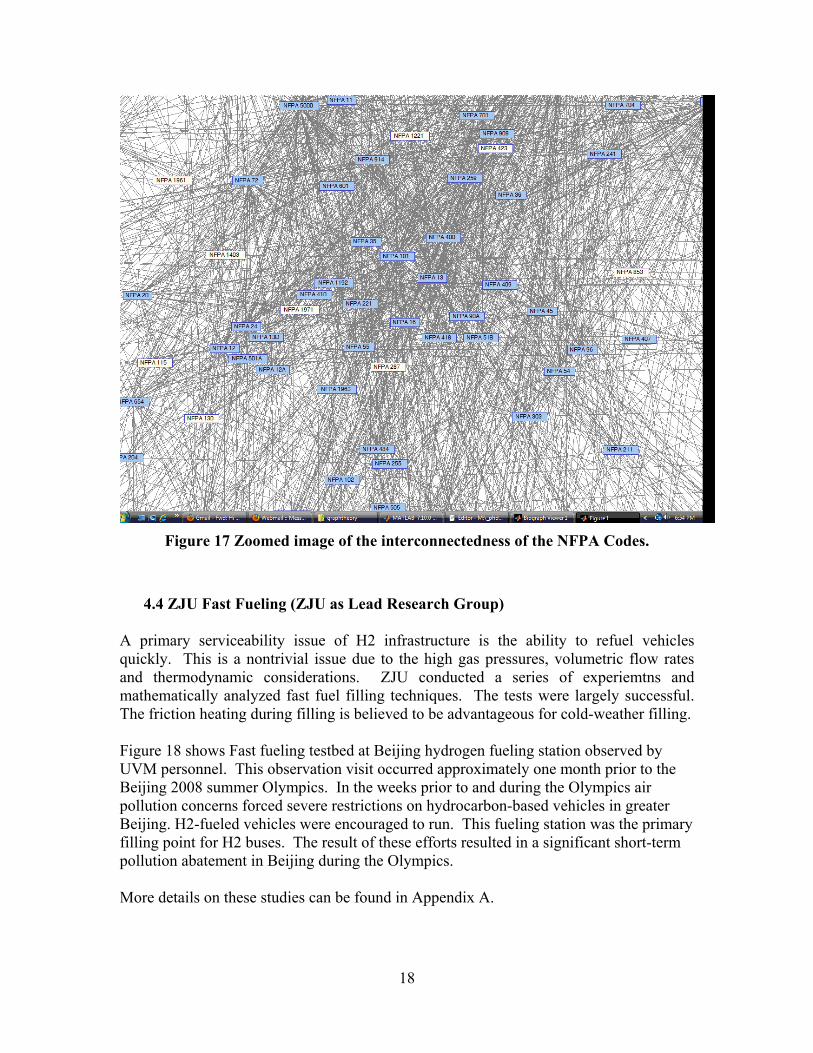
4.4 ZJU Fast Fueling (ZJU as Lead Research Group) A primary serviceability issue of H2 infrastructure is the ability to refuel vehicles quickly. This is a nontrivial issue due to the high gas pressures, volumetric flow rates and thermodynamic considerations. ZJU conducted a series of experiemtns and mathematically analyzed fast fuel filling techniques. The tests were largely successful. The friction heating during filling is believed to be advantageous for cold-weather filling. Figure 18 shows Fast fueling testbed at Beijing hydrogen fueling station observed by UVM personnel. This observation visit occurred approximately one month prior to the Beijing 2008 summer Olympics. In the weeks prior to and during the Olympics air pollution concerns forced severe restrictions on hydrocarbon-based vehicles in greater Beijing. H2-fueled vehicles were encouraged to run. This fueling station was the primary filling point for H2 buses. The result of these efforts resulted in a significant short-term pollution abatement in Beijing during the Olympics. More details on these studies can be found in Appendix A.
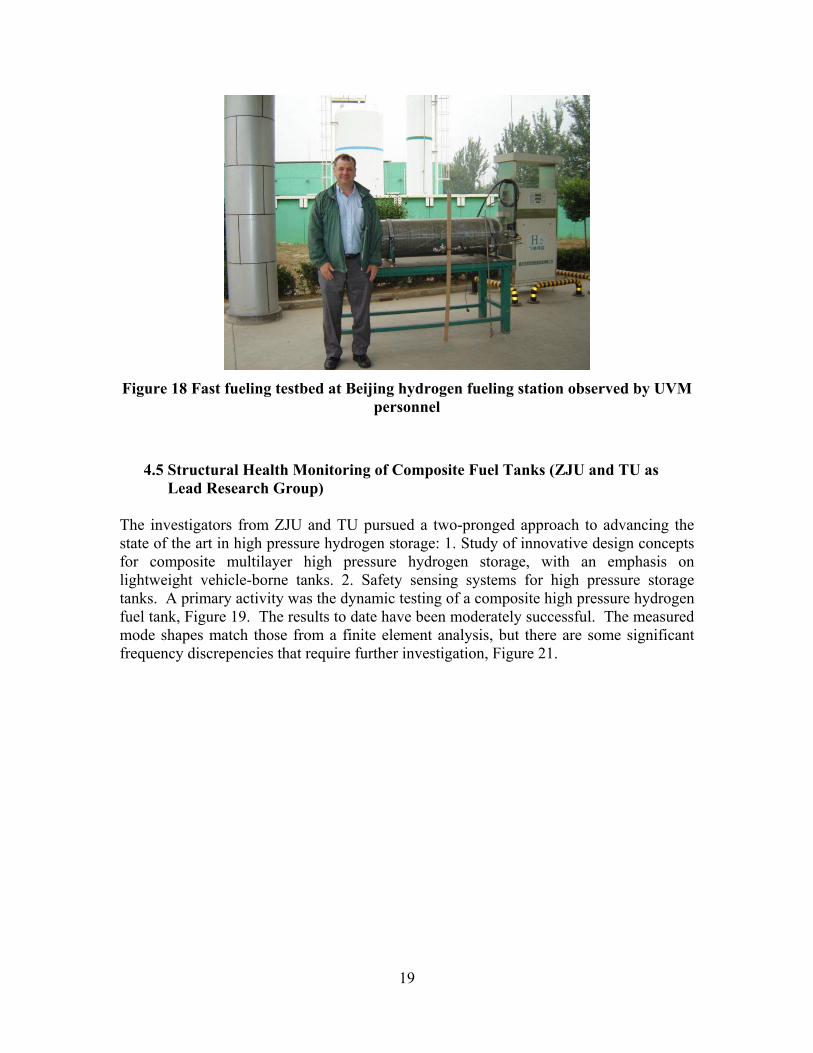
19
Figure 18 Fast fueling testbed at Beijing hydrogen fueling station observed by UVM
personnel
4.5 Structural Health Monitoring of Composite Fuel Tanks (ZJU and TU as
Lead Research Group)
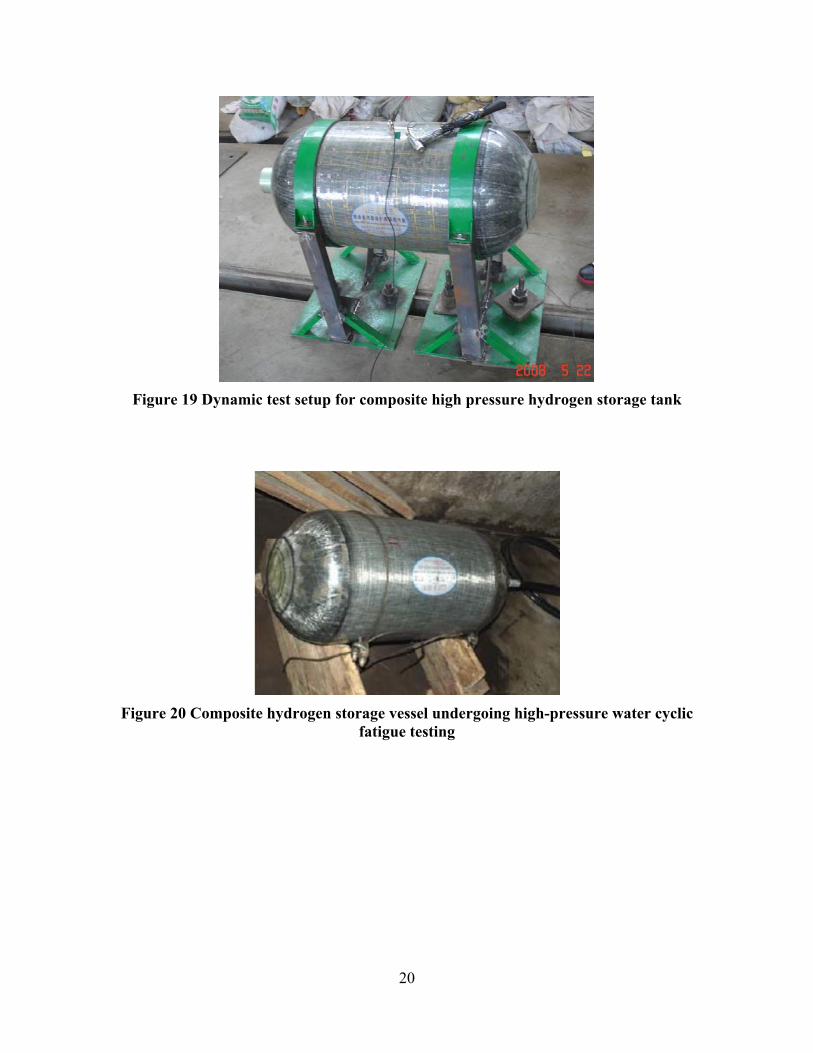
The investigators from ZJU and TU pursued a two-pronged approach to advancing the state of the art in high pressure hydrogen storage: 1. Study of innovative design concepts for composite multilayer high pressure hydrogen storage, with an emphasis on lightweight vehicle-borne tanks. 2. Safety sensing systems for high pressure storage tanks. A primary activity was the dynamic testing of a composite high pressure hydrogen fuel tank, Figure 19. The results to date have been moderately successful. The measured mode shapes match those from a finite element analysis, but there are some significant frequency discrepencies that require further investigation, Figure 21.
20
Figure 19 Dynamic test setup for composite high pressure hydrogen storage tank
Figure 20 Composite hydrogen storage vessel undergoing high-pressure water cyclic
fatigue testing

21
FE Modal Analysis Test Frequency Modal Shape Frequency Modal Shape
1 1341
2 1345
1318/1302/1330
3 1415
4 1416
945/906/907
5 1602
6 1607
1601
7 1881 122/166
Figure 21 Measured and calculated vibraton mode shapes for composite hydrogen
tank The dynamic tests included a variety of standard modal testing methods using linear analysis techniques. A conclusion of the testing was that the linear methods were somewhat sensitive to boundary conditions at the mounts and that other, possibly nonlinear, test procedures might be more suitable. Fatigue tests using high-pressure water instead of the more dangerous hydrogen are underway. These tests consist of The fatigue test plan is 15,000 cycles from 2 to 35 MPa, and possibly a design overload of 10,500 cycles with a pressure of 2 to 44 MPa. More details on these studies can be found in Appendix A.

22
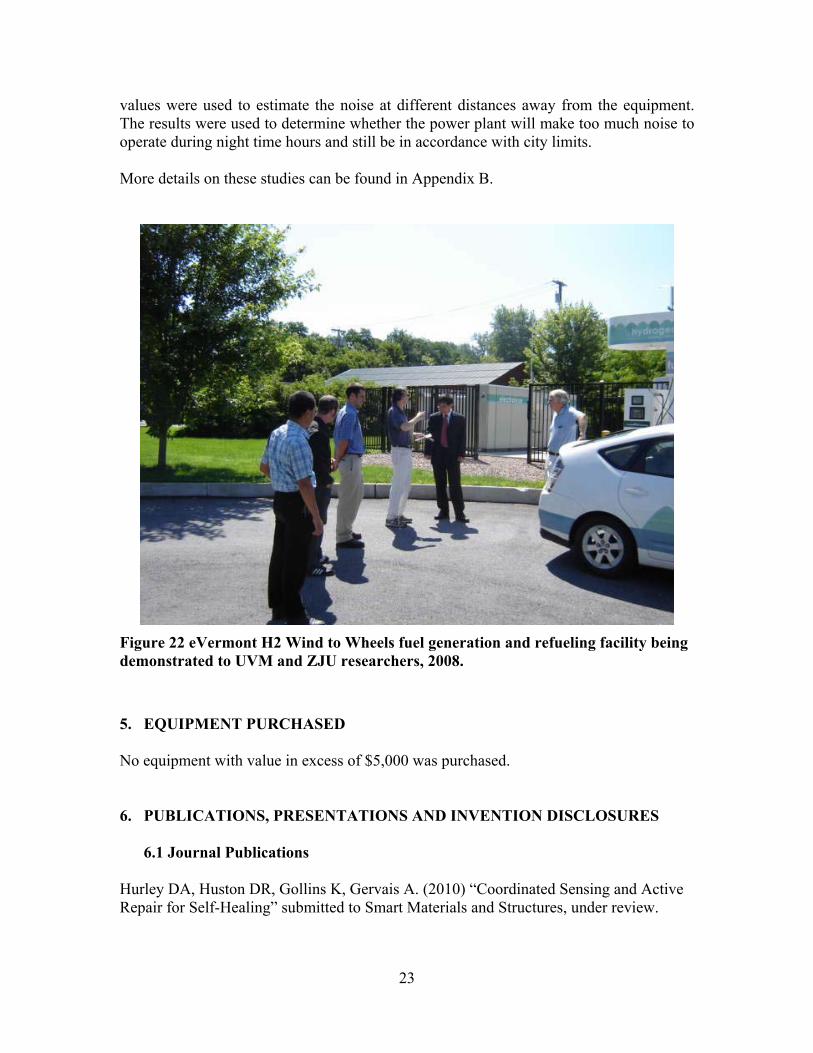
4.6 Hydrogen Fuel System Performance Evaluation (eVermont as Lead Research Group)
EVermont�’s goal is a systems analysis of the new hydrogen generation and fueling station with an eye toward documenting and proposing improvements to efficiency of conversion of wind energy to hydrogen for vehicle propulsion. This was accomplished by performing multiple experiments on the station itself to determine the efficiency of every component. This involved an analysis of the efficiency of each step of the process would be performed: wind generation of electricity; use of electricity to electrolyze water and produce hydrogen (at 200 psi); compression of the hydrogen to 5000 psi; fueling of a vehicle; and operation of the vehicle on hydrogen. A primary finding is the energy consumption by the fueling station where for a six month period the station used an approximate 7200 kW �– hr in energy, with the breakdown consisting of 6070 kW-hr for the electrolyzer, 103.2 kW-hr for the compressor, 44 kW for the cooling unit, and the balance for heating and fueling station operation. eVermont used Norwich University engineering students to help with collecting and analyzing the data. The actual power used by each component was determined using a Fluke 345 Power Quality Clamp Meter that was temporarily connected into the system�’s main power supply. It was found that the electrolyzer�’s usage was 42 kW while the compressor demanded 4.22 kW. The theoretical power that was calculated was used with the actual power to determine the efficiencies of both these components. The theoretical power of the electrolyzer was 21.2 kW which yielded an efficiency of 50.36% and with a theoretical power of .7744 kW the efficiency of the compressor was calculated to be 18.4%. The determination of these efficiencies will help modify the station in order to use more of the supplied power and hopefully pave the way for future for hydrogen fueled vehicles. For a six month shakedown period of January to July 2007, the station used an approximate 7200 kW �– hr in energy and produced 62.9 kg of Hydrogen. It was calculated that the electrolyzer accounted for about 6065.94 kW �– hr, the compressor accounted for about 103.2 kW �– hr, the compressor cooling unit used 43.72 kW �– hr while the cooler and heater required the rest of the power. The electrolyzer is the main consumer of the power supplied to the station while the compressor consumes about a tenth of the electrolyzer consumes. Also, the efficiency of the electrolyzer is much higher than the efficiency of the compressor by 40 %. The compressor�’s efficiency is extremely low using only 18.4% of the power supplied to it. In order to put the hydrogen plant into a residential area, a major concern would be noise pollution. In the City of Burlington noise from any power equipment, machinery, and construction is prohibited from the hours of nine at night to seven in the morning. Because this Hydrogen station is a desirable distributed energy facility, potentially located in residential areas, the amount of noise that the unit generates was calculated. This was done using a decibel meter and taking readings around the plant. These decibel
23
values were used to estimate the noise at different distances away from the equipment. The results were used to determine whether the power plant will make too much noise to operate during night time hours and still be in accordance with city limits. More details on these studies can be found in Appendix B.
Figure 22 eVermont H2 Wind to Wheels fuel generation and refueling facility being demonstrated to UVM and ZJU researchers, 2008. 5. EQUIPMENT PURCHASED No equipment with value in excess of $5,000 was purchased. 6. PUBLICATIONS, PRESENTATIONS AND INVENTION DISCLOSURES
6.1 Journal Publications Hurley DA, Huston DR, Gollins K, Gervais A. (2010) �“Coordinated Sensing and Active Repair for Self-Healing�” submitted to Smart Materials and Structures, under review.
24
Huston D, Hurley D, Gervais A, Gollins K, Ziegler T. (2011) �“Damage Detection and Autonomous Repair System Coordination�” submitted to Advances in Structural Engineering, October 2009, accepted for publication, to appear Feb 2011. Liu YL, Zheng JY, Xu P, Zhao YZ, Liu PF, Chen HG. (2008) �“Numerical Simulation on the Influence of Environment Temperature on the Leakage and Diffusion of High Pressured Hydrogen due to Storage Tank Failure�”Journal of Engineering Thermophysics, 2008, 29(5):770-772(In Chinese, EI) Liu YL, Zheng JY, Xu P, Zhao YZ, Liu PF, Bie HY. (2008) �“Numerical Simulation of Obstacle Influence on the Leakage and Diffusion of Hydrogen due to High-Pressure Storage Tank Failure Journal of Zhejiang University, 2008, 42(12):25-28. (In Chinese, EI) Liu YL, Zheng JY, Xu P, Zhao YZ, Liu PF, Bie HY, Huston D. (2008) �“Numerical Simulation on the Leakage and Diffusion of Hydrogen in the Case of Different Parameters due to High-Pressured Storage Tanks Failure�” Journal of Loss Prevention in the Process Industry�” (doi:10.1016/j.jlp.2008.06.007) (In English, SCI) Liu Y, Xu P, Zheng J, Zhao Y, Chen H, Deng G, Chen R. (2008) �“Numerical Simulation on the Dispersion of Hydrogen and Natural Gas due to High Pressured Pipeline Failure�” Acta Energy Solaris Sinica, 29(10):1250-1253(In Chinese, EI) Xu P, Liu P-F, Liu Y-L, Zheng JY, Chen HG, Bie HY, Huston D. (2008) �“Numerical Study of the Leakage and Dispersion of Hydrogen due to High-Pressured Storage Tank Failure in the Case Of Various Leaking Locations�”, Journal of Chemical Engineering of Chinese Universities, , 29(12) (In Chinese, EI) Xu P, Zheng JY, Liu PF, Chen R, Kai F, Lei Li L. (2008) �“Risk Identification and Control of Stationary High-Pressure Hydrogen Storage Vessels�” Journal of Loss Prevention In The Process Industry,(doi:10.1016/j.jlp.2008.08.008)(In English, SCI) Zheng JY, Bie HY, Xu P, Liu P-F, Chen H-G, Dryver Huston D. (2007) �“Investigation on Standards of Fully-wrapped Composite Tanks for On-board Storage of High Pressure Hydrogen�” Pressure Vessel Technology, 2007(11):48-56. (In Chinese)
6.2 Conference Publications Bie H, Xu P, Zheng J, Kai F, Liu P, Liu Y, Chen H. �“Influence Of Stress Ratio On The Reliability Of Al/Carbon �–Fiber Composite Hydrogen Tanks�” ASME Pressure Vessels and Piping Conference, Chicago, July 2008 Chen H, Zheng JY, Liu Y, Xu P, Li L, Liu P, Bie H. �“Optimization of Hydrogen Utilization Ratio In Hydrogen Filling Stations�” ASME Pressure Vessels and Piping Conference, Chicago, July 2008

25
Chen Y, Tian S, Sun, Sun X, Huston DR. �“Experimental study on decision fusion of many damage detection methods with multi-resolution. SPIE Smart Structures/NDE. March 2008. (In English)
Huston D, Hurley D, Gollins K, Gervais A, Ziegler T. �“Damage Detection and Autonomous Repair System Coordination�” Proc. ANCRiSST Fifth International Workshop on Smart Structures and Materials Technology, Northeastern University, Boston, 2009 Huston DR, Hurley DA, Gollins K, Gervais A. �“Coordinated Sensing and Autonomous Repair of Pressure Vessels And Structures�” Paper 7647-55 SPIE Smart Structures - Sensors and Smart Structures Technologies for Civil, Mechanical, and Aerospace Systems 2010, Masayoshi Tomizuka, Ed. March 2010, San Diego Huston D, Hurley D, Gervais A, Gollins �“Coupled Acoustic Emission Damage Detection and Active-Healing Smart Structural System�” Proc. 7th International Workshop on Structural Health Monitoring 2009, Stanford University Huston D, Hurley D, Gervais A, Gollins K. �“Incorporating Active Healing and Feedback in Structural Systems (Technical Brief) Annual Conference of the Prognostics and Health Management Society, San Diego. Huston DR, Sun XY, Zheng JY, Qin Q, Chen Y, Sansoz F. �“Self Sealing Tanks and Pressure Vessels�” SPIE Smart Structures and Nondestructive Testing Conference, San Diego, March 2008. Huston D, Sun XY, Zheng JY, Qin Q, Chen Y, Hurley D, Sansoz F, Savin D. �“Self Sealing and Monitoring of Tanks and Pressure Vessels�” Proc ANCRiSST�’08, Tokyo, June 2008 Liu YL, Zheng JY, Xu P, Zhao YZ, Chen HG, Bie HY. (2008) �“Numerical Simulation on Hydrogen Fast Filling for 150LComposite Cylinders�” 2008 International hydrogen forum. Changsha, Hunan: August 2-3, 2008, (In English) Liu Y, Zheng J, Xu P, Zhao Y, Li L, Liu P, Bie H, Chen H, Huston D, Sun X. �“Numerical Simulation On Fast Filling Of Hydrogen For Composite Storage Cylinders�” presented at ASME Pressure Vessels and Piping Conference, Chicago, July 2008 Sun XY, Huston DR, Zheng JY, Qin Q, Chen Y. �“Feasibility Investigation on fatigue crack damage detection of fiber composite wrapped tank for on-board high pressure hydrogen storage�” Proc. 7th International Workshop on Structural Health Monitoring 2009, Stanford University
26
Sun XY, Qin Q, Zheng JY, Chen Y, Huston DR. �“Damage Detection and Leakage Alert of Fiber Composite Wrapped Tank for High Pressure Hydrogen Storage�” presented at SPIE Smart Structures and Nondestructive Testing Conference, San Diego, March 2008 Zheng JY, Bie HY, Liu PF, Liu YL, Xu P, Chen HG. (2008) �“Fatigue Lifetime Evaluation of High Pressure Hydrogen Storage Vessel for Fuel Cell Vehicles�” 2008 International hydrogen forum. Changsha, Hunan: August 2-3, 2008, (In English)
6.3 Unpublished Presentations Harold Garabedian presented research results at the Electric Vehicle Symposium 23 in Anaheim, CA on Dec. 4, 2007 with the title �“Wind to Wheels Hydrogen Project: Sustainable Transportation�”
6.4 Invention Disclosures
Huston D, McLean J �“Building Code and Standard Network Analysis for BIM Applications�” submitted to the UVM Office of Technology Commercialization, Sept 2010. McLean J, Huston D �“Invisible Flame and Ultraviolet Light Viewer�” submitted to the UVM Office of Technology Commercialization, July 2009.
6.5 Trade Journal Publication McLean J, Huston D. (2010) �“The Invisible Flame�” Fire Chief, Vol. 54, Issue 6, p 52-55, Jun 1

27
7. REFERENCES Bain A, Van Vorst WD. (1999) �“The Hindenburg Tragedy Revisited: The Fatal Flaw Found�” Intl Jnl Hydrogen Energy, Vol 24, Issue 5 , 399-403 May 1999 Birgisson G, Lavarco W. (2004) �“An Effective Regulatory Regime for Transportation of Hydrogen�” Intl Jnl Hydrogen Energy 29, 771 - 780 Carlson JM, Doyle J. (1999) �“Highly optimized tolerance: A mechanism for power laws in design systems�” Phys Rev Lett, 60, 2, p 1412-1427 Dodds PS, Watts DJ. (2004) �“Universal Behavior in a Generalized Model of Contagion�” Phys Rev Lett, 92, 218701 Dodds PS, Watts DJ, Sabel CF, (2003) �“Information exchange and the robustness of organizational networks�” Proc Natl Acad Sci, 100, 21, p 12516-12521 Doerner D. (1989) The Logic of Failure, Perseus Books, Cambridge Domashenko A, Golovchenko A, Gorbatsky Y, Nelidov V, Skorodumov B. (2002) �“Production, Storage and Transportation of Liquid Hydrogen. Experience of Infrastructure Development and Operation�” Intl Jnl Hydrogen Energy 27, 753 �– 755 Feynman R. (1986) �“Personal Observations on Reliability of Shuttle�” Report of the Presidential Commission on the Space Shuttle Challenger Accident, NASA, Appendix F Heinrich HW, Granniss ER. (1959) Industrial Accident Prevention McGraw-Hill, New York Huston D, Durham D. (1995) �“Investigation of Broken Pipe�” unpublished report to the Vermont State Fire Marshall�’s Office Kontic B, Kontic D. (2006) �“Weaknesses in Risk Assessment Scenario Development Aimed For Spatial Planning�” NATO Adv Research Workshop, Comp Models of Risks to Infrastructure, Primosten, Croatia Murray JD. (2002) Mathematical Biology 3rd ed., Springer, New York Meng G, Gao S, Li Z, Chang B,Su J. (1999) �“The measuring system for expanding characteristics test of seawater frozen in sealed cover tube of offshore oil well�”. China Offshore Platform 14(3)25-29. (in Chinese) Ogden JM. (1999) �“Developing an Infrastructure for Hydrogen Vehicles: A Southern California Case Study�” Intl Jnl Hydrogen Energy, Vol 24, Issue 8 , Aug, p 709-730 Petroski H. (1992) To Engineer is Human, Vintage Books, New York

28
Perrow C. (1999) Normal Accidents, Princeton University Press, Princeton, NJ Sagan, SD. (2002) The Limits of Safety, Princeton University Press, Princeton, NJ U.S. Dept. of Energy. (2004) �“Permitting Hydrogen Motor Fuel Dispensing Facilities�” Hydrogen, Fuel Cells, and Infrastructure, Version 1.0 PNNL Wasserman S, Faust K. (1994) Social Network Analysis: Methods and Applications, Cambridge University Press, Cambridge Watts, DJ. (2002) �“A simple model of global cascades on random networks�” Proc Natl Acad Sc., 99, 9, p 5766-5771 Weed LL. (1991) Knowledge Coupling, Springer-Verlag, New York Wilson PF, Dell LD, Anderson GF. (1993) Root Cause Analysis, ASQ Quality Press, Milwaukee

29
Appendix A - Safety Issues Related to Transport and Storage of Hydrogen Fuels in Northern Climates Zhejiang University Final Report
Zhejiang University, P.R.China
- 1 -
Safety Issues Related to Transport and Storage of
Hydrogen Fuels in Northern Climates The proposed research by investigators from ZJU and TU in collaboration with UVM is to extend the active research efforts at ZJU to examine the safety and reliability of H2 fuel transportation and storage systems in northern climates. Based on the communication and discussion between the collaborators, several critical safety issues associated with H2 storage and transportation in northern climates are identified and the investigation is developed as following:
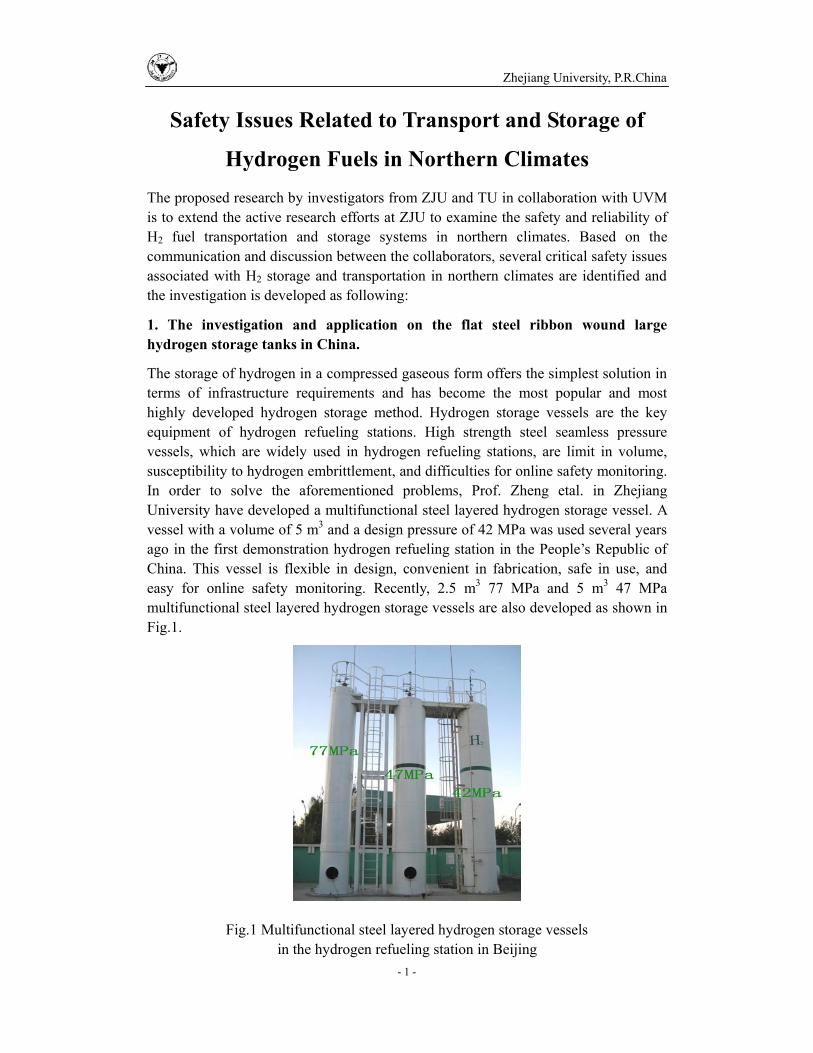
1. The investigation and application on the flat steel ribbon wound large hydrogen storage tanks in China.
The storage of hydrogen in a compressed gaseous form offers the simplest solution in terms of infrastructure requirements and has become the most popular and most highly developed hydrogen storage method. Hydrogen storage vessels are the key equipment of hydrogen refueling stations. High strength steel seamless pressure vessels, which are widely used in hydrogen refueling stations, are limit in volume, susceptibility to hydrogen embrittlement, and difficulties for online safety monitoring. In order to solve the aforementioned problems, Prof. Zheng etal. in Zhejiang University have developed a multifunctional steel layered hydrogen storage vessel. A vessel with a volume of 5 m3 and a design pressure of 42 MPa was used several years ago in the first demonstration hydrogen refueling station in the People�’s Republic of China. This vessel is flexible in design, convenient in fabrication, safe in use, and easy for online safety monitoring. Recently, 2.5 m3 77 MPa and 5 m3 47 MPa multifunctional steel layered hydrogen storage vessels are also developed as shown in Fig.1.
Fig.1 Multifunctional steel layered hydrogen storage vessels in the hydrogen refueling station in Beijing

Zhejiang University, P.R.China
- 2 -
Basic Structure
A multifunctional layered stationary hydrogen storage vessel is shown in Fig.2, which consists of a flat steel ribbon wound cylindrical shell, two double-layered hemispherical heads, two reinforcing rings, a skirt support, some nozzles, etc. The flat ribbon wound cylindrical shell is made up of a thin inner shell, a layered shell, and a protective shell. The inner shell, the thickness of which is 1/6�–1/8 of the total thickness, is made by welding after rolling a special type of cladding steel sheets. The layered shell is made from flat steel ribbons with width of 80�–160 mm and thickness of 4�–8 mm, which is cross-helically wound layer by layer onto the thin inner shell at room temperature under an appropriate pretension until it reaches the required thickness. The helical winding angle with respect to the hoop direction of the vessel shall be neither less than 15 deg nor greater than 30 deg. The ends of each ribbon are welded to the two inclined or conic surfaces at both ends, respectively. The protective shell made from steel sheet with thickness of 3�–6 mm is wrapped outside the layered shell. There are several nozzles in the protective shell, which are attached to an online safety monitoring system.
Fig.2 Construction of the multifunctional layered stationary hydrogen storage vessel. 1.Bottom nozzle support, 2.Opening, 3.Reinforcing ring, 4.Protective shell, 5.Layered shell, 6.Inner shell,
7.Cylinder nozzle, 8.head nozzle, 9.Top nozzle support, 10.Hemispherical head, 11.Reinforcing,
The double-layered hemispherical head consists of inner and outer hemispherical heads. The wall thickness of the outer head should be determined based on the criterion that its burst pressure should be 1.5 times the design pressure of the vessel. Therefore, any cracks in the inner head can be arrested; the outer head can bear the

Zhejiang University, P.R.China
- 3 -
operating pressure even though any leak occurs in the inner hemispherical head. There are also nozzles in the outer hemispherical heads, which are used to collect leaked hydrogen for safety monitoring.
Characteristics
(1) Feasible in Manufacturing with Various Parameters. Multifunctional layered stationary hydrogen storage vessels are mainly made from thin plates and steel ribbons. There are no manufacturing restrictions on size, either for internal diameter or for length and shell thickness. The larger the internal diameter is, the easier it is for pretension winding of steel ribbon layers, and the longer the length of the vessel is, the higher efficiency of the manufacturing is. The cost can be reduced when compared with seamless pressure vessels. Multifunctional layered stationary hydrogen storage vessels with an internal diameter of 2500 mm and a design pressure of 100 MPa can be manufactured by using the winding machine available in the People�’s Republic of China.
(2) Not Susceptible to Hydrogen Embrittlement. The inner shell is made from cladding steel sheets whose cladding layer material is type 316L stainless steel, which has been proven to be compatible with high pressure hydrogen at environment temperature. The tensile strength of other materials used for the vessel, including inner shell and flat steel ribbons, is below 510 MPa, far less than 882 MPa. Therefore, hydrogen embrittlement will never occur to the vessel at normal operating conditions or even there is a hydrogen leakage from the inner shell.
(3) Burst Resistant or Self-Protected. The developed vessels possess the characteristics of being burst resistant or self-protected. Theoretical analysis, experiments and thousands of application cases have proven that a flat steel ribbon wound shell completely does away with disastrous unexpected whole brittle fracture damage, and the worst damage is always �“only leak, but never burst�”. Firstly, pretension winding of ribbons makes the thin inner shell compressed both in the axial and in the circumferential direction. The compressive stress can partly or even thoroughly counteract the tensile stress caused by the operating pressure. This makes the inner shell in a low stress status. Complementarily, during the winding process, yielding of the inner shell and steel ribbons are prevented by controlling the pretensioning stress, yet bulking of the inner shell will inherently never occur due to the vessel structure. Secondly, such shell uses thin steel plates and ribbons, in which the existence probability of defects such as cracks and delamination is less than that in thick plates, and the dimension is small. Thirdly, the interlayer friction can prevent cracks from propagating. When cracks in the inner shell tend to propagate, the ribbons above the cracks will cause additional back pressure and friction, which will prevent the cracks from propagating.
(4) Random Dispersion of Defects or Cracks. The developed vessel avoids deep circumferential weld. The ribbons and heads are joined by step weld instead of traditional butt weld. These measures not only augment the bearing capacity of weld but also make the stress in the heads and cylinder transit smoothly.
Zhejiang University, P.R.China
- 4 -
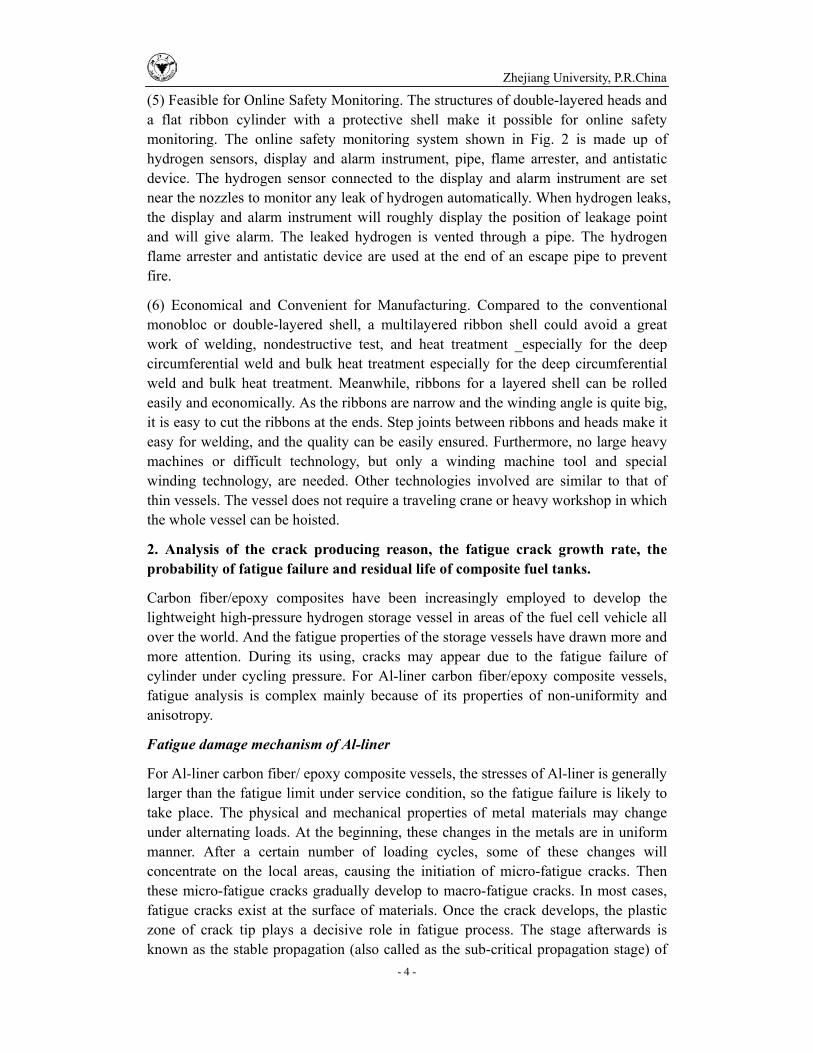
(5) Feasible for Online Safety Monitoring. The structures of double-layered heads and a flat ribbon cylinder with a protective shell make it possible for online safety monitoring. The online safety monitoring system shown in Fig. 2 is made up of hydrogen sensors, display and alarm instrument, pipe, flame arrester, and antistatic device. The hydrogen sensor connected to the display and alarm instrument are set near the nozzles to monitor any leak of hydrogen automatically. When hydrogen leaks, the display and alarm instrument will roughly display the position of leakage point and will give alarm. The leaked hydrogen is vented through a pipe. The hydrogen flame arrester and antistatic device are used at the end of an escape pipe to prevent fire.
(6) Economical and Convenient for Manufacturing. Compared to the conventional monobloc or double-layered shell, a multilayered ribbon shell could avoid a great work of welding, nondestructive test, and heat treatment _especially for the deep circumferential weld and bulk heat treatment especially for the deep circumferential weld and bulk heat treatment. Meanwhile, ribbons for a layered shell can be rolled easily and economically. As the ribbons are narrow and the winding angle is quite big, it is easy to cut the ribbons at the ends. Step joints between ribbons and heads make it easy for welding, and the quality can be easily ensured. Furthermore, no large heavy machines or difficult technology, but only a winding machine tool and special winding technology, are needed. Other technologies involved are similar to that of thin vessels. The vessel does not require a traveling crane or heavy workshop in which the whole vessel can be hoisted.
2. Analysis of the crack producing reason, the fatigue crack growth rate, the probability of fatigue failure and residual life of composite fuel tanks.
Carbon fiber/epoxy composites have been increasingly employed to develop the lightweight high-pressure hydrogen storage vessel in areas of the fuel cell vehicle all over the world. And the fatigue properties of the storage vessels have drawn more and more attention. During its using, cracks may appear due to the fatigue failure of cylinder under cycling pressure. For Al-liner carbon fiber/epoxy composite vessels, fatigue analysis is complex mainly because of its properties of non-uniformity and anisotropy.
Fatigue damage mechanism of Al-liner
For Al-liner carbon fiber/ epoxy composite vessels, the stresses of Al-liner is generally larger than the fatigue limit under service condition, so the fatigue failure is likely to take place. The physical and mechanical properties of metal materials may change under alternating loads. At the beginning, these changes in the metals are in uniform manner. After a certain number of loading cycles, some of these changes will concentrate on the local areas, causing the initiation of micro-fatigue cracks. Then these micro-fatigue cracks gradually develop to macro-fatigue cracks. In most cases, fatigue cracks exist at the surface of materials. Once the crack develops, the plastic zone of crack tip plays a decisive role in fatigue process. The stage afterwards is known as the stable propagation (also called as the sub-critical propagation stage) of
Zhejiang University, P.R.China
- 5 -
crack growth. During this stage, crack length increases slowly along with the increasing cycling number. When the crack length reaches to a certain threshold value, crack instable propagation occur which means failure of the vessels.
Fatigue damage mechanism of composite laminates
The composite damage mechanisms can be classified into the progressive and non-progressive mechanisms. The fracture forms in continuous fiber reinforced composites can be divided into three basic fracture types: intralaminar, interlaminar, and translaminar. The intralaminar and interlaminar fractures both tend to be in the forms of matrix fracture or fiber-to-matrix debonding in terms of micro- structures. However, from a macro perspective, the former fractures are those located internally within a ply, yet the latter ones describe failures oriented between plies. Translaminar fractures are those oriented transverse to the laminated plane in which conditions of fiber fracture are generated. By introducing this convention, fatigue damage mechanism of composites can be described in terms of matrix fracture, fiber fracture, delamination, or their combinations.
Experimental research
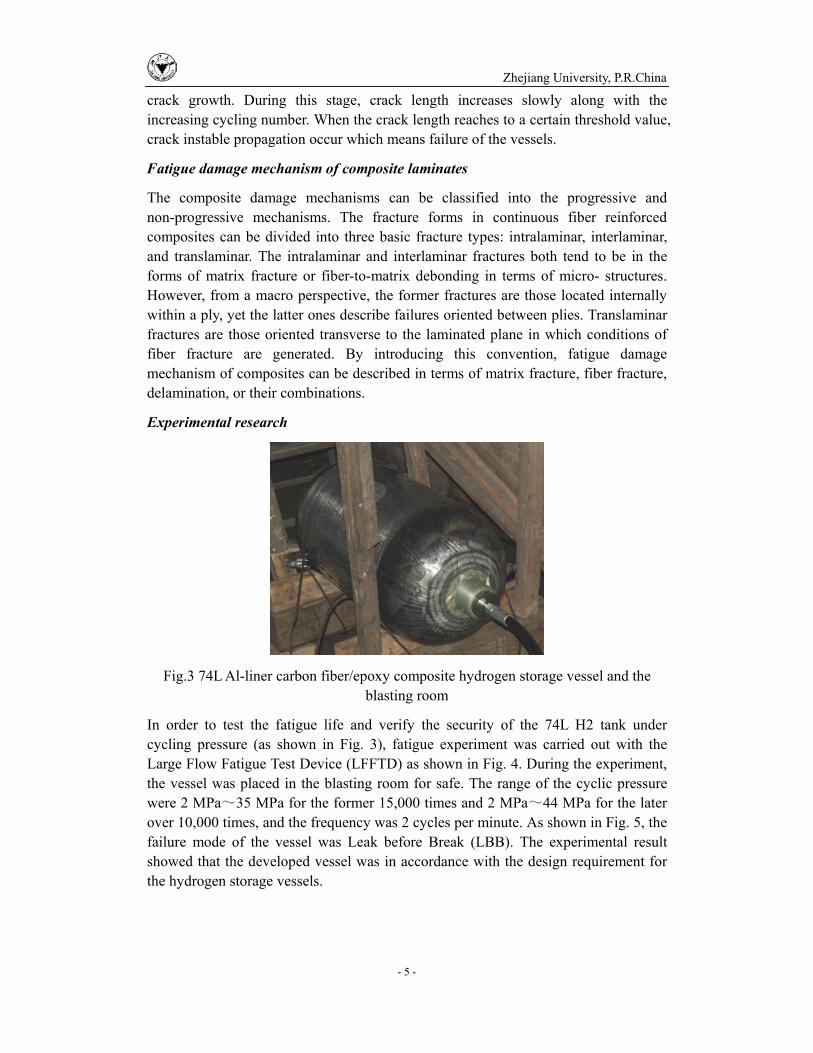
Fig.3 74L Al-liner carbon fiber/epoxy composite hydrogen storage vessel and the blasting room
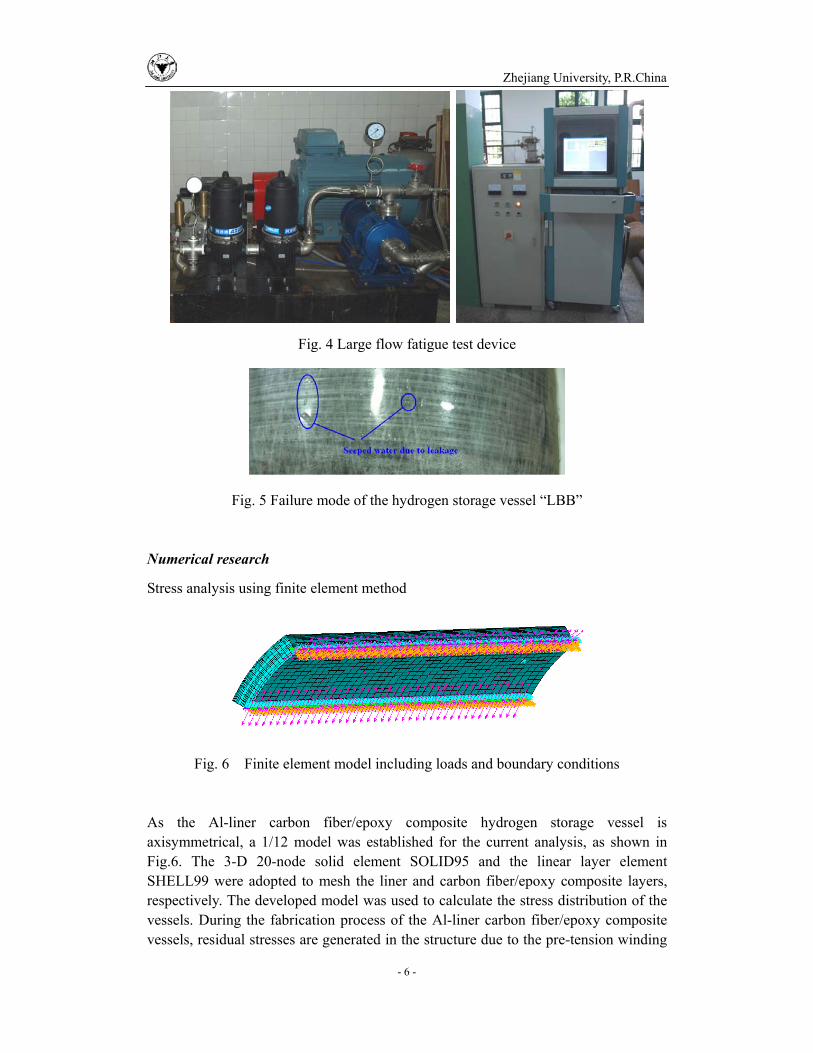
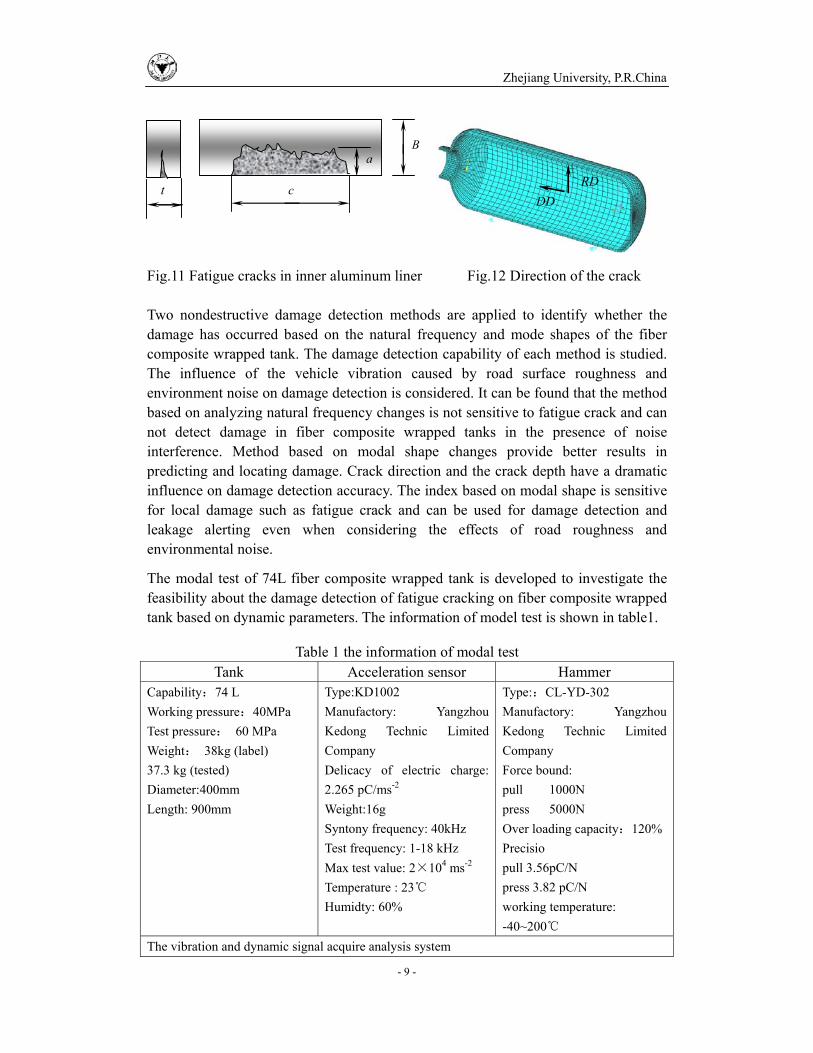
In order to test the fatigue life and verify the security of the 74L H2 tank under cycling pressure (as shown in Fig. 3), fatigue experiment was carried out with the Large Flow Fatigue Test Device (LFFTD) as shown in Fig. 4. During the experiment, the vessel was placed in the blasting room for safe. The range of the cyclic pressure were 2 MPa 35 MPa for the former 15,000 times and 2 MPa 44 MPa for the later over 10,000 times, and the frequency was 2 cycles per minute. As shown in Fig. 5, the failure mode of the vessel was Leak before Break (LBB). The experimental result showed that the developed vessel was in accordance with the design requirement for the hydrogen storage vessels.
Zhejiang University, P.R.China
- 6 -
Fig. 4 Large flow fatigue test device
Fig. 5 Failure mode of the hydrogen storage vessel �“LBB�”
Numerical research
Stress analysis using finite element method
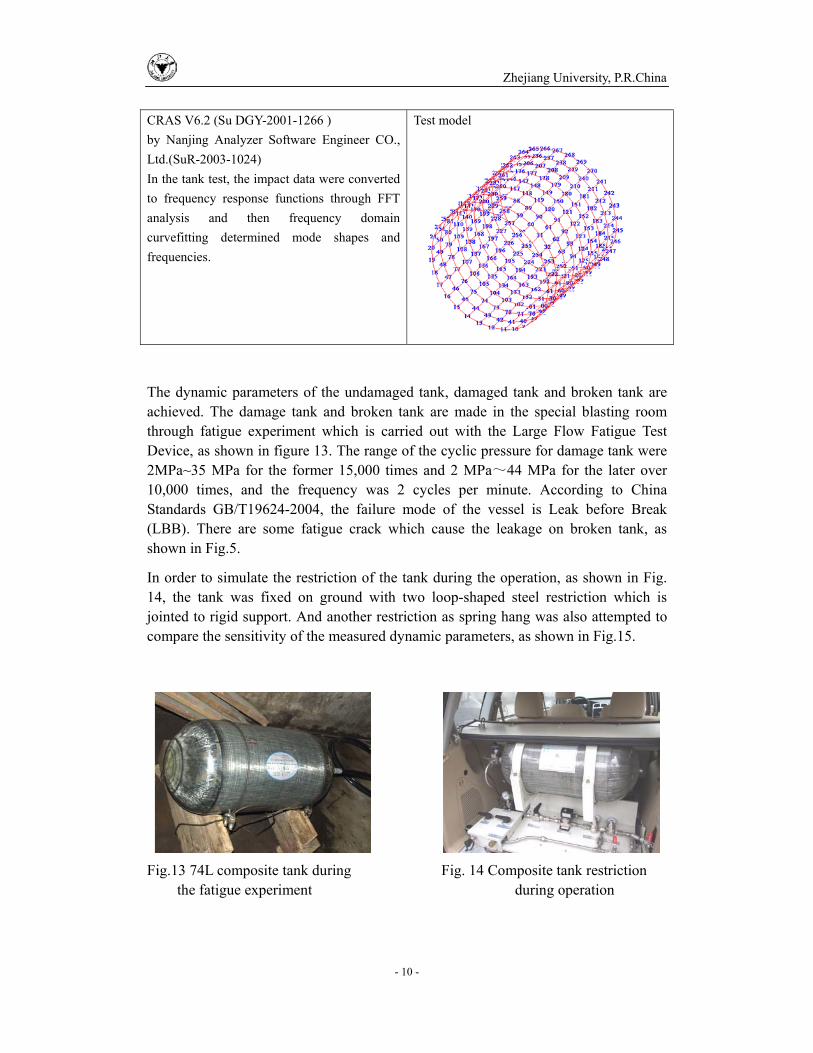
Fig. 6 Finite element model including loads and boundary conditions
As the Al-liner carbon fiber/epoxy composite hydrogen storage vessel is axisymmetrical, a 1/12 model was established for the current analysis, as shown in Fig.6. The 3-D 20-node solid element SOLID95 and the linear layer element SHELL99 were adopted to mesh the liner and carbon fiber/epoxy composite layers, respectively. The developed model was used to calculate the stress distribution of the vessels. During the fabrication process of the Al-liner carbon fiber/epoxy composite vessels, residual stresses are generated in the structure due to the pre-tension winding

Zhejiang University, P.R.China
- 7 -
and cooling of the resin from the curing temperature. Besides, the autofrettage technology is also applied after manufacturing in order to decrease the stress level in the Al-liner and to improve the fatigue life. For 40 MPa vessels, the autofrettage pressure is calculated as 55.5 MPa including the effect of the residual stresses . The stress distributions under 55.5 MPa and 40 MPa are shown in Fig.7 and Fig.8, respectively. From the numerical results, the maximum stress in the Al-liner is
max 228MPa at 40 MPa pressure after autofrettage.
Fig. 7 Stress contours at 55.5 MPa pressure
Fig. 8 Stress contours at 40 MPa pressure after autofrettage process.
Fatigue life evaluation
Numerical results were used to predict fatigue life. In previous studies, it has been revealed that the fatigue life of Al-liner carbon fiber/epoxy composite hydrogen storage vessel was mainly dominated by the Al liner. Therefore, the liner is key object in this report. The aluminum alloy material is assumed to be isotropic and thin-walled structure, then m= eq/3, eq = yields the follows:
1
1 1max min
1 2
2fN
B (1)
Substituting the maximum stress max, B and into Eq.1 with the obtained values, the fatigue life of liner is calculated as 31740. The fatigue experiments conducted on the Al-liner carbon fiber/epoxy composite hydrogen storage vessels also approved the results.

Zhejiang University, P.R.China
- 8 -
Further research work about the fatigue crack and fatigue life is under way.
3. Damage detection and analysis of H2 leakage of composite fuel tanks
In order to ensure the safety during the operation, the damage detection and leakage alerting of fiber composite wrapped high pressure hydrogen storage tanks should be investigated. Fatigue cracking of the inner aluminum alloy is widely accepted as a common form of damage with in-service pressure vessels that can be mitigated through safety assessments and implementing leakage alert capabilities. The aim of this research is to find an effective nondestructive damage detection method to identify fatigue cracks on composite wrapped tank so as to actualize a leakage alert. During the fabrication process, residual stresses are generated in of the Al-liner carbon fiber/epoxy composite tanks due to the pre-tension winding and cooling of the resin from the curing temperature. As the autofrettage technology is also applied after manufacturing to decrease the stress level in the Al-liner and to improve the fatigue life, the simulation model analysis could be developed with residual stress ignored. A three-dimensional finite-element model is developed as the baseline model, as shown in Fig. 9 and 10. Fatigue cracks in the inner aluminum layer is simulated with the position, length, and direction of the crack being the principal investigation parameters, as shown in Fig. 11 and 12.
Fig.9 FE model of 74L fiber composite wrapped tank
Fig.10 The layers along the tank thickness of FE modal
Zhejiang University, P.R.China
- 9 -
Fig.11 Fatigue cracks in inner aluminum liner Fig.12 Direction of the crack Two nondestructive damage detection methods are applied to identify whether the damage has occurred based on the natural frequency and mode shapes of the fiber composite wrapped tank. The damage detection capability of each method is studied. The influence of the vehicle vibration caused by road surface roughness and environment noise on damage detection is considered. It can be found that the method based on analyzing natural frequency changes is not sensitive to fatigue crack and can not detect damage in fiber composite wrapped tanks in the presence of noise interference. Method based on modal shape changes provide better results in predicting and locating damage. Crack direction and the crack depth have a dramatic influence on damage detection accuracy. The index based on modal shape is sensitive for local damage such as fatigue crack and can be used for damage detection and leakage alerting even when considering the effects of road roughness and environmental noise.
The modal test of 74L fiber composite wrapped tank is developed to investigate the feasibility about the damage detection of fatigue cracking on fiber composite wrapped tank based on dynamic parameters. The information of model test is shown in table1.
Table 1 the information of modal test Tank Acceleration sensor Hammer
Capability 74 L Working pressure 40MPa Test pressure 60 MPa Weight 38kg (label) 37.3 kg (tested) Diameter:400mm Length: 900mm
Type:KD1002 Manufactory: Yangzhou Kedong Technic Limited Company Delicacy of electric charge: 2.265 pC/ms-2
Weight:16g Syntony frequency: 40kHz Test frequency: 1-18 kHz Max test value: 2 104 ms-2
Temperature : 23 Humidty: 60%
Type: CL-YD-302 Manufactory: Yangzhou Kedong Technic Limited Company Force bound: pull 1000N press 5000N Over loading capacity 120% Precisio pull 3.56pC/N press 3.82 pC/N working temperature: -40~200
The vibration and dynamic signal acquire analysis system
RD DD
t
a
c
B
Zhejiang University, P.R.China
- 10 -
CRAS V6.2 (Su DGY-2001-1266 ) by Nanjing Analyzer Software Engineer CO., Ltd.(SuR-2003-1024) In the tank test, the impact data were converted to frequency response functions through FFT analysis and then frequency domain curvefitting determined mode shapes and frequencies.
Test model
The dynamic parameters of the undamaged tank, damaged tank and broken tank are achieved. The damage tank and broken tank are made in the special blasting room through fatigue experiment which is carried out with the Large Flow Fatigue Test Device, as shown in figure 13. The range of the cyclic pressure for damage tank were 2MPa~35 MPa for the former 15,000 times and 2 MPa 44 MPa for the later over 10,000 times, and the frequency was 2 cycles per minute. According to China Standards GB/T19624-2004, the failure mode of the vessel is Leak before Break (LBB). There are some fatigue crack which cause the leakage on broken tank, as shown in Fig.5.
In order to simulate the restriction of the tank during the operation, as shown in Fig. 14, the tank was fixed on ground with two loop-shaped steel restriction which is jointed to rigid support. And another restriction as spring hang was also attempted to compare the sensitivity of the measured dynamic parameters, as shown in Fig.15.
Fig.13 74L composite tank during Fig. 14 Composite tank restriction the fatigue experiment during operation
Zhejiang University, P.R.China
- 11 -
Fig 15 the restrictions of the 74L composite tank model test
The spring hang cause a flicker of the composite tank which interfere with the measured frequency response function, as shown in Fig. 16, therefore the after-mentioned damage detection analysis was developed based on the measured dynamic parameters of the rigid supported tank.
Spring hangRigid support
Fig.16 Frequency response functions of the composite tank under different restriction
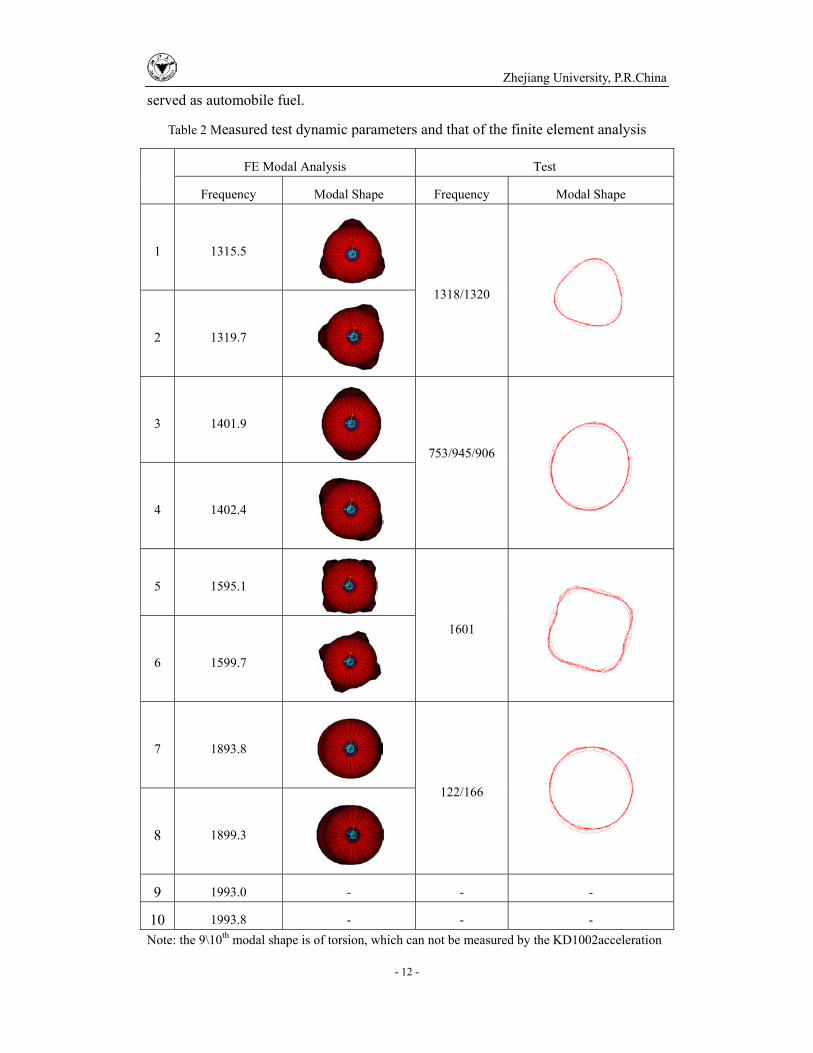
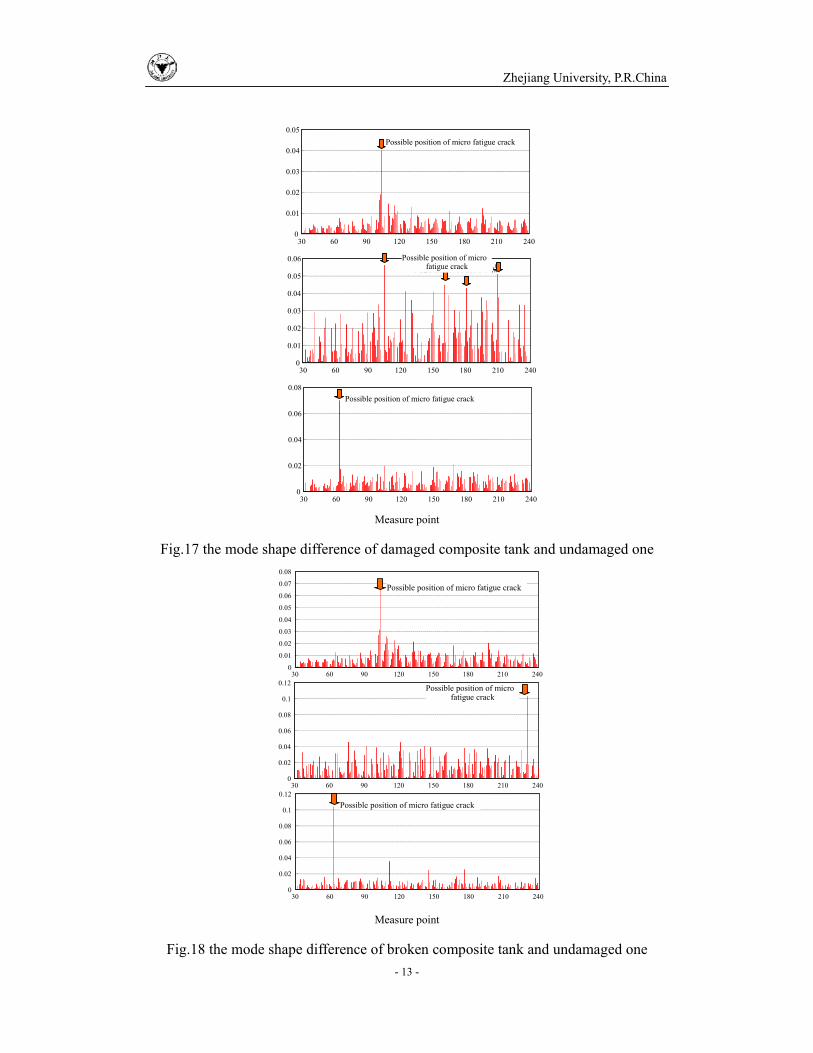
The measured dynamic parameters are compared with that of the finite element analysis, as shown in table 2, the deviations between test results and FEA results are mainly because of the simulation of the restriction and the error of measurement. Focus on fatigue crack as the form of local damage, the methods based on modal shape could be a prospective way to identify the occur of damage and locate the possible position of the crack, as shown in Fig.17 and 18. This research can be looked as basis of the online damage detection of high pressure hydrogen storage tank which
Zhejiang University, P.R.China
- 12 -
served as automobile fuel.
Table 2 Measured test dynamic parameters and that of the finite element analysis
FE Modal Analysis Test
Frequency Modal Shape Frequency Modal Shape
1 1315.5
1318/1320
2 1319.7
3 1401.9
753/945/906
4 1402.4
5 1595.1
1601
6 1599.7
7 1893.8
122/166
8 1899.3
9 1993.0 - - -
10 1993.8 - - - Note: the 9\10th modal shape is of torsion, which can not be measured by the KD1002acceleration
Zhejiang University, P.R.China
- 13 -
30 60 90 120 150 180 210 2400
0.01
0.02
0.03
0.04
0.05
30 60 90 120 150 180 210 2400
0.01
0.02
0.03
0.04
0.05
0.06
30 60 90 120 150 180 210 2400
0.02
0.04
0.06
0.08
Possible position of micro fatigue crack
Possible position of microfatigue crack
Possible position of micro fatigue crack
Measure point
Fig.17 the mode shape difference of damaged composite tank and undamaged one
30 60 90 120 150 180 210 2400
0.02
0.04
0.06
0.08
0.1
0.12
30 60 90 120 150 180 210 2400
0.01
0.02
0.03
0.04
0.05
0.06
0.07
0.08
30 60 90 120 150 180 210 2400
0.02
0.04
0.06
0.08
0.1
0.12
Possible position of micro fatigue crack
Possible position of microfatigue crack
Possible position of micro fatigue crack
Measure point
Fig.18 the mode shape difference of broken composite tank and undamaged one

Zhejiang University, P.R.China
- 14 -
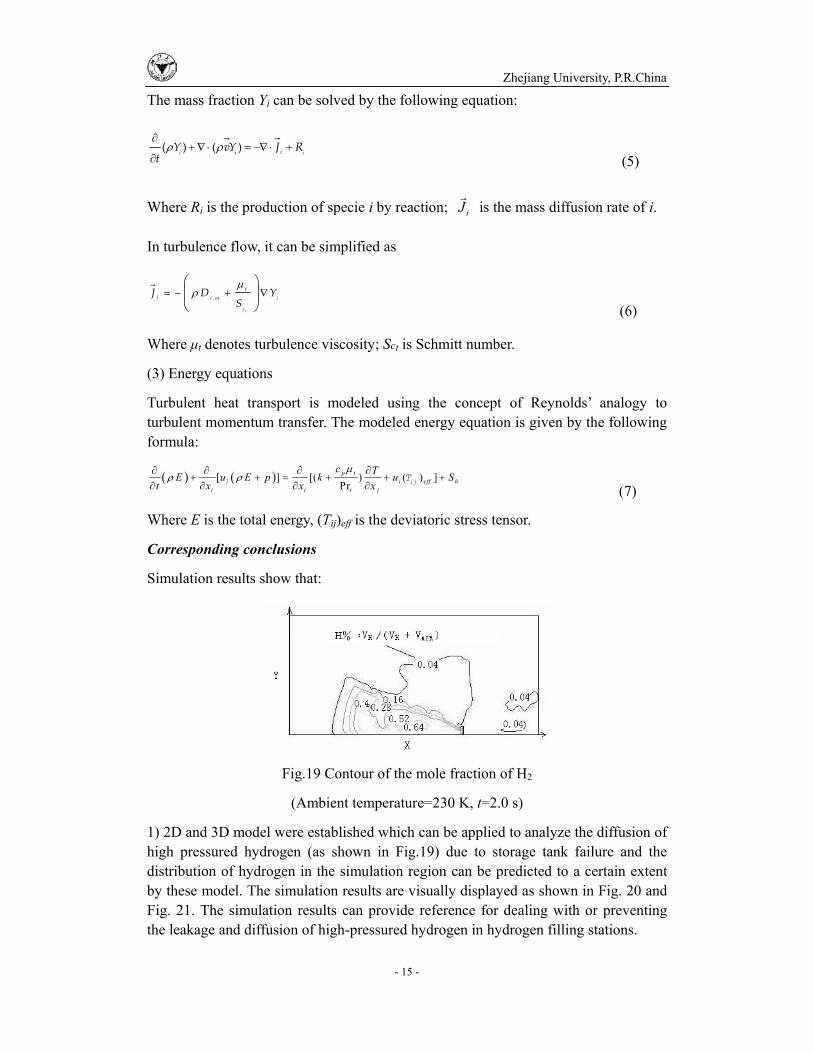
4. Numerical simulation of leakage and diffusion of H2 in northern environments.
The number of vessels will be greatly increased in hydrogen refueling stations or hydrogen fuel cell vehicles etc. Thus, accidents due to leakage of the vessel should be paid more attention. Since the experiment is not easy to carry out because of high costs and dangerousness, numerical simulation could be an alternative method. The established model in this report can be applied to analyze the diffusion of high pressured hydrogen due to storage tank failure and the distribution of hydrogen in the simulation region can be predicted to a certain extent. By analysis of CFD simulation results, the influence of wind, temperature and nearby buildings on diffusion was obtained.
Theoretical models
The finite volume method is used to carry out the numerical calculation in this paper. High speed jet and high pressured hydrogen (not ideal gas) are the main difficulties in hydrogen diffusion simulation. The corresponding theories for transport and diffusion are as follows.
(1) Transportation equations
The model for diffusion of high pressured hydrogen due to storage tank failure is established using the Realizable k- model which is fit for jet problems. Some parameters in equations of the Realizable k- model are improved in order to solve the diffusion of high pressured hydrogen.
The modeled transport equations for k is:
( ) ( ) ( )t
j k b M
j j k j
kk ku G G Y
t x x x (2)
And for is:
2( ) ( ) ( )
1 2 1 3tu C S C C C G
j bt x x x kk vj j j (3)
And a real gas equation of hydrogen is used:
1 H
HH
pT
V (4)
Where RH,RAir are constants of hydrogen and air, respectively; =1.9155×10 6
K.Pa-1 . Compared with the NIST (National Institute of Standards and Technology) data, the results obtained from this equation has a relative error no more than 3.4% in the range of 173K<T<393K for high pressured hydrogen.
(2) Diffusion equations
Zhejiang University, P.R.China
- 15 -
The mass fraction Yi can be solved by the following equation:
( ) ( )ii i i
Y vY J Rt (5)
Where Ri is the production of specie i by reaction; iJ is the mass diffusion rate of i.
In turbulence flow, it can be simplified as
,
t
t
i i m i
c
J D YS (6)
Where µt denotes turbulence viscosity; Sct is Schmitt number.
(3) Energy equations
Turbulent heat transport is modeled using the concept of Reynolds�’ analogy to turbulent momentum transfer. The modeled energy equation is given by the following formula:
[ ] [( ) ( ) ]Prp t
i i eff hi i t j
c TE u E p k u St x x x ijT
(7)
Where E is the total energy, (Tij)eff is the deviatoric stress tensor.
Corresponding conclusions
Simulation results show that:
Fig.19 Contour of the mole fraction of H2
(Ambient temperature=230 K, t=2.0 s)
1) 2D and 3D model were established which can be applied to analyze the diffusion of high pressured hydrogen (as shown in Fig.19) due to storage tank failure and the distribution of hydrogen in the simulation region can be predicted to a certain extent by these model. The simulation results are visually displayed as shown in Fig. 20 and Fig. 21. The simulation results can provide reference for dealing with or preventing the leakage and diffusion of high-pressured hydrogen in hydrogen filling stations.

Zhejiang University, P.R.China
- 16 -
Fig.20 Contour of hydrogen distribution with side leakage
Fig.21 Contour of hydrogen distribution with top leakage
Zhejiang University, P.R.China
- 17 -
2) Different leaking position of the tank leads to different hazard region. When the leakage occurs at the side of hydrogen storage tank, the dangerous caused by the hazard regions on the ground are much larger than that occurs at the top by comparing Fig. 20 with Fig.21.
3) The transportation distances in the horizontal or vertical direction with large hole diameters are longer than those with small ones at the beginning of diffusion, and it grows slower later because the pressure in the tanks of larger diameters decline more quickly than that in the smaller ones.
4) The wind can accelerate the transportation rate of hazard regions in the horizontal direction, but weaken it in the vertical direction. The hazard region is huger with a lower wind velocity but exist for a shorter time because that the wind can accelerate the diffusion of hydrogen.
5) The ambient temperature affects the transportation of the hazard regions in the vertical and horizontal directions. And the transportation distance of hazard region increases with growing ambient temperature. The hazard region of hydrogen exists for a longer time with a lower ambient temperature.
6) The transportation distance of hazard region increases in the horizontal direction with increasing L (Lengths between leaking hole and obstacle) where there are obstacles in the downwind direction, but decreases in the vertical direction. Otherwise, the transportation distance of hazard region decreases in the horizontal direction with increasing H (Heights of the obstacle) but increases in the vertical direction.
5. The northern climate effect on the performance of composite fuel tanks
As an effective filling is required to be completed in a short time about 3 to 15 minutes, a fast filling is necessary which may lead to temperature rise and heterogeneity inside the cylinders. Taking the high temperature sensitivity of the composite materials into account, much works were done to study the temperature rise in the process of fast filling of hydrogen. Experimental and numerical approaches were adopted to investigate the temperature rise of hydrogen in fast filling process. According to the investigation on fast filling of hydrogen for composite storage cylinders, the low temperature of northern climate is advantaged for the safety issue related to H2 filling.
Theoretical analysis
Zhejiang University, P.R.China
- 18 -
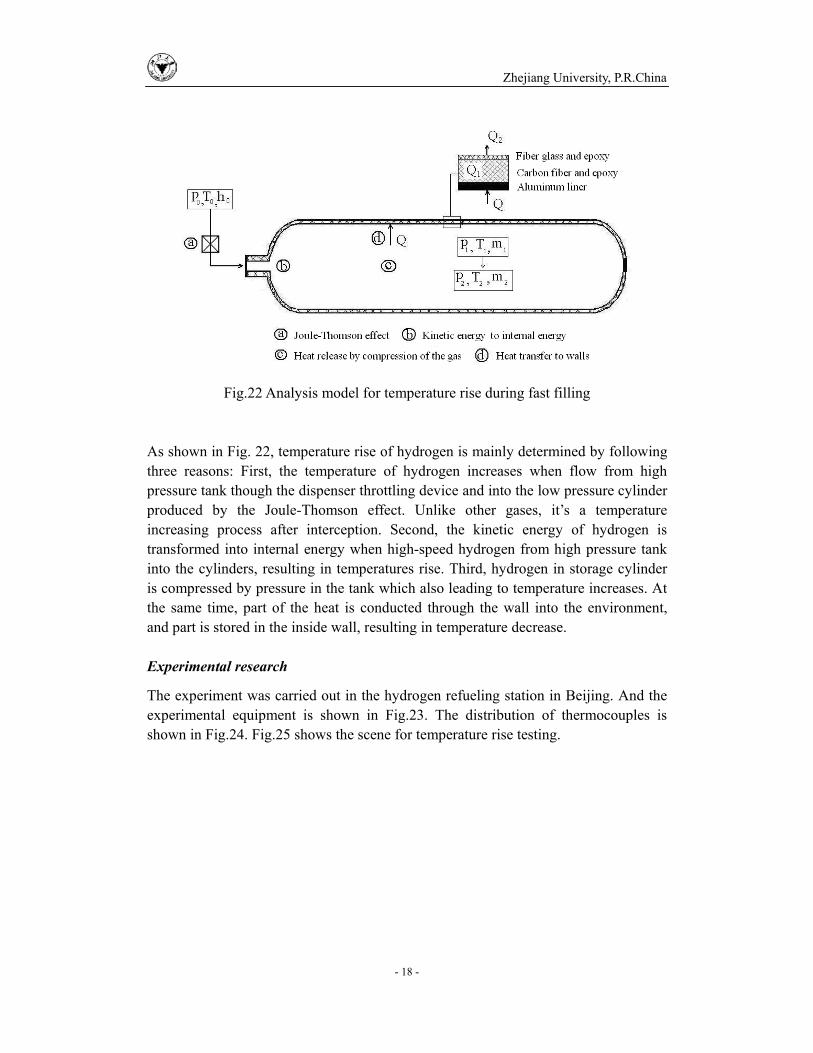
Fig.22 Analysis model for temperature rise during fast filling
As shown in Fig. 22, temperature rise of hydrogen is mainly determined by following three reasons: First, the temperature of hydrogen increases when flow from high pressure tank though the dispenser throttling device and into the low pressure cylinder produced by the Joule-Thomson effect. Unlike other gases, it�’s a temperature increasing process after interception. Second, the kinetic energy of hydrogen is transformed into internal energy when high-speed hydrogen from high pressure tank into the cylinders, resulting in temperatures rise. Third, hydrogen in storage cylinder is compressed by pressure in the tank which also leading to temperature increases. At the same time, part of the heat is conducted through the wall into the environment, and part is stored in the inside wall, resulting in temperature decrease.
Experimental research
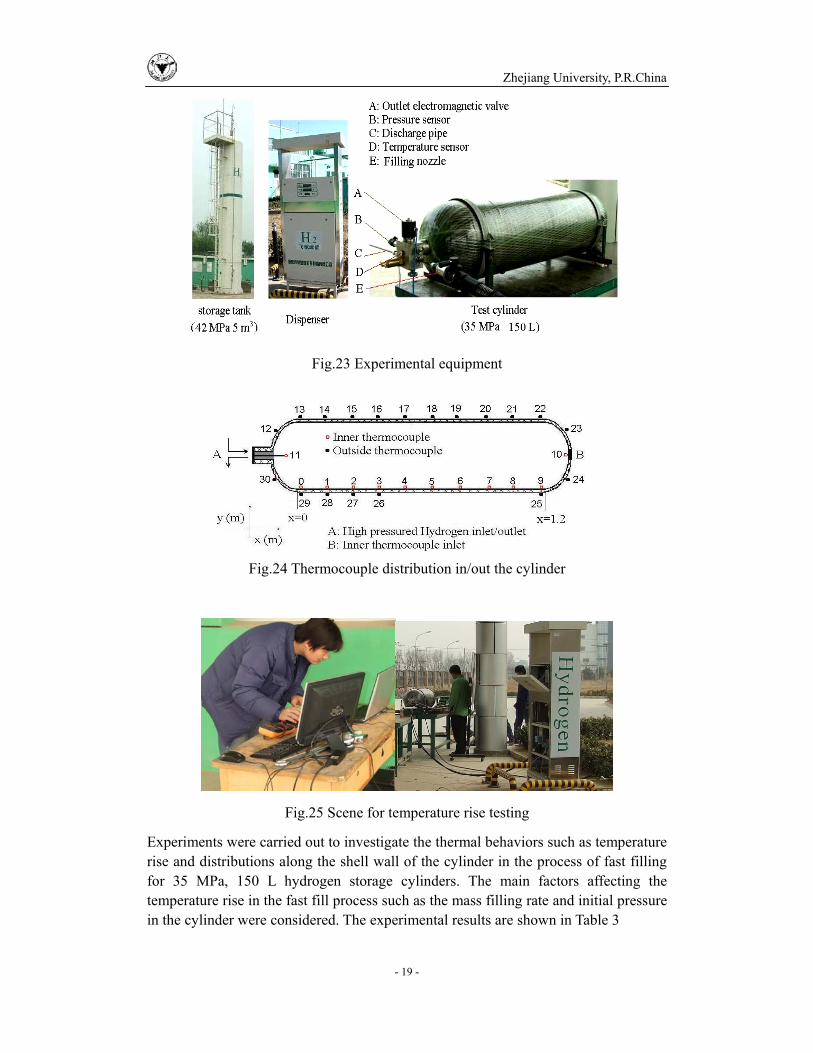
The experiment was carried out in the hydrogen refueling station in Beijing. And the experimental equipment is shown in Fig.23. The distribution of thermocouples is shown in Fig.24. Fig.25 shows the scene for temperature rise testing.
Zhejiang University, P.R.China
- 19 -
Fig.23 Experimental equipment
Fig.24 Thermocouple distribution in/out the cylinder
Fig.25 Scene for temperature rise testing
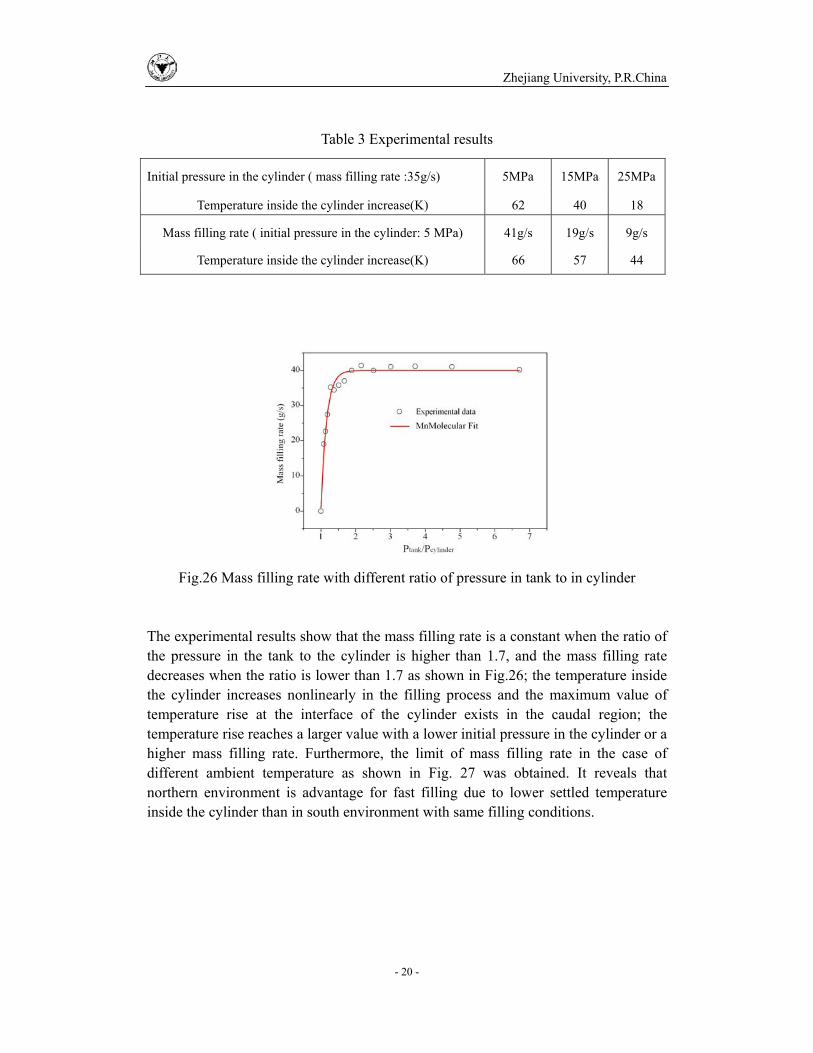
Experiments were carried out to investigate the thermal behaviors such as temperature rise and distributions along the shell wall of the cylinder in the process of fast filling for 35 MPa, 150 L hydrogen storage cylinders. The main factors affecting the temperature rise in the fast fill process such as the mass filling rate and initial pressure in the cylinder were considered. The experimental results are shown in Table 3
Zhejiang University, P.R.China
- 20 -
Table 3 Experimental results
Fig.26 Mass filling rate with different ratio of pressure in tank to in cylinder
The experimental results show that the mass filling rate is a constant when the ratio of the pressure in the tank to the cylinder is higher than 1.7, and the mass filling rate decreases when the ratio is lower than 1.7 as shown in Fig.26; the temperature inside the cylinder increases nonlinearly in the filling process and the maximum value of temperature rise at the interface of the cylinder exists in the caudal region; the temperature rise reaches a larger value with a lower initial pressure in the cylinder or a higher mass filling rate. Furthermore, the limit of mass filling rate in the case of different ambient temperature as shown in Fig. 27 was obtained. It reveals that northern environment is advantage for fast filling due to lower settled temperature inside the cylinder than in south environment with same filling conditions.
Initial pressure in the cylinder ( mass filling rate :35g/s) 5MPa 15MPa 25MPa
Temperature inside the cylinder increase(K) 62 40 18
Mass filling rate ( initial pressure in the cylinder: 5 MPa) 41g/s 19g/s 9g/s
Temperature inside the cylinder increase(K) 66 57 44

Zhejiang University, P.R.China
- 21 -
Fig.27 Mass filling rate limitation in case of different ambient temperature
Fig.28 Value of temperature rise from all the sensors in filling, steady
and discharging process
As shown in Fig. 28, it�’s a cooling process through the discharging process of the hydrogen storage cylinder in which the temperature rise may reach to -20 . If the ambient temperature is -30 , the temperature inside the cylinder may reach to about -50 . Although low temperature has no effect on the composite materials in the storage cylinder, it may be dangerous to others.
Numerical research
Theoretical models
(1) Energy equations
The modeled energy equation for hydrogen is given by the following formula:
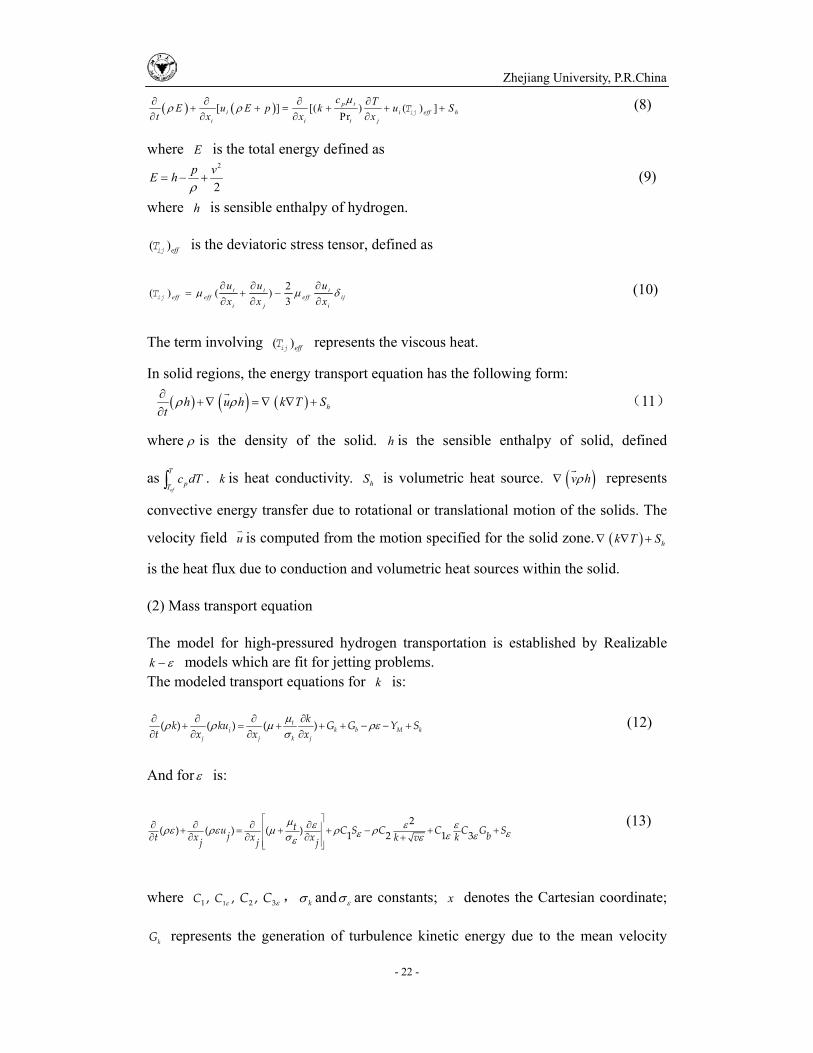
Zhejiang University, P.R.China
- 22 -
[ ] [( ) ( ) ]Prp t
i i eff hi i t j
c TE u E p k u St x x x ijT (8)
where E is the total energy defined as 2
2p vE h (9)
where h is sensible enthalpy of hydrogen.
( )effijT is the deviatoric stress tensor, defined as
2( ) ( )3
i i ieff eff eff ij
i j i
u u ux x xijT (10)
The term involving ( )effijT represents the viscous heat.
In solid regions, the energy transport equation has the following form:
hh u h k T St
11
where is the density of the solid. h is the sensible enthalpy of solid, defined
asef
T
pTc dT . k is heat conductivity. hS is volumetric heat source. v h represents
convective energy transfer due to rotational or translational motion of the solids. The
velocity field u is computed from the motion specified for the solid zone. hk T S
is the heat flux due to conduction and volumetric heat sources within the solid.
(2) Mass transport equation
The model for high-pressured hydrogen transportation is established by Realizable k models which are fit for jetting problems. The modeled transport equations for k is:
( ) ( ) ( )t
j k b M k
j j k j
kk ku G G Y S
t x x x (12)
And for is:
2( ) ( ) ( )
1 2 1 3tu C S C C C G S
j bt x x x kk vj j j
(13)
where 11 2 3, , , C C C C
kand are constants; x denotes the Cartesian coordinate;
kG represents the generation of turbulence kinetic energy due to the mean velocity

Zhejiang University, P.R.China
- 23 -
gradients, calculated as j
k i j
uG u u
x;
bG is the generation of turbulence kinetic
energy due to buoyancy, calculated asPrt
b i
t i
Gx
g ; MY represents the contribution
of the fluctuating dilatation in compressible turbulence to the overall dissipation rate,
calculated as 22M tY M , where
tM is the turbulent Mach number, defined as,
2t
kM
a, where a is the speed of sound; 1 max 0.43,
5C ; 3 tanh
vC
u;
kS
and S are user-defined source terms; defined as kS where 2
ij ijS S S ; is
the density of hydrogen; t is turbulence viscosity, defined as
2
t
kC , where
C is decided by mean strain and rotation rates, the angular velocity of the system
rotation and the turbulence fields( k and ).
(3) Continuity equations
The continuity equations for hydrogen flow is defined as
0i
i
ut x
(14)
Numerical results
A numerical method is proposed based on the finite volume method to investigate the thermal behavior such as temperature rise and distribution in the process of fast filling for the 15 L cylinder that designed by us. By numerical simulation, temperature, velocity and pressure distribution in the filling process are shown intuitively. Also,
Fig.29 Temperature distribution in simulation region (Mass velocity=1 g/s; T=20 s)
Fig.30 Contour of temperature distribution in different surfaces of the cylinder
Zhejiang University, P.R.China
- 24 -
temperature and velocity gradients in the axial direction are obtained. By simulation, the following conclusions are obtained: 1) in the fast filling process, the lowest temperature exists at inlet of hydrogen, and the highest exists around axis near the inlet as shown in Fig.17 and Fig.18. In axial direction, the temperature gradually increases with decreasing growing rates and the velocity of hydrogen decreases linearly. 2) The temperature rise increases almost linearly with increasing filling rate. 3) Although the pressure in the cylinder comes to the operating value, the weight of hydrogen in the cylinder does not meet the requirement due to the temperature rise in cylinders. So, the final pressure after filling should be raised in order to meet the weight requirement.
Journal paper 1. Liu Yan-lei , Zheng Jin-yang, Xu Ping, Zhao Yong-zhi, Liu Peng-fei, Bie Hai-yan,
Dryver Huston. Numerical simulation on the leakage and diffusion of hydrogen in the case of different parameters due to high-pressured storage tanks failure, Journal of loss prevention in the process industry, (doi:10.1016/j.jlp.2008.06.007) (In English, SCI)
2. Ping Xu, Jin-Yang Zheng, PengFei Liu, Rui Chen, Fangming Kai and Lei Li. Risk identification and control of stationary high-pressure hydrogen storage vessels, Journal of loss prevention in the process industry,(doi:10.1016/j.jlp.2008.08.008)(In English, SCI)
3. Liu Yan-lei, Zheng Jin-yang, Xu Ping, Zhao Yong-zhi, Liu Peng-fei, Chen Hong-gang. Numerical simulation on the influence of environment temperature on the leakage and diffusion of high pressured hydrogen due to storage tank failure, Journal of Engineering Thermophysics, 2008, 29(5):770-772(In Chinese, EI)
4. Liu Yan-lei , Zheng Jin-yang, Xu Ping, Zhao Yong-zhi, Liu Peng-fei, Bie Hai-yan. Numerical simulation of obstacle influence on the leakage and diffusion of hydrogen due to high-pressure storage tank failure Journal of Zhejiang University, 2008, 42(12):25-28. (In Chinese, EI)
5. Xu Ping, Liu Peng-fei, Liu Yan-lei, Jin-yang Zheng, Chen Hong-gang, Bie Hai-yan, Dryver Huston. Numerical study of the leakage and dispersion of hydrogen due to high-pressured storage tank failure in the case of various leaking locations, Journal of Chemical Engineering of Chinese Universities, 2008, 29(12) (In Chinese, EI)
6. Liu Yanlei, Xu Ping, Zheng Jinyang, Zhao Yongzhi, Chen Honggang, Deng Guide, Chen Rui. Numerical simulation on the dispersion of hydrogen and natrual gas due to high pressured pipeline failure. Acta energy solaris sinica, 2008,29(10):1250-1253(In Chinese, EI)
7. ZHENG Jin-yang, BIE Hai-yan,XU Ping,LIU Peng-fei,CHEN Hong-gang, Dryver Huston. Investigation on Standards of Fully-wrapped Composite Tanks for On-board Storage of High Pressure Hydrogen, Pressure Vessel Technology, 2007(11):48-56. (In Chinese)
Conference paper

Zhejiang University, P.R.China
- 25 -
1. Honggang Chen, Jinyang Zheng, Yanlei Liu, Ping Xu, Lei Li, Pengfei Liu, Haiyan Bie. Optimization of hydrogen utilization ratio in hydrogen filling stations, 2008 ASME Pressure Vessels and Piping Conference, Chicago, Illinois: July 27-31, 2008 (In English, EI)
2. Yanlei Liu, Jinyang Zheng, Ping Xu, Yongzhi Zhao, Lei Li, Pengfei Liu, Haiyan Bie, Honggang Chen, Dryver Huston, Xiaoyan Sun. Numerical simulation on fast filling of hydrogen for composite storage cylinders, 2008 ASME Pressure Vessels and Piping Conference , Chicago, Illinois: July 27-31, 2008 (In English, EI)
3. Haiyan Bie, Ping Xu, Jinyang Zheng, Fangming Kai, Pengfei Liu, Yanlei Liu, Honggang Chen. Influence of stress ratio on the reliability of Al/carbon �–fiber composite hydrogen tanks. 2008 ASME Pressure Vessels and Piping Conference, Chicago, Illinois: July 27-31, 2008 (In English, EI)
4. J.Y. Zheng, H.Y. Bie, P.F. Liu, Y.L.Liu, P. Xu, H.G. Chen. Fatigue Lifetime Evaluation of High Pressure Hydrogen Storage Vessel for Fuel Cell Vehicles. 2008 International hydrogen forum. Changsha, Hunan: August 2-3, 2008, (In English)
5. LIU Yan-lei, ZHENG Jin-yang, XU Ping, ZHAO Yong-zhi, CHEN Hong-gang, BIE Hai-yan. Numerical simulation on hydrogen fast filling for 150L composite cylinders. 2008 International hydrogen forum. Changsha, Hunan: August 2-3, 2008, (In English)
6. Sun,Xiao-yan, Dryver R. Huston, Qin,Quan, Chen,Yong, Zheng,Jin-yang, Wang,Xin. Damage detection and leakage alert of fiber composite wrapped tank for high pressure hydrogen storage. SPIE Smart Structures/NDE. March 2008. (In English)
7. Yong Chen, Senyuan Tian, Bingnan Sun, Xiaoyan Sun, Dryver R. Huston. Experimental study on decision fusion of many damage detection methods with multi-resolution. SPIE Smart Structures/NDE. March 2008. (In English)

Appendix B �– Evermont�’s Hydrogen Generation and Storage Facility: Electrical Energy Consumption eVermont Final Report

Electrical Energy Consumption
October 2008

Page 2 of 21
Table of Content
Introduction .............................................................. .3 Site Description ........................................................ .5
Physical Location ........................................... .5 Process Description ........................................ .5
H2 Station Operations .............................................. .7
Water Use ....................................................... .7 Energy Use ..................................................... .8
Station Components ................................................. .9
Electrolyzer .................................................... .9 Electrolyzer Heat Exchanger ......................... 10 Compressor .................................................... 10 Compressor Heat Exchanger .......................... 10
Station Electrical Measurements .............................. 11
BED Data ....................................................... 12 SmartView Data ............................................. 13 March 20, 2008 Manual Measurements ........ 15
Station Electrical Consumption ................................ 16 Wind Turbine Operations ......................................... 17 Discussion ................................................................ 19 Recommendations .................................................... 20

Page 3 of 21
Introduction The Transportation Sector is responsible for 28% of national energy consumption (Transportation Energy Data Book, U. S. Department of Energy, 2005), 43% of the conventional air pollution regulated under the federal Clean Air Act (U. S. Environmental Protection Agency, National Air Quality and Emissions Trends Report, 2003 Special Studies Edition), and 33% of national Greenhouse Gas emissions (U. S. Environmental Protection Agency, 2007 Draft Greenhouse Gas Inventory Report, 2007): in other words, the activity of transportation is central to major energy and environmental issues facing our nation. Compounding this, one fuel, petroleum, constitutes 96% of transportation energy. Petroleum derived motor fuel is finite in nature. It requires large-scale intrusive resource extraction procedures that make the crude resource available to industrial chemical processing facilities. These centralized facilities produce a highly refined product that is stored, transported, stored again, and then distributed at the wholesale and retail level. At every step in this process and distribution network there are emissions to the environment that represent a threat to human health and the health of the environment. For sustainability in the transportation sector, a carbon-free, clean and renewable fuel is needed. A fuel with these characteristics can be hydrogen. Hydrogen is an abundant form of energy, but unlike petroleum is a secondary form of energy, an energy carrier, rather than a primary form of energy. As such, how hydrogen is produced, determines it attributes of cleanliness and sustainability. Further to hydrogen providing transportation energy is the issue of the vehicle technology which the hydrogen will power.
Scientific American, September 2006 Special Issue). To be realized, a hydrogen economy has to overcome two major hurdles at once; it not only requires vehicles that operate on hydrogen, it also requires the infrastructure to produce and deliver the hydrogen. Additionally, as new and different technologies and fuels are brought to consumers, consumers need to become familiar and comfortable with new and different re-fueling dispensers and automotive technicians need to be trained in proper procedures for handling the fuel and servicing the vehicles that operate on this fuel. Fuel cell vehicles are thought to the vehicle technology of the future. While much progress has been made advancing this technology, the reality is that it may be decades away from being a
them. Given that fuel cell vehicles will not be available for decades, and they will need a whole new infrastructure to support them, which takes years to construct, how is it justified to begin to build this infrastructure when its use is uncertain, or is sufficiently far into the future? A technological bridge is needed: A technology that justifies the investment in infrastructure, by using that infrastructure today to make incremental progress toward the ultimate goal.

Page 4 of 21
As a step toward this technological bridge, and sponsored by the DOE EERE Hydrogen, Fuel Cells & Infrastructure Technologies (HFC&IT) Program, EVermont has developed and built a unique wind to wheels energy conversion unit that addresses the dual challenges of building energy for sustainability in the transportation sector. It looks at energy use through the lens of local, decentralized production and use, based upon a renewable form of energy and non-toxic, non-polluting processes. An overview of this system is presented in Figure 1.
Figure 1. "Wind to Wheels" schematic. The fueling station produces hydrogen from the electrolysis of water. The hydrogen is stored as a compressed gas and is available for dispensing to a vehicle The station is capable of sub-zero ( F) operation. The first vehicle is a Toyota Prius, modified by Quantum, Inc. to burn hydrogen as a replacement for motor gasoline. The vehicle validates the ability to use hydrogen as a transportation fuel in cold climates. . This fundamental research project has successfully proven the concepts that electrolysis can be used in cold climates to produce hydrogen, that wind power can provide the energy required by the electrolyzer and compressors required, that hydrogen can be utilized as an energy carrier for motor vehicles even in cold climates, and that a vehicle which consumes the hydrogen can be used in challenging conditions with little or no added attention by the operator. These are all pertinent issues to the image of nation-wide use of hydrogen fuel in the US transportation system. Commercial partners of the project have incorporated many improvements into their second generation products based on this project. In this project, the individual components of

Page 5 of 21
the system to produce the hydrogen, their energy consumption and how the hydrogen production systems matches with the electricity created by the associated wind turbine is considered. Site Description Physical location The production and refueling station is located off 545 Pine Street in Burlington, Vermont,
Figure 2. Aerial view of the hydrogen generation and dispensing facility and associated wind turbine. Initial construction of the station was begun in the fall of 2005, with the station commencing initial operation in the spring of 2006. A formal opening of the station was held on July 3, 2006. Process Description The onsite components of the system are laid out in Figure 3, and consist of four sub-systems:1)
Lat: N 44o 27.7922
Lon: W 73o12.9829
H2 Station
Wind Turbine
Figure 3: System Block Diagram; Onsite Components.
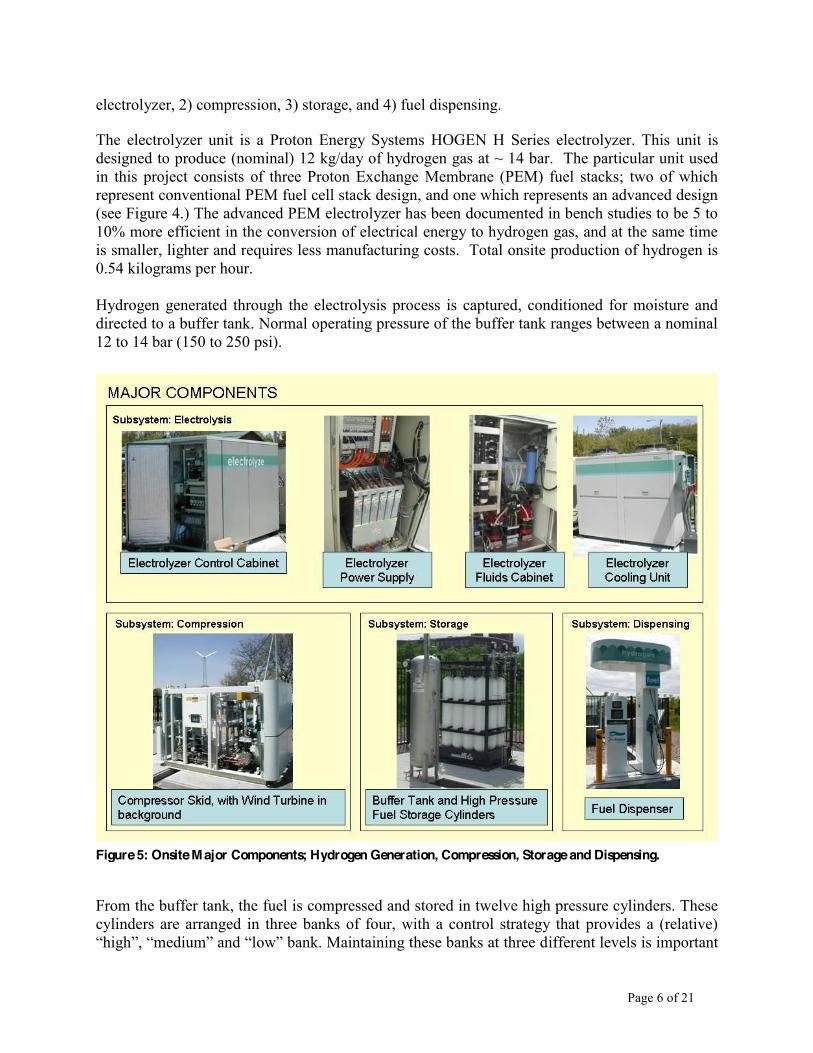
Page 6 of 21
electrolyzer, 2) compression, 3) storage, and 4) fuel dispensing. The electrolyzer unit is a Proton Energy Systems HOGEN H Series electrolyzer. This unit is designed to produce (nominal) 12 kg/day of hydrogen gas at ~ 14 bar. The particular unit used in this project consists of three Proton Exchange Membrane (PEM) fuel stacks; two of which represent conventional PEM fuel cell stack design, and one which represents an advanced design (see Figure 4.) The advanced PEM electrolyzer has been documented in bench studies to be 5 to 10% more efficient in the conversion of electrical energy to hydrogen gas, and at the same time is smaller, lighter and requires less manufacturing costs. Total onsite production of hydrogen is 0.54 kilograms per hour. Hydrogen generated through the electrolysis process is captured, conditioned for moisture and directed to a buffer tank. Normal operating pressure of the buffer tank ranges between a nominal 12 to 14 bar (150 to 250 psi).
From the buffer tank, the fuel is compressed and stored in twelve high pressure cylinders. These cylinders are arranged in three banks of four, with a control strategy that provides a (relative)
ifferent levels is important
Figure 5: Onsite Major Components; Hydrogen Generation, Compression, Storage and Dispensing.
Page 7 of 21
to fuel management and vehicle refueling, as the compressor design is to maintain the storage tanks and is not used to fuel the vehicle. Hydrogen gas storage is provided at a nominal 5000 psig (350 bar). Fuel storage and dispensing equipment is an Air Products Series 200 Hydrogen fueler. The unit dispenses fuel to a 5000 psig vehicle storage system. It is capable of delivering fuel to a vehicle fitted with a California Fuel Cell Partnership (CaFCP) communication protocol for Communications fills are temperature compensated and result in more consistent fuelling of the vehicle. The dispenser pressure. Normal dispenser display reports the mass of fuel dispensed, and has memory capacity to retain details of each of the last seventeen re-fueling events. These details include date and time fueling is initiated, pressure of vehicle fuel tank immediately prior to the addition of fuel, date and time fueling is completed, the pressure of vehicle tanks at fueling completion and the mass of fuel dispensed. The dispenser has the capability of being remotely access by telephone modem for the acquisition of these data as well as dispenser diagnostics and software upgrades. H2 Station Operations The primary inputs to the generation/refueling station are water and electricity. The only on-site waste generation is a stream of mineral enhanced water from water treatment system. The fundamental chemical equation which governs the generation of hydrogen from water is:
2H2O 2H2 + O2 In this process it is the H2 that is interest. It is captured and stored as a compressed gas. Given the small scale and demonstration nature of the project, the O2 gas is not captured or used: it vented to the atmosphere. It is possible that in a commercial operation, with the right set of conditions, this gas cold be an economic resource. Water Use As presented in Figure 3, the design water input to the hydrogen generation process is 720 liters per day. The source of this water is the potable water supply system for the City of Burlington. This water needs to be conditioned prior to being presented to the PEM electrolysis process. This is accomplished through the use of an ELGA PURELAB Options-S water conditioning system. The unit is a mixed-bed ion exchange using strongly basic anion exchange resins. The system is designed to process potable water to a water conductivity of 1.0 to 0.1 micro-seimens per
1. At design conditions, of the 720 liters provided to the reverse osmosis process, 144 liters of water are produced that meet the required treatment level and 576 liters discharged to drain. The 144 liters that are directed to the hydrogen generation unit are the feedstock for the production on the 12 kilograms of hydrogen gas.
--- 1. Electrical conductivity is the ability of a material to carry electrical current. In water, it is generally used as a measure of the mineral or other ionic concentration. Conductivity is a measure of the purity of water or the concentration of ionized chemicals in water.
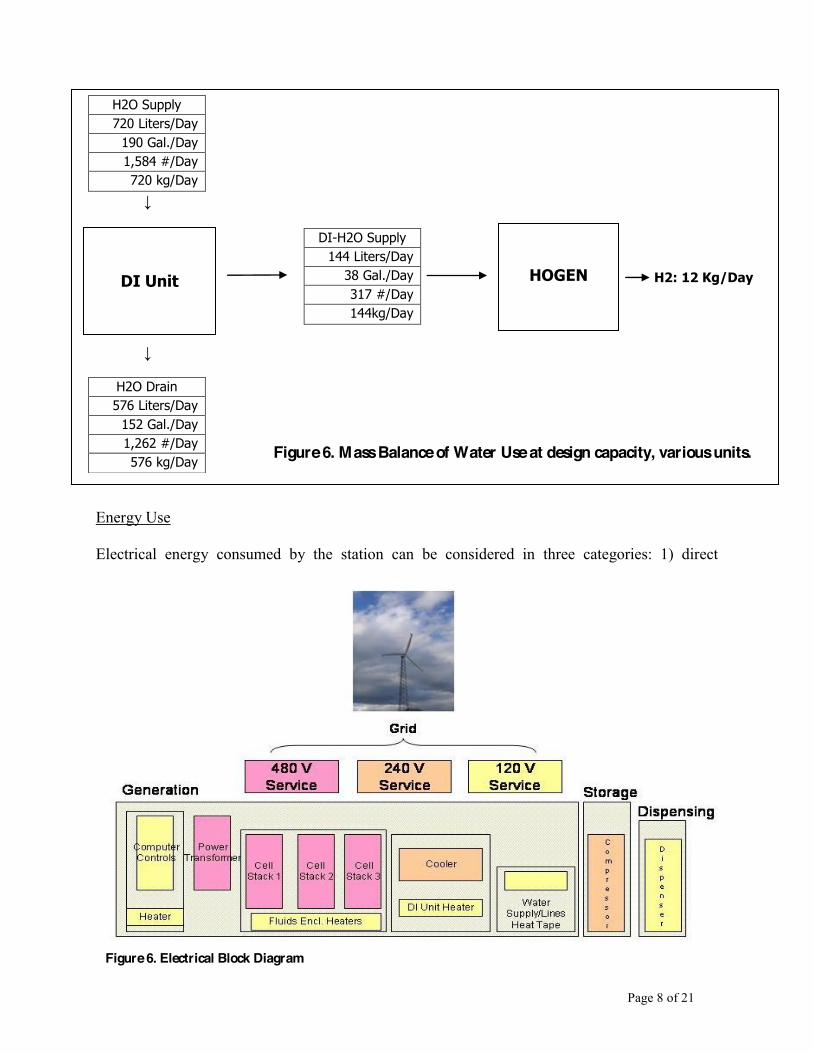
Page 8 of 21
Figure 6. Mass Balance of Water Use at design capacity, various units.
Figure 6. Electrical Block Diagram
H2O Supply 720 Liters/Day 190 Gal./Day 1,584 #/Day 720 kg/Day
DI-H2O Supply 144 Liters/Day 38 Gal./Day 317 #/Day 144kg/Day
Energy Use Electrical energy consumed by the station can be considered in three categories: 1) direct
H2O Drain 576 Liters/Day 152 Gal./Day 1,262 #/Day 576 kg/Day
H2: 12 Kg/Day
DI Unit
HOGEN
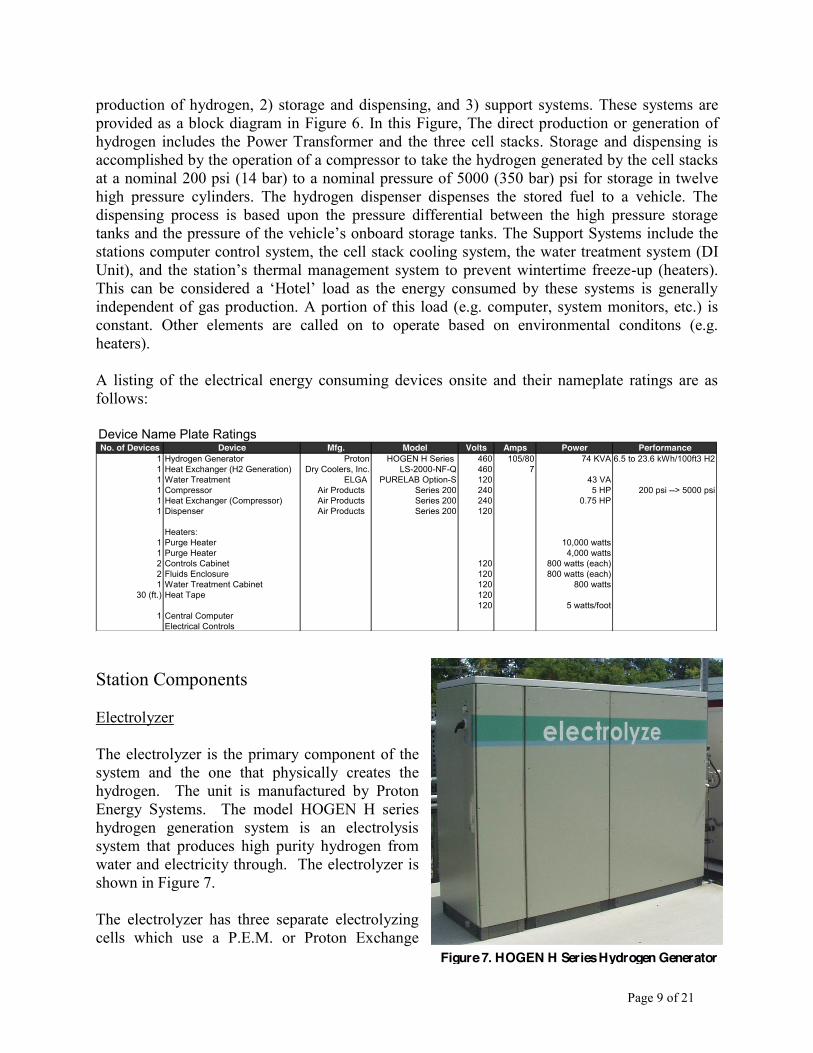
Page 9 of 21
production of hydrogen, 2) storage and dispensing, and 3) support systems. These systems are provided as a block diagram in Figure 6. In this Figure, The direct production or generation of hydrogen includes the Power Transformer and the three cell stacks. Storage and dispensing is accomplished by the operation of a compressor to take the hydrogen generated by the cell stacks at a nominal 200 psi (14 bar) to a nominal pressure of 5000 (350 bar) psi for storage in twelve high pressure cylinders. The hydrogen dispenser dispenses the stored fuel to a vehicle. The dispensing process is based upon the pressure differential between the high pressure storage
The Support Systems include the stations computer control system, the cell stack cooling system, the water treatment system (DI
-up (heaters).
independent of gas production. A portion of this load (e.g. computer, system monitors, etc.) is constant. Other elements are called on to operate based on environmental conditons (e.g. heaters). A listing of the electrical energy consuming devices onsite and their nameplate ratings are as follows: Device Name Plate RatingsNo. of Devices Device Mfg. Model Volts Amps Power Performance
1 Hydrogen Generator Proton HOGEN H Series 460 105/80 74 KVA16.5 to 23.6 kWh/100ft3 H21 Heat Exchanger (H2 Generation) Dry Coolers, Inc. LS-2000-NF-Q 460 71 Water Treatment ELGA PURELAB Option-S 120 43 VA1 Compressor Air Products Series 200 240 5 HP 200 psi --> 5000 psi1 Heat Exchanger (Compressor) Air Products Series 200 240 0.75 HP1 Dispenser Air Products Series 200 120
Heaters:1 Purge Heater 10,000 watts1 Purge Heater 4,000 watts2 Controls Cabinet 120 800 watts (each)2 Fluids Enclosure 120 800 watts (each)1 Water Treatment Cabinet 120 800 watts
30 (ft.) Heat Tape 120120 5 watts/foot
1 Central ComputerElectrical Controls
Station Components Electrolyzer The electrolyzer is the primary component of the system and the one that physically creates the hydrogen. The unit is manufactured by Proton Energy Systems. The model HOGEN H series hydrogen generation system is an electrolysis system that produces high purity hydrogen from water and electricity through. The electrolyzer is shown in Figure 7. The electrolyzer has three separate electrolyzing cells which use a P.E.M. or Proton Exchange
Figure 7. HOGEN H Series Hydrogen Generator
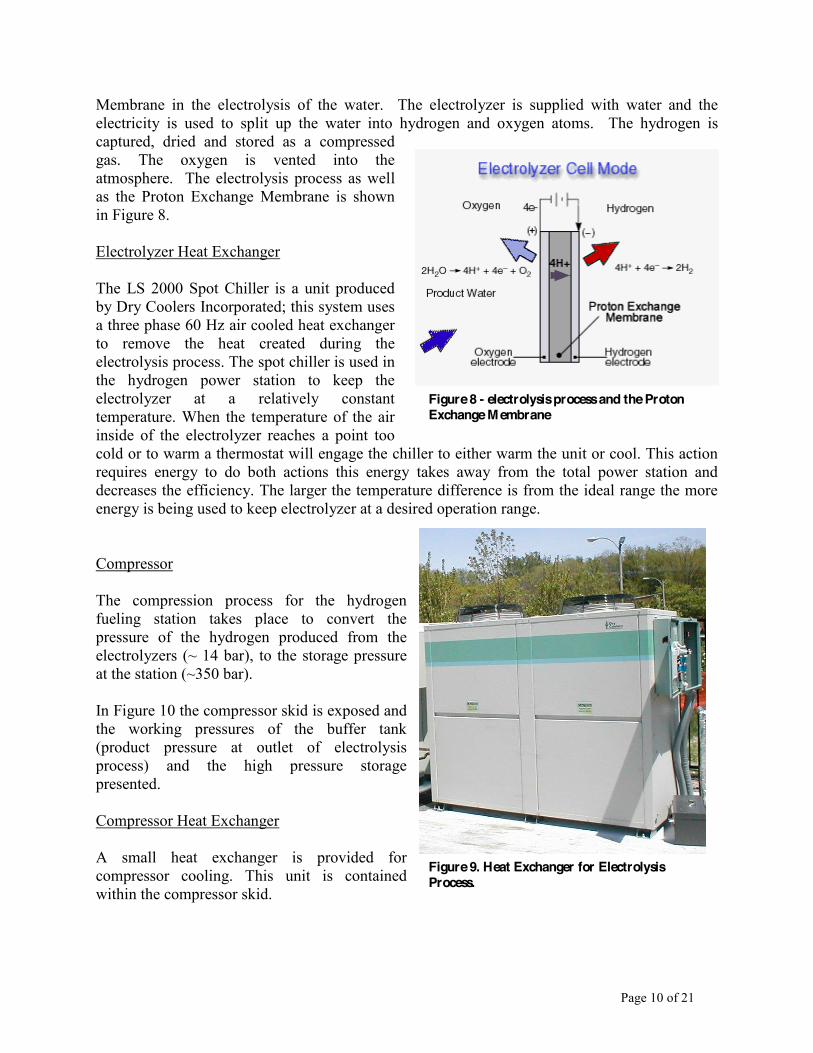
Page 10 of 21
Membrane in the electrolysis of the water. The electrolyzer is supplied with water and the electricity is used to split up the water into hydrogen and oxygen atoms. The hydrogen is captured, dried and stored as a compressed gas. The oxygen is vented into the atmosphere. The electrolysis process as well as the Proton Exchange Membrane is shown in Figure 8. Electrolyzer Heat Exchanger The LS 2000 Spot Chiller is a unit produced by Dry Coolers Incorporated; this system uses a three phase 60 Hz air cooled heat exchanger to remove the heat created during the electrolysis process. The spot chiller is used in the hydrogen power station to keep the electrolyzer at a relatively constant temperature. When the temperature of the air inside of the electrolyzer reaches a point too cold or to warm a thermostat will engage the chiller to either warm the unit or cool. This action requires energy to do both actions this energy takes away from the total power station and decreases the efficiency. The larger the temperature difference is from the ideal range the more energy is being used to keep electrolyzer at a desired operation range. Compressor The compression process for the hydrogen fueling station takes place to convert the pressure of the hydrogen produced from the electrolyzers (~ 14 bar), to the storage pressure at the station (~350 bar). In Figure 10 the compressor skid is exposed and the working pressures of the buffer tank (product pressure at outlet of electrolysis process) and the high pressure storage presented. Compressor Heat Exchanger A small heat exchanger is provided for compressor cooling. This unit is contained within the compressor skid.
Figure 8 - electrolysis process and the Proton Exchange Membrane
Figure 9. Heat Exchanger for Electrolysis Process.

Page 11 of 21
Figure 10. Compressor Skid The high pressure storage system is comprised of twelve gas cylinders each capable of storing one kilogram (nominal) of hydrogen at 5000 psi (nominal). To manage the vehicle refueling process, the twelve cylinders are arranged in three banks based on relative pressure: high and medium and low. As fuel is transferred to the vehicle based on pressure differential, not by means
maintain a constant 5000 psi (nominal) in the high pressure bank to ensure consistent fills of all vehicles. To manage the temperature of the compressor, a small heat exchanger (compressor cooling unit) extracts heat from the compressor created during the process of compressing the gas from the (nominal) 200 psi pressure of the buffer tank to the (nominal) 5000 psi storage tanks. This heat exchanger is manufactured by ALE Hydraulic Machinery, and utilizes a Leeson Washguard AC motor to power the fan and the coolant pump. The motor is rated as a 3/4 horsepower motor at 1725 revolutions per a minute, which translates to 0.56 Kilowatts. Station Electrical Measurements Three sets of electrical energy data are available. One is of total energy use by the station. These data are connects to the electrical grid. Electrical energy use is metered at this point with a market grade meter maintained by the Burlington Electric Department (BED). Data are recorded on total electrical consumption on a 15 minute basis. The second set of data available is This system is known as SmartView. SmartView continuously monitors key operational
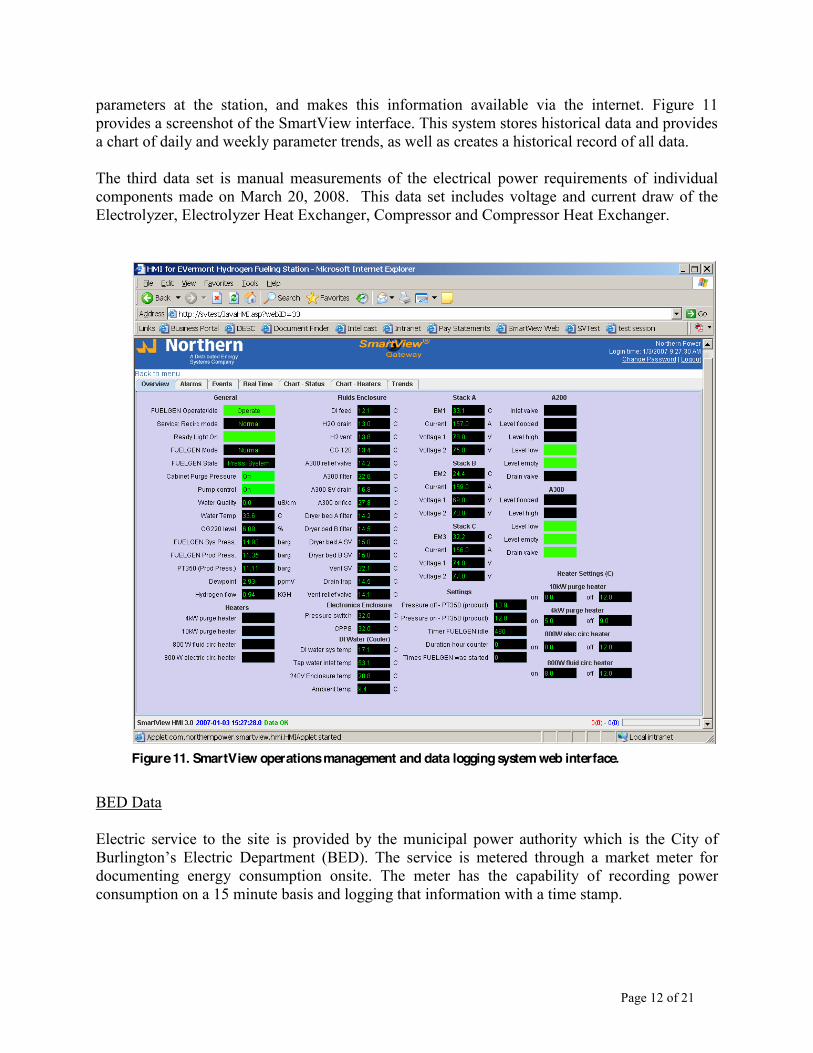
Page 12 of 21
parameters at the station, and makes this information available via the internet. Figure 11 provides a screenshot of the SmartView interface. This system stores historical data and provides a chart of daily and weekly parameter trends, as well as creates a historical record of all data. The third data set is manual measurements of the electrical power requirements of individual components made on March 20, 2008. This data set includes voltage and current draw of the Electrolyzer, Electrolyzer Heat Exchanger, Compressor and Compressor Heat Exchanger. BED Data Electric service to the site is provided by the municipal power authority which is the City of
documenting energy consumption onsite. The meter has the capability of recording power consumption on a 15 minute basis and logging that information with a time stamp.
Figure 11. SmartView operations management and data logging system web interface.
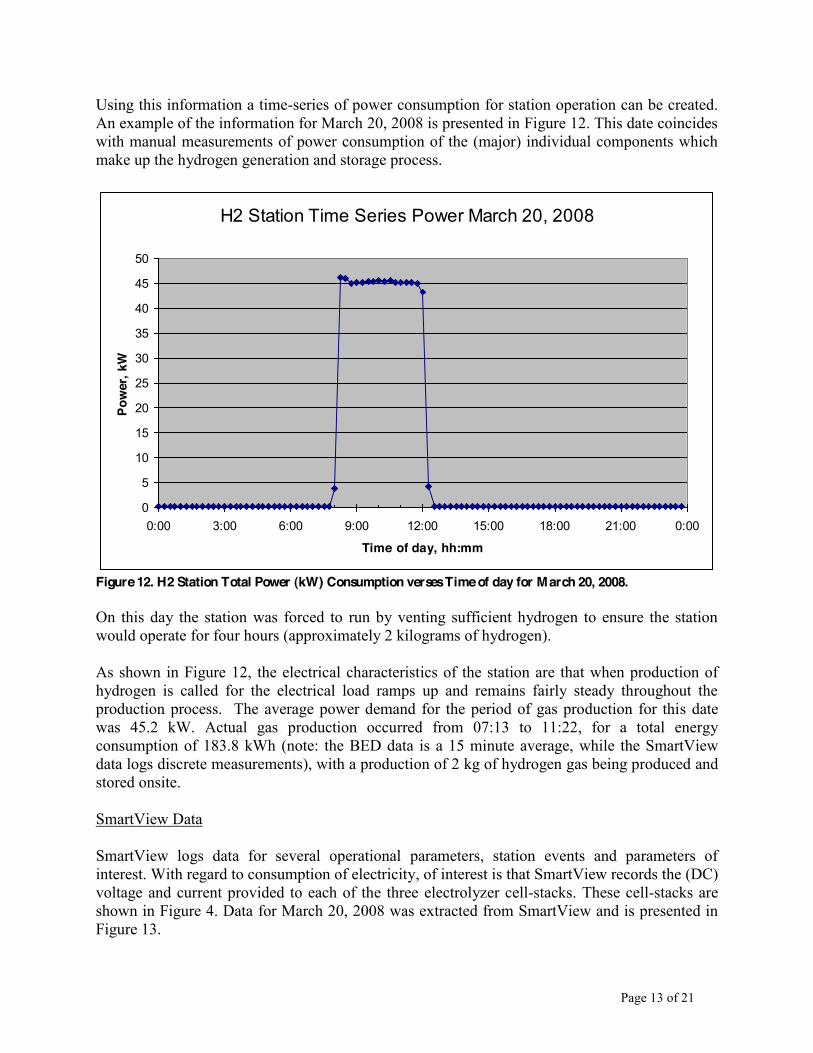
Page 13 of 21
Using this information a time-series of power consumption for station operation can be created. An example of the information for March 20, 2008 is presented in Figure 12. This date coincides with manual measurements of power consumption of the (major) individual components which make up the hydrogen generation and storage process.
H2 Station Time Series Power March 20, 2008
0
5
10
15
20
25
30
35
40
45
50
0:00 3:00 6:00 9:00 12:00 15:00 18:00 21:00 0:00
Time of day, hh:mm
Pow
er, k
W
Figure 12. H2 Station Total Power (kW) Consumption verses Time of day for March 20, 2008. On this day the station was forced to run by venting sufficient hydrogen to ensure the station would operate for four hours (approximately 2 kilograms of hydrogen). As shown in Figure 12, the electrical characteristics of the station are that when production of hydrogen is called for the electrical load ramps up and remains fairly steady throughout the production process. The average power demand for the period of gas production for this date was 45.2 kW. Actual gas production occurred from 07:13 to 11:22, for a total energy consumption of 183.8 kWh (note: the BED data is a 15 minute average, while the SmartView data logs discrete measurements), with a production of 2 kg of hydrogen gas being produced and stored onsite. SmartView Data SmartView logs data for several operational parameters, station events and parameters of interest. With regard to consumption of electricity, of interest is that SmartView records the (DC) voltage and current provided to each of the three electrolyzer cell-stacks. These cell-stacks are shown in Figure 4. Data for March 20, 2008 was extracted from SmartView and is presented in Figure 13.

Page 14 of 21
Figure 13. Power Consumption (kW) of Cell-Stacks A, B and C. March 20, 2008
Figure 14. Power Consumption summed for the three cell stacks, March 20, 2008.
Power Consumption (kW), Individual Cell-Stacks March 20, 2008
10
10.5
11
11.5
12
12.5
13
13.5
6:00 7:30 9:00 10:30 12:00
Time of Day (hh:mm)
Indi
vidu
al C
ell-S
tack
sPo
wer
Con
sum
ptio
n (k
W)
Stack A_Calc. Power, kWStack B_Calc. Power, kWStack C_Calc. Power, kW
Power Consumption (kW), Sum of Individual Cell-Stacks March 20, 2008
8
13
18
23
28
33
38
43
6:00 7:30 9:00 10:30 12:00
Time of Day (hh:mm)
Sum
m o
f Ind
ivid
ual C
ell-S
tack
sPo
wer
Con
sum
ptio
n (k
W)
(Sum A/B/C)
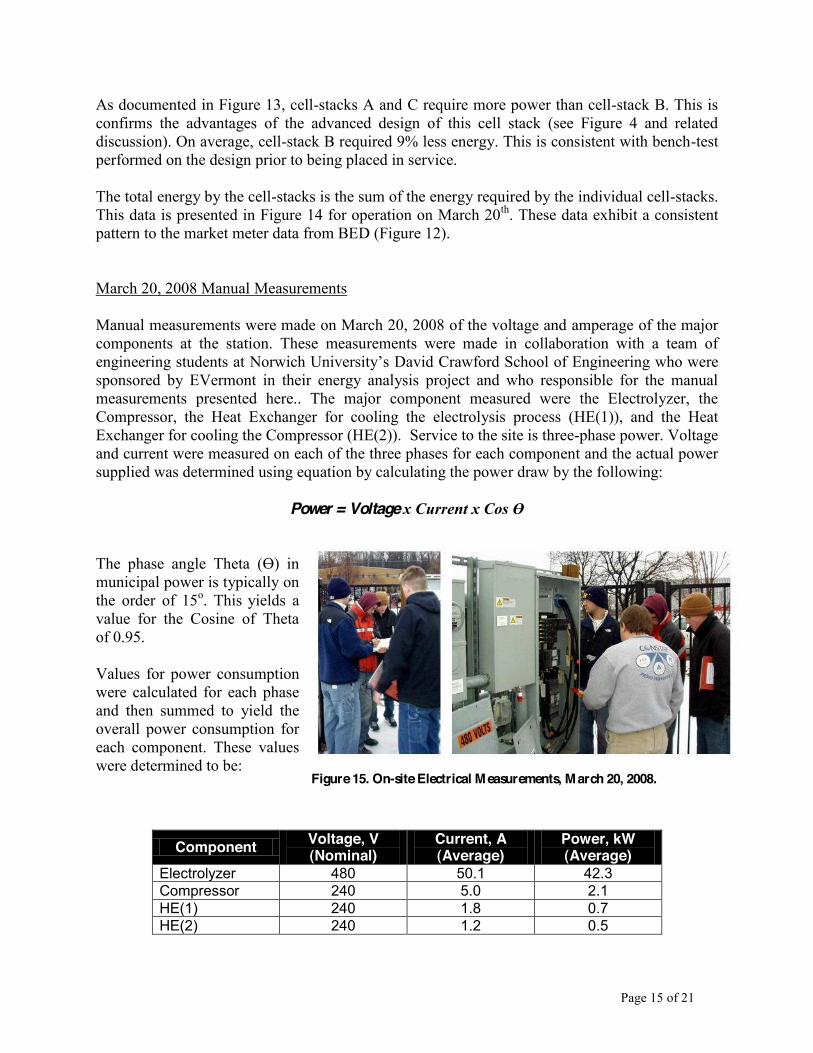
Page 15 of 21
As documented in Figure 13, cell-stacks A and C require more power than cell-stack B. This is confirms the advantages of the advanced design of this cell stack (see Figure 4 and related discussion). On average, cell-stack B required 9% less energy. This is consistent with bench-test performed on the design prior to being placed in service. The total energy by the cell-stacks is the sum of the energy required by the individual cell-stacks. This data is presented in Figure 14 for operation on March 20th. These data exhibit a consistent pattern to the market meter data from BED (Figure 12). March 20, 2008 Manual Measurements Manual measurements were made on March 20, 2008 of the voltage and amperage of the major components at the station. These measurements were made in collaboration with a team of
David Crawford School of Engineering who were sponsored by EVermont in their energy analysis project and who responsible for the manual measurements presented here.. The major component measured were the Electrolyzer, the Compressor, the Heat Exchanger for cooling the electrolysis process (HE(1)), and the Heat Exchanger for cooling the Compressor (HE(2)). Service to the site is three-phase power. Voltage and current were measured on each of the three phases for each component and the actual power supplied was determined using equation by calculating the power draw by the following:
Power = Voltage
The phase angle Theta in municipal power is typically on the order of 15o. This yields a value for the Cosine of Theta of 0.95. Values for power consumption were calculated for each phase and then summed to yield the overall power consumption for each component. These values were determined to be:
Component Voltage, V (Nominal)
Current, A (Average)
Power, kW (Average)
Electrolyzer 480 50.1 42.3 Compressor 240 5.0 2.1 HE(1) 240 1.8 0.7 HE(2) 240 1.2 0.5
Figure 15. On-site Electrical Measurements, March 20, 2008.
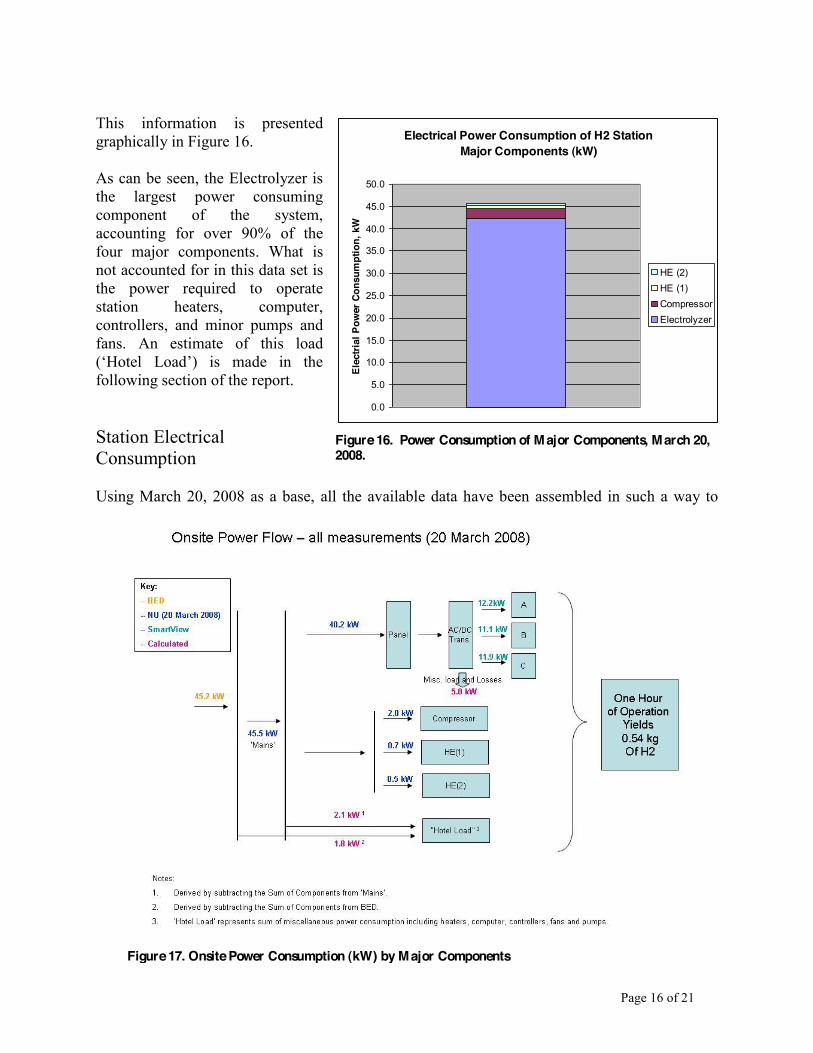
Page 16 of 21
This information is presented graphically in Figure 16. As can be seen, the Electrolyzer is the largest power consuming component of the system, accounting for over 90% of the four major components. What is not accounted for in this data set is the power required to operate station heaters, computer, controllers, and minor pumps and fans. An estimate of this load
following section of the report. Station Electrical Consumption Using March 20, 2008 as a base, all the available data have been assembled in such a way to
Electrical Power Consumption of H2 Station Major Components (kW)
0.0
5.0
10.0
15.0
20.0
25.0
30.0
35.0
40.0
45.0
50.0
Elec
trial
Pow
er C
onsu
mpt
ion,
kW
HE (2)HE (1)CompressorElectrolyzer
Figure 16. Power Consumption of Major Components, March 20, 2008.
Figure 17. Onsite Power Consumption (kW) by Major Components
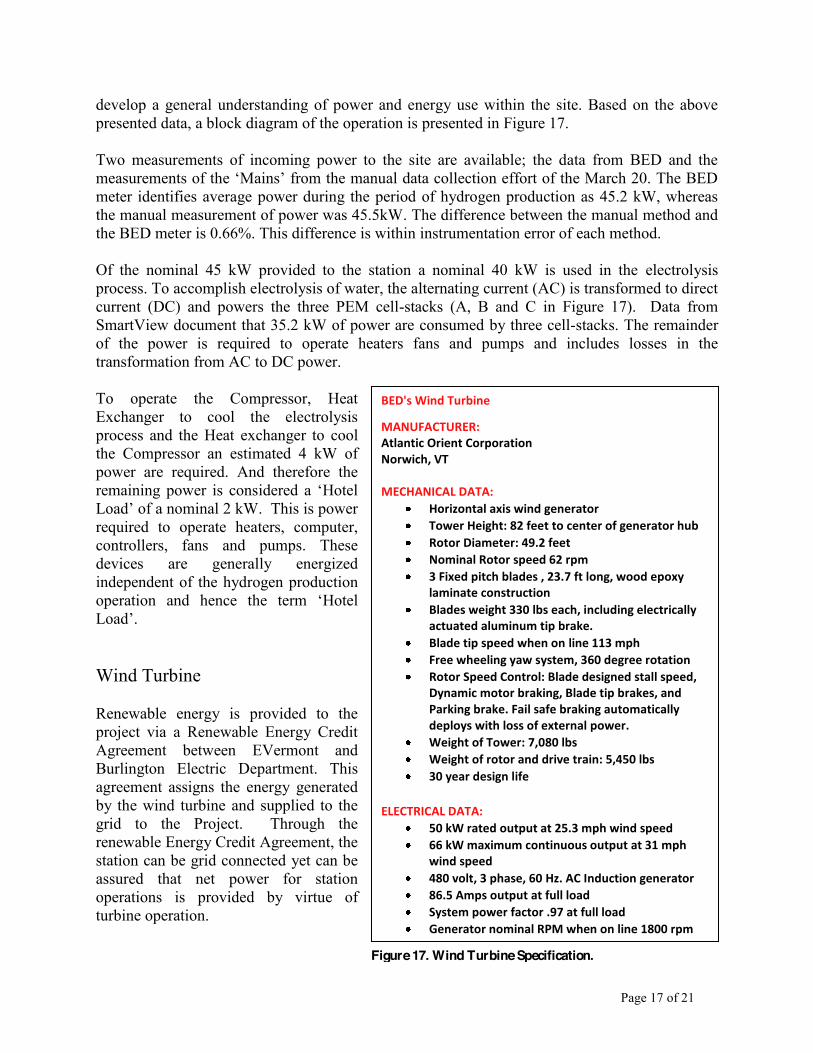
Page 17 of 21
develop a general understanding of power and energy use within the site. Based on the above presented data, a block diagram of the operation is presented in Figure 17. Two measurements of incoming power to the site are available; the data from BED and the
meter identifies average power during the period of hydrogen production as 45.2 kW, whereas the manual measurement of power was 45.5kW. The difference between the manual method and the BED meter is 0.66%. This difference is within instrumentation error of each method. Of the nominal 45 kW provided to the station a nominal 40 kW is used in the electrolysis process. To accomplish electrolysis of water, the alternating current (AC) is transformed to direct current (DC) and powers the three PEM cell-stacks (A, B and C in Figure 17). Data from SmartView document that 35.2 kW of power are consumed by three cell-stacks. The remainder of the power is required to operate heaters fans and pumps and includes losses in the transformation from AC to DC power. To operate the Compressor, Heat Exchanger to cool the electrolysis process and the Heat exchanger to cool the Compressor an estimated 4 kW of power are required. And therefore the
required to operate heaters, computer, controllers, fans and pumps. These devices are generally energized independent of the hydrogen production
Wind Turbine Renewable energy is provided to the project via a Renewable Energy Credit Agreement between EVermont and Burlington Electric Department. This agreement assigns the energy generated by the wind turbine and supplied to the grid to the Project. Through the renewable Energy Credit Agreement, the station can be grid connected yet can be assured that net power for station operations is provided by virtue of turbine operation.
BED's Wind Turbine
MANUFACTURER: Atlantic Orient Corporation Norwich, VT MECHANICAL DATA:
Horizontal axis wind generator Tower Height: 82 feet to center of generator hub Rotor Diameter: 49.2 feet Nominal Rotor speed 62 rpm 3 Fixed pitch blades , 23.7 ft long, wood epoxy
laminate construction Blades weight 330 lbs each, including electrically
actuated aluminum tip brake. Blade tip speed when on line 113 mph Free wheeling yaw system, 360 degree rotation Rotor Speed Control: Blade designed stall speed,
Dynamic motor braking, Blade tip brakes, and Parking brake. Fail safe braking automatically deploys with loss of external power.
Weight of Tower: 7,080 lbs Weight of rotor and drive train: 5,450 lbs 30 year design life
ELECTRICAL DATA: 50 kW rated output at 25.3 mph wind speed 66 kW maximum continuous output at 31 mph
wind speed 480 volt, 3 phase, 60 Hz. AC Induction generator 86.5 Amps output at full load System power factor .97 at full load Generator nominal RPM when on line 1800 rpm
Figure 17. Wind Turbine Specification.
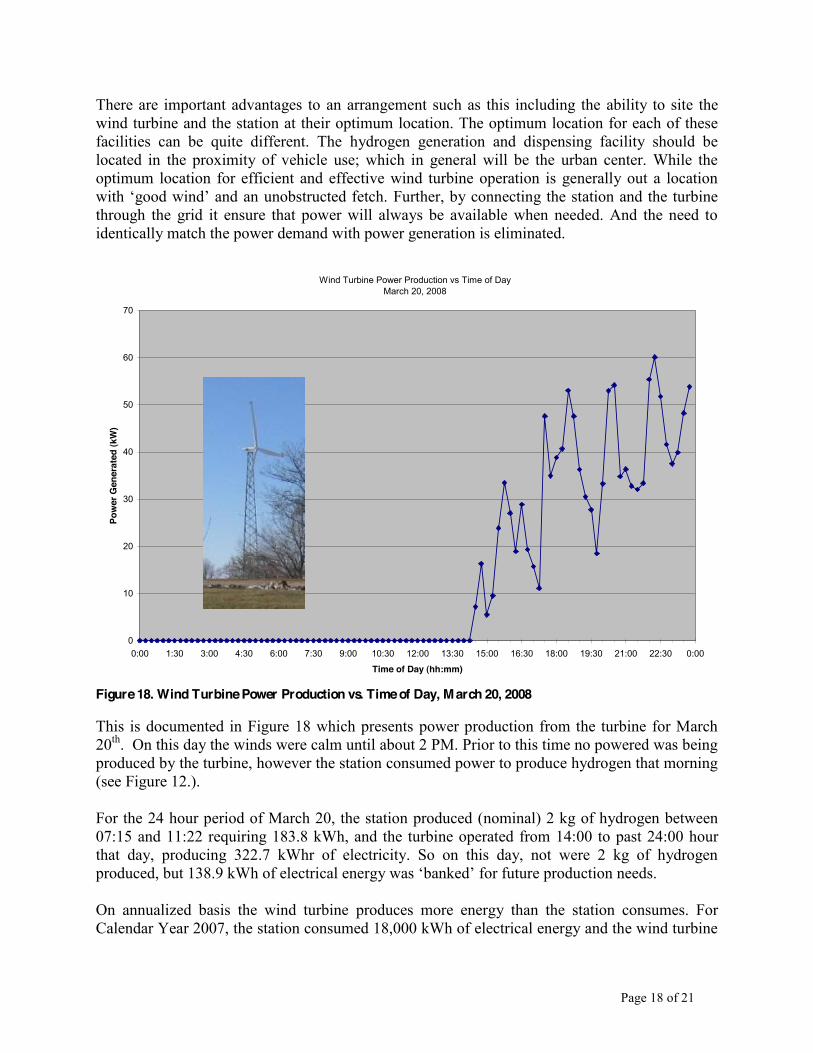
Page 18 of 21
There are important advantages to an arrangement such as this including the ability to site the wind turbine and the station at their optimum location. The optimum location for each of these facilities can be quite different. The hydrogen generation and dispensing facility should be located in the proximity of vehicle use; which in general will be the urban center. While the optimum location for efficient and effective wind turbine operation is generally out a location
Further, by connecting the station and the turbine through the grid it ensure that power will always be available when needed. And the need to identically match the power demand with power generation is eliminated.
Wind Turbine Power Production vs Time of DayMarch 20, 2008
0
10
20
30
40
50
60
70
0:00 1:30 3:00 4:30 6:00 7:30 9:00 10:30 12:00 13:30 15:00 16:30 18:00 19:30 21:00 22:30 0:00
Time of Day (hh:mm)
Pow
er G
ener
ated
(kW
)
Figure 18. Wind Turbine Power Production vs. Time of Day, March 20, 2008 This is documented in Figure 18 which presents power production from the turbine for March 20th. On this day the winds were calm until about 2 PM. Prior to this time no powered was being produced by the turbine, however the station consumed power to produce hydrogen that morning (see Figure 12.). For the 24 hour period of March 20, the station produced (nominal) 2 kg of hydrogen between 07:15 and 11:22 requiring 183.8 kWh, and the turbine operated from 14:00 to past 24:00 hour that day, producing 322.7 kWhr of electricity. So on this day, not were 2 kg of hydrogen produced, but On annualized basis the wind turbine produces more energy than the station consumes. For Calendar Year 2007, the station consumed 18,000 kWh of electrical energy and the wind turbine
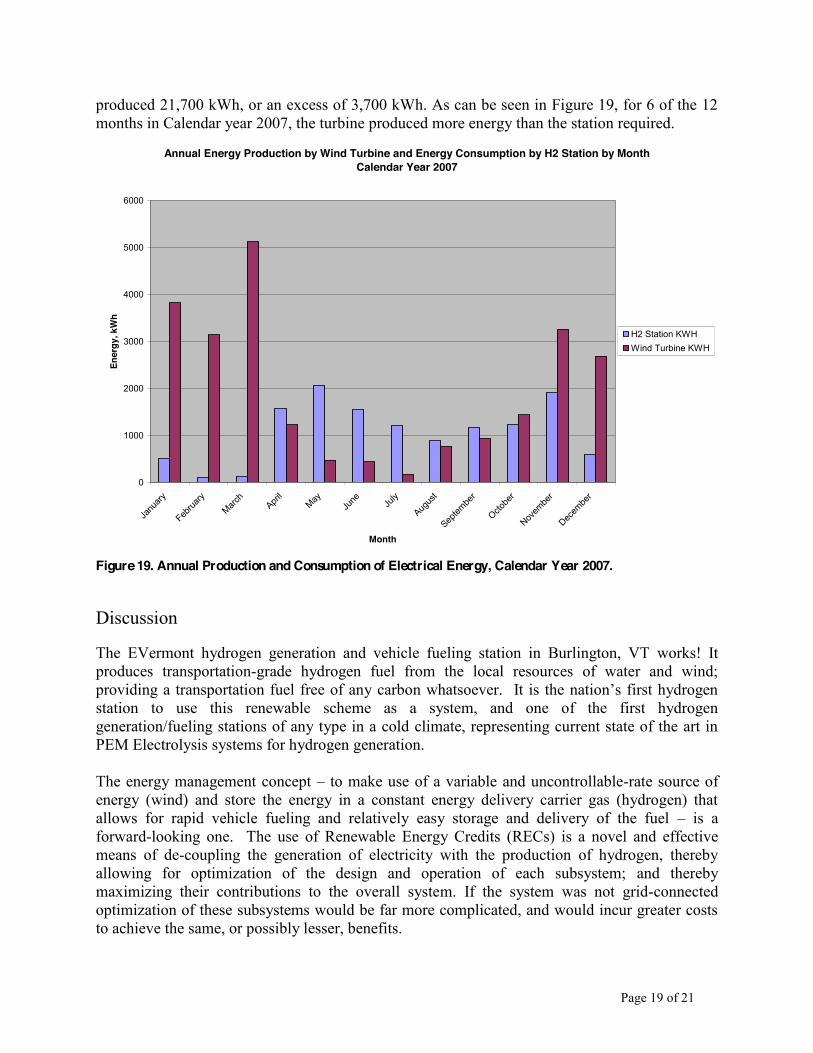
Page 19 of 21
produced 21,700 kWh, or an excess of 3,700 kWh. As can be seen in Figure 19, for 6 of the 12 months in Calendar year 2007, the turbine produced more energy than the station required.
Annual Energy Production by Wind Turbine and Energy Consumption by H2 Station by Month Calendar Year 2007
0
1000
2000
3000
4000
5000
6000
Janu
ary
Februa
ryMarc
hApri
lMay
June Ju
ly
Augus
t
Septem
ber
Octobe
r
Novem
ber
Decem
ber
Month
Ener
gy, k
Wh
H2 Station KWHWind Turbine KWH
Figure 19. Annual Production and Consumption of Electrical Energy, Calendar Year 2007. Discussion The EVermont hydrogen generation and vehicle fueling station in Burlington, VT works! It produces transportation-grade hydrogen fuel from the local resources of water and wind;
station to use this renewable scheme as a system, and one of the first hydrogen generation/fueling stations of any type in a cold climate, representing current state of the art in PEM Electrolysis systems for hydrogen generation. The energy management concept to make use of a variable and uncontrollable-rate source of energy (wind) and store the energy in a constant energy delivery carrier gas (hydrogen) that allows for rapid vehicle fueling and relatively easy storage and delivery of the fuel is a forward-looking one. The use of Renewable Energy Credits (RECs) is a novel and effective means of de-coupling the generation of electricity with the production of hydrogen, thereby allowing for optimization of the design and operation of each subsystem; and thereby maximizing their contributions to the overall system. If the system was not grid-connected optimization of these subsystems would be far more complicated, and would incur greater costs to achieve the same, or possibly lesser, benefits.

Page 20 of 21
The current system converts a nominal 180 kWh of electricity to 2 kilograms of hydrogen, or stated another way, it requires 90 kWh to make 1 kilogram of hydrogen. Converting these engineering units to equivalent energy units, by inputting 307,000 BTUs in the form of electricity, 125,000 BTUs of fuel grade hydrogen can be made available to displace motor gasoline. This is an overall system efficiency of 41%. Hydrogen, like electricity, is a secondary form of energy. To create the hydrogen, the largest single energy consuming component of the system is the electrolysis process. Through this process the hydrogen-oxygen chemical bonds of the water molecular are broken to make the hydrogen available as a fuel. Of the total energy required to operate the station, operation of the PEM cell technology accounts for 88% of the energy consumed. At the time this station was designed, Stack B represented and advanced cell-stack design, producing the equivalent amount of hydrogen gas by a cell-stack that was smaller, lighter, more efficient and less expensive to manufacture. If all three cell-stacks performed at the level of efficiency as cell-stack B (see Figure 4 and related text), the overall system efficiency would increase to 43%. Advancement in cell-stack design continue. These advancements not only continue to improve the efficiency of the stack in breaking the hydrogen-oxygen chemical bond, today advanced stack technology is producing product (hydrogen gas) at higher pressures. In the system being reported on, hydrogen gas is produced from stacks at a pressure of (nominal) 14 bar (200 psi) and then through a reciprocating compressor, the pressure is raised to (nominal) 350 bar (5,000 psi) for storage and dispensing. Stacks are now coming available that can produce product in the range of 60 70 bar (nominal 1,000 psi). This will greatly reduce the need for compression, an inefficient process, with a vision of possible eliminating the need for a mechanical compressor altogether. Looking further into the future, there are developments which could revolutionize the way the hydrogen-oxygen bond is broken. One technology being pursued is inspired by the photosynthesis performed by plants; an artificial photosynthesis. The key components in this body of work are new catalyst materials that can produce that produce hydrogen and oxygen gas from water. These new catalysts make use of cobalt metal, phosphate and platinum in e new ways to duplicate the water splitting reaction that occurs during photosynthesis in a plant. These technologies operate at room temperature and at much higher conversion efficiencies.[e.g. Daniel Nocera Profile: Hydrogen Economy? Let Sunlight Do the Work, Science 2007, 315, 789] Recommendations Demonstrating forecourt energy production is important in moving forward on the promise of the
ing the fuel produced locally with renewable resources is to the development of a hydrogen infrastructure, most particularly in rural areas. While economics and other consideration more direct urban areas to centralized production and distribution. The economics of these systems will not support expansion of a centralized hydrogen infrastructure to rural areas. And if consumers are to have confidence in the evolving vehicle technology which would operate on hydrogen the fuel needs to be available not in urban areas, but adjacent rural

Page 21 of 21
areas as well. Demonstrating that technologies are available today to produce hydrogen for transportation and demonstrating that current vehicle technology can be adapted to use hydrogen as a transportation allows policies to be needed for wide-be a policy of having small commercial and/or municipal fleets modeled on this project. Such a policy would put sustainable transportation in practice today, while gaining important experience with hydrogen as a transportation fuel and building infrastructure for tomorrow. Personnel Harold Garabedian, EVermont Project Director (802) 241-3849 [email protected] Gregory Wight, EVermont Technical Manager and Norwich University Liason (802) 485-2276 [email protected] Norwich University Students Chad Freitas Ryan Cammasso Andrew Murray James Rhodes