
Role of Bead Sequence in Underwater Welding
10
materials Article Role of Bead Sequence in Underwater Welding Jacek Tomków* , Dariusz Fydrych and Grzegorz Rogalski Faculty of Mechanical Engineering, Gda ´ nsk University of Technology, G. Narutowicza Street 11/12, 80-233 Gda ´ nsk, Poland; [email protected] (D.F.); [email protected] (G.R.) * Correspondence: [email protected]; Tel.: +48-58-347-1863 Received: 19 September 2019; Accepted: 14 October 2019; Published: 16 October 2019 Abstract: This paper presents examinations of the role of the bead sequence in underwater welding. Two specimens of wet welded layers made by covered electrodes with the use of normalized S355G10+N steel were welded by a reasonable bead sequence. For each specimen, metallographic macro- and micro-scopic tests were done. Then, Vickers HV10 hardness measurements were conducted for each pad weld in the welded layer. The results show that welding in the water environment carries many problems in the stability of the welding arc, which influences the properties of the welds. The effects of refining and tempering the structure in heat-affected zones of earlier laid beads was observed, which provides a reduction of hardness. The possibility of applying two techniques while welding the layer by the wet method is described. It is stated that a reasonable bead sequence can decrease the hardness in heat-affected zones up to 40 HV10. Tempering by heat from next beads can also change the microstructure in this area by tempering martensite and can decrease susceptibility to cold cracking. Keywords: underwater welding; covered electrodes; wet welding; cold cracking; pad welding 1. Introduction The most common method of underwater welding is wet welding. The welder and the welding area are in direct contact with the surrounding environment. The process is often carried out by flux-cored arc welding (FCAW) [1–4]. The most common is welding by covered electrodes, which is cheaper and easier [5,6]. The water environment can generate significant problems during welding. For welders, the biggest problems are instability of the welding arc and limited visibility [7,8], which can result in poor quality of welded joints. From the metallurgical point of view, the high cooling rate, the high hydrogen content in deposited metal, and residual stresses have the greatest influence on the quality of underwater welded joints. The high cooling rate leads to the formation of hardened structures in the heat-affected zone (HAZ) [9,10]. This is one of the reasons for residual stresses in welded joints after the welding process is completed. The next problem in underwater conditions is high diffusible hydrogen content in deposited metal, which is much higher than welding in air [11]. Three factors are responsible for high susceptibility of underwater welded joints to cold cracking. This type of cracking is located in the HAZ and in welds of joints made in water along the fusion line in the overheated area of the HAZ [6,12]. Sometimes, they can also be found in the welds [13]. Experiments in the field of welding processes in the water environment are developing annually, because underwater processes are used more in engineering [14]. Attempts to reduce the imperfections in welded joints made in the water are made in different ways. Much attention is devoted to improving the stability of the welding arc in underwater conditions and assessing the metal transfer in the welding arc, using the following methods: visual sensing [15], Materials 2019, 12, 3372; doi:10.3390/ma12203372 www.mdpi.com/journal/materials
Transcript of Role of Bead Sequence in Underwater Welding
materials
Article
Role of Bead Sequence in Underwater Welding
Jacek Tomków * , Dariusz Fydrych and Grzegorz Rogalski
Faculty of Mechanical Engineering, Gdansk University of Technology, G. Narutowicza Street 11/12,80-233 Gdansk, Poland; [email protected] (D.F.); [email protected] (G.R.)* Correspondence: [email protected]; Tel.: +48-58-347-1863
Received: 19 September 2019; Accepted: 14 October 2019; Published: 16 October 2019�����������������
Abstract: This paper presents examinations of the role of the bead sequence in underwater welding.Two specimens of wet welded layers made by covered electrodes with the use of normalizedS355G10+N steel were welded by a reasonable bead sequence. For each specimen, metallographicmacro- and micro-scopic tests were done. Then, Vickers HV10 hardness measurements wereconducted for each pad weld in the welded layer. The results show that welding in the waterenvironment carries many problems in the stability of the welding arc, which influences the propertiesof the welds. The effects of refining and tempering the structure in heat-affected zones of earlierlaid beads was observed, which provides a reduction of hardness. The possibility of applying twotechniques while welding the layer by the wet method is described. It is stated that a reasonable beadsequence can decrease the hardness in heat-affected zones up to 40 HV10. Tempering by heat fromnext beads can also change the microstructure in this area by tempering martensite and can decreasesusceptibility to cold cracking.
Keywords: underwater welding; covered electrodes; wet welding; cold cracking; pad welding
1. Introduction
The most common method of underwater welding is wet welding. The welder and the weldingarea are in direct contact with the surrounding environment. The process is often carried out byflux-cored arc welding (FCAW) [1–4]. The most common is welding by covered electrodes, which ischeaper and easier [5,6].
The water environment can generate significant problems during welding. For welders, the biggestproblems are instability of the welding arc and limited visibility [7,8], which can result in poor qualityof welded joints. From the metallurgical point of view, the high cooling rate, the high hydrogen contentin deposited metal, and residual stresses have the greatest influence on the quality of underwaterwelded joints.
The high cooling rate leads to the formation of hardened structures in the heat-affected zone(HAZ) [9,10]. This is one of the reasons for residual stresses in welded joints after the welding processis completed. The next problem in underwater conditions is high diffusible hydrogen content indeposited metal, which is much higher than welding in air [11]. Three factors are responsible for highsusceptibility of underwater welded joints to cold cracking. This type of cracking is located in the HAZand in welds of joints made in water along the fusion line in the overheated area of the HAZ [6,12].Sometimes, they can also be found in the welds [13].
Experiments in the field of welding processes in the water environment are developing annually,because underwater processes are used more in engineering [14].
Attempts to reduce the imperfections in welded joints made in the water are made in differentways. Much attention is devoted to improving the stability of the welding arc in underwater conditionsand assessing the metal transfer in the welding arc, using the following methods: visual sensing [15],
Materials 2019, 12, 3372; doi:10.3390/ma12203372 www.mdpi.com/journal/materials
Materials 2019, 12, 3372 2 of 10
in situ imaging [16], mechanical constraints [17], and ultrasonic waves [3,8]. The other research trend isdeveloping filler materials for welding: modifying the flux coating and wires of coated electrodes [18]and applying a waterproof coating [19]. Several articles present the results of technological methods toimprove the weldability of steel: diffusible hydrogen content in deposited metal [11,20], the use ofaustenitic deposits [9,21], preheating [22], and multilayer welding, including the temper bead weldingtechnique [6,12,13,23]. Controlling the distribution of heat input by controlling the sequence andpositioning of the beads is considered to be particularly promising, because it leads to a reduction in thegrain size and provides decreased hardness and increased impact strength [24–26]. Different variantsof bead sequences are used to weld hard-to-weld metals such as cast iron, nuclear steel, aluminum,quenched and tempered steel, and thermomechanically-treated steel [27–35].
For marine and offshore constructions, high-strength, low-alloy (HSLA) steels are widely used [36].These constructions may undergo failure during exploitation in marine conditions [37–40]. They oftenhave to be repaired in underwater conditions due to the high cost of transport to air conditions.However, the water environment makes repair welding more difficult, therefore, there is still a searchfor ways to improve the quality of underwater welds.
The aim of the research was to check the influence of the role of bead sequence on the structureand properties of layers using the wet welding method for specimens welded with covered electrodes.
2. Materials and Methods
2.1. Materials Used
For tests, normalized S355G10 + N steel plates with dimensions of 16 × 100 × 100 mm were chosenas the base metal (BM). This steel is often used as a material for offshore structures that may requirerepairs in the water environment. The carbon equivalent (CeIIW) is 0.385 according to the InternationalInstitute of Welding (IIW). As a filler material, ISO 2560-A: E 38 0 R 11 [41] rutile electrodes with adiameter of 4.0 mm were used. They produce good plasticity of welds, which may be helpful to avoidcold cracking. The chemical compositions of the materials used are listed in Table 1 and the mechanicalproperties in Table 2.
Table 1. Chemical compositions of materials used (wt.%).
Material C Si Mn P Cr Mo Ni Cu V CeIIW
S355G10 + N according to control analysis 0.11 0.35 1.39 0.01 0.02 0.02 0.25 0.27 0.003 0.385E 38 9 R 11 electrode deposit according to
manufacturer data 0.07 0.44 0.55 0.01 0.04 - - 0.05 - -
CeIIW, carbon equivalent by International Institute of Welding.
Table 2. Mechanical properties of materials used according to manufacturer data.
Material Re (Mpa) Rm (Mpa) A5 (%)
SS355G10+N 389 521 23.5E 38 0 R 11 electrode deposit 503 538 26
2.2. Welding Process
For welding, the manual metal arc (MMA) wet welding process was chosen. The schema of thisprocess is presented in Figure 1.
For the tests, 2 specimens were made in the water (0.15 m depth) with 5 beads in each. The timebetween welding each bead was 120 s. Specimens were welded by different techniques. In sampleS1, the beads were laid one after the other from bead 1 to bead 5. In sample S2, the beads were notlaid in order. These 2 techniques were chosen because they are representative of welding techniques.In S1, a bead was tempered only by the bead welded later. In S2, beads 1 and 2 were tempered by2 beads. The use of other techniques, such as 14253, would obtain only one bead (bead 2), which
Materials 2019, 12, 3372 3 of 10
will be tempered by 2 others. That may not have allowed preparation of the planned experiments.The schemas of welding techniques for S1 and S2 specimens are presented in Figure 2. The weldingparameters were chosen according to preliminary tests. They provided stability of the welding arc inthe experimental conditions and allowed heat input values higher than 0.90 kJ/mm. From the pointof view of weldability in underwater conditions, these values may reduce the susceptibility to coldcracking. It has been assumed that the heat input of the tempering bead should be higher than that ofthe tempered bead. The parameters for both specimens are shown in Table 3. In the case of manualunderwater wet welding, the ability to control the value of heat input is very limited. Hence, differencesbetween heat input values of subsequent beads are not significant (0.24 and 0.39 kJ/mm for specimensS1 and S2, respectively) from the point of view of metallurgical transformations.Materials 2019, 12, x FOR PEER REVIEW 3 of 10
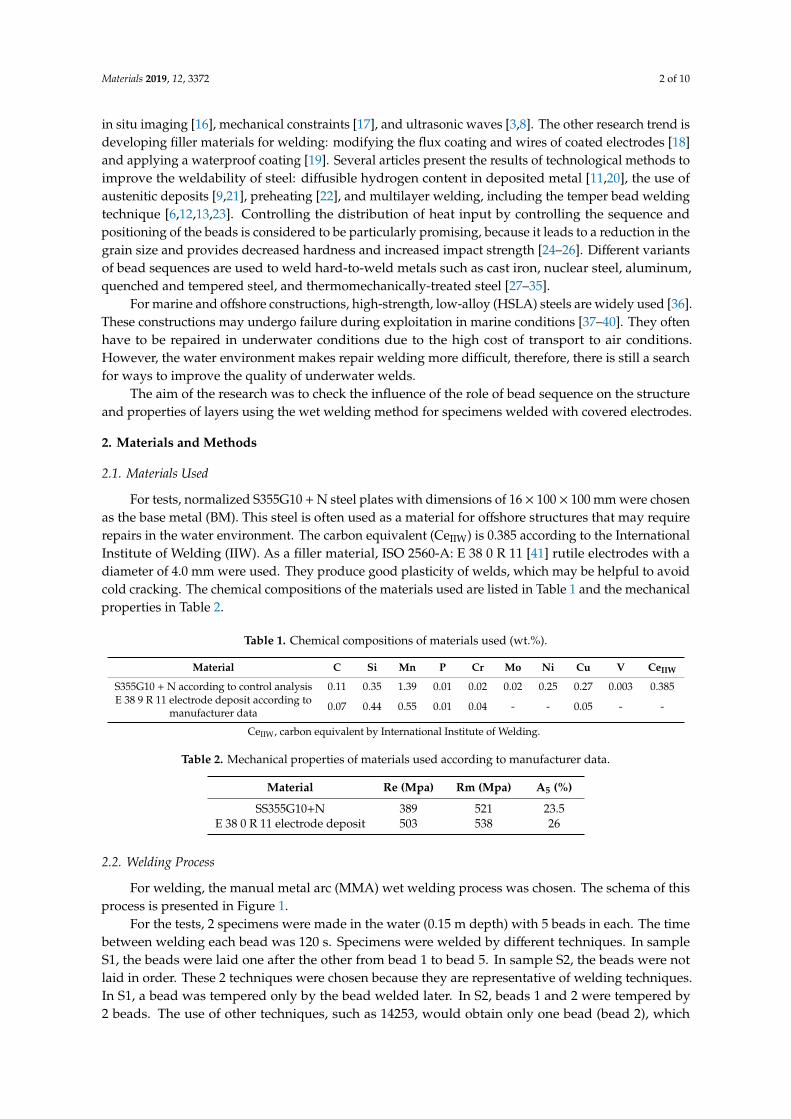
Figure 1. Wet welding by covered electrodes schema. 1: water vapor, 2: gas bubbles, 3: flux coating, 4: wire, 5: melting flux coating, 6: liquid metal, 7: electric arc, 8: base materials, 9: slag, 10: gas from melting flux coating.
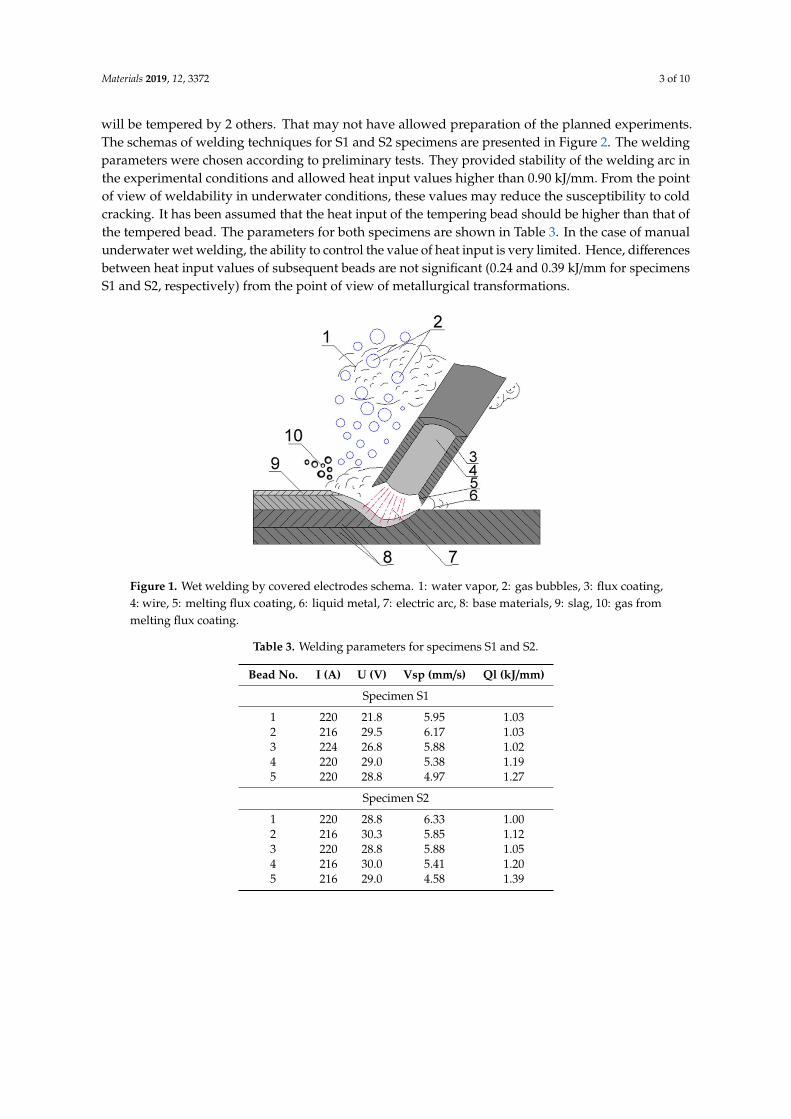
For the tests, 2 specimens were made in the water (0.15 m depth) with 5 beads in each. The time between welding each bead was 120 s. Specimens were welded by different techniques. In sample S1, the beads were laid one after the other from bead 1 to bead 5. In sample S2, the beads were not laid in order. These 2 techniques were chosen because they are representative of welding techniques. In S1, a bead was tempered only by the bead welded later. In S2, beads 1 and 2 were tempered by 2 beads. The use of other techniques, such as 14253, would obtain only one bead (bead 2), which will be tempered by 2 others. That may not have allowed preparation of the planned experiments. The schemas of welding techniques for S1 and S2 specimens are presented in Figure 2. The welding parameters were chosen according to preliminary tests. They provided stability of the welding arc in the experimental conditions and allowed heat input values higher than 0.90 kJ/mm. From the point of view of weldability in underwater conditions, these values may reduce the susceptibility to cold cracking. It has been assumed that the heat input of the tempering bead should be higher than that of the tempered bead. The parameters for both specimens are shown in Table 3. In the case of manual underwater wet welding, the ability to control the value of heat input is very limited. Hence, differences between heat input values of subsequent beads are not significant (0.24 and 0.39 kJ/mm for specimens S1 and S2, respectively) from the point of view of metallurgical transformations.
(a) (b) Figure 2. Scheme of welding process in (a) specimen S1 and (b) specimen S2.
Table 3. Welding parameters for specimens S1 and S2.
Bead No. I (A) U (V) Vsp (mm/s) Ql (kJ/mm) Specimen S1
1 220 21.8 5.95 1.03 2 216 29.5 6.17 1.03 3 224 26.8 5.88 1.02 4 220 29.0 5.38 1.19 5 220 28.8 4.97 1.27
Figure 1. Wet welding by covered electrodes schema. 1: water vapor, 2: gas bubbles, 3: flux coating,4: wire, 5: melting flux coating, 6: liquid metal, 7: electric arc, 8: base materials, 9: slag, 10: gas frommelting flux coating.
Table 3. Welding parameters for specimens S1 and S2.
Bead No. I (A) U (V) Vsp (mm/s) Ql (kJ/mm)
Specimen S1
1 220 21.8 5.95 1.032 216 29.5 6.17 1.033 224 26.8 5.88 1.024 220 29.0 5.38 1.195 220 28.8 4.97 1.27
Specimen S2
1 220 28.8 6.33 1.002 216 30.3 5.85 1.123 220 28.8 5.88 1.054 216 30.0 5.41 1.205 216 29.0 4.58 1.39
Materials 2019, 12, 3372 4 of 10
Materials 2019, 12, x FOR PEER REVIEW 3 of 10
Figure 1. Wet welding by covered electrodes schema. 1: water vapor, 2: gas bubbles, 3: flux coating, 4: wire, 5: melting flux coating, 6: liquid metal, 7: electric arc, 8: base materials, 9: slag, 10: gas from melting flux coating.
For the tests, 2 specimens were made in the water (0.15 m depth) with 5 beads in each. The time between welding each bead was 120 s. Specimens were welded by different techniques. In sample S1, the beads were laid one after the other from bead 1 to bead 5. In sample S2, the beads were not laid in order. These 2 techniques were chosen because they are representative of welding techniques. In S1, a bead was tempered only by the bead welded later. In S2, beads 1 and 2 were tempered by 2 beads. The use of other techniques, such as 14253, would obtain only one bead (bead 2), which will be tempered by 2 others. That may not have allowed preparation of the planned experiments. The schemas of welding techniques for S1 and S2 specimens are presented in Figure 2. The welding parameters were chosen according to preliminary tests. They provided stability of the welding arc in the experimental conditions and allowed heat input values higher than 0.90 kJ/mm. From the point of view of weldability in underwater conditions, these values may reduce the susceptibility to cold cracking. It has been assumed that the heat input of the tempering bead should be higher than that of the tempered bead. The parameters for both specimens are shown in Table 3. In the case of manual underwater wet welding, the ability to control the value of heat input is very limited. Hence, differences between heat input values of subsequent beads are not significant (0.24 and 0.39 kJ/mm for specimens S1 and S2, respectively) from the point of view of metallurgical transformations.
(a) (b)
Figure 2. Scheme of welding process in (a) specimen S1 and (b) specimen S2.
Table 3. Welding parameters for specimens S1 and S2.
Bead No. I (A) U (V) Vsp (mm/s) Ql (kJ/mm) Specimen S1
1 220 21.8 5.95 1.03 2 216 29.5 6.17 1.03 3 224 26.8 5.88 1.02
Figure 2. Scheme of welding process in (a) specimen S1 and (b) specimen S2.
2.3. Examination Procedure
After welding, specimens were cut to cross-sections, and macroscopic and microscopicmetallographic examinations were conducted in accordance with the EN ISO 17637:2011 [42] standard,with the use of 4% Nital. Finally, Vickers HV10 hardness measurements were taken in accordancewith EN ISO 9015:2011 [43], by using a Sinowon V-10 stand (Sinowon, Dongguan, China), with ameasurement error of ± 3 HV10. The investigated S355G10 + N steel is classified as material group 2.1in accordance with EN ISO 15614-1:2017 [44]. The maximum hardness values of HAZ recommendedby this standard cannot exceed 380 HV10.
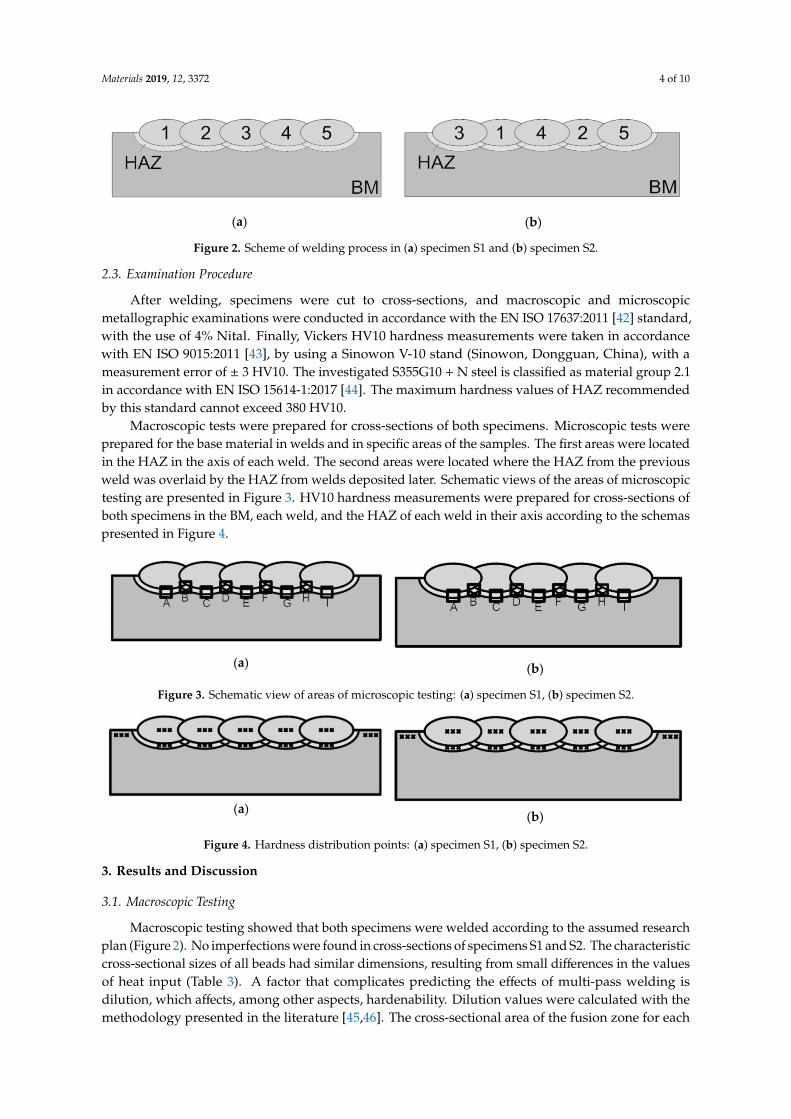
Macroscopic tests were prepared for cross-sections of both specimens. Microscopic tests wereprepared for the base material in welds and in specific areas of the samples. The first areas were locatedin the HAZ in the axis of each weld. The second areas were located where the HAZ from the previousweld was overlaid by the HAZ from welds deposited later. Schematic views of the areas of microscopictesting are presented in Figure 3. HV10 hardness measurements were prepared for cross-sections ofboth specimens in the BM, each weld, and the HAZ of each weld in their axis according to the schemaspresented in Figure 4.
Materials 2019, 12, x FOR PEER REVIEW 4 of 10
4 220 29.0 5.38 1.19 5 220 28.8 4.97 1.27
Specimen S2 1 220 28.8 6.33 1.00 2 216 30.3 5.85 1.12 3 220 28.8 5.88 1.05 4 216 30.0 5.41 1.20 5 216 29.0 4.58 1.39
2.3. Examination Procedure
After welding, specimens were cut to cross-sections, and macroscopic and microscopic metallographic examinations were conducted in accordance with the EN ISO 17637:2011 [42] standard, with the use of 4% Nital. Finally, Vickers HV10 hardness measurements were taken in accordance with EN ISO 9015:2011 [43], by using a Sinowon V-10 stand (Sinowon, Dongguan, China), with a measurement error of ± 3 HV10. The investigated S355G10 + N steel is classified as material group 2.1 in accordance with EN ISO 15614-1:2017 [44]. The maximum hardness values of HAZ recommended by this standard cannot exceed 380 HV10.
Macroscopic tests were prepared for cross-sections of both specimens. Microscopic tests were prepared for the base material in welds and in specific areas of the samples. The first areas were located in the HAZ in the axis of each weld. The second areas were located where the HAZ from the previous weld was overlaid by the HAZ from welds deposited later. Schematic views of the areas of microscopic testing are presented in Figure 3. HV10 hardness measurements were prepared for cross-sections of both specimens in the BM, each weld, and the HAZ of each weld in their axis according to the schemas presented in Figure 4.
(a) (b) Figure 3. Schematic view of areas of microscopic testing: (a) specimen S1, (b) specimen S2.
(a) (b) Figure 4. Hardness distribution points: (a) specimen S1, (b) specimen S2.
3. Results and Discussion
3.1. Macroscopic Testing
Macroscopic testing showed that both specimens were welded according to the assumed research plan (Figure 2). No imperfections were found in cross-sections of specimens S1 and S2. The characteristic cross-sectional sizes of all beads had similar dimensions, resulting from small differences in the values of heat input (Table 3). A factor that complicates predicting the effects of multi-pass welding is dilution, which affects, among other aspects, hardenability. Dilution values were calculated with the methodology presented in the literature [45,46]. The cross-sectional area of the fusion zone for each pass was used, i.e., D = Abase/A, where A is the total molten area and Abase is the molten area of the BM [45]. The calculations showed that dilution in S2 is lower than in S1, which
Figure 3. Schematic view of areas of microscopic testing: (a) specimen S1, (b) specimen S2.
Materials 2019, 12, x FOR PEER REVIEW 4 of 10
4 220 29.0 5.38 1.19 5 220 28.8 4.97 1.27
Specimen S2 1 220 28.8 6.33 1.00 2 216 30.3 5.85 1.12 3 220 28.8 5.88 1.05 4 216 30.0 5.41 1.20 5 216 29.0 4.58 1.39
2.3. Examination Procedure
After welding, specimens were cut to cross-sections, and macroscopic and microscopic metallographic examinations were conducted in accordance with the EN ISO 17637:2011 [42] standard, with the use of 4% Nital. Finally, Vickers HV10 hardness measurements were taken in accordance with EN ISO 9015:2011 [43], by using a Sinowon V-10 stand (Sinowon, Dongguan, China), with a measurement error of ± 3 HV10. The investigated S355G10 + N steel is classified as material group 2.1 in accordance with EN ISO 15614-1:2017 [44]. The maximum hardness values of HAZ recommended by this standard cannot exceed 380 HV10.
Macroscopic tests were prepared for cross-sections of both specimens. Microscopic tests were prepared for the base material in welds and in specific areas of the samples. The first areas were located in the HAZ in the axis of each weld. The second areas were located where the HAZ from the previous weld was overlaid by the HAZ from welds deposited later. Schematic views of the areas of microscopic testing are presented in Figure 3. HV10 hardness measurements were prepared for cross-sections of both specimens in the BM, each weld, and the HAZ of each weld in their axis according to the schemas presented in Figure 4.
(a) (b)
Figure 3. Schematic view of areas of microscopic testing: (a) specimen S1, (b) specimen S2.
(a) (b)Figure 4. Hardness distribution points: (a) specimen S1, (b) specimen S2.
3. Results and Discussion
3.1. Macroscopic Testing
Macroscopic testing showed that both specimens were welded according to the assumed research plan (Figure 2). No imperfections were found in cross-sections of specimens S1 and S2. The characteristic cross-sectional sizes of all beads had similar dimensions, resulting from small differences in the values of heat input (Table 3). A factor that complicates predicting the effects of multi-pass welding is dilution, which affects, among other aspects, hardenability. Dilution values were calculated with the methodology presented in the literature [45,46]. The cross-sectional area of the fusion zone for each pass was used, i.e., D = Abase/A, where A is the total molten area and Abase is the molten area of the BM [45]. The calculations showed that dilution in S2 is lower than in S1, which
Figure 4. Hardness distribution points: (a) specimen S1, (b) specimen S2.
3. Results and Discussion
3.1. Macroscopic Testing
Macroscopic testing showed that both specimens were welded according to the assumed researchplan (Figure 2). No imperfections were found in cross-sections of specimens S1 and S2. The characteristiccross-sectional sizes of all beads had similar dimensions, resulting from small differences in the valuesof heat input (Table 3). A factor that complicates predicting the effects of multi-pass welding isdilution, which affects, among other aspects, hardenability. Dilution values were calculated with themethodology presented in the literature [45,46]. The cross-sectional area of the fusion zone for each
Materials 2019, 12, 3372 5 of 10
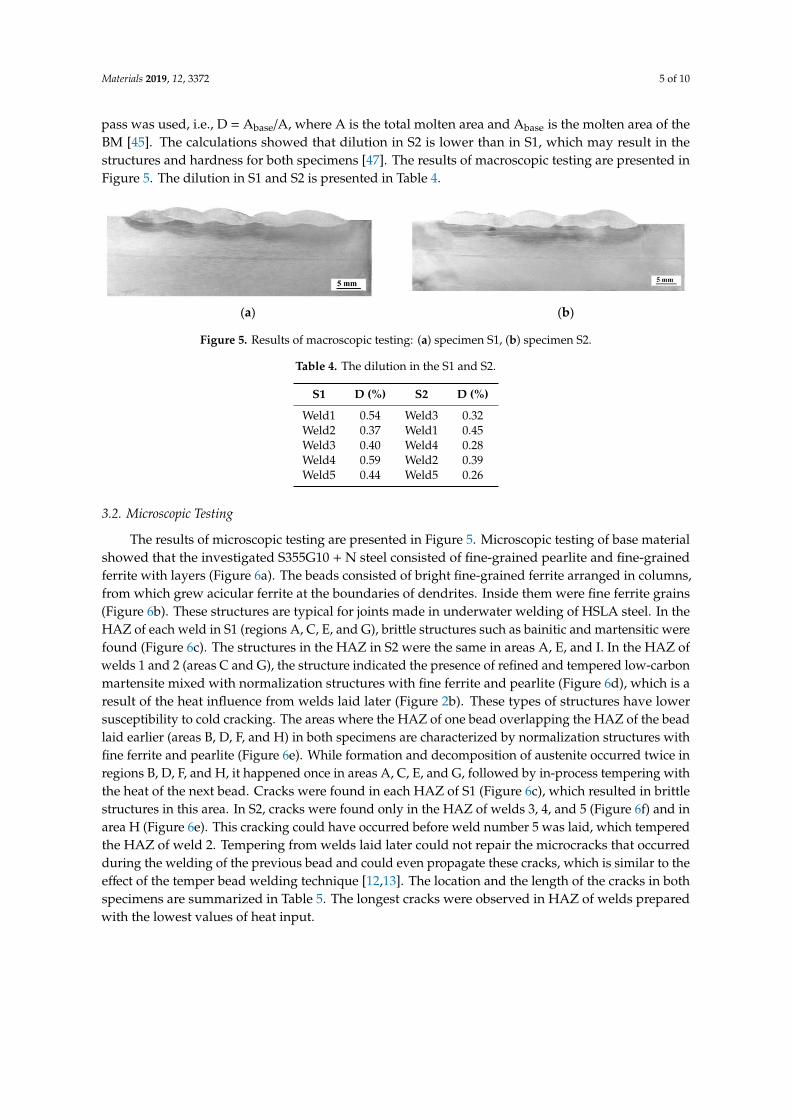
pass was used, i.e., D = Abase/A, where A is the total molten area and Abase is the molten area of theBM [45]. The calculations showed that dilution in S2 is lower than in S1, which may result in thestructures and hardness for both specimens [47]. The results of macroscopic testing are presented inFigure 5. The dilution in S1 and S2 is presented in Table 4.
Materials 2019, 12, x FOR PEER REVIEW 5 of 10
may result in the structures and hardness for both specimen
(a) (b)
Figure 5. Results of macroscopic testing: (a) specimen S1, (b) specimen S2.
Table 4. The dilution in the S1 and S2.
S1 D (%) S2 D (%) Weld1 0.54 Weld3 0.32 Weld2 0.37 Weld1 0.45 Weld3 0.40 Weld4 0.28 Weld4 0.59 Weld2 0.39 Weld5 0.44 Weld5 0.26
3.2. Microscopic Testing
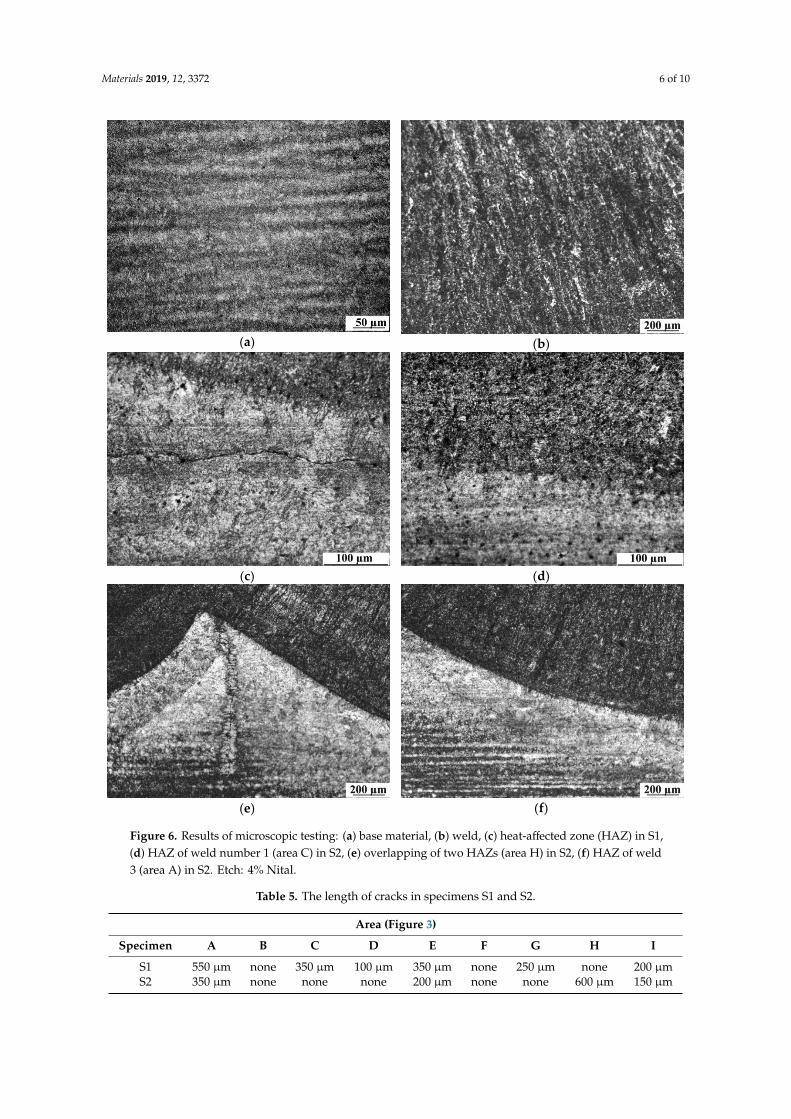
The results of microscopic testing are presented in Figure 5. Microscopic testing of base material showed that the investigated S355G10 + N steel consisted of fine-grained pearlite and fine-grained ferrite with layers (Figure 6a). The beads consisted of bright fine-grained ferrite arranged in columns, from which grew acicular ferrite at the boundaries of dendrites. Inside them were fine ferrite grains (Figure 6b). These structures are typical for joints made in underwater welding of HSLA steel. In the HAZ of each weld in S1 (regions A, C, E, and G), brittle structures such as bainitic and martensitic were found (Figure 6c). The structures in the HAZ in S2 were the same in areas A, E, and I. In the HAZ of welds 1 and 2 (areas C and G), the structure indicated the presence of refined and tempered low-carbon martensite mixed with normalization structures with fine ferrite and pearlite (Figure 6d), which is a result of the heat influence from welds laid later (Figure 2b). These types of structures have lower susceptibility to cold cracking. The areas where the HAZ of one bead overlapping the HAZ of the bead laid earlier (areas B, D, F, and H) in both specimens are characterized by normalization structures with fine ferrite and pearlite (Figure 6e). While formation and decomposition of austenite occurred twice in regions B, D, F, and H, it happened once in areas A, C, E, and G, followed by in-process tempering with the heat of the next bead. Cracks were found in each HAZ of S1 (Figure 6c), which resulted in brittle structures in this area. In S2, cracks were found only in the HAZ of welds 3, 4, and 5 (Figure 6f) and in area H (Figure 6e). This cracking could have occurred before weld number 5 was laid, which tempered the HAZ of weld 2. Tempering from welds laid later could not repair the microcracks that occurred during the welding of the previous bead and could even propagate these cracks, which is similar to the effect of the temper bead welding technique [12,13]. The location and the length of the cracks in both specimens are summarized in Table 5. The longest cracks were observed in HAZ of welds prepared with the lowest values of heat input.
Figure 5. Results of macroscopic testing: (a) specimen S1, (b) specimen S2.
Table 4. The dilution in the S1 and S2.
S1 D (%) S2 D (%)
Weld1 0.54 Weld3 0.32Weld2 0.37 Weld1 0.45Weld3 0.40 Weld4 0.28Weld4 0.59 Weld2 0.39Weld5 0.44 Weld5 0.26
3.2. Microscopic Testing
The results of microscopic testing are presented in Figure 5. Microscopic testing of base materialshowed that the investigated S355G10 + N steel consisted of fine-grained pearlite and fine-grainedferrite with layers (Figure 6a). The beads consisted of bright fine-grained ferrite arranged in columns,from which grew acicular ferrite at the boundaries of dendrites. Inside them were fine ferrite grains(Figure 6b). These structures are typical for joints made in underwater welding of HSLA steel. In theHAZ of each weld in S1 (regions A, C, E, and G), brittle structures such as bainitic and martensitic werefound (Figure 6c). The structures in the HAZ in S2 were the same in areas A, E, and I. In the HAZ ofwelds 1 and 2 (areas C and G), the structure indicated the presence of refined and tempered low-carbonmartensite mixed with normalization structures with fine ferrite and pearlite (Figure 6d), which is aresult of the heat influence from welds laid later (Figure 2b). These types of structures have lowersusceptibility to cold cracking. The areas where the HAZ of one bead overlapping the HAZ of the beadlaid earlier (areas B, D, F, and H) in both specimens are characterized by normalization structures withfine ferrite and pearlite (Figure 6e). While formation and decomposition of austenite occurred twice inregions B, D, F, and H, it happened once in areas A, C, E, and G, followed by in-process tempering withthe heat of the next bead. Cracks were found in each HAZ of S1 (Figure 6c), which resulted in brittlestructures in this area. In S2, cracks were found only in the HAZ of welds 3, 4, and 5 (Figure 6f) and inarea H (Figure 6e). This cracking could have occurred before weld number 5 was laid, which temperedthe HAZ of weld 2. Tempering from welds laid later could not repair the microcracks that occurredduring the welding of the previous bead and could even propagate these cracks, which is similar to theeffect of the temper bead welding technique [12,13]. The location and the length of the cracks in bothspecimens are summarized in Table 5. The longest cracks were observed in HAZ of welds preparedwith the lowest values of heat input.
Materials 2019, 12, 3372 6 of 10
Materials 2019, 12, x FOR PEER REVIEW 6 of 10
(a)
(b)
(c)
(d)
(e)
(f)
Figure 6. Results of microscopic testing: (a) base material, (b) weld, (c) heat-affected zone (HAZ) in S1, (d) HAZ of weld number 1 (area C) in S2, (e) overlapping of two HAZs (area H) in S2, (f) HAZ of weld 3 (area A) in S2. Etch: 4% Nital.
Table 5. The length of cracks in specimens S1 and S2.
Area (Figure 3) Specimen A B C D E F G H I
S1 550 µm none 350 µm 100 µm 350 µm none 250 µm none 200 µm S2 350 µm none none none 200 µm none none 600 µm 150 µm
3.2. Hardness Measurements
The investigated S355G10 + N steel is classified as material group 2.1 by EN ISO 9015-1:2011. In accordance with the EN-ISO 15614:1 standard, the maximum hardness of the HAZ cannot exceed 380
Figure 6. Results of microscopic testing: (a) base material, (b) weld, (c) heat-affected zone (HAZ) in S1,(d) HAZ of weld number 1 (area C) in S2, (e) overlapping of two HAZs (area H) in S2, (f) HAZ of weld3 (area A) in S2. Etch: 4% Nital.
Table 5. The length of cracks in specimens S1 and S2.
Area (Figure 3)
Specimen A B C D E F G H I
S1 550 µm none 350 µm 100 µm 350 µm none 250 µm none 200 µmS2 350 µm none none none 200 µm none none 600 µm 150 µm
Materials 2019, 12, 3372 7 of 10
3.3. Hardness Measurements
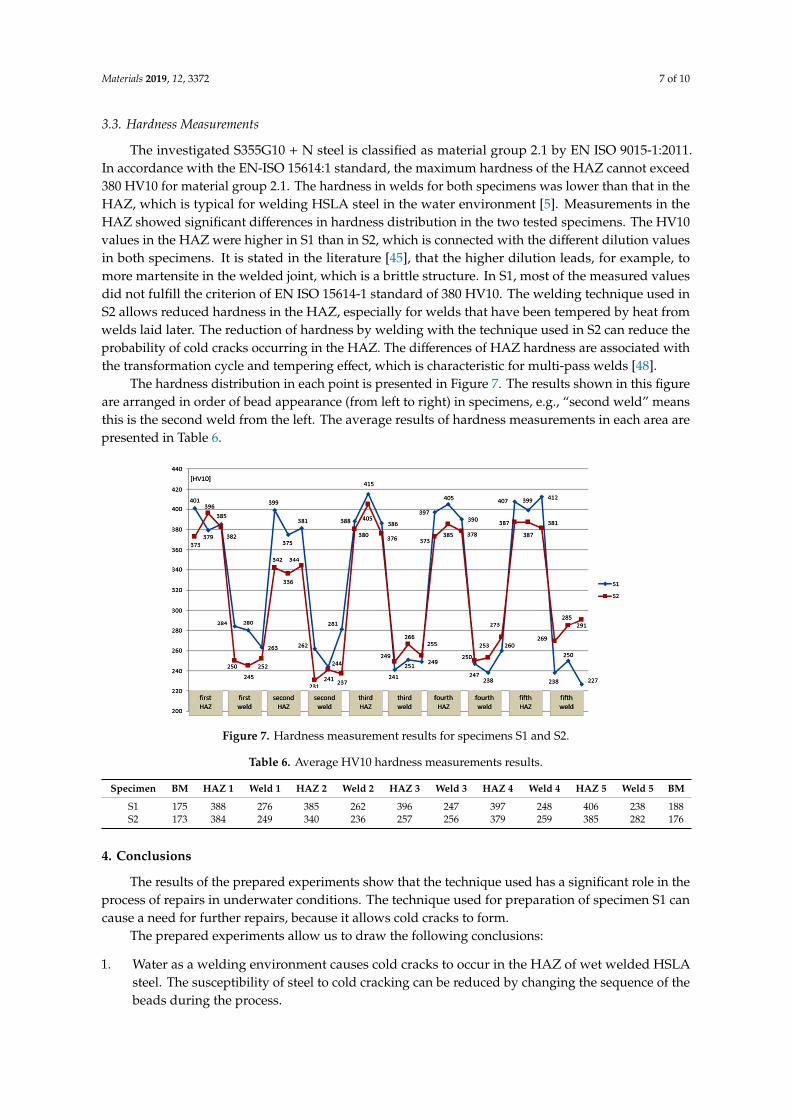
The investigated S355G10 + N steel is classified as material group 2.1 by EN ISO 9015-1:2011.In accordance with the EN-ISO 15614:1 standard, the maximum hardness of the HAZ cannot exceed380 HV10 for material group 2.1. The hardness in welds for both specimens was lower than that in theHAZ, which is typical for welding HSLA steel in the water environment [5]. Measurements in theHAZ showed significant differences in hardness distribution in the two tested specimens. The HV10values in the HAZ were higher in S1 than in S2, which is connected with the different dilution valuesin both specimens. It is stated in the literature [45], that the higher dilution leads, for example, tomore martensite in the welded joint, which is a brittle structure. In S1, most of the measured valuesdid not fulfill the criterion of EN ISO 15614-1 standard of 380 HV10. The welding technique used inS2 allows reduced hardness in the HAZ, especially for welds that have been tempered by heat fromwelds laid later. The reduction of hardness by welding with the technique used in S2 can reduce theprobability of cold cracks occurring in the HAZ. The differences of HAZ hardness are associated withthe transformation cycle and tempering effect, which is characteristic for multi-pass welds [48].
The hardness distribution in each point is presented in Figure 7. The results shown in this figureare arranged in order of bead appearance (from left to right) in specimens, e.g., “second weld” meansthis is the second weld from the left. The average results of hardness measurements in each area arepresented in Table 6.
Materials 2019, 12, x FOR PEER REVIEW 7 of 10
HV10 for material group 2.1. The hardness in welds for both specimens was lower than that in the HAZ, which is typical for welding HSLA steel in the water environment [5]. Measurements in the HAZ showed significant differences in hardness distribution in the two tested specimens. The HV10 values in the HAZ were higher in S1 than in S2, which is connected with the different dilution values in both specimens. It is stated in the literature [45], that the higher dilution leads, for example, to more martensite in the welded joint, which is a brittle structure. In S1, most of the measured values did not fulfill the criterion of EN ISO 15614-1 standard of 380 HV10. The welding technique used in S2 allows reduced hardness in the HAZ, especially for welds that have been tempered by heat from welds laid later. The reduction of hardness by welding with the technique used in S2 can reduce the probability of cold cracks occurring in the HAZ. The differences of HAZ hardness are associated with the transformation cycle and tempering effect, which is characteristic for multi-pass welds [48].
The hardness distribution in each point is presented in Figure 7. The results shown in this figure are arranged in order of bead appearance (from left to right) in specimens, e.g., “second weld” means this is the second weld from the left. The average results of hardness measurements in each area are presented in Table 6.
Figure 7. Hardness measurement results for specimens S1 and S2.
Table 6. Average HV10 hardness measurements results.
Specimen
BM
HAZ 1
Weld 1
HAZ 2
Weld 2
HAZ 3
Weld 3
HAZ 4
Weld 4
HAZ 5
Weld 5
BM
S1 175 388 276 385 262 396 247 397 248 406 238 188 S2 173 384 249 340 236 257 256 379 259 385 282 176
4. Conclusions
The results of the prepared experiments show that the technique used has a significant role in the process of repairs in underwater conditions. The technique used for preparation of specimen S1 can cause a need for further repairs, because it allows cold cracks to form.
The prepared experiments allow us to draw the following conclusions: 1. Water as a welding environment causes cold cracks to occur in the HAZ of wet welded
HSLA steel. The susceptibility of steel to cold cracking can be reduced by changing the sequence of the beads during the process.
2. The technique used for the preparation of specimen S2 allowed the structure in the HAZ of some welds to be changed. In this area, the structure indicated the presence of refined and tempered low-carbon martensite mixed with normalization structures with fine ferrite and pearlite. In each HAZ in specimen S1, brittle structures such as bainitic and martensitic were found.
Figure 7. Hardness measurement results for specimens S1 and S2.
Table 6. Average HV10 hardness measurements results.
Specimen BM HAZ 1 Weld 1 HAZ 2 Weld 2 HAZ 3 Weld 3 HAZ 4 Weld 4 HAZ 5 Weld 5 BM
S1 175 388 276 385 262 396 247 397 248 406 238 188S2 173 384 249 340 236 257 256 379 259 385 282 176
4. Conclusions
The results of the prepared experiments show that the technique used has a significant role in theprocess of repairs in underwater conditions. The technique used for preparation of specimen S1 cancause a need for further repairs, because it allows cold cracks to form.
The prepared experiments allow us to draw the following conclusions:
1. Water as a welding environment causes cold cracks to occur in the HAZ of wet welded HSLAsteel. The susceptibility of steel to cold cracking can be reduced by changing the sequence of thebeads during the process.
Materials 2019, 12, 3372 8 of 10
2. The technique used for the preparation of specimen S2 allowed the structure in the HAZ of somewelds to be changed. In this area, the structure indicated the presence of refined and temperedlow-carbon martensite mixed with normalization structures with fine ferrite and pearlite. In eachHAZ in specimen S1, brittle structures such as bainitic and martensitic were found.
3. Welding S355G10 + N steel with the sequence used in specimen S2 (out of order) allowed areduction of hardness in the HAZ below the critical value of 380 HV10, as stated by the EN-ISO15614-1 standard. The lowest hardness values were measured in the HAZ in specimen S2,where the heat from beads laid later tempered this area, and in which the dilution is lower thanin specimen S1.
4. The technique used in welding specimen S2 should be used during repair procedures that haveto be prepared in the water environment.
Author Contributions: Conceptualization, J.T. and G.R.; Methodology, J.T., D.F. and G.R.; Formal Analysis, J.T.and D.F.; Investigation, J.T. and G.R.; Writing—Original Draft Preparation, J.T., D.F. and G.R.; Writing—Reviewand Editing, J.T. and D.F.
Funding: This research received no external funding.
Conflicts of Interest: The authors declare no conflict of interest.
References
1. Zhang, Y.; Jia, C.; Wang, J.; Zhao, B.; Wu, C. Investigation on the bubble dynamic behaviors and correspondingregulation method in underwater flux-cored arc welding. Proc. Inst. Mech. Eng. B 2019, 223, 1808–1817.[CrossRef]
2. Sun, K.; Zeng, M.; Shi, Y.; Hu, Y.; Shen, X. Microstructure and corrosion behavior of S32101 stainless steelunderwater dry and wet welded joints. J. Mater. Process. Technol. 2018, 256, 190–201. [CrossRef]
3. Wang, J.; Sun, Q.; Teng, J.; Feng, J. Bubble evolution in ultrasonic wave-assisted underwater wet FCAW.Weld. J. 2019, 98, 150–163.
4. Guo, N.; Du, Y.; Maksimov, S.; Feng, J.; Yin, Z.; Krazhanovskyi, D.; Fu, Y. Study of metal transfer control inunderwater wet FCAW using pulsed wire feed method. Weld. World 2018, 62, 87–94. [CrossRef]
5. Tomków, J.; Łabanowski, J.; Fydrych, D.; Rogalski, G. Cold cracking of S460N steel in water environment.Pol. Marit. Res. 2018, 25, 131–136. [CrossRef]
6. Gao, W.B.; Wang, D.; Cheng, F.; Deng, C.; Xu, W. Underwater wet welding for HSLA steels: Chemicalcomposition, defects, microstructure, and mechanical properties. Acta Metall. Sin. Engl. 2015, 28, 1097–1108.[CrossRef]
7. Fu, Y.; Guo, N.; Du, Y.; Chen, H.; Xu, C.; Feng, J. Effect of metal transfer mode on spatter and arc stability inunderwater flux-cored wire wet welding. J. Manuf. Process. 2018, 35, 161–168. [CrossRef]
8. Wang, J.; Sun, Q.; Ma, J.; Teng, J.; Jin, P.; Feng, J. Investigation of acoustic radiator affecting bubble-acousticinteraction in ultrasonic wave-assisted UWW at shallow water. J. Manuf. Process. 2018, 37, 563–577.[CrossRef]
9. Li, H.; Liu, D.; Ma, Q.; Guo, N.; Song, X.; Feng, J. Microstructure and mechanical properties of dissimilarwelds between 16Mn and 304L in underwater wet welding. Sci. Technol. Weld. Join. 2018, 24, 1–7. [CrossRef]
10. Tomków, J.; Fydrych, D.; Rogalski, G.; Łabanowski, J. Effect of the welding environment and storage time ofelectrodes on the diffusible hydrogen content in deposited metal. Rev. Metall. 2019, 55, e140. [CrossRef]
11. Swierczynska, A.; Fydrych, D.; Rogalski, G. Diffusible hydrogen management in underwater wet self-shieldedflux cored arc welding. Int. J. Hydrogen Energy 2017, 42, 24532–24540. [CrossRef]
12. Tomków, J.; Rogalski, G.; Fydrych, D.; Łabanowski, J. Improvement of S355G10+N steel -weldability inwater environment by Temper Bead Welding. J. Mater. Process. Technol. 2018, 262, 372–381. [CrossRef]
13. Tomków, J.; Rogalski, G.; Fydrych, D.; Łabanowski, J. Advantages of the application of temper bead weldingtechnique during wet welding. Materials 2019, 12, 915. [CrossRef] [PubMed]
14. Jia, C.; Zhang, Y.; Wu, J.; Xing, C.; Zhao, B.; Wu, C. Comprehensive analysis of spatter loss in wet FCAWconsidering interactions of bubbles, droplets and arc–Part 1: Measurement and improvement. J. Manuf.Process. 2019, 40, 122–127. [CrossRef]
Materials 2019, 12, 3372 9 of 10
15. Wang, J.; Sun, Q.; Zhang, S.; Wang, C.; Wu, L.; Feng, F. Characterization of the underwater welding arcbubble through a visual sensing method. J. Mater. Process. Technol. 2018, 251, 95–108. [CrossRef]
16. Chen, H.; Guo, N.; Huang, L.; Zhang, X.; Feng, J.; Wang, G. Effects of arc bubble behaviors and characteristicson droplet transfer in underwater wet welding using in-situ imaging method. Mater. Des. 2019, 170, 107696.[CrossRef]
17. Wang, J.; Sun, Q.; Pan, Z.; Yang, J.; Feng, J. Effect of welding speed on bubble dynamics and process stabilityin mechanical constraint-assisted underwater wet welding of steel sheets. J. Mater. Process. Technol. 2019,264, 389–401. [CrossRef]
18. Silva, L.F.; Santos, V.R.D.; Paciornik, S.; Rizzo, F.A.; Monteiro, M.J.; Bracarense, A.Q.; Pessoa, E.C.; Vieira, L.A.;Marinho, R.R. Influence of molybdenum in metal weld properties in welding wet with oxy-rutillic electrodes.Soldag. Inspeção 2013, 18, 102–109. [CrossRef]
19. Winarto, W.; Purnama, D.; Churniawan, I. The effect of different rutile electrodes on mechanical properties ofunderwater wet welded AH-36 steel plates. AIP Conf. Proc. 2018, 1945, 020048.
20. Muktepavel, V.; Murzin, V.; Karpov, V.; Kurakin, A. Research on welding and processing behavior ofelectrodes and features of their application in “wet” underwater arc welding. Mater. Sci. Forum 2019, 946,913–920. [CrossRef]
21. Guo, N.; Yang, Z.; Wang, M.; Yuan, X.; Feng, J. Microstructure and mechanical properties of an underwaterwet welded dissimilar ferritic/austenitic steel joint. Strength Mater. 2015, 47, 12–18. [CrossRef]
22. Zhang, H.T.; Dai, X.Y.; Feng, J.C.; Hu, L.L. Preliminary investigation on real-time induction heating-assistedunderwater wet welding. Weld. J. 2015, 94, 8–15.
23. Gao, W.; Wang, D.; Cheng, F.; Di, X.; Deng, C.; Xu, W. Microstructural and mechanical performance ofunderwater wet welded S355 steel. J. Mater. Process. Technol. 2016, 238, 333–340. [CrossRef]
24. Yan, Y.; Liu, C.; Wang, C.; Shen, J. Mechanical properties and stress variations in multipass welded joint oflow-alloy high-strength steel after layer-by-layer ultrasonic impact treatment. J. Mater. Eng. Perform. 2019,28, 2726–2735. [CrossRef]
25. Vargas-Arista, B.; Mendoza-Camargo, O.; Zaragoza-Rivera, I.P.; Medina-Flores, A.; Cuevas-Salgado, A.;Garfias-García, E.; García-Vázquez, F. Influence of heat input on the Charpy ductile fracture behavior ofreheated HAZ in GMAW multilayer welded joints on HSLA steel using digital fractographic analysis. Rev.Metal. 2019, 55, e143. [CrossRef]
26. Winczek, J. Modeling of temperature field during multi-pass GMAW surfacing or rebuilding of steel elementstaking into account the heat of the deposit metal. Appl. Sci. 2018, 7, 6. [CrossRef]
27. Pancikiewicz, K. Structure and properties of welded joints of 7CrMoVTiB10-10 (T24) steel. Adv. Mater. Sci.2018, 18, 37–47. [CrossRef]
28. Yu, J.H.; Choi, Y.S.; Shim, D.S.; Park, S.H. Repairing casting part using laser assisted additive metal-layerdeposition and its mechanical properties. Opt. Laser Technol. 2018, 106, 87–93. [CrossRef]
29. Pandey, C.; Mahapatra, M.; Kumar, P.; Saini, N.; Thakre, J.G.; Vidyarthy, R.S.; Narang, H.K. A brief studyon δ-ferrite evolution in dissimilar P91 and P92 steel weld joint and their effect on mechanical properties.Arch. Civ. Mech. Eng. 2018, 18, 713–722. [CrossRef]
30. Tuz, L. Evaluation of microstructure and selected mechanical properties of laser beam welded S690QLhigh-strength steel. Adv. Mater. Sci. 2018, 18, 34–42. [CrossRef]
31. Kurc-Lisiecka, A.; Piwnik, J.; Lisiecki, A. Laser welding of new grade of advanced high strength steel STRENX1100 MC. Arch. Metall. Mater. 2017, 62, 1651–1657. [CrossRef]
32. Kik, T.; Górka, J. Numerical simulations of laser and hybrid S700MC T-joint welding. Materials 2019, 12, 516.[CrossRef]
33. Skowronska, B.; Chmielewski, T.; Pachla, W.; Kulczyk, M.; Skiba, J.; Presz, W. Friction weldability of UFG316L stainless steel. Arch. Metall. Mater. 2019, 64, 1051–1058.
34. Konovalov, S.V.; Kormyashev, V.E.; Gromov, V.E.; Ivanov, Y.F.; Kapralov, E.V.; Semin, A.P. Formation featuresof structure-phase states of Cr-Nb-C-V containing coatings on martensitic steel. J. Surf. Investig. 2016, 10,1119–1124. [CrossRef]
35. Chen, X.; Su, C.; Wang, Y.; Siddiquee, A.N.; Konovalov, S.; Jayalakshami, S.; Singh, R.A. Cold metal transfer(CMT) based wire and arc additive manufacture (WAAM) system. J. Surf. Investig. 2018, 12, 1278–1284.[CrossRef]
Materials 2019, 12, 3372 10 of 10
36. Dehghani, A.; Aslani, F. A review on defects in steel offshore structures and developed strengtheningtechniques. Structures 2019, 20, 635–657. [CrossRef]
37. Meng, X.; Chen, G.; Zhu, G.; Zhu, Y. Dynamic quantitative risk assessment of accidents inducted by leakageon offshore platforms using DEMATEL-BN. Int. J. Nav. Archit. Ocean Eng. 2019, 11, 22–32. [CrossRef]
38. Wodtke, M.; Olszewski, A.; Wójcikowski, A. FEM calculations in analysis of steel subsea water injectionflowlines designing process. Pol. Marit. Res. 2018, 25, 84–93. [CrossRef]
39. Kolios, A.; Wang, L.; Mehmanparast, A.; Brennan, F. Determination of stress concentration factors in offshorewind welded structures through a hybrid experimental and numerical approach. Ocean Eng. 2019, 178,38–47. [CrossRef]
40. Oh, K.Y.; Nam, W.; Ryu, M.S.; Kim, J.Y.; Epureanu, B.I. A review of foundations of offshore wind energyconvertors: Current status and future perspectives. Renew. Sustain. Energy Rev. 2018, 88, 16–36. [CrossRef]
41. ISO 2560—A Classification of Coated Rod Electrodes for Arc Welding of Unalloyed Steel and Fine-Grained Steel; ISO:Geneva, Switzerland, 1908.
42. EN ISO 17637:2017 Non-Destructive Testing of Welds—Visual Testing of Fusion-Welded Joints; ISO: Geneva,Switzerland, 2017.
43. EN ISO 9015-1:2011 Destructive Tests on Welds in Metallic Materials. Hardness Testing. Hardness Test on ArcWelded Joints; ISO: Geneva, Switzerland, 2011.
44. EN ISO 15614-1:2017 Specification and Qualification of Welding Procedures for Metallic Materials—WeldingProcedure Test—Part 1: Arc and Gas Welding of Steels and Arc Welding of Nickel and Nickel Alloys; ISO: Geneva,Switzerland, 2017.
45. Sun, Y.L.; Obasi, G.; Hamelin, C.J.; Vasileiou, A.N.; Flint, T.F.; Blakrishna, J.; Smith, M.C.; Francis, J.A. Effectsof dilution on alloy content and microstructure in multi-pass steel welds. J. Mater. Process. Technol. 2019, 265,71–86. [CrossRef]
46. Sun, Y.L.; Hamelin, C.J.; Flint, T.F.; Vasileiou, A.N.; Francis, A.; Smith, M.C. Prediction of dilution and itsimpact on the metallurgical and mechanical behavior of a multipass steel weldment. J. Press. Vessel Technol.2019, 141, 061405. [CrossRef]
47. Saida, K.; Bunda, K.; Ogiwara, H.; Nishimoto, K. Microcracking susceptibility in dissimilar multipass weldsof Ni-base alloy 690 and low-alloy steel. Weld. Int. 2015, 29, 668–680. [CrossRef]
48. Sun, Y.L.; Obasi, G.; Hamelin, C.J.; Vasileiou, A.N.; Flint, T.F.; Francis, J.A.; Smith, M.C. Characterization andmodelling of tempering during multi-pass welding. J. Mater. Process. Technol. 2019, 270, 118–131. [CrossRef]
© 2019 by the authors. Licensee MDPI, Basel, Switzerland. This article is an open accessarticle distributed under the terms and conditions of the Creative Commons Attribution(CC BY) license (http://creativecommons.org/licenses/by/4.0/).