Roadshow Presentation - ГК "Ovostar Union" -...
35
June 2011 Roadshow Presentation Egg production and processing http://ovostar.ua/
Transcript of Roadshow Presentation - ГК "Ovostar Union" -...

June 2011
Roadshow Presentation
Egg production and processing
http://ovostar.ua/
Ovostar Union: Roadshow Presentation 2
Disclaimer
NOT FOR RELEASE, DIRECTLY OR INDIRECTLY, IN THE UNITED STATES OF AMERICA, AUSTRALIA, CANADA, JAPAN OR ANY OTHER JURISDICTION WHERE TO DO SO WOULD
BE UNLAWFUL.
IMPORTANT NOTICE
By attending the meeting where this presentation is made, you agree to be bound by the following limitations.
In the European Economic Area, with respect to any Member State that has implemented Directive 2003/71/EC (together with any applicable implementing measures in any Member
State, the "Prospectus Directive") this communication is only addressed to and is only directed at qualified investors in that Member State within the meaning of the Prospectus Directive.
The securities referred to herein have not been and will not be registered under the US Securities Act of 1933, as amended (the "Securities Act"), and may not be offered or sold in the United
States or to US persons (as such term is defined in Regulation S under the Securities Act) unless the securities are registered under the Securities Act, or an exemption from the registration
requirements of the Securities Act is available. The issuer of the securities has not registered, and does not intend to register, any portion of the offering in the United States, and does not
intend to conduct a public offering of securities in the United States.
This communication is directed solely at (i) persons outside Poland and the United Kingdom, or (ii) persons with professional experience in matters relating to investments and high net worth
entities, and other persons to whom it may lawfully be communicated, falling within respective provisions implementing article 3.2.a of the Prospectus Directive in Poland, (iii) persons with
professional experience in matters relating to investments falling within Article 19(5) of the Financial Services and Markets Act 2000 (Financial Promotion) Order 2005 as amended (the
"Order"), (iv) high net worth entities, and other persons to whom it may lawfully be communicated, falling within Article 49(2)(a) to (d) of the Order, and (v) persons to whom an invitation or
inducement to engage in investment activity (within the meaning of section 21 of the Financial Services and Markets Act 2000 ("FSMA")) in connection with the issue or sale of any securities
of the Company or any member of its group may otherwise lawfully be communicated or caused to be communicated (all such persons in (i)-(v) above being "relevant persons"). Any
investment activity to which this communication relates will only be available to and will only be engaged with relevant persons. Any person who is not a relevant person should not act or rely
on this communication.
This presentation and its contents are confidential and proprietary to Ovostar Union N.V. (the "Company") and no part of it or its subject matter may be reproduced, redistributed, passed
on, or the contents otherwise divulged, directly or indirectly, to any other person (excluding the relevant person's professional advisers) or published in whole or in part for any purpose without
the prior consent of the Company, BIC Securities SIA, BZ WBK S.A., DM BZ WBK S.A. and KBC Securities N.V. (Branch in Poland). If this presentation has been received in error then it
must be returned immediately. The recipients of this presentation should not base any behaviour in relation to investments or products which would amount to market abuse on the
information in this presentation until after the information has been made generally available. Nor should the recipient use the information in this presentation in any way which would
constitute market abuse.
These materials shall not constitute an offer to sell or the solicitation of an offer to buy, nor shall there be any sale of the securities referred to herein in any jurisdiction in which such
offer, solicitation or sale would be unlawful prior to registration, exemption from registration or qualification under the securities laws of any such jurisdiction.
The information contained in this presentation has not been independently verified. No representation or warranty, express or implied, is made as to, and no reliance should be placed on, the
correctness, completeness or accuracy of the information or opinions contained therein. Neither the Company nor any of its representatives will be liable for any damages arising from any
use of this presentation or otherwise arising in connection with this presentation.
Assumptions, opinions and views reflected in this presentation are solely opinions and forecasts of the Company. Opinions and forecasts are statements using expressions such as
"expects", "believes", "assumes", "is the opinion", "to the best of our knowledge" and similar phrases. They reflect the current view of the Company with regard to potential future
events, which, however, are uncertain and therefore subject to risk. A multitude of factors can cause actual events to differ significantly from an anticipated development, such as changes in
regulatory systems, increased or new competition in the market, risks arising from acquisitions, interest rate and currency risks or risks based on previous liabilities and litigation risks. Neither
the Company nor its management can answer for the future accuracy of the opinions expressed in this presentation or the actual occurrence of the developments forecast.
The information contained herein has been prepared using information available to the Company at the time of preparation of the presentation. External or other factors may have impacted
on the business of the Company and the content of this presentation, since its preparation. In addition all relevant information about the Company may not be included in this presentation.
A draft prospectus in connection with a proposed initial public offering (the “IPO”) of the Company has been filed with Autoriteit Financiële Markten (the "AFM") which is the competent capital
markets authority in the Netherlands. The Company may conduct the IPO once the AFM approves the prospectus, and provides Komisja Nadzoru Finansowego, the competent capital
markets authority in Poland with a certificate of approval of the Prospectus, and the Company publishes the approved prospectus. The Prospectus, if approved, will be published on the
website of the Issuer (www.ovostar.ua) and the website of the offering broker in Poland (www.dmbzwbk.pl).
This document is for promotional purposes only and under no circumstances shall constitute the basis for a decision to invest in securities of the Company. It does not constitute a
recommendation to invest in any securities. There is no assurance that the prospectus will be approved or that the Company will proceed with the IPO. The Prospectus will be the sole legally
binding document including information on the Company and the IPO.

Ovostar Union: Roadshow Presentation 3
Presentation team
Name: Borys Bielikov
Age: 42 years
Position: Co-owner and the CEO
Education: National Aviation University
Industry experience: 18 years
Name: Vitalii Veresenko
Age: 42 years
Position: Co-owner and the Chairman of the Board
Education: Kyiv Air Defense Radio Technical Engineers College
Industry experience: 20 years
Name: Natalia Malyovana
Age: 31 years
Position: Commercial Director
Education: Kyiv National Economics University
Industry experience: 12 years
Ovostar Union: Roadshow Presentation 4
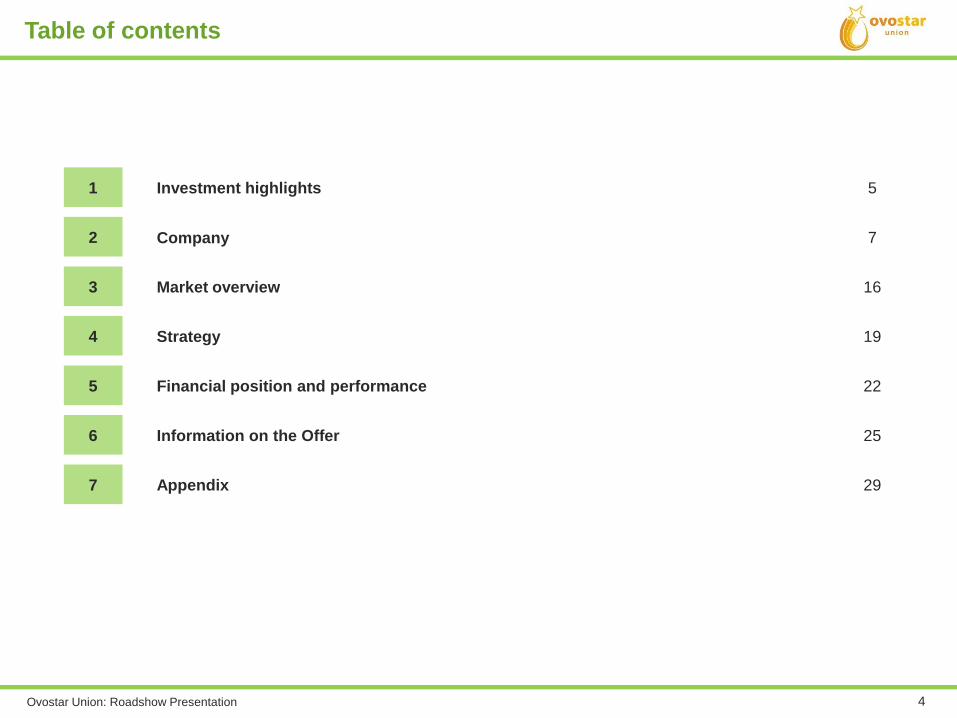
1 Investment highlights 5
2 Company 7
3 Market overview 16
4 Strategy 19
5 Financial position and performance 22
6 Information on the Offer 25
7 Appendix 29
Table of contents
Ovostar Union: Roadshow Presentation 5
Investment highlights
Section 1
Ovostar Union: Roadshow Presentation 6
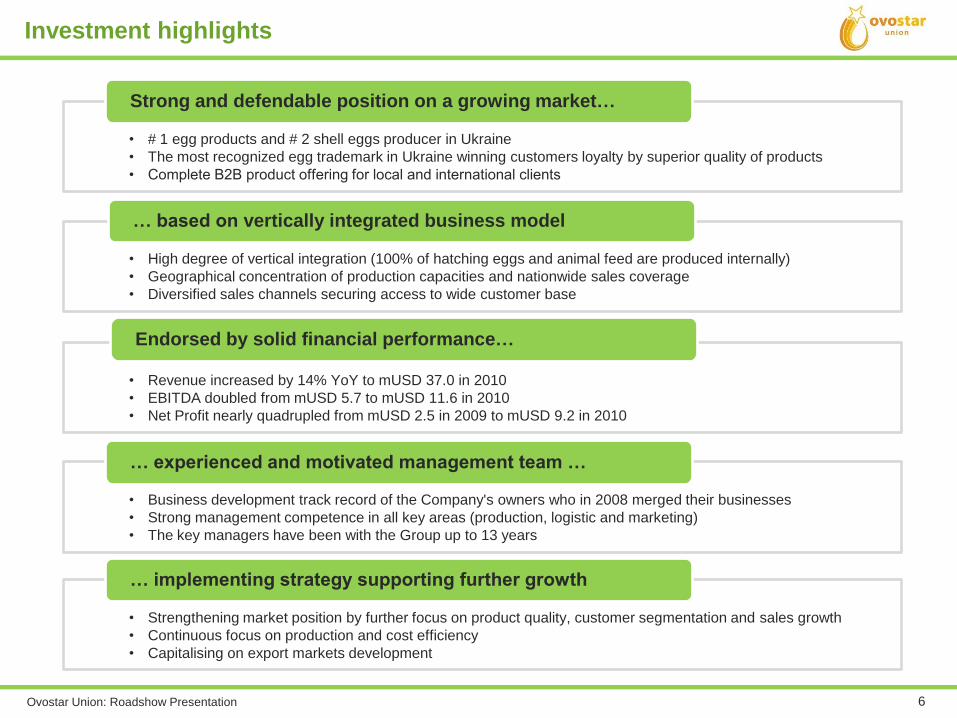
Investment highlights
• # 1 egg products and # 2 shell eggs producer in Ukraine
• The most recognized egg trademark in Ukraine winning customers loyalty by superior quality of products
• Complete В2В product offering for local and international clients
Strong and defendable position on a growing market…
• High degree of vertical integration (100% of hatching eggs and animal feed are produced internally)
• Geographical concentration of production capacities and nationwide sales coverage
• Diversified sales channels securing access to wide customer base
… based on vertically integrated business model
• Revenue increased by 14% YoY to mUSD 37.0 in 2010
• EBITDA doubled from mUSD 5.7 to mUSD 11.6 in 2010
• Net Profit nearly quadrupled from mUSD 2.5 in 2009 to mUSD 9.2 in 2010
Endorsed by solid financial performance…
• Business development track record of the Company's owners who in 2008 merged their businesses
• Strong management competence in all key areas (production, logistic and marketing)
• The key managers have been with the Group up to 13 years
… experienced and motivated management team …
• Strengthening market position by further focus on product quality, customer segmentation and sales growth
• Continuous focus on production and cost efficiency
• Capitalising on export markets development
… implementing strategy supporting further growth
Ovostar Union: Roadshow Presentation 7
Company
Section 2
Ovostar Union: Roadshow Presentation 8
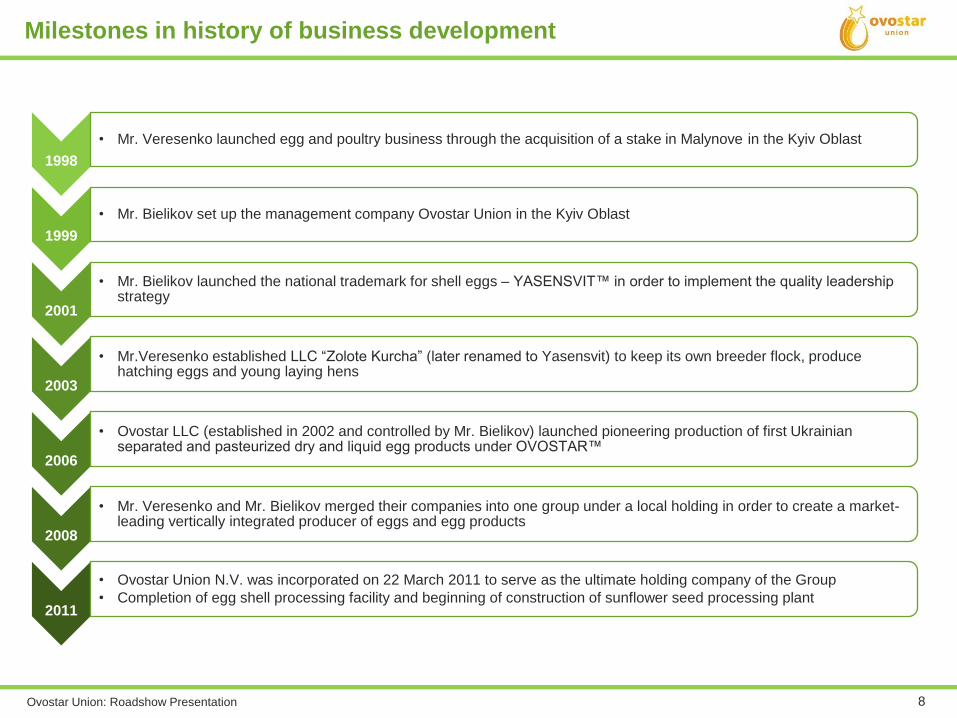
Milestones in history of business development
1998
• Mr. Veresenko launched egg and poultry business through the acquisition of a stake in Malynove in the Kyiv Oblast
1999
• Mr. Bielikov set up the management company Ovostar Union in the Kyiv Oblast
2001
• Mr. Bielikov launched the national trademark for shell eggs – YASENSVIT™ in order to implement the quality leadership strategy
2003
• Mr.Veresenko established LLC “Zolote Kurcha” (later renamed to Yasensvit) to keep its own breeder flock, produce hatching eggs and young laying hens
2006
• Ovostar LLC (established in 2002 and controlled by Mr. Bielikov) launched pioneering production of first Ukrainian separated and pasteurized dry and liquid egg products under OVOSTAR™
2008
• Mr. Veresenko and Mr. Bielikov merged their companies into one group under a local holding in order to create a market-leading vertically integrated producer of eggs and egg products
2011
• Ovostar Union N.V. was incorporated on 22 March 2011 to serve as the ultimate holding company of the Group
• Completion of egg shell processing facility and beginning of construction of sunflower seed processing plant
Ovostar Union: Roadshow Presentation 9
3 177 3 497
4 706
2008 2009 2010
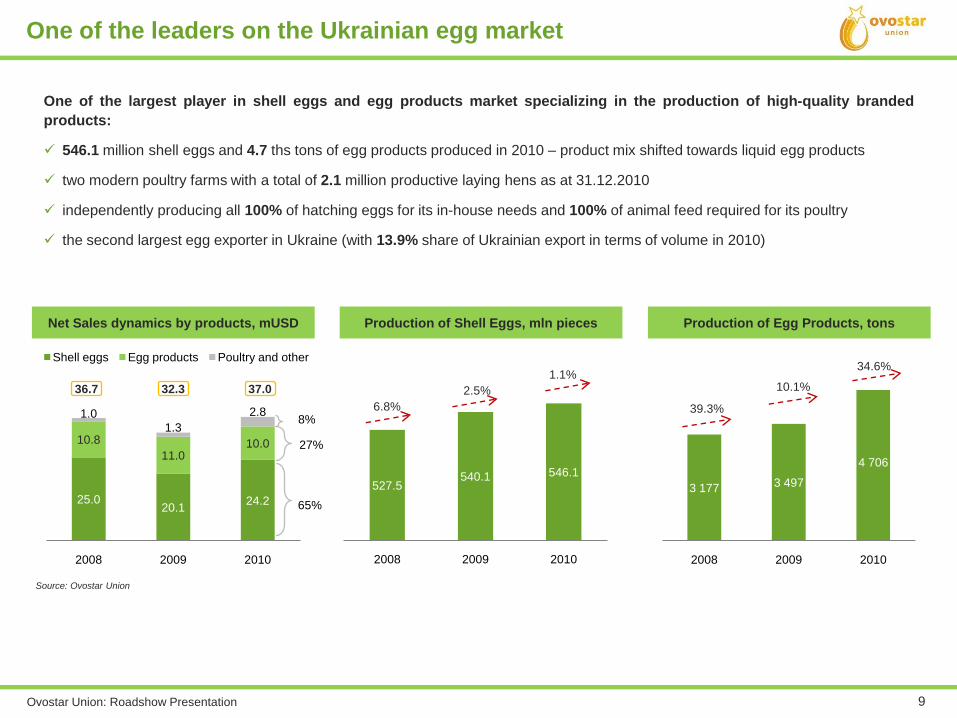
One of the largest player in shell eggs and egg products market specializing in the production of high-quality branded
products:
546.1 million shell eggs and 4.7 ths tons of egg products produced in 2010 – product mix shifted towards liquid egg products
two modern poultry farms with a total of 2.1 million productive laying hens as at 31.12.2010
independently producing all 100% of hatching eggs for its in-house needs and 100% of animal feed required for its poultry
the second largest egg exporter in Ukraine (with 13.9% share of Ukrainian export in terms of volume in 2010)
One of the leaders on the Ukrainian egg market
Net Sales dynamics by products, mUSD
Source: Ovostar Union
Production of Shell Eggs, mln pieces Production of Egg Products, tons
527.5540.1 546.1
2008 2009 2010
6.8%
2.5%
1.1%
39.3%
10.1%
34.6%
25.020.1
24.2
10.8
11.010.0
1.01.3
2.8
2008 2009 2010
Shell eggs Egg products Poultry and other
36.7 32.3 37.0
27%
65%
8%
Ovostar Union: Roadshow Presentation 10
64% 64%
85%
36% 36%
15%
2008 2009 2010
Branded eggs Unbranded eggs
24.220.125.0
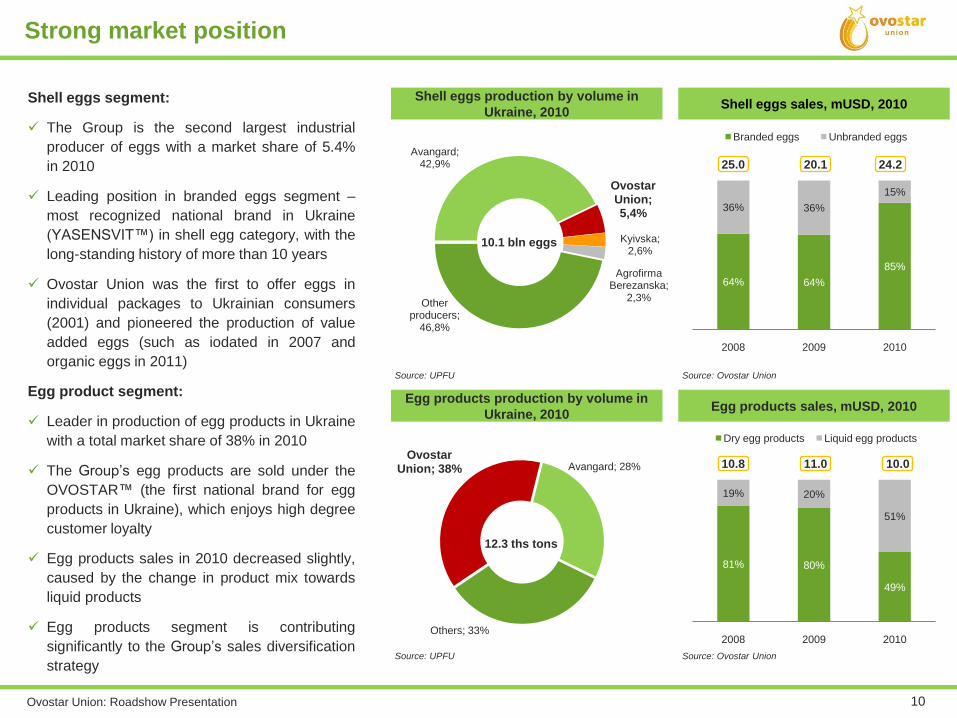
Strong market position
Shell eggs production by volume in
Ukraine, 2010
Egg products production by volume in
Ukraine, 2010
Avangard; 42,9%
Ovostar Union; 5,4%
Kyivska; 2,6%
Agrofirma Berezanska;
2,3%Other
producers; 46,8%
Ovostar Union; 38% Avangard; 28%
Others; 33%
10.1 bln eggs
12.3 ths tons
Source: UPFU
Source: UPFU
Shell eggs segment:
The Group is the second largest industrial
producer of eggs with a market share of 5.4%
in 2010
Leading position in branded eggs segment –
most recognized national brand in Ukraine
(YASENSVIT™) in shell egg category, with the
long-standing history of more than 10 years
Ovostar Union was the first to offer eggs in
individual packages to Ukrainian consumers
(2001) and pioneered the production of value
added eggs (such as iodated in 2007 and
organic eggs in 2011)
Egg product segment:
Leader in production of egg products in Ukraine
with a total market share of 38% in 2010
The Group’s egg products are sold under the
OVOSTAR™ (the first national brand for egg
products in Ukraine), which enjoys high degree
customer loyalty
Egg products sales in 2010 decreased slightly,
caused by the change in product mix towards
liquid products
Egg products segment is contributing
significantly to the Group’s sales diversification
strategy
Shell eggs sales, mUSD, 2010
Egg products sales, mUSD, 2010
Source: Ovostar Union
Source: Ovostar Union
81% 80%
49%
19% 20%
51%
2008 2009 2010
Dry egg products Liquid egg products
10.011.010.8
Ovostar Union: Roadshow Presentation 11
Cherkasy
region
Kyiv
region
KyivVasylkiv
NahirnaSkybyn
Saltanivka
Kaharlyk
Stavyshche
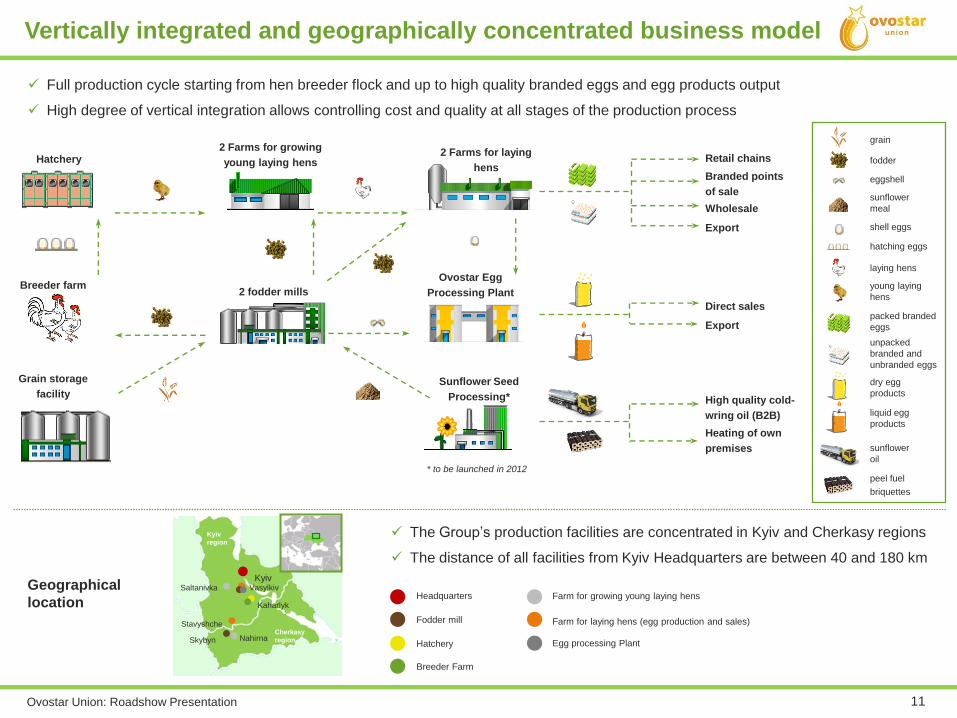
Full production cycle starting from hen breeder flock and up to high quality branded eggs and egg products output
High degree of vertical integration allows controlling cost and quality at all stages of the production process
Vertically integrated and geographically concentrated business model
grain
fodder
eggshell
dry egg
products
packed branded
eggs
unpacked
branded and
unbranded eggs
liquid egg
products
sunflower
meal
sunflower
oil
peel fuel
briquettes
* to be launched in 2012
Retail chains
Branded points
of sale
Wholesale
Export
Hatchery
Breeder farm
2 Farms for growing
young laying hens
2 fodder mills
2 Farms for laying
hens
Ovostar Egg
Processing Plant
Sunflower Seed
Processing*
Grain storage
facility
Direct sales
Export
High quality cold-
wring oil (B2B)
Heating of own
premises
Fodder mill
Hatchery
Farm for laying hens (egg production and sales)
Headquarters
Egg processing Plant
Farm for growing young laying hens
Breeder Farm
The Group’s production facilities are concentrated in Kyiv and Cherkasy regions
The distance of all facilities from Kyiv Headquarters are between 40 and 180 km
Geographical
location
shell eggs
hatching eggs
laying hens
young laying
hens
Ovostar Union: Roadshow Presentation 12
To
p-3
eg
gs b
y g
ross
ma
rgin
in 2
01
0
To
p-3
eg
gs b
y c
on
trib
uti
on
to
sh
ell
eg
gs s
ale
s in
201
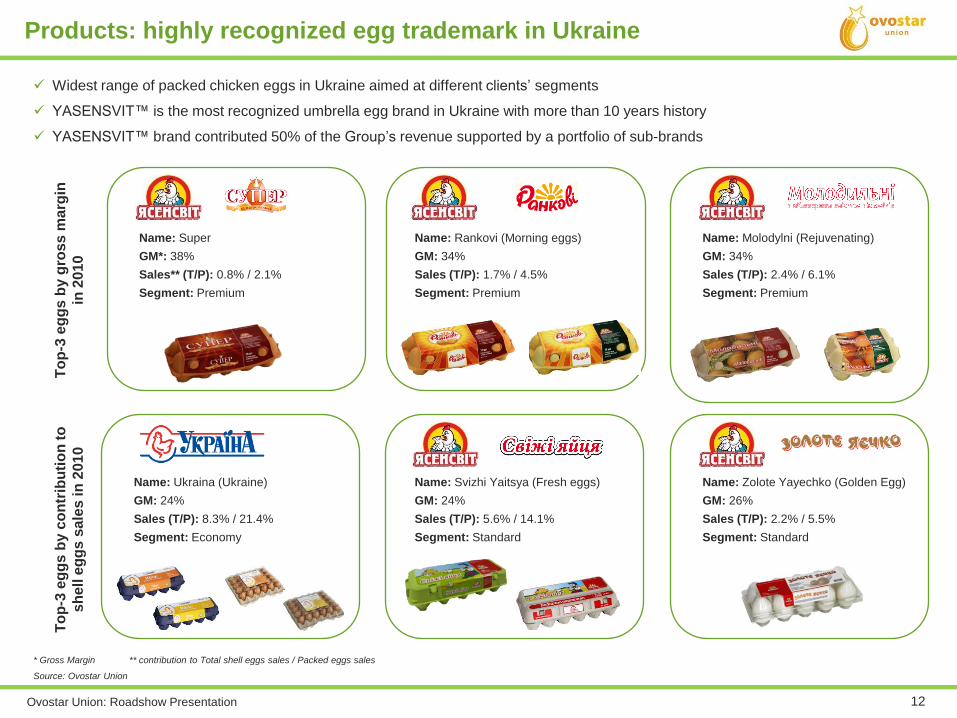
0 Widest range of packed chicken eggs in Ukraine aimed at different clients’ segments
YASENSVIT™ is the most recognized umbrella egg brand in Ukraine with more than 10 years history
YASENSVIT™ brand contributed 50% of the Group’s revenue supported by a portfolio of sub-brands
* Gross Margin ** contribution to Total shell eggs sales / Packed eggs sales
Name: Ukraina (Ukraine)
GM: 24%
Sales (T/P): 8.3% / 21.4%
Segment: Economy
Name: Zolote Yayechko (Golden Egg)
GM: 26%
Sales (T/P): 2.2% / 5.5%
Segment: Standard
Name: Svizhi Yaitsya (Fresh eggs)
GM: 24%
Sales (T/P): 5.6% / 14.1%
Segment: Standard
Name: Super
GM*: 38%
Sales** (T/P): 0.8% / 2.1%
Segment: Premium
Name: Molodylni (Rejuvenating)
GM: 34%
Sales (T/P): 2.4% / 6.1%
Segment: Premium
Name: Rankovi (Morning eggs)
GM: 34%
Sales (T/P): 1.7% / 4.5%
Segment: Premium
Products: highly recognized egg trademark in Ukraine
Source: Ovostar Union
Ovostar Union: Roadshow Presentation 13
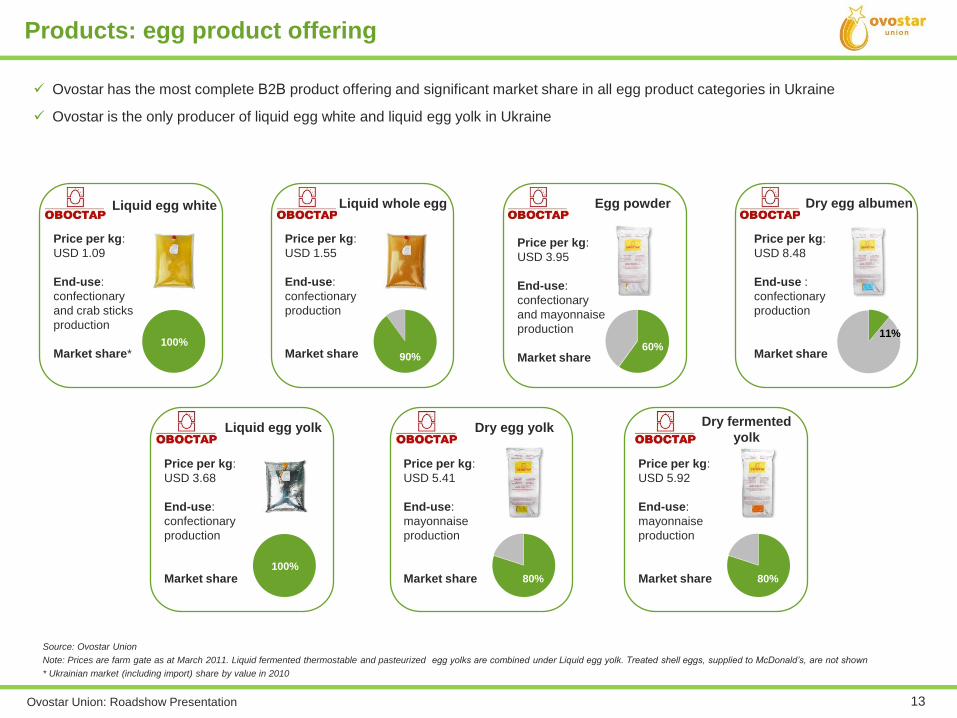
Price per kg:
USD 3.95
End-use:
confectionary
and mayonnaise
production
Market share
Egg powder
60%
Price per kg:
USD 5.41
End-use:
mayonnaise
production
Market share
Dry egg yolk
80%
Price per kg:
USD 3.68
End-use:
confectionary
production
Market share
Liquid egg yolk
100%
Price per kg:
USD 5.92
End-use:
mayonnaise
production
Market share
Dry fermented
yolk
80%
Price per kg:
USD 8.48
End-use :
confectionary
production
Market share
Dry egg albumen
11%
Price per kg:
USD 1.55
End-use:
confectionary
production
Market share
Liquid whole egg
90%
Price per kg:
USD 1.09
End-use:
confectionary
and crab sticks
production
Market share*
Liquid egg white
100%
Source: Ovostar Union
Note: Prices are farm gate as at March 2011. Liquid fermented thermostable and pasteurized egg yolks are combined under Liquid egg yolk. Treated shell eggs, supplied to McDonald’s, are not shown
* Ukrainian market (including import) share by value in 2010
Ovostar has the most complete В2В product offering and significant market share in all egg product categories in Ukraine
Ovostar is the only producer of liquid egg white and liquid egg yolk in Ukraine
Products: egg product offering
Ovostar Union: Roadshow Presentation 14
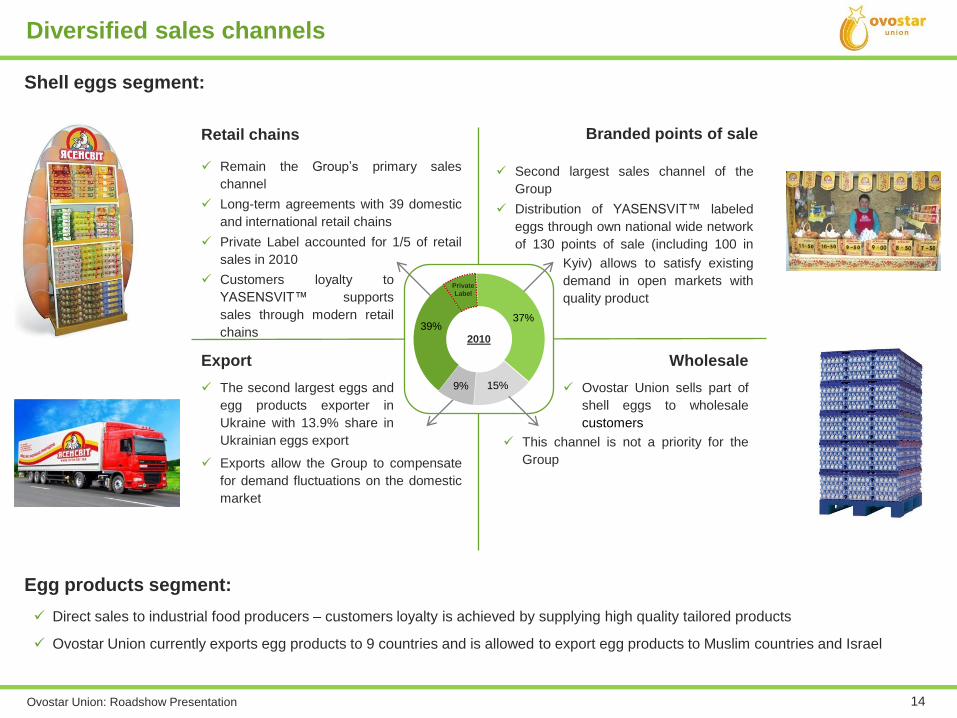
Ovostar Union sells part of
shell eggs to wholesale
customers
Second largest sales channel of the
Group
Distribution of YASENSVIT™ labeled
eggs through own national wide network
of 130 points of sale (including 100 in
Kyiv
Diversified sales channels
Retail chains Branded points of sale
Export Wholesale
Remain the Group’s primary sales
channel
Long-term agreements with 39 domestic
and international retail chains
Private Label accounted for 1/5 of retail
sales in 2010
Customers loyalty to
YASENSVIT™ supports
sales through modern retail
chains
Exports allow the Group to compensate
for demand fluctuations on the domestic
market
Direct sales to industrial food producers – customers loyalty is achieved by supplying high quality tailored products
Ovostar Union currently exports egg products to 9 countries and is allowed to export egg products to Muslim countries and Israel
Shell eggs segment:
The second largest eggs and
egg products exporter in
Ukraine with 13.9% share in
Ukrainian eggs export
Egg products segment:
2010
Kyiv) allows to satisfy existing
demand in open markets with
quality product
This channel is not a priority for the
Group
39%37%
15%9%
Private
Label
Ovostar Union: Roadshow Presentation 15
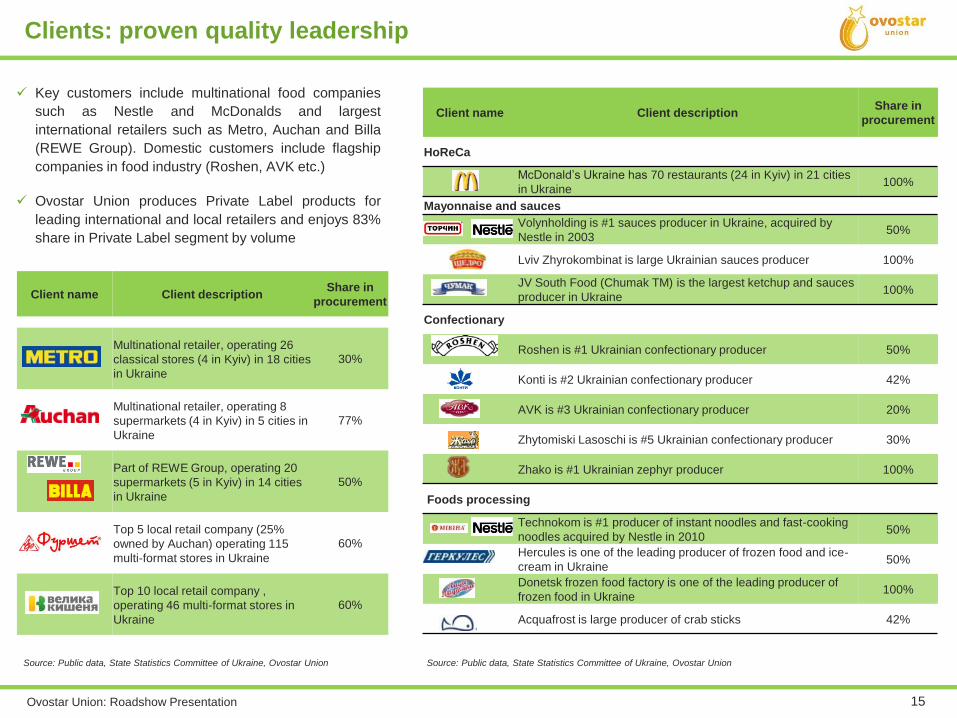
Client name Client descriptionShare in
procurement
HoReCa
McDonald’s Ukraine has 70 restaurants (24 in Kyiv) in 21 cities
in Ukraine100%
Mayonnaise and sauces
Volynholding is #1 sauces producer in Ukraine, acquired by
Nestle in 200350%
Lviv Zhyrokombinat is large Ukrainian sauces producer 100%
JV South Food (Chumak TM) is the largest ketchup and sauces
producer in Ukraine 100%
Confectionary
Roshen is #1 Ukrainian confectionary producer 50%
Konti is #2 Ukrainian confectionary producer 42%
AVK is #3 Ukrainian confectionary producer 20%
Zhytomiski Lasoschi is #5 Ukrainian confectionary producer 30%
Zhako is #1 Ukrainian zephyr producer 100%
Foods processing
Technokom is #1 producer of instant noodles and fast-cooking
noodles acquired by Nestle in 201050%
Hercules is one of the leading producer of frozen food and ice-
cream in Ukraine50%
Donetsk frozen food factory is one of the leading producer of
frozen food in Ukraine100%
Acquafrost is large producer of crab sticks 42%
Source: Public data, State Statistics Committee of Ukraine, Ovostar Union
Clients: proven quality leadership
Client name Client descriptionShare in
procurement
Multinational retailer, operating 26
classical stores (4 in Kyiv) in 18 cities
in Ukraine
30%
Multinational retailer, operating 8
supermarkets (4 in Kyiv) in 5 cities in
Ukraine
77%
Part of REWE Group, operating 20
supermarkets (5 in Kyiv) in 14 cities
in Ukraine
50%
Top 5 local retail company (25%
owned by Auchan) operating 115
multi-format stores in Ukraine
60%
Top 10 local retail company ,
operating 46 multi-format stores in
Ukraine
60%
Key customers include multinational food companies
such as Nestle and McDonalds and largest
international retailers such as Metro, Auchan and Billa
(REWE Group). Domestic customers include flagship
companies in food industry (Roshen, AVK etc.)
Ovostar Union produces Private Label products for
leading international and local retailers and enjoys 83%
share in Private Label segment by volume
Source: Public data, State Statistics Committee of Ukraine, Ovostar Union
Ovostar Union: Roadshow Presentation 16
Market overview
Section 3
Ovostar Union: Roadshow Presentation 17
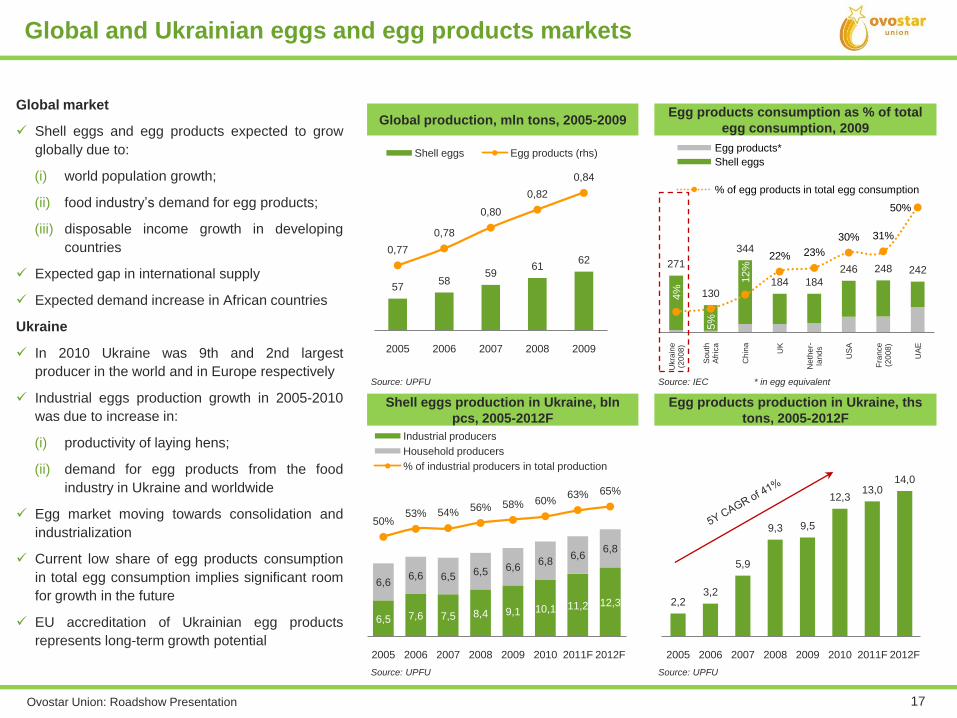
6,5 7,6 7,5 8,4 9,1 10,1 11,2 12,3
6,66,6 6,5 6,5 6,6
6,86,6
6,8
50%53% 54%
56% 58% 60%63% 65%
2005 2006 2007 2008 2009 2010 2011F 2012F
Industrial producers
Household producers
% of industrial producers in total production
Global market
Shell eggs and egg products expected to grow
globally due to:
(i) world population growth;
(ii) food industry’s demand for egg products;
(iii) disposable income growth in developing
countries
Expected gap in international supply
Expected demand increase in African countries
Ukraine
In 2010 Ukraine was 9th and 2nd largest
producer in the world and in Europe respectively
Industrial eggs production growth in 2005-2010
was due to increase in:
(i) productivity of laying hens;
(ii) demand for egg products from the food
industry in Ukraine and worldwide
Egg market moving towards consolidation and
industrialization
Current low share of egg products consumption
in total egg consumption implies significant room
for growth in the future
EU accreditation of Ukrainian egg products
represents long-term growth potential
Source: UPFU
5758
5961
620,77
0,78
0,80
0,82
0,84
2005 2006 2007 2008 2009
Shell eggs Egg products (rhs)
Global production, mln tons, 2005-2009Egg products consumption as % of total
egg consumption, 2009
Source: IEC * in egg equivalent
Source: UPFU
Global and Ukrainian eggs and egg products markets
Shell eggs production in Ukraine, bln
pcs, 2005-2012F
Egg products production in Ukraine, ths
tons, 2005-2012F
2,23,2
5,9
9,3 9,5
12,313,0
14,0
2005 2006 2007 2008 2009 2010 2011F 2012F
Source: UPFU
271
130
344
184 184
246 248 242
4%
5%
12%
22% 23%
30% 31%
50%
Ukra
ine
(20
08
)
So
uth
Afr
ica
Chin
a
UK
Neth
er-
lan
ds
US
A
Fra
nce
(20
08
)
UA
E
Egg products*
Shell eggs
% of egg products in total egg consumption
Ovostar Union: Roadshow Presentation 18
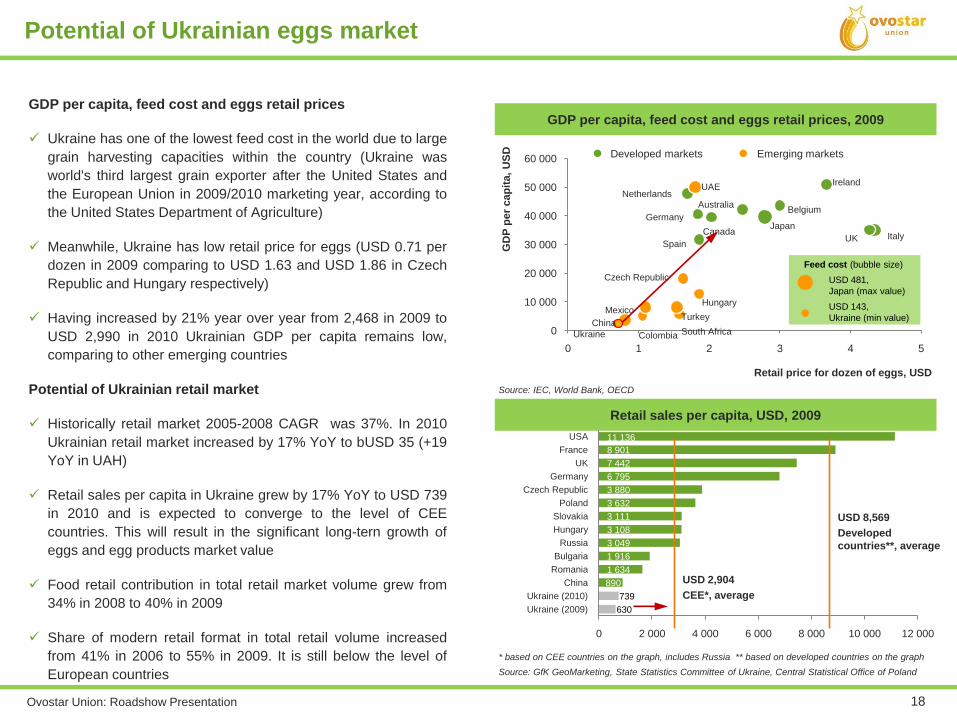
Source: GfK GeoMarketing, State Statistics Committee of Ukraine, Central Statistical Office of Poland
* based on CEE countries on the graph, includes Russia ** based on developed countries on the graph
Retail sales per capita, USD, 2009
GDP per capita, feed cost and eggs retail prices
Ukraine has one of the lowest feed cost in the world due to large
grain harvesting capacities within the country (Ukraine was
world's third largest grain exporter after the United States and
the European Union in 2009/2010 marketing year, according to
the United States Department of Agriculture)
Meanwhile, Ukraine has low retail price for eggs (USD 0.71 per
dozen in 2009 comparing to USD 1.63 and USD 1.86 in Czech
Republic and Hungary respectively)
Having increased by 21% year over year from 2,468 in 2009 to
USD 2,990 in 2010 Ukrainian GDP per capita remains low,
comparing to other emerging countries
Potential of Ukrainian retail market
Historically retail market 2005-2008 CAGR was 37%. In 2010
Ukrainian retail market increased by 17% YoY to bUSD 35 (+19
YoY in UAH)
Retail sales per capita in Ukraine grew by 17% YoY to USD 739
in 2010 and is expected to converge to the level of CEE
countries. This will result in the significant long-tern growth of
eggs and egg products market value
Food retail contribution in total retail market volume grew from
34% in 2008 to 40% in 2009
Share of modern retail format in total retail volume increased
from 41% in 2006 to 55% in 2009. It is still below the level of
European countries
Potential of Ukrainian eggs market
0
10 000
20 000
30 000
40 000
50 000
60 000
0 1 2 3 4 5
China
Mexico
Colombia
Spain
Ukraine South Africa
Turkey
Hungary
Czech Republic
UAENetherlands
Germany
Canada
Belgium
Ireland
Japan
Australia
UK Italy
GD
P p
er
cap
ita,
US
D
USD 481,
Japan (max value)
Feed cost (bubble size)
USD 143,
Ukraine (min value)
Retail price for dozen of eggs, USD
Developed markets Emerging markets
Source: IEC, World Bank, OECD
GDP per capita, feed cost and eggs retail prices, 2009
630
739
890
1 634
1 916
3 049
3 108
3 111
3 632
3 880
6 795
7 442
8 901
11 136
0 2 000 4 000 6 000 8 000 10 000 12 000
Ukraine (2009)
Ukraine (2010)
China
Romania
Bulgaria
Russia
Hungary
Slovakia
Poland
Czech Republic
Germany
UK
France
USA
USD 2,904
CEE*, average
USD 8,569
Developed
countries**, average
Ovostar Union: Roadshow Presentation 19
Strategy
Section 4
Ovostar Union: Roadshow Presentation 20
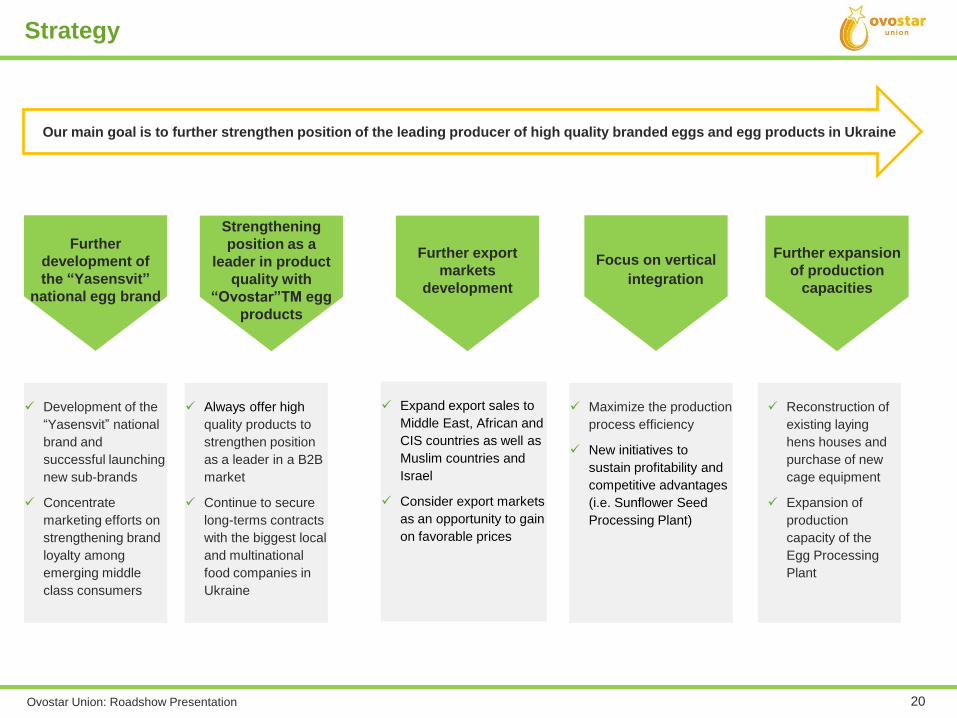
Our main goal is to further strengthen position of the leading producer of high quality branded eggs and egg products in Ukraine
Further
development of
the “Yasensvit”
national egg brand
Further expansion
of production
capacities
Strengthening
position as a
leader in product
quality with
“Ovostar”TM egg
products
Focus on vertical
integration
Further export
markets
development
Development of the
“Yasensvit” national
brand and
successful launching
new sub-brands
Concentrate
marketing efforts on
strengthening brand
loyalty among
emerging middle
class consumers
Reconstruction of
existing laying
hens houses and
purchase of new
cage equipment
Expansion of
production
capacity of the
Egg Processing
Plant
Always offer high
quality products to
strengthen position
as a leader in a B2B
market
Continue to secure
long-terms contracts
with the biggest local
and multinational
food companies in
Ukraine
Maximize the production
process efficiency
New initiatives to
sustain profitability and
competitive advantages
(i.e. Sunflower Seed
Processing Plant)
Expand export sales to
Middle East, African and
CIS countries as well as
Muslim countries and
Israel
Consider export markets
as an opportunity to gain
on favorable prices
Strategy
Ovostar Union: Roadshow Presentation 21
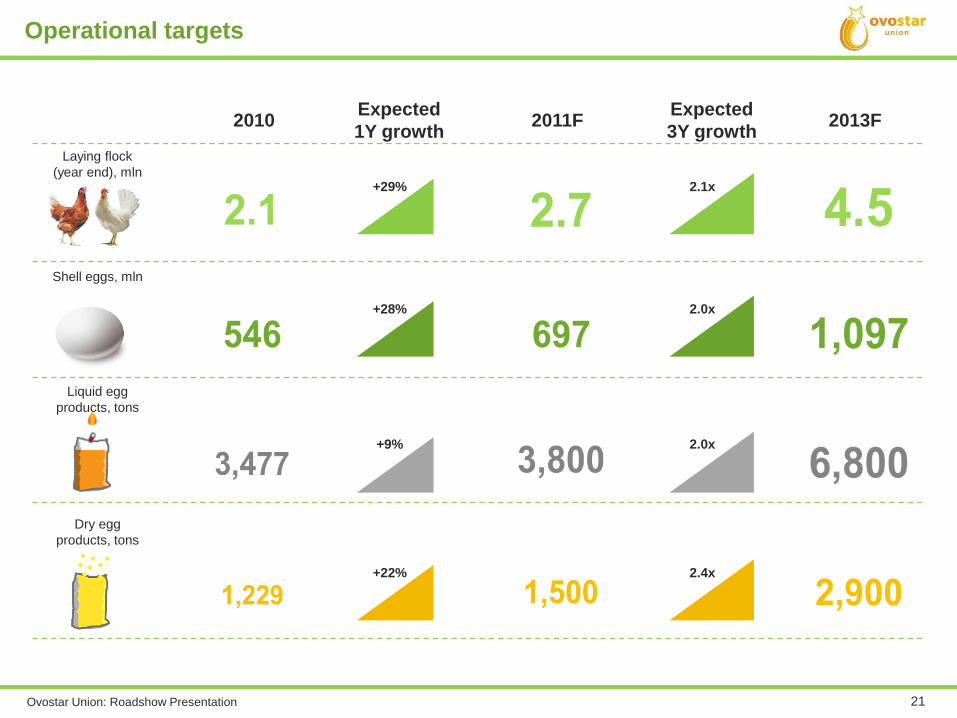
Operational targets
2010 2013FExpected
1Y growth
Laying flock
(year end), mln
Shell eggs, mln
Liquid egg
products, tons
Dry egg
products, tons
+29%
+28%
+9%
+22%
2011FExpected
3Y growth
2.1x
2.0x
2.0x
2.4x
Ovostar Union: Roadshow Presentation 22
Financial position and
performance
Section 5
Ovostar Union: Roadshow Presentation 23
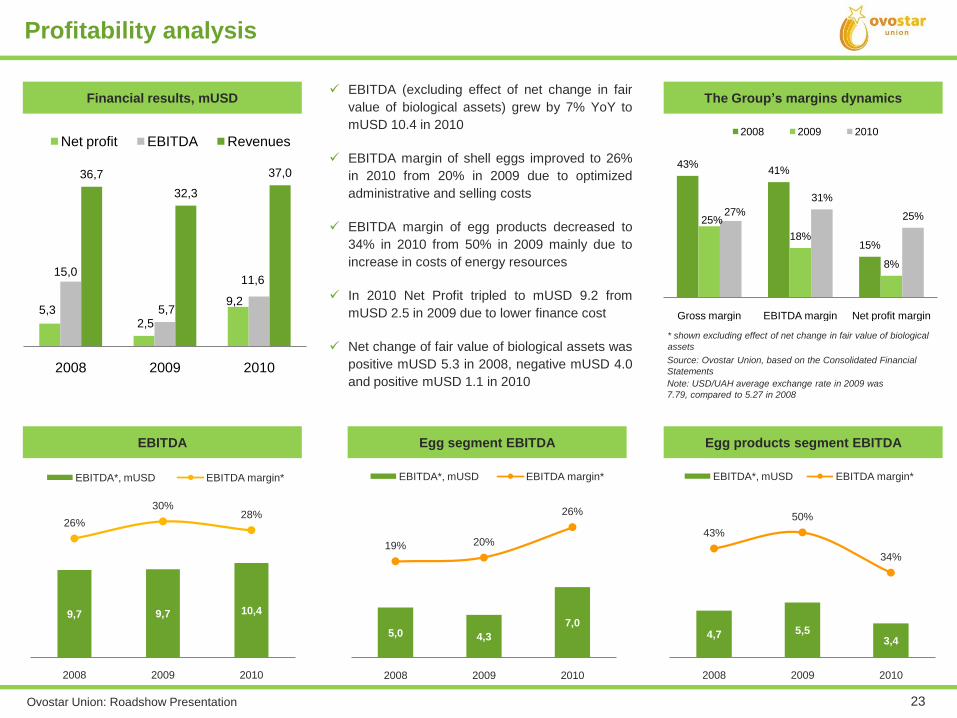
Egg segment EBITDA Egg products segment EBITDA
5,0 4,3
7,0
19% 20%
26%
2008 2009 2010
EBITDA*, mUSD EBITDA margin*
Profitability analysis
4,7 5,53,4
43%
50%
34%
2008 2009 2010
EBITDA*, mUSD EBITDA margin*
EBITDA
9,7 9,7 10,4
26%
30%28%
2008 2009 2010
EBITDA*, mUSD EBITDA margin*
* shown excluding effect of net change in fair value of biological
assets
Source: Ovostar Union, based on the Consolidated Financial
Statements
Note: USD/UAH average exchange rate in 2009 was
7.79, compared to 5.27 in 2008
The Group’s margins dynamics EBITDA (excluding effect of net change in fair
value of biological assets) grew by 7% YoY to
mUSD 10.4 in 2010
EBITDA margin of shell eggs improved to 26%
in 2010 from 20% in 2009 due to optimized
administrative and selling costs
EBITDA margin of egg products decreased to
34% in 2010 from 50% in 2009 mainly due to
increase in costs of energy resources
In 2010 Net Profit tripled to mUSD 9.2 from
mUSD 2.5 in 2009 due to lower finance cost
Net change of fair value of biological assets was
positive mUSD 5.3 in 2008, negative mUSD 4.0
and positive mUSD 1.1 in 2010
43%41%
15%
25%
18%
8%
27%
31%
25%
Gross margin EBITDA margin Net profit margin
2008 2009 2010
5,3 2,5
9,2
15,0
5,7
11,6
36,7
32,3
37,0
2008 2009 2010
Net profit EBITDA Revenues
Financial results, mUSD
Ovostar Union: Roadshow Presentation 24
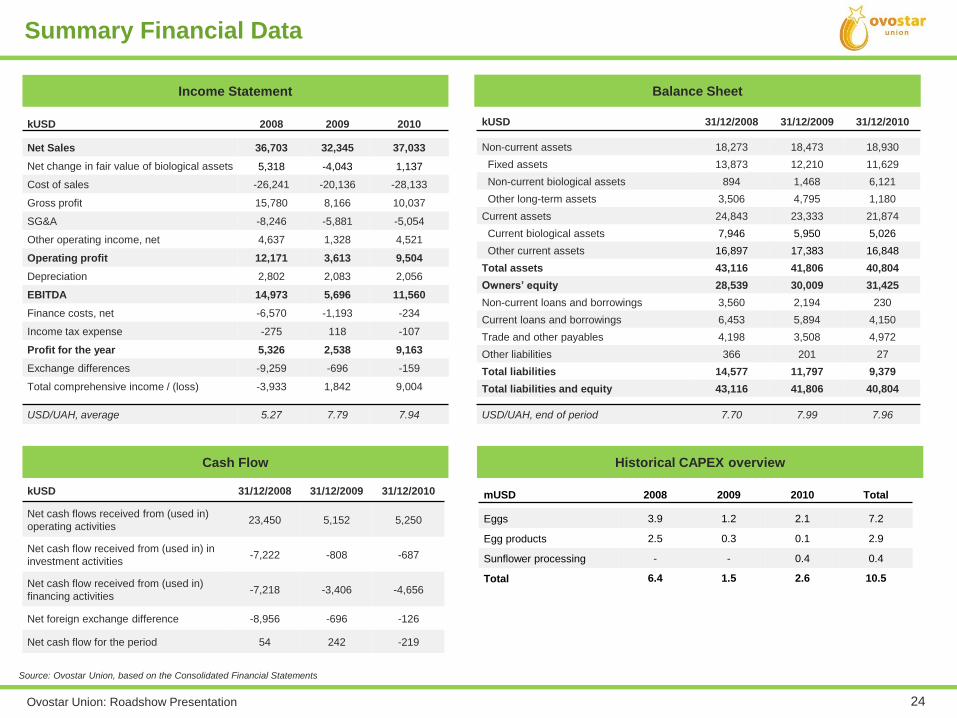
Income Statement
kUSD 2008 2009 2010
Net Sales 36,703 32,345 37,033
Net change in fair value of biological assets 5,318 -4,043 1,137
Cost of sales -26,241 -20,136 -28,133
Gross profit 15,780 8,166 10,037
SG&A -8,246 -5,881 -5,054
Other operating income, net 4,637 1,328 4,521
Operating profit 12,171 3,613 9,504
Depreciation 2,802 2,083 2,056
EBITDA 14,973 5,696 11,560
Finance costs, net -6,570 -1,193 -234
Income tax expense -275 118 -107
Profit for the year 5,326 2,538 9,163
Exchange differences -9,259 -696 -159
Total comprehensive income / (loss) -3,933 1,842 9,004
USD/UAH, average 5.27 7.79 7.94
Source: Ovostar Union, based on the Consolidated Financial Statements
Summary Financial Data
Balance Sheet
kUSD 31/12/2008 31/12/2009 31/12/2010
Non-current assets 18,273 18,473 18,930
Fixed assets 13,873 12,210 11,629
Non-current biological assets 894 1,468 6,121
Other long-term assets 3,506 4,795 1,180
Current assets 24,843 23,333 21,874
Current biological assets 7,946 5,950 5,026
Other current assets 16,897 17,383 16,848
Total assets 43,116 41,806 40,804
Owners’ equity 28,539 30,009 31,425
Non-current loans and borrowings 3,560 2,194 230
Current loans and borrowings 6,453 5,894 4,150
Trade and other payables 4,198 3,508 4,972
Other liabilities 366 201 27
Total liabilities 14,577 11,797 9,379
Total liabilities and equity 43,116 41,806 40,804
USD/UAH, end of period 7.70 7.99 7.96
kUSD 31/12/2008 31/12/2009 31/12/2010
Net cash flows received from (used in)
operating activities23,450 5,152 5,250
Net cash flow received from (used in) in
investment activities-7,222 -808 -687
Net cash flow received from (used in)
financing activities-7,218 -3,406 -4,656
Net foreign exchange difference -8,956 -696 -126
Net cash flow for the period 54 242 -219
Cash Flow
mUSD 2008 2009 2010 Total
Eggs 3.9 1.2 2.1 7.2
Egg products 2.5 0.3 0.1 2.9
Sunflower processing - - 0.4 0.4
Total 6.4 1.5 2.6 10.5
Historical CAPEX overview
Ovostar Union: Roadshow Presentation 25
Information on the Offer
Section 6
Ovostar Union: Roadshow Presentation 26
2.1 mln
546 mln/year
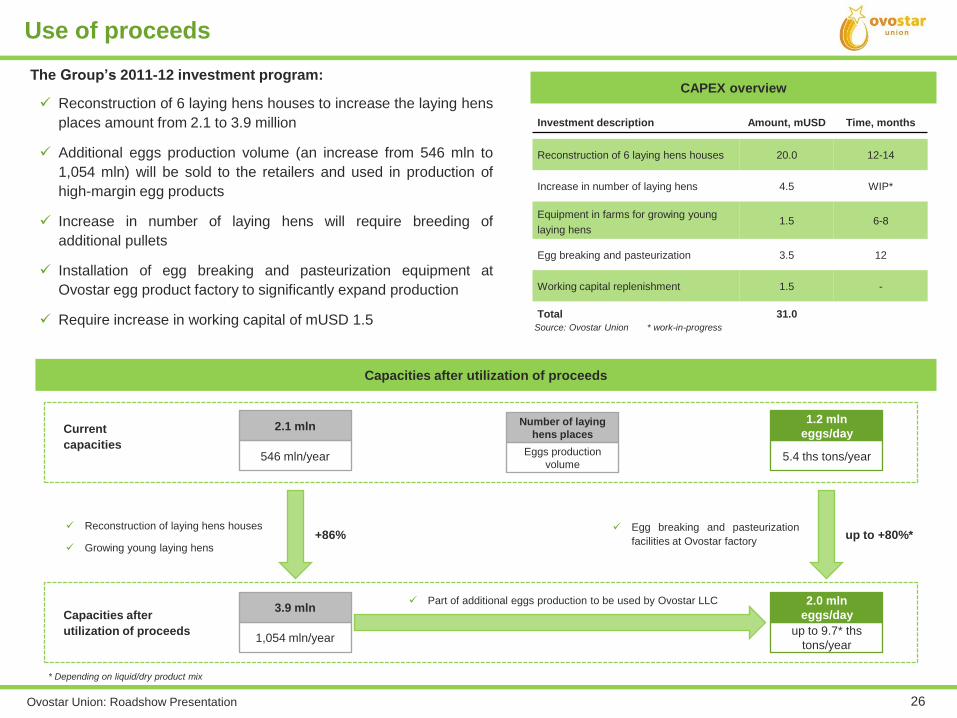
The Group’s 2011-12 investment program:
Reconstruction of 6 laying hens houses to increase the laying hens
places amount from 2.1 to 3.9 million
Additional eggs production volume (an increase from 546 mln to
1,054 mln) will be sold to the retailers and used in production of
high-margin egg products
Increase in number of laying hens will require breeding of
additional pullets
Installation of egg breaking and pasteurization equipment at
Ovostar egg product factory to significantly expand production
Require increase in working capital of mUSD 1.5
3.9 mln
1,054 mln/year
1.2 mln
eggs/day
5.4 ths tons/year
2.0 mln
eggs/day
up to 9.7* ths
tons/year
Reconstruction of laying hens houses
Growing young laying hens
Egg breaking and pasteurization
facilities at Ovostar factory
Part of additional eggs production to be used by Ovostar LLC
Current
capacities
Capacities after
utilization of proceeds
Number of laying
hens places
Eggs production
volume
Source: Ovostar Union * work-in-progress
CAPEX overview
Capacities after utilization of proceeds
* Depending on liquid/dry product mix
Use of proceeds
Investment description Amount, mUSD Time, months
Reconstruction of 6 laying hens houses 20.0 12-14
Increase in number of laying hens 4.5 WIP*
Equipment in farms for growing young
laying hens1.5 6-8
Egg breaking and pasteurization 3.5 12
Working capital replenishment 1.5 -
Total 31.0
+86% up to +80%*
Ovostar Union: Roadshow Presentation 27
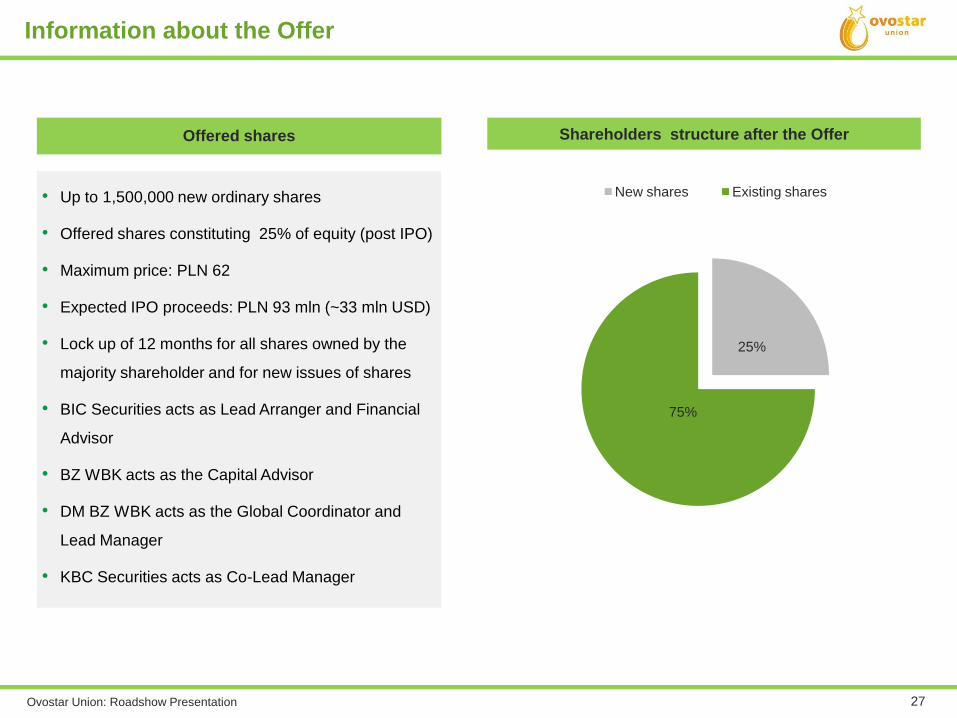
Offered shares
• Up to 1,500,000 new ordinary shares
• Offered shares constituting 25% of equity (post IPO)
• Maximum price: PLN 62
• Expected IPO proceeds: PLN 93 mln (~33 mln USD)
• Lock up of 12 months for all shares owned by the
majority shareholder and for new issues of shares
• BIC Securities acts as Lead Arranger and Financial
Advisor
• BZ WBK acts as the Capital Advisor
• DM BZ WBK acts as the Global Coordinator and
Lead Manager
• KBC Securities acts as Co-Lead Manager
Shareholders structure after the Offer
25%
75%
New shares Existing shares
Information about the Offer

Ovostar Union: Roadshow Presentation 28
Timetable
June 8 9 10 11 12 13 14 15 16 17 18 19 20 21 … 26 27
Book-building by 2:00 PM
Announcement of the Offer Price and final
number of Offer Shares in the each of
tranche
by
9:00
AM
Accepting subscriptions in the Institutional
Tranche
Accepting subscriptions in the Retail
Tranche
Allotment Date (no later than)
Settlement Date
Listing Date (on or around)
Ovostar Union: Roadshow Presentation 29
Appendix
Section 7
Ovostar Union: Roadshow Presentation 30
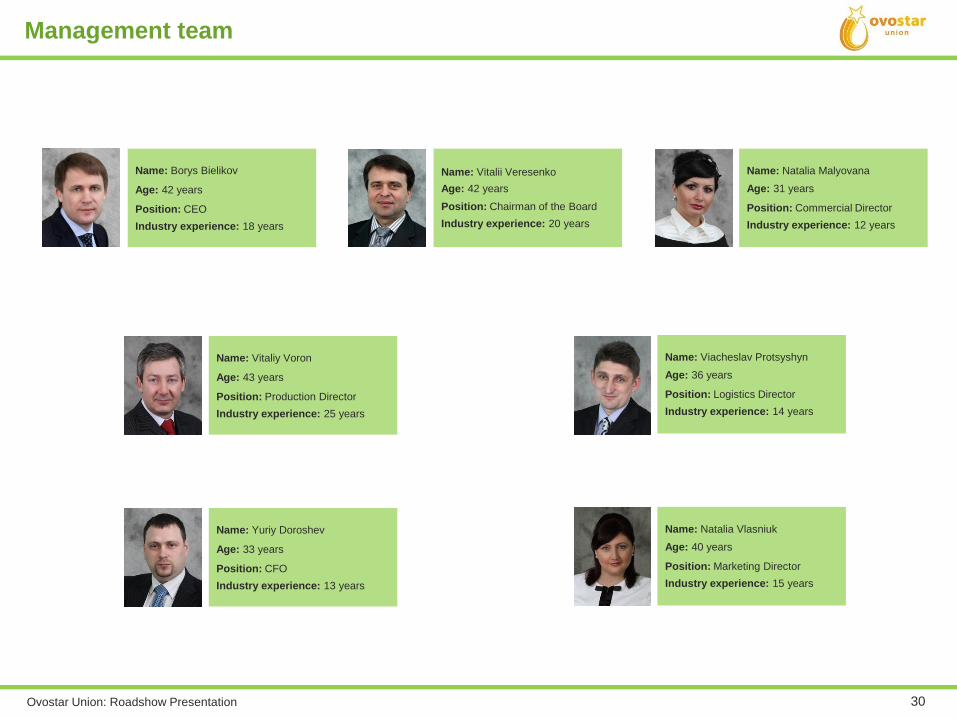
Management team
Name: Borys Bielikov
Age: 42 years
Position: CEO
Industry experience: 18 years
Name: Natalia Malyovana
Age: 31 years
Position: Commercial Director
Industry experience: 12 years
Name: Vitaliy Voron
Age: 43 years
Position: Production Director
Industry experience: 25 years
Name: Viacheslav Protsyshyn
Age: 36 years
Position: Logistics Director
Industry experience: 14 years
Name: Yuriy Doroshev
Age: 33 years
Position: CFO
Industry experience: 13 years
Name: Natalia Vlasniuk
Age: 40 years
Position: Marketing Director
Industry experience: 15 years
Name: Vitalii Veresenko
Age: 42 years
Position: Chairman of the Board
Industry experience: 20 years
Ovostar Union: Roadshow Presentation 31
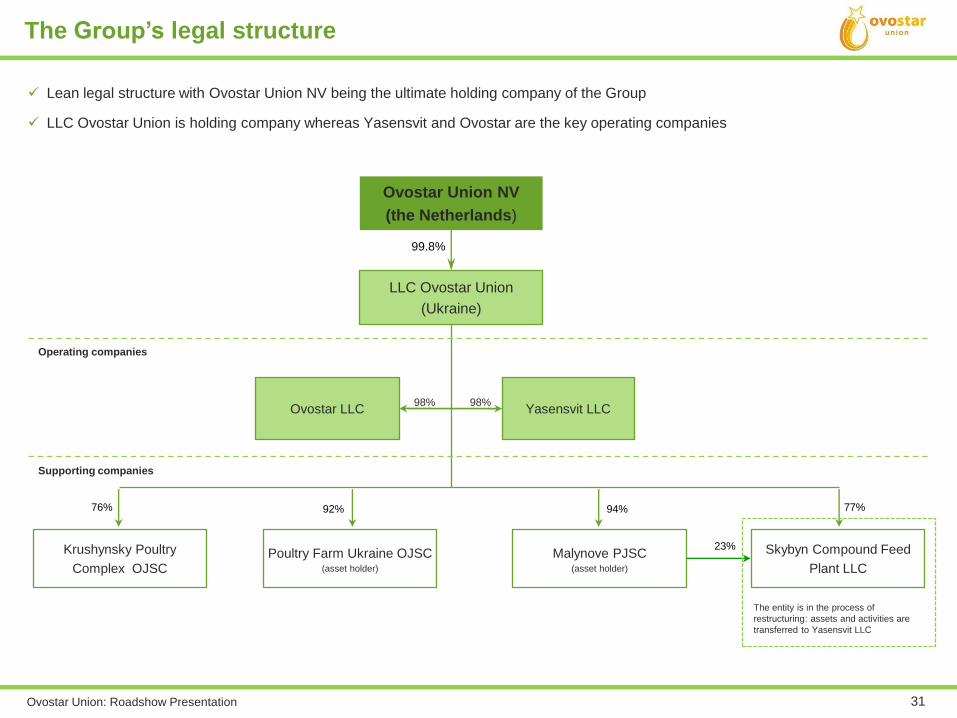
Poultry Farm Ukraine OJSC(asset holder)
LLC Ovostar Union
(Ukraine)
Malynove PJSC(asset holder)
Ovostar LLC Yasensvit LLC98%
76%
98%
92%
99.8%
94%
Ovostar Union NV
(the Netherlands)
Operating companies
Supporting companies
77%
Krushynsky Poultry
Complex OJSC
23% Skybyn Compound Feed
Plant LLC
The entity is in the process of
restructuring: assets and activities are
transferred to Yasensvit LLC
The Group’s legal structure
Lean legal structure with Ovostar Union NV being the ultimate holding company of the Group
LLC Ovostar Union is holding company whereas Yasensvit and Ovostar are the key operating companies
Ovostar Union: Roadshow Presentation 32
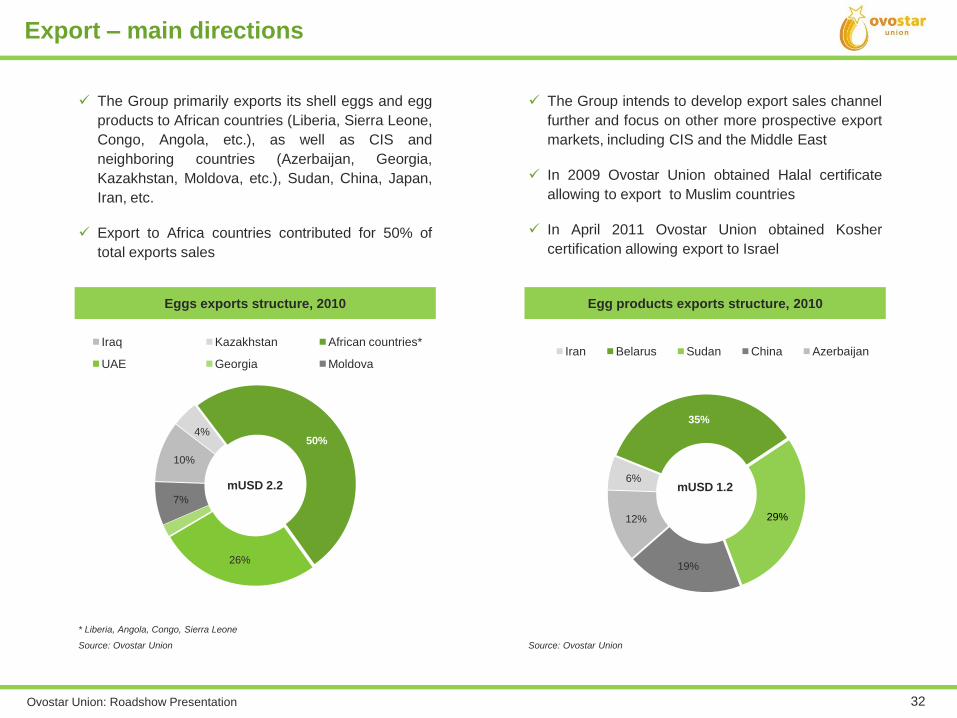
The Group primarily exports its shell eggs and egg
products to African countries (Liberia, Sierra Leone,
Congo, Angola, etc.), as well as CIS and
neighboring countries (Azerbaijan, Georgia,
Kazakhstan, Moldova, etc.), Sudan, China, Japan,
Iran, etc.
Export to Africa countries contributed for 50% of
total exports sales
Egg products exports structure, 2010
10%
4%50%
26%
7%
Iraq Kazakhstan African countries*
UAE Georgia Moldova
Source: Ovostar Union Source: Ovostar Union
6%
35%
29%
19%
12%
Iran Belarus Sudan China Azerbaijan
* Liberia, Angola, Congo, Sierra Leone
mUSD 2.2 mUSD 1.2
Eggs exports structure, 2010
Export – main directions
The Group intends to develop export sales channel
further and focus on other more prospective export
markets, including CIS and the Middle East
In 2009 Ovostar Union obtained Halal certificate
allowing to export to Muslim countries
In April 2011 Ovostar Union obtained Kosher
certification allowing export to Israel
Ovostar Union: Roadshow Presentation 33
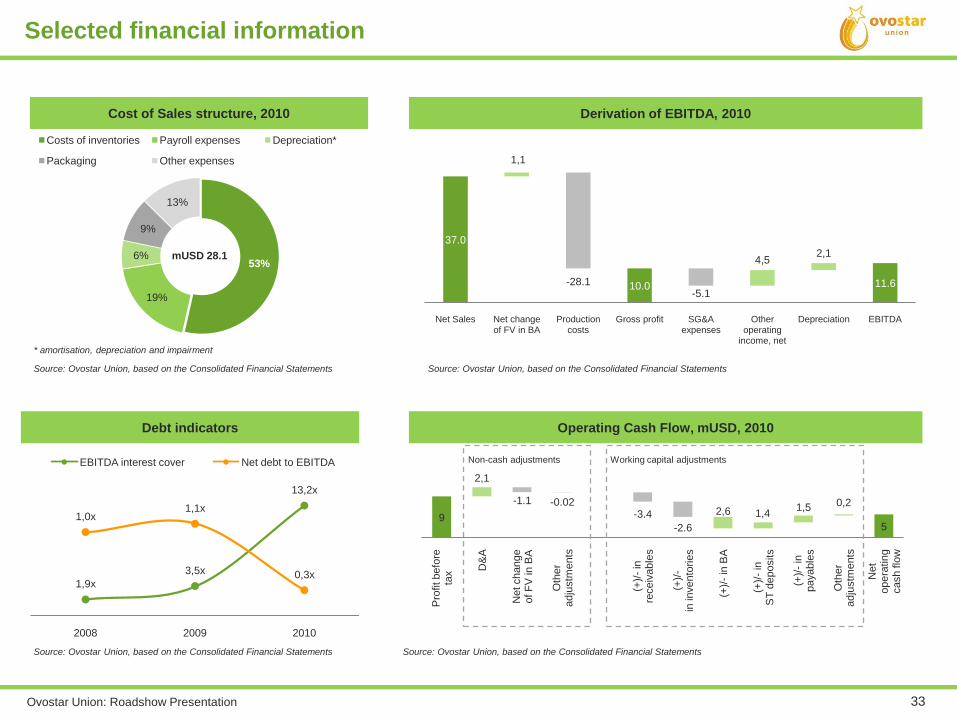
53%
19%
6%
9%
13%
Costs of inventories Payroll expenses Depreciation*
Packaging Other expenses
Operating Cash Flow, mUSD, 2010
Selected financial information
Debt indicators
1,9x
3,5x
13,2x
1,0x1,1x
0,3x
2008 2009 2010
EBITDA interest cover Net debt to EBITDA
Source: Ovostar Union, based on the Consolidated Financial Statements
95
2,1
-1.1 -0.02-3.4
-2.6
2,6 1,41,5 0,2
Pro
fit befo
reta
x
D&
A
Net change
of F
V in
BA
Oth
er
adju
stm
ents
(+)/
-in
re
ceiv
able
s
(+)/
-in
in
vento
rie
s
(+)/
-in
BA
(+)/
-in
ST
deposits
(+)/
-in
payable
s
Oth
er
adju
stm
ents
Net
opera
tin
gcash flo
w
Non-cash adjustments Working capital adjustments
Derivation of EBITDA, 2010
37.0
10.0 11.6
1,1
-28.1-5.1
4,52,1
Net Sales Net changeof FV in BA
Production costs
Gross profit SG&A expenses
Other operating
income, net
Depreciation EBITDA
Cost of Sales structure, 2010
Source: Ovostar Union, based on the Consolidated Financial Statements Source: Ovostar Union, based on the Consolidated Financial Statements
Source: Ovostar Union, based on the Consolidated Financial Statements
mUSD 28.1
* amortisation, depreciation and impairment
Ovostar Union: Roadshow Presentation 34
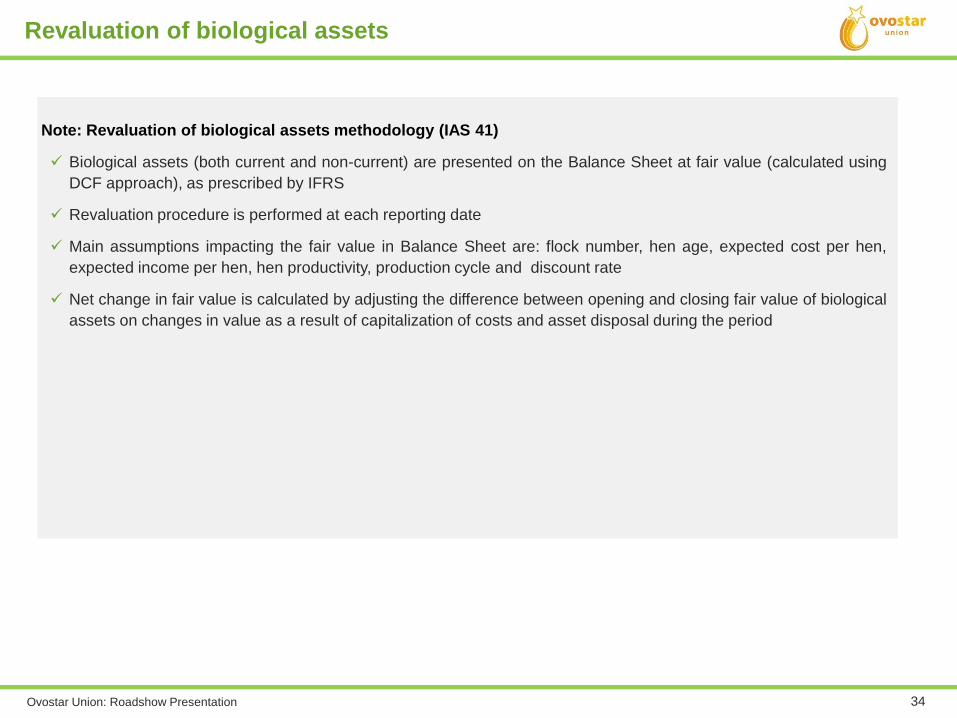
Note: Revaluation of biological assets methodology (IAS 41)
Biological assets (both current and non-current) are presented on the Balance Sheet at fair value (calculated using
DCF approach), as prescribed by IFRS
Revaluation procedure is performed at each reporting date
Main assumptions impacting the fair value in Balance Sheet are: flock number, hen age, expected cost per hen,
expected income per hen, hen productivity, production cycle and discount rate
Net change in fair value is calculated by adjusting the difference between opening and closing fair value of biological
assets on changes in value as a result of capitalization of costs and asset disposal during the period
Revaluation of biological assets
Ovostar Union: Roadshow Presentation 35
Borys Bielikov
CEO
Ovostar Union
Tel.: +380 44 354 29 60
Fax: +380 44 354 29 61
E-Mail: [email protected]
Vitalii Veresenko
Chairman of the Board
Ovostar Union
Tel.: +380 44 354 29 60
Fax: +380 44 354 29 61
E-Mail: [email protected]
Natalia Malyovana
Commercial Director
Ovostar Union
Tel.: +380 44 354 29 60
Fax: +380 44 354 29 61
E-Mail: [email protected]
Contact details
Ekaterina Pavlovskaya
IR manager
Ovostar Union
Tel.: +380 44 354 29 60
Fax: +380 44 354 29 61
E-Mail: [email protected]