Richard Perrin and Lilyan Fulginiti U. of...
14
Productivity vs Food Security and Sustainability Richard Perrin and Lilyan Fulginiti U. of Nebraska Comments prepared for the NAS workshop on Food Insecurity and the Sustainability of Global Food Systems February 16‐17, 2011
-
Upload
truongkien -
Category
Documents
-
view
216 -
download
0
Transcript of Richard Perrin and Lilyan Fulginiti U. of...
Productivity vs Food Security and Sustainability
Richard Perrin and Lilyan Fulginiti
U. of Nebraska
Comments prepared for the NAS workshop on Food Insecurity and the Sustainability of Global Food SystemsFebruary 16‐17, 2011

Productivity Measurement: What is it?
• Definition: Output/Input
• Single factor, i.e. output/acre, or
Multi‐factor, MFP, (output index)/(input index)
• Anthropocentric – it's what matters to us
[Thermodynamics assures us the true ratio is 1.000]

Productivity Measurement: What for?
1. Solow (1957) ‐measure progress, new returns to labor
2. Schultz (1956) ‐ explain where progress comes from
When explained, productivity growth is gone –
No longer a measure of progress
where does it go?
Thermodynamics, again ‐ there is no progress

Productivity Measurement: What we want
1. Gauge progress (Solow)–Human welfare from relatively fixed resources,
such as land, water, climate, ecosystem resilience
2. Explain progress (Griliches)‐
How it is achieved is important for policy
But don't use the result as a metric for progress

Agricultural Productivity vs Food Security in 2050
• Compare growth rates of MFP & demand
• Rate of demand growth
Source of growth Total Increase Avg Annual Rate
Population 32% 0.7%
Income 38% 0.8%
Total 70% 1.34%
• Can productivity growth rate match that?
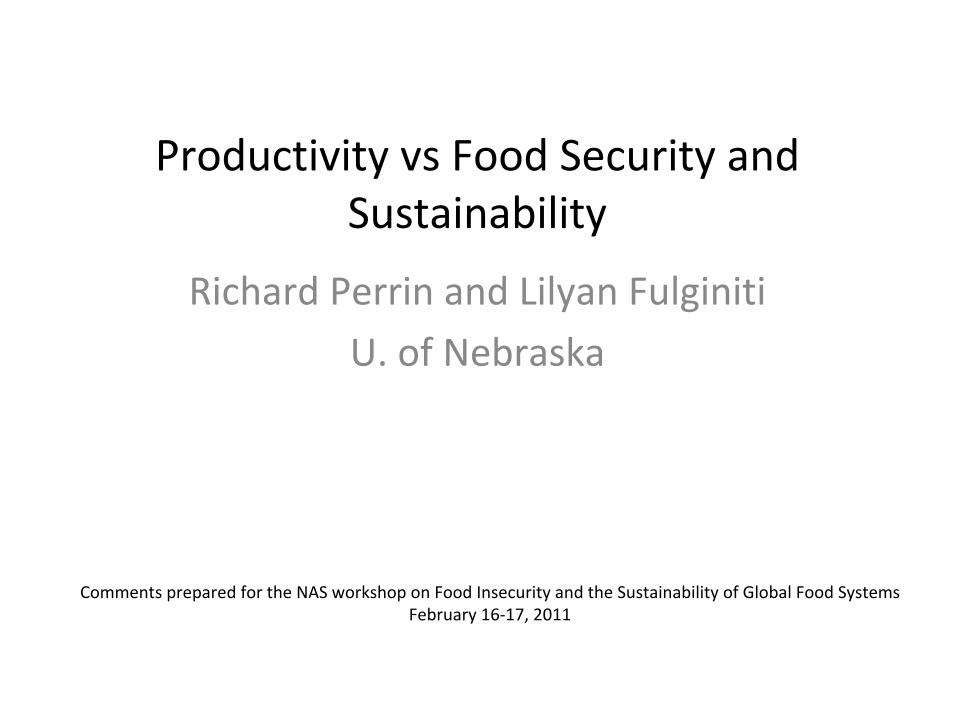
Crop Yields vs MFP ‐ world
Sources: Authors' calculations from USDA FAS data, Fuglie (2008)
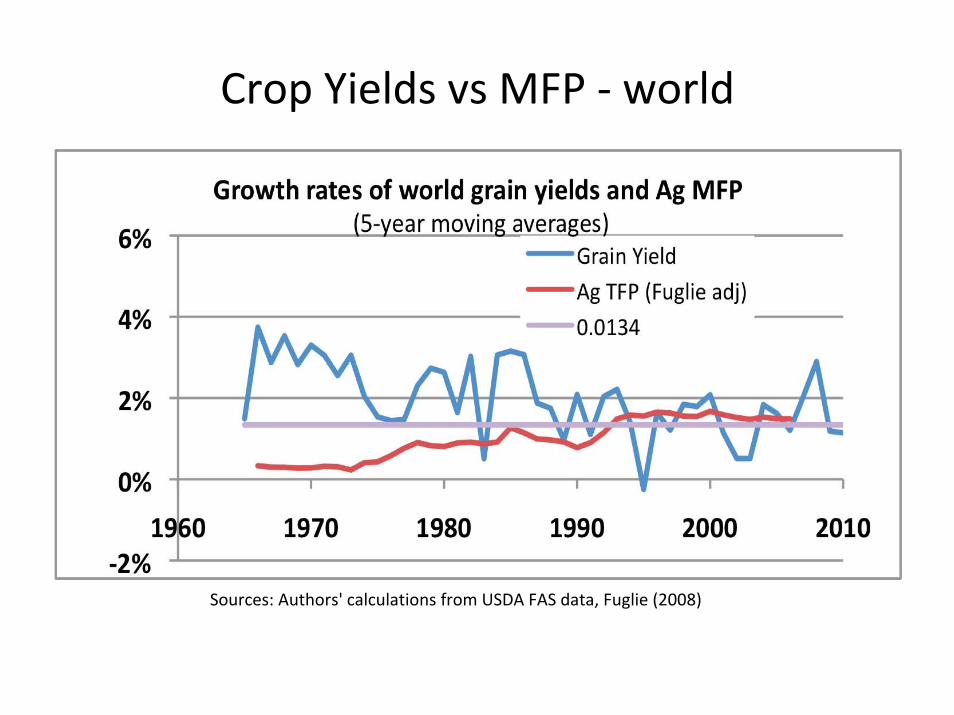
Decline in growth rate of world grain yields
Sources: Authors' calculations from USDA FAS data

Crop yields vs MFP ‐ US
Sources: Authors' calculations from USDA FAS data, USA ERS

Crop yields vs MFP ‐ China
Sources: Authors' calculations from USDA FAS data, Fuglie (2008)

Crop yields vs MFP – Sub Saharan Africa
Sources: Authors' calculations from USDA FAS data, Fulginiti (2004)
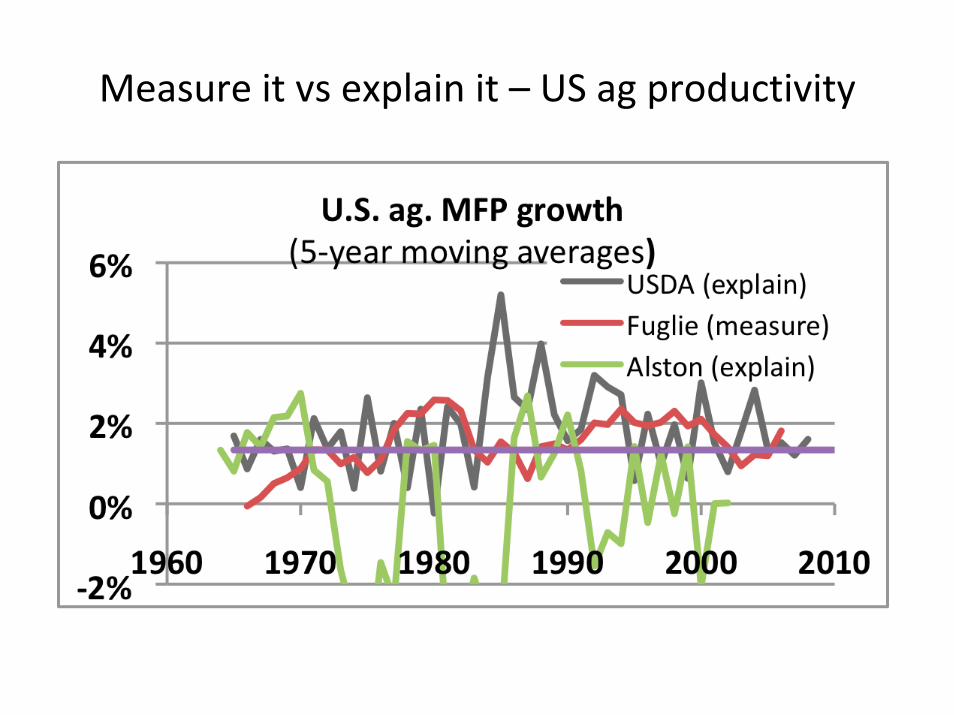
Measure it vs explain it – US ag productivity

So what do we learn from this?
• Productivity growth is perhaps declining– Yield growth rates certainly near the critical 1.34%
– Perhaps because of more unpriced outputs (health)
• Is there evidence that it could persist at 1.34%?– Monsanto: no problem
– Lobell, et al: yield ceilings are being approached
So what do we learn from this?
• There are unmeasured/unpriced inputs that have led to bias in measuring productivity:o Water
o Climate
o Ecological support

So what do we learn from this?
• What if the productivity rate falls below 1.34%?o Food prices will rise
o More inputs will be required, butThere's not much more land w/o consequences
There will likely be less water
Climate change may be a net negative
Ecological deterioration may be a net negative
• Research on missing inputs is needed