RESEARCHARTICLE Recapitulation ofAyurvedaconstitutiontypes ...
17
RESEARCH ARTICLE Recapitulation of Ayurveda constitution types by machine learning of phenotypic traits Pradeep Tiwari 1,2,3☯ , Rintu Kutum 2,3,4☯ , Tavpritesh Sethi 1☯¤ , Ankita Shrivastava 5 , Bhushan Girase 5 , Shilpi Aggarwal 1 , Rutuja Patil 5 , Dhiraj Agarwal 5 , Pramod Gautam 1 , Anurag Agrawal 1,3 , Debasis Dash 3,4 , Saurabh Ghosh 6 , Sanjay Juvekar 5 *, Mitali Mukerji 1,2,3 *, Bhavana Prasher 1,2,3 * 1 Genomics and Molecular Medicine, CSIR-Institute of Genomics and Integrative Biology, New Delhi, India, 2 CSIR’s Ayurgenomics Unit–TRISUTRA (Translational Research and Innovative Science ThRough Ayurgenomics) CSIR-Institute of Genomics and Integrative Biology, New Delhi, India, 3 Academy of Scientific and Innovative Research (AcSIR), CSIR-IGIB, Delhi, India, 4 G.N.Ramachandran Knowledge Centre for Genome Informatics, CSIR-Institute of Genomics and Integrative Biology, New Delhi, India, 5 Vadu Rural Health Program, KEM Hospital Research Centre, Pune, India, 6 Human Genetics Unit, Indian Statistical Institute, Kolkata, India ☯ These authors contributed equally to this work. ¤ Current address: Indraprastha Institute of Information Technology, New Delhi, India. * [email protected] (BP); [email protected] (MM); [email protected](SJ) Abstract In Ayurveda system of medicine individuals are classified into seven constitution types, “Prakriti”, for assessing disease susceptibility and drug responsiveness. Prakriti evaluation involves clinical examination including questions about physiological and behavioural traits. A need was felt to develop models for accurately predicting Prakriti classes that have been shown to exhibit molecular differences. The present study was carried out on data of pheno- typic attributes in 147 healthy individuals of three extreme Prakriti types, from a genetically homogeneous population of Western India. Unsupervised and supervised machine learning approaches were used to infer inherent structure of the data, and for feature selection and building classification models for Prakriti respectively. These models were validated in a North Indian population. Unsupervised clustering led to emergence of three natural clusters corresponding to three extreme Prakriti classes. The supervised modelling approaches could classify individuals, with distinct Prakriti types, in the training and validation sets. This study is the first to demonstrate that Prakriti types are distinct verifiable clusters within a mul- tidimensional space of multiple interrelated phenotypic traits. It also provides a computa- tional framework for predicting Prakriti classes from phenotypic attributes. This approach may be useful in precision medicine for stratification of endophenotypes in healthy and dis- eased populations. Introduction In the present era of phenomics, there has been an increase in emphasis on endo-phenotyping along with omics approaches for identification of groups that differ in susceptibility, prognosis and therapeutic requirements [1,2]. This has formed the basis for the development of predic- tive preventive, personalised and participatory (P4) medicine [3–5]. There is an unmet need PLOS ONE | https://doi.org/10.1371/journal.pone.0185380 October 5, 2017 1 / 17 a1111111111 a1111111111 a1111111111 a1111111111 a1111111111 OPEN ACCESS Citation: Tiwari P, Kutum R, Sethi T, Shrivastava A, Girase B, Aggarwal S, et al. (2017) Recapitulation of Ayurveda constitution types by machine learning of phenotypic traits. PLoS ONE 12(10): e0185380. https://doi.org/10.1371/journal.pone.0185380 Editor: Gyaneshwer Chaubey, Estonian Biocentre, ESTONIA Received: April 11, 2017 Accepted: September 10, 2017 Published: October 5, 2017 Copyright: © 2017 Tiwari et al. This is an open access article distributed under the terms of the Creative Commons Attribution License, which permits unrestricted use, distribution, and reproduction in any medium, provided the original author and source are credited. Data Availability Statement: Minimal dataset needed for qualified researchers to replicate our findings would be available for sharing upon request in order to protect the study participants’ privacy. The data requests may be sent to Bhavana. [email protected], [email protected], or [email protected]. in. Funding: Funding from CSIR (MLP901) and DBT- BINC fellowship to PT are acknowledged. The funders had no role in study design, data collection and analysis, decision to publish, or preparation of the manuscript.
Transcript of RESEARCHARTICLE Recapitulation ofAyurvedaconstitutiontypes ...

RESEARCH ARTICLE
Recapitulation of Ayurveda constitution typesbymachine learning of phenotypic traits
Pradeep Tiwari1,2,3☯, Rintu Kutum2,3,4☯, Tavpritesh Sethi1☯¤, Ankita Shrivastava5,
Bhushan Girase5, Shilpi Aggarwal1, Rutuja Patil5, Dhiraj Agarwal5, Pramod Gautam1,
Anurag Agrawal1,3, Debasis Dash3,4, Saurabh Ghosh6, Sanjay Juvekar5*,Mitali Mukerji1,2,3*, Bhavana Prasher1,2,3*
1 Genomics and Molecular Medicine, CSIR-Institute of Genomics and Integrative Biology, New Delhi, India,
2 CSIR’s Ayurgenomics Unit–TRISUTRA (Translational Research and Innovative Science ThRoughAyurgenomics) CSIR-Institute of Genomics and Integrative Biology, New Delhi, India, 3 Academy ofScientific and Innovative Research (AcSIR), CSIR-IGIB, Delhi, India, 4 G.N.Ramachandran Knowledge
Centre for Genome Informatics, CSIR-Institute of Genomics and Integrative Biology, New Delhi, India,5 Vadu Rural Health Program, KEMHospital Research Centre, Pune, India, 6 Human Genetics Unit, Indian
Statistical Institute, Kolkata, India
☯ These authors contributed equally to this work.
¤ Current address: Indraprastha Institute of Information Technology, New Delhi, India.* [email protected] (BP); [email protected] (MM); [email protected](SJ)
Abstract
In Ayurveda system of medicine individuals are classified into seven constitution types,
“Prakriti”, for assessing disease susceptibility and drug responsiveness. Prakriti evaluation
involves clinical examination including questions about physiological and behavioural traits.
A need was felt to develop models for accurately predicting Prakriti classes that have been
shown to exhibit molecular differences. The present study was carried out on data of pheno-
typic attributes in 147 healthy individuals of three extreme Prakriti types, from a genetically
homogeneous population of Western India. Unsupervised and supervised machine learning
approaches were used to infer inherent structure of the data, and for feature selection and
building classification models for Prakriti respectively. These models were validated in a
North Indian population. Unsupervised clustering led to emergence of three natural clusters
corresponding to three extreme Prakriti classes. The supervised modelling approaches
could classify individuals, with distinct Prakriti types, in the training and validation sets. This
study is the first to demonstrate that Prakriti types are distinct verifiable clusters within a mul-
tidimensional space of multiple interrelated phenotypic traits. It also provides a computa-
tional framework for predicting Prakriti classes from phenotypic attributes. This approach
may be useful in precision medicine for stratification of endophenotypes in healthy and dis-
eased populations.
Introduction
In the present era of phenomics, there has been an increase in emphasis on endo-phenotyping
along with omics approaches for identification of groups that differ in susceptibility, prognosis
and therapeutic requirements [1,2]. This has formed the basis for the development of predic-
tive preventive, personalised and participatory (P4) medicine [3–5]. There is an unmet need
PLOSONE | https://doi.org/10.1371/journal.pone.0185380 October 5, 2017 1 / 17
a1111111111a1111111111a1111111111a1111111111a1111111111
OPENACCESS
Citation: Tiwari P, Kutum R, Sethi T, Shrivastava A,
Girase B, Aggarwal S, et al. (2017) Recapitulation
of Ayurveda constitution types by machine learning
of phenotypic traits. PLoS ONE 12(10): e0185380.
https://doi.org/10.1371/journal.pone.0185380
Editor: Gyaneshwer Chaubey, Estonian Biocentre,
ESTONIA
Received: April 11, 2017
Accepted: September 10, 2017
Published: October 5, 2017
Copyright: © 2017 Tiwari et al. This is an open
access article distributed under the terms of the
Creative Commons Attribution License, which
permits unrestricted use, distribution, and
reproduction in any medium, provided the original
author and source are credited.
Data Availability Statement:Minimal dataset
needed for qualified researchers to replicate our
findings would be available for sharing upon
request in order to protect the study participants’
privacy. The data requests may be sent to Bhavana.
[email protected], [email protected], or [email protected].
in.
Funding: Funding from CSIR (MLP901) and DBT-
BINC fellowship to PT are acknowledged. The
funders had no role in study design, data collection
and analysis, decision to publish, or preparation of
the manuscript.
for the development of adequate phenotyping methods for stratification of healthy individuals
at a systemic level. Although methods/questionnaires are available for classification of in-
dividuals in terms of specific anatomical and physiological attributes such as somatotypes,
phototypes, chronotypes and metabotypes [6–8]. These have been to some extent useful in pre-
dicting the health and disease tendencies with respect to specific systems.
Phenotypic stratification of healthy individuals forms the primary basis for predictive and
personalised medicine in Ayurveda, a 5000 year old Indian system of medicine [9,10]. Accord-
ing to this system, individuals are classified into seven broad constitution types “Prakriti” that
is determined at the time of birth and remains invariant throughout life. Amongst the seven
types, three groups Vata (V), Pitta (P) and Kapha (K) are at the end of the phenotypic spec-
trum and are described to have contrasting disease susceptibilities [11]. V, P and K are herein
referred to as extreme (distinct) Prakriti while other four Prakriti types VP, PK, VK and VPK
are referred here as non-extreme Prakriti. An earlier study has revealed molecular differences
between the extreme Prakriti types [12]. Assuming that the Prakriti types correspond to objec-
tively identifiable sub-phenotypes, they should form clusters within a multidimensional space
where the axes conform to the phenotypic traits used for clinical stratification. This would be
most obvious for extreme Prakritis and should conceptually be extendable to non- extreme
Prakritis. To optimally extract useful knowledge contained within Ayurveda, it is important to
develop a modern framework in which such assumptions are tested, followed by development
of methods that would enable standardized implementations that are rapid, accurate and scal-
able[12–14].
Prakriti assessment involves examination of more than 150 features with anatomical and
physical activity related attributes that can be directly examined and physiological and psycho-
logical parameters inferred based on the responses of the individual and past history[13]. Dur-
ing the examination, care is taken to avoid misinterpretation of the clinical features that might
arise due to recent or occasional change of internal or external environment. The process of
inferring Prakriti from these large number of features is a non-trivial task. Cumulative assign-
ment to a Prakriti group involves consideration of individual features as V, P or K. However,
in majority of instances this involves assignment based on the combinatorial occurrence of fea-
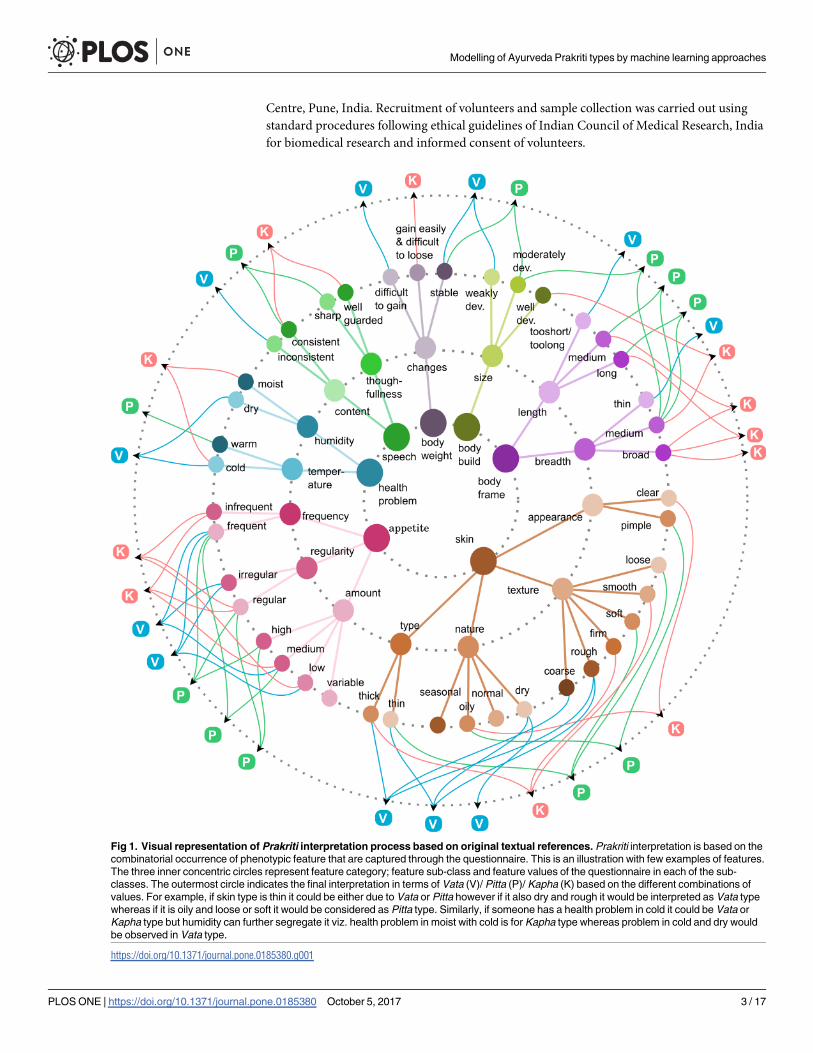
tures (Fig 1). Although this is a system standardized with guidelines from well documented
Ayurveda texts, which also takes the interactions into account, the decision rules have not yet
been formalized as mathematical models. One of the major challenges in building these mod-
els is the small ‘n’ and large ‘p’ problem where ‘n’ refers to number of samples and ‘p’ refers to
no of parameters. This type of data matrix results in multicollinearity that arises when many
features are correlated amongst each other [15,16]. In order to address this problem, we have
used advanced modelling approaches of LASSO [17], elastic net [18] and random forests [19].
We have also used unsupervised approach in a purely data driven fashion [20–22]. Unsuper-
vised clustering provided three natural clusters that corroborate with the clinicians’ classifica-
tion of V, P and K. Supervised modelling allowed us to identify core set of variables that were
concordant between all the three methods and could accurately predict extreme Prakriti with
high specificity and sensitivity. This is the first study of its kind that not only highlights the spe-
cific attributes that help in distinguishing constitution types amongst healthy individuals in an
unbiased approach but also recapitulates the connectivity between seemingly unrelated sys-
tems that are described in Ayurveda.
Methods
The study was carried out as per protocols approved by the institutional ethics committee at
CSIR-Institute of Genomics and Integrative Biology, Delhi and KEMHospital Research
Modelling of Ayurveda Prakriti types by machine learning approaches
PLOSONE | https://doi.org/10.1371/journal.pone.0185380 October 5, 2017 2 / 17
Competing interests: The authors have declared
that no competing interests exist.
Centre, Pune, India. Recruitment of volunteers and sample collection was carried out using
standard procedures following ethical guidelines of Indian Council of Medical Research, India
for biomedical research and informed consent of volunteers.
Fig 1. Visual representation of Prakriti interpretation process based on original textual references. Prakriti interpretation is based on thecombinatorial occurrence of phenotypic feature that are captured through the questionnaire. This is an illustration with few examples of features.The three inner concentric circles represent feature category; feature sub-class and feature values of the questionnaire in each of the sub-classes. The outermost circle indicates the final interpretation in terms of Vata (V)/ Pitta (P)/ Kapha (K) based on the different combinations ofvalues. For example, if skin type is thin it could be either due to Vata or Pitta however if it also dry and rough it would be interpreted as Vata typewhereas if it is oily and loose or soft it would be considered as Pitta type. Similarly, if someone has a health problem in cold it could be Vata orKapha type but humidity can further segregate it viz. health problem in moist with cold is for Kapha type whereas problem in cold and dry wouldbe observed in Vata type.
https://doi.org/10.1371/journal.pone.0185380.g001
Modelling of Ayurveda Prakriti types by machine learning approaches
PLOSONE | https://doi.org/10.1371/journal.pone.0185380 October 5, 2017 3 / 17
Recruitment of subjects and clinical assessment of Prakriti
The study was carried out in a genetically homogeneous rural cohort developed under Vadu
Rural Health Program (VRHP) for Health and Demographic Surveillance System (HDSS)
near Pune in the western part of India. This cohort is henceforth referred to as Vadu cohort.
10,100 individuals of equal number of healthy males and females between the age groups of
18–40 years residing in 22 villages of VRHP area were pre-screened by field research assistants
for identification of prospective subjects of extreme Prakriti. Detailed Prakriti evaluation was
carried out in 528 individuals by Ayurveda physicians using the questionnaire that had been
developed in the earlier study in the North Indian population [12]. In order to have homoge-
neity in administering the questionnaire an extensive training was provided to all the Ayur-
veda clinicians. In addition, a manual was developed to enable clinical decision-making. Based
on the physicians’ judgment and the responses of the subjects the individuals were classified
into one of the seven sub-types; Vata (V), Pitta (P), Kapha (K), VP, VK, PK and VPK. Assign-
ment to Prakriti groups was done by two groups of Ayurveda physicians, one at the field site
where the clinician who carried out the Prakriti examination at site and the second group of
physicians at CSIR-IGIB including Ayurveda co-investigator who assigned Prakriti based on
the data collected at the field site. A subset of study subjects were examined by both groups of
physicians for cross validation of observation and questionnaire data. There was a cross valida-
tion exercise of nearly 20% of the subjects by different Ayurveda clinicians.
Preprocessing of data
Collected questionnaire data is stored in a database. Data were pre-processed, variables with
more than 5%missing values were removed while others were imputed with the mode of the
data. Non-varying factor variables were then excluded from further analysis. 133 features/
questions were included for the final study.
We followed both unsupervised and supervised machine learning approaches using pheno-
type data from two cohorts from different geographical locations. A flowchart describing the
steps followed have been provided as supplementary figure (S1 Fig)
Genetic homogeneity of the population
Genotype data was generated on 237 samples of different Prakriti types from the Vadu cohort,
on Affymetrix GenomeWide Human SNP array 6.0 (Affymetrix, Santaclara, CA, USA). The
genetic relatedness and homogeneity of the VADU cohort with Indian population was estab-
lished by analysis of the VADU genotype data with shared SNPS in the Indian Genome Varia-
tion Consortium panel. The IGVC database houses genotype data of representative samples
from genetically and ethnically diverse populations of the country [23]. A set of 17,675 SNPs
that were shared with 509 Indian Genome Variation Consortium (IGVC) samples generated
from Affymetrix 50k Xba1 240 Gene chip Human mapping array were used for the PCA analy-
sis. All the SNPs used for the analysis followed Hardy-Weinberg equilibrium and qualified all
the standard quality criteria such as more than 90% genotyping call in more than 90% of sam-
ples. We ensured that all the genotype data were from the same strand prior to merging the
data. Principal Component analysis (PCA) of the genotype data was performed using EIGEN-
SOFT 5.0 [24,25]
Unsupervised clustering of individuals
Clustering analysis based upon questionnaire features was applied to discover the inherent
structure and to stratify individual subjects. A random forests model consisting of 1 million
Modelling of Ayurveda Prakriti types by machine learning approaches
PLOSONE | https://doi.org/10.1371/journal.pone.0185380 October 5, 2017 4 / 17
decision trees was constructed in unsupervised mode to derive similarity (1-dissimilarity)
matrix. This matrix further was used for objectively evaluating optimum cluster number
through partition around medoids (PAM) [26,27] with cluster numbers varying from 2 to 20.
We used silhouette width as a criterion to identify optimum cluster numbers [28]. A visual
inspection of the clusters was done using Multi-Dimensional Scaling plot. Thereafter robust-
ness of clustering was assessed through a permutation of original features. One hundred times
permuted datasets were generated and for each permutation, similarity matrix was created
with one million decision trees using random forests algorithm. Silhouette widths derived
from permuted datasets were plotted vis-a-vis original data through a visualization approach,
we called as Savannah plot. Permutation analysis also helped us to test if there exists any cou-
pling between the features of the questionnaire data with respect to Prakriti groups. A similar
analysis was carried out on all samples to test whether non-extreme samples were indeed a
mixture of the constituent Prakriti types. Whole analysis was implemented in R statistical pro-
gramming language [29] using randomForest [30] and cluster package [31].
Supervised modeling of the questionnaire
Three methods were used for the modelling of the questionnaire. A brief description highlight-
ing the need for adopting these advanced methods is provided below.
LASSOmodel. The regression framework of the LASSO model was used for extreme
Prakriti modelling as it addresses the problems of multicollinearity arising out of large number
of explanatory variables. It includes a penalty function in the model that shrinks the regression
coefficients of insignificant or unnecessary explanatory variables to zero [17,32]. The model is
given by,
Y ¼ Xbþ l jbjj þ ε
Where Y is the vector of responses, X is the design matrix comprising of the explanatory
variables, β = (β1, β2 . . . βj) is the vector of regression coefficients, λ is a tuning parameter that
controls model accuracy and ε is the random error component. In our study, vector Y is the
Prakriti label V/P/K assigned to the subjects X is the matrix containing feature values collected
through the questionnaire.
Elastic net model. When the data have highly correlated predictors LASSO tends to select
only one variable and removes the correlated variable/s. Since there might be some interaction
involved in the variables, grouped selection might be needed for future reference which is
done in elastic net. In our study, we anticipate that non-redundant variables alone might not
differentiate extreme from non-extreme Prakriti individuals and retaining correlated variables
might be of significant importance. Hence, we have also used elastic net method. Elastic net
regression is related to LASSO in the sense that it also uses penalty parameter to circumvent
the problem of multicollinearity and belongs to penalized regression family. It is given by,
Y ¼ Xβþ λ½ð1� αÞþ k β k22=2þ α k βk
1�
Elastic net method is governed by two parameters α and λ. Lambda (λ) is same as in
LASSO regression while alpha (α) should strictly be between 0 and 1 for elastic net [18].
Random forests model. Random forests (RF) is an ensemble decision tree based algo-
rithm, where each decision tree is built independently from different bagging samples and ran-
domly selecting a subset of features (square root of total number of variables for classification
task). Two parameters namely ntree (number of decision trees) and mtry (a subset of features
to be chosen randomly) were optimized before building the final training model [19]. Variable
selection was performed using Boruta package in R [33]
Modelling of Ayurveda Prakriti types by machine learning approaches
PLOSONE | https://doi.org/10.1371/journal.pone.0185380 October 5, 2017 5 / 17
Modelling strategy. Extreme Prakritimodelling.Data partition was fixed for all down-
streammodeling strategies. From the extreme set of individuals (total = 147; V = 66, P = 35, K =
46), a random sample of 90% data was drawn to create a training set. The remaining 10% data was
used for testing the models [Fig 2]. Out of 147 extreme Prakriti samples 81 samples were females
(23 Kapha, 14 Pitta, 44Vata) and 66 samples (23 Kapha, 21 Pitta and 22Vata) were males.
A battery of LASSO, elastic net and random forests was then applied for supervised classifi-
cation modeling.
Features for LASSO and elastic net models were selected by the optimization of penalty
parameters [λ], [λ, α] respectively through 10 fold cross-validation. In the case of elastic net a
two dimensional cross validation was performed for the tuning of parameters since it involves
two parameters. A grid of values (0 to 1, separated by 0.1) was picked for α. Then for each
alpha a cross validation was performed to select other parameter λ. Minimum λ was chosenbased on the model error. So for each “α” a λ value and corresponding model accuracy was
obtained. Finally, optimum α was chosen based on the minimummodel error.
For random forests, feature selection was done using the Boruta algorithm [33] followed by
optimization of number of trees and number of variables (ntree and mtry respectively).
Twenty models each with ntree ranging from 500 to 10000 (step-size = 500 trees) were built
and least median Out of Box (OOB) in conjunction with least standard deviation criterion
were used to finalize the optimal ntree as 4000. A similar strategy was followed to derive the
optimal mtry as 5. All tuning and optimization were implemented in R statistical language
using glmnet [34] package for LASSO and elastic net and randomForest package [30] for RF.
Validation of models on an external dataset from a different population
The models were validated in a dataset of an earlier study from the North Indian population.
Since 106 features were common between both the datasets after pre-processing we rebuilt the
model using the same methods on the VADU data. A similar strategy of 90% data for training
and 10% VADU data was used as test set. The model so built on VADU cohort was then tested
on the complete data of 96 subjects (48 subjects each from males and females with nearly equal
representation of Kapha, Pitta and Vata) from the North Indian cohort (Fig 2).
Model for segregation of Extreme vs Non-Extreme Prakriti
In order to segregate extreme from non-extreme samples in a heterogeneous population, we
built a model with a hybrid approach. In this approach, the extreme Prakriti model was run on
a mix of 147 extreme and 106 non-extreme samples and maxima of membership-probability
were recorded. We expected that score for each Prakriti generated based on the above model
would assign a high probability to the extreme samples in one class whereas the non-extreme
would not show such skewness towards one group. These scores were then used to construct
the extreme versus non-extreme models through binary logistic regression. Subsequently, ten-
fold cross validation was performed to test the robustness of these models (Fig 2). Predictive
performance of these models was then assessed on the left out set by calculating sensitivity,
specificity from a confusion matrix [35] and the AUC of the ROC curve [36,37]
Results
Genotyping analysis confirmed the genetic homogeneity of the studypopulation
Vadu cohort belongs to an Indo-European background fromWestern India. The genetic
homogeneity of the cohort was confirmed using a panel of markers from Indian Genome
Modelling of Ayurveda Prakriti types by machine learning approaches
PLOSONE | https://doi.org/10.1371/journal.pone.0185380 October 5, 2017 6 / 17
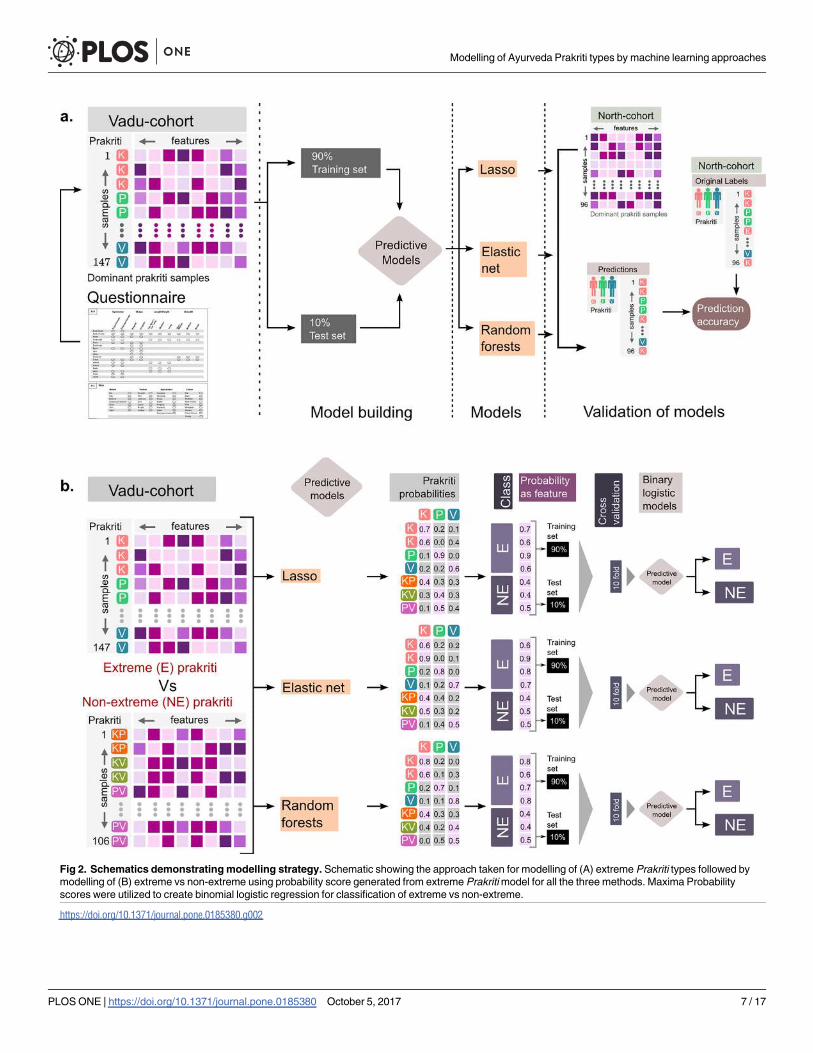
Fig 2. Schematics demonstratingmodelling strategy. Schematic showing the approach taken for modelling of (A) extreme Prakriti types followed bymodelling of (B) extreme vs non-extreme using probability score generated from extreme Prakritimodel for all the three methods. Maxima Probabilityscores were utilized to create binomial logistic regression for classification of extreme vs non-extreme.
https://doi.org/10.1371/journal.pone.0185380.g002
Modelling of Ayurveda Prakriti types by machine learning approaches
PLOSONE | https://doi.org/10.1371/journal.pone.0185380 October 5, 2017 7 / 17

Variation database (IGVdb) wherein the study population was found to be clustered with west-
ern populations from the IGVdb study. In general Vadu population is genetically homoge-
nous, however few of the members appear as outliers in PCA plot (S2 Fig).
Identification of extreme Prakriti
Since the questionnaire has three aspects including visual and tactile examination and subject’s
response, there could be inter-individual variability in administering the questionnaire as well
as interpretation of the response. Assignment to Prakriti groups was done by two groups of
Ayurveda physicians, one at the field site by the clinician who carried out the Prakriti examina-
tion and the second group who assigned Prakriti based on the data collected at field site. A
total of 147 extreme Prakriti individuals were identified which consisted of three types namely
Kapha (n = 46), Pitta (n = 35) and Vata (n = 66). Apart from extreme Prakriti type, 106 sam-
ples were also classified as non-extreme type VP, PK and VK.
Emergence of three distinct robust clusters through unsupervisedlearning of questionnaire data from extreme Prakriti
Unsupervised random forests based clustering revealed three clusters using purely a data-
driven approach (Fig 3). These are evident in the Savannah plot in Fig 4. The line with the
highest silhouette criteria represents the optimum number of clusters. Cluster memberships
had 93.9% agreement with Prakriti labels thus proving the validity of Prakriti measurement
through the questionnaire. Permutation analysis with the random shuffling of the feature val-
ues in the questionnaire data could not resolve into three clusters. The silhouette width for
Fig 3. MDS Visualization for unsupervised clusters and original Prakriti labels from extreme Prakriti
questionnaire data (male, female combined). Each shape refers to one individual. Unsupervised clusteringof questionnaire data for extreme Prakriti individual gives rise to three clusters. These clusters correspond tooriginal Prakritimembership as shown in the figure in the right panel.
https://doi.org/10.1371/journal.pone.0185380.g003
Modelling of Ayurveda Prakriti types by machine learning approaches
PLOSONE | https://doi.org/10.1371/journal.pone.0185380 October 5, 2017 8 / 17
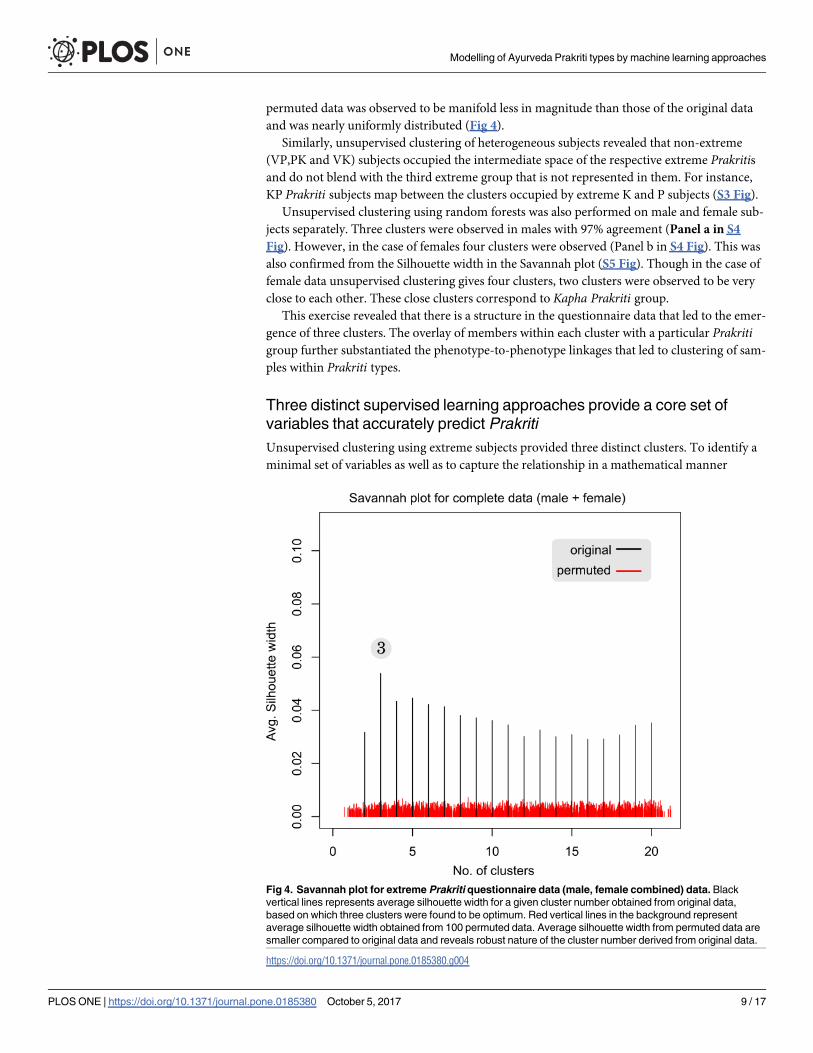
permuted data was observed to be manifold less in magnitude than those of the original data
and was nearly uniformly distributed (Fig 4).
Similarly, unsupervised clustering of heterogeneous subjects revealed that non-extreme
(VP,PK and VK) subjects occupied the intermediate space of the respective extreme Prakritis
and do not blend with the third extreme group that is not represented in them. For instance,
KP Prakriti subjects map between the clusters occupied by extreme K and P subjects (S3 Fig).
Unsupervised clustering using random forests was also performed on male and female sub-
jects separately. Three clusters were observed in males with 97% agreement (Panel a in S4
Fig). However, in the case of females four clusters were observed (Panel b in S4 Fig). This was
also confirmed from the Silhouette width in the Savannah plot (S5 Fig). Though in the case of
female data unsupervised clustering gives four clusters, two clusters were observed to be very
close to each other. These close clusters correspond to Kapha Prakriti group.
This exercise revealed that there is a structure in the questionnaire data that led to the emer-
gence of three clusters. The overlay of members within each cluster with a particular Prakriti
group further substantiated the phenotype-to-phenotype linkages that led to clustering of sam-
ples within Prakriti types.
Three distinct supervised learning approaches provide a core set ofvariables that accurately predict Prakriti
Unsupervised clustering using extreme subjects provided three distinct clusters. To identify a
minimal set of variables as well as to capture the relationship in a mathematical manner
Fig 4. Savannah plot for extreme Prakriti questionnaire data (male, female combined) data. Blackvertical lines represents average silhouette width for a given cluster number obtained from original data,based on which three clusters were found to be optimum. Red vertical lines in the background representaverage silhouette width obtained from 100 permuted data. Average silhouette width from permuted data aresmaller compared to original data and reveals robust nature of the cluster number derived from original data.
https://doi.org/10.1371/journal.pone.0185380.g004
Modelling of Ayurveda Prakriti types by machine learning approaches
PLOSONE | https://doi.org/10.1371/journal.pone.0185380 October 5, 2017 9 / 17
between Prakriti types and feature attributes, we carried out supervised modelling using
LASSO, elastic net and random forests algorithms.
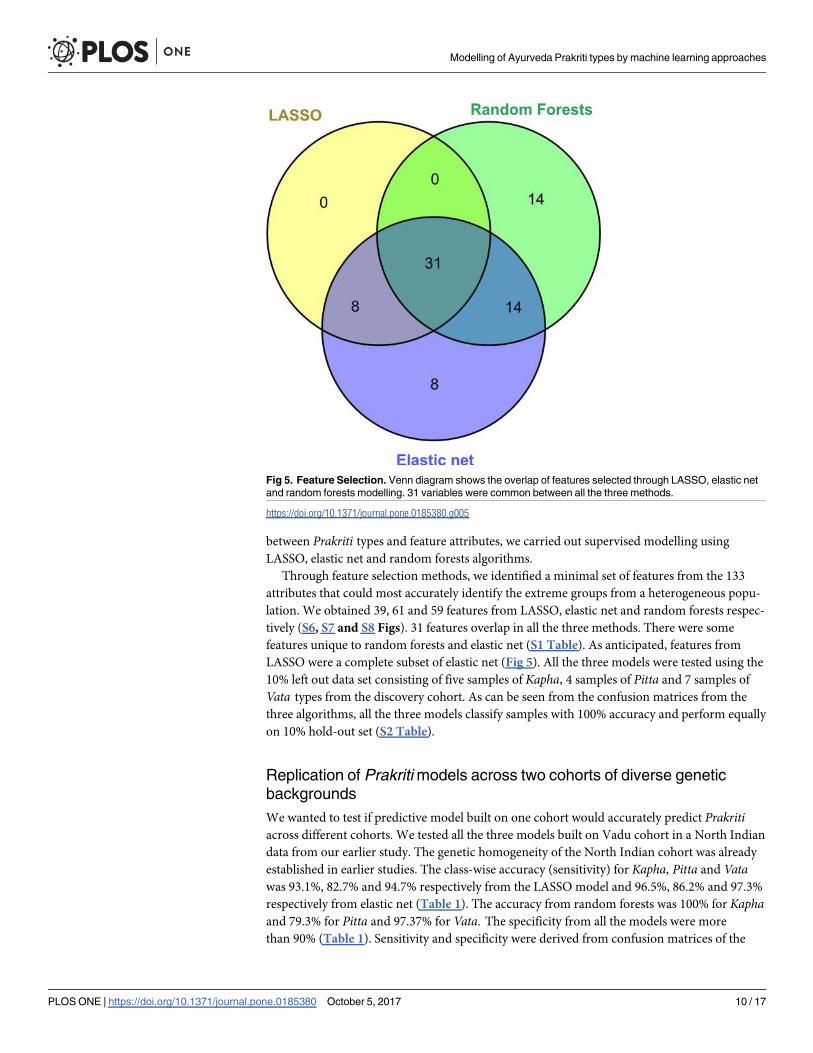
Through feature selection methods, we identified a minimal set of features from the 133
attributes that could most accurately identify the extreme groups from a heterogeneous popu-
lation. We obtained 39, 61 and 59 features from LASSO, elastic net and random forests respec-
tively (S6, S7 and S8 Figs). 31 features overlap in all the three methods. There were some
features unique to random forests and elastic net (S1 Table). As anticipated, features from
LASSO were a complete subset of elastic net (Fig 5). All the three models were tested using the
10% left out data set consisting of five samples of Kapha, 4 samples of Pitta and 7 samples of
Vata types from the discovery cohort. As can be seen from the confusion matrices from the
three algorithms, all the three models classify samples with 100% accuracy and perform equally
on 10% hold-out set (S2 Table).
Replication of Prakritimodels across two cohorts of diverse geneticbackgrounds
We wanted to test if predictive model built on one cohort would accurately predict Prakriti
across different cohorts. We tested all the three models built on Vadu cohort in a North Indian
data from our earlier study. The genetic homogeneity of the North Indian cohort was already
established in earlier studies. The class-wise accuracy (sensitivity) for Kapha, Pitta and Vata
was 93.1%, 82.7% and 94.7% respectively from the LASSO model and 96.5%, 86.2% and 97.3%
respectively from elastic net (Table 1). The accuracy from random forests was 100% for Kapha
and 79.3% for Pitta and 97.37% for Vata. The specificity from all the models were more
than 90% (Table 1). Sensitivity and specificity were derived from confusion matrices of the
Fig 5. Feature Selection. Venn diagram shows the overlap of features selected through LASSO, elastic netand random forests modelling. 31 variables were common between all the three methods.
https://doi.org/10.1371/journal.pone.0185380.g005
Modelling of Ayurveda Prakriti types by machine learning approaches
PLOSONE | https://doi.org/10.1371/journal.pone.0185380 October 5, 2017 10 / 17
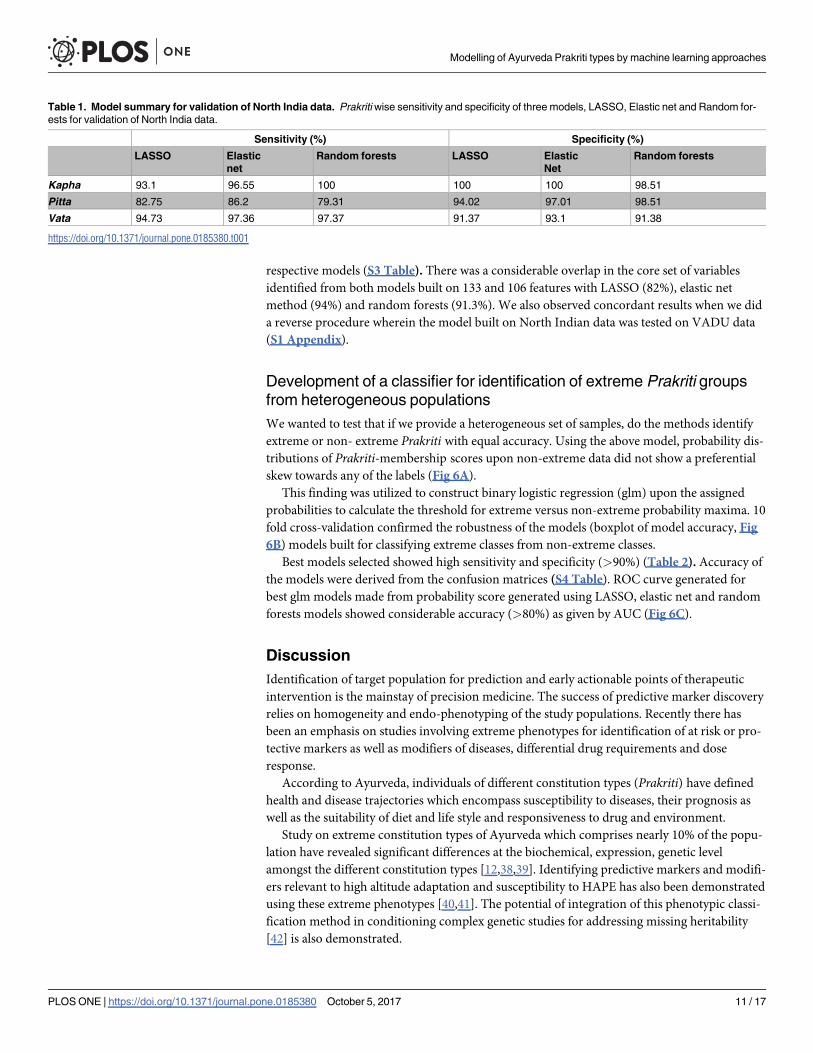
respective models (S3 Table). There was a considerable overlap in the core set of variables
identified from both models built on 133 and 106 features with LASSO (82%), elastic net
method (94%) and random forests (91.3%). We also observed concordant results when we did
a reverse procedure wherein the model built on North Indian data was tested on VADU data
(S1 Appendix).
Development of a classifier for identification of extreme Prakriti groupsfrom heterogeneous populations
We wanted to test that if we provide a heterogeneous set of samples, do the methods identify
extreme or non- extreme Prakriti with equal accuracy. Using the above model, probability dis-
tributions of Prakriti-membership scores upon non-extreme data did not show a preferential
skew towards any of the labels (Fig 6A).
This finding was utilized to construct binary logistic regression (glm) upon the assigned
probabilities to calculate the threshold for extreme versus non-extreme probability maxima. 10
fold cross-validation confirmed the robustness of the models (boxplot of model accuracy, Fig
6B) models built for classifying extreme classes from non-extreme classes.
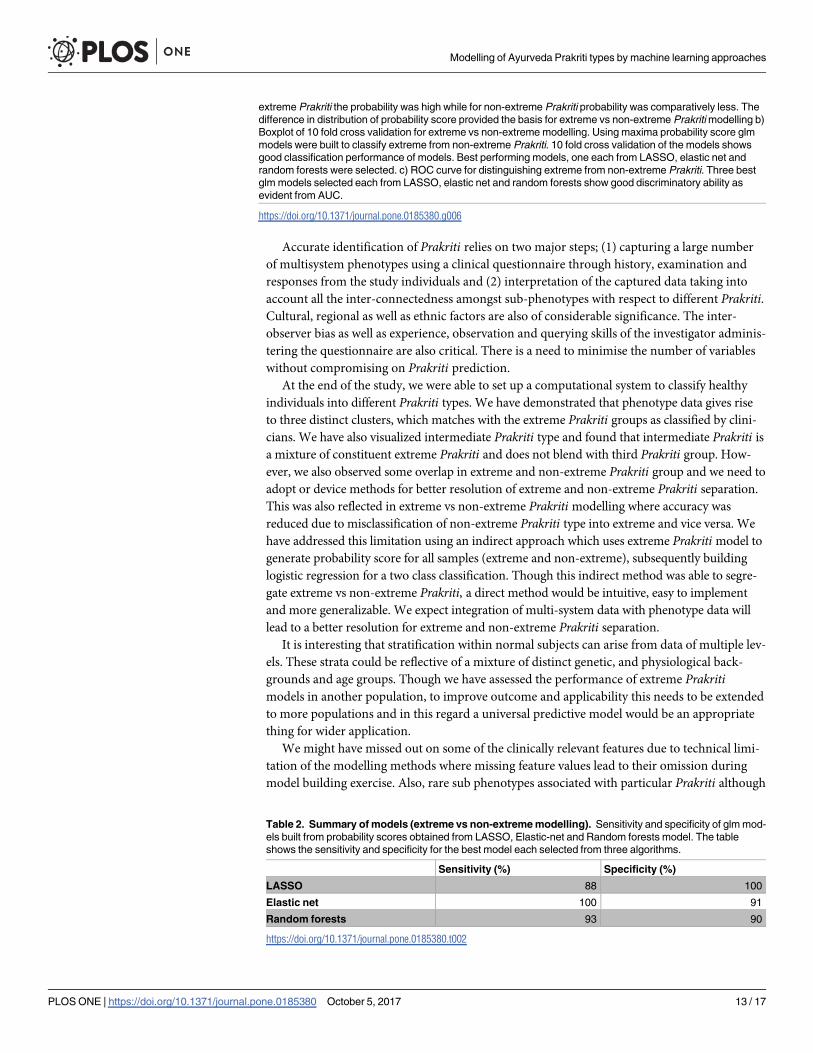
Best models selected showed high sensitivity and specificity (>90%) (Table 2). Accuracy of
the models were derived from the confusion matrices (S4 Table). ROC curve generated for
best glm models made from probability score generated using LASSO, elastic net and random
forests models showed considerable accuracy (>80%) as given by AUC (Fig 6C).
Discussion
Identification of target population for prediction and early actionable points of therapeutic
intervention is the mainstay of precision medicine. The success of predictive marker discovery
relies on homogeneity and endo-phenotyping of the study populations. Recently there has
been an emphasis on studies involving extreme phenotypes for identification of at risk or pro-
tective markers as well as modifiers of diseases, differential drug requirements and dose
response.
According to Ayurveda, individuals of different constitution types (Prakriti) have defined
health and disease trajectories which encompass susceptibility to diseases, their prognosis as
well as the suitability of diet and life style and responsiveness to drug and environment.
Study on extreme constitution types of Ayurveda which comprises nearly 10% of the popu-
lation have revealed significant differences at the biochemical, expression, genetic level
amongst the different constitution types [12,38,39]. Identifying predictive markers and modifi-
ers relevant to high altitude adaptation and susceptibility to HAPE has also been demonstrated
using these extreme phenotypes [40,41]. The potential of integration of this phenotypic classi-
fication method in conditioning complex genetic studies for addressing missing heritability
[42] is also demonstrated.
Table 1. Model summary for validation of North India data. Prakritiwise sensitivity and specificity of three models, LASSO, Elastic net and Random for-ests for validation of North India data.
Sensitivity (%) Specificity (%)
LASSO Elasticnet
Random forests LASSO ElasticNet
Random forests
Kapha 93.1 96.55 100 100 100 98.51
Pitta 82.75 86.2 79.31 94.02 97.01 98.51
Vata 94.73 97.36 97.37 91.37 93.1 91.38
https://doi.org/10.1371/journal.pone.0185380.t001
Modelling of Ayurveda Prakriti types by machine learning approaches
PLOSONE | https://doi.org/10.1371/journal.pone.0185380 October 5, 2017 11 / 17
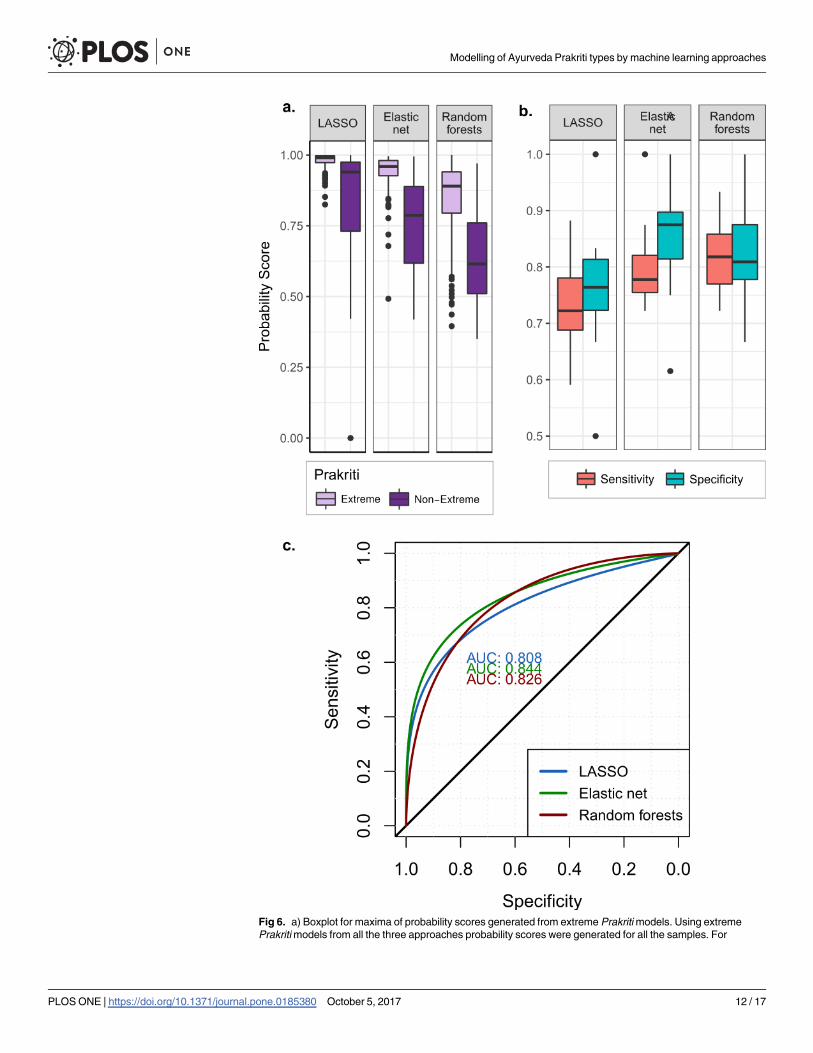
Fig 6. a) Boxplot for maxima of probability scores generated from extreme Prakritimodels. Using extremePrakritimodels from all the three approaches probability scores were generated for all the samples. For
Modelling of Ayurveda Prakriti types by machine learning approaches
PLOSONE | https://doi.org/10.1371/journal.pone.0185380 October 5, 2017 12 / 17
Accurate identification of Prakriti relies on two major steps; (1) capturing a large number
of multisystem phenotypes using a clinical questionnaire through history, examination and
responses from the study individuals and (2) interpretation of the captured data taking into
account all the inter-connectedness amongst sub-phenotypes with respect to different Prakriti.
Cultural, regional as well as ethnic factors are also of considerable significance. The inter-
observer bias as well as experience, observation and querying skills of the investigator adminis-
tering the questionnaire are also critical. There is a need to minimise the number of variables
without compromising on Prakriti prediction.
At the end of the study, we were able to set up a computational system to classify healthy
individuals into different Prakriti types. We have demonstrated that phenotype data gives rise
to three distinct clusters, which matches with the extreme Prakriti groups as classified by clini-
cians. We have also visualized intermediate Prakriti type and found that intermediate Prakriti is
a mixture of constituent extreme Prakriti and does not blend with third Prakriti group. How-
ever, we also observed some overlap in extreme and non-extreme Prakriti group and we need to
adopt or device methods for better resolution of extreme and non-extreme Prakriti separation.
This was also reflected in extreme vs non-extreme Prakriti modelling where accuracy was
reduced due to misclassification of non-extreme Prakriti type into extreme and vice versa. We
have addressed this limitation using an indirect approach which uses extreme Prakriti model to
generate probability score for all samples (extreme and non-extreme), subsequently building
logistic regression for a two class classification. Though this indirect method was able to segre-
gate extreme vs non-extreme Prakriti, a direct method would be intuitive, easy to implement
and more generalizable. We expect integration of multi-system data with phenotype data will
lead to a better resolution for extreme and non-extreme Prakriti separation.
It is interesting that stratification within normal subjects can arise from data of multiple lev-
els. These strata could be reflective of a mixture of distinct genetic, and physiological back-
grounds and age groups. Though we have assessed the performance of extreme Prakriti
models in another population, to improve outcome and applicability this needs to be extended
to more populations and in this regard a universal predictive model would be an appropriate
thing for wider application.
We might have missed out on some of the clinically relevant features due to technical limi-
tation of the modelling methods where missing feature values lead to their omission during
model building exercise. Also, rare sub phenotypes associated with particular Prakriti although
extreme Prakriti the probability was high while for non-extreme Prakriti probability was comparatively less. Thedifference in distribution of probability score provided the basis for extreme vs non-extreme Prakritimodelling b)Boxplot of 10 fold cross validation for extreme vs non-extrememodelling. Using maxima probability score glmmodels were built to classify extreme from non-extreme Prakriti. 10 fold cross validation of the models showsgood classification performance of models. Best performing models, one each from LASSO, elastic net andrandom forests were selected. c) ROC curve for distinguishing extreme from non-extreme Prakriti. Three bestglm models selected each from LASSO, elastic net and random forests show good discriminatory ability asevident from AUC.
https://doi.org/10.1371/journal.pone.0185380.g006
Table 2. Summary ofmodels (extreme vs non-extrememodelling). Sensitivity and specificity of glmmod-els built from probability scores obtained from LASSO, Elastic-net and Random forests model. The tableshows the sensitivity and specificity for the best model each selected from three algorithms.
Sensitivity (%) Specificity (%)
LASSO 88 100
Elastic net 100 91
Random forests 93 90
https://doi.org/10.1371/journal.pone.0185380.t002
Modelling of Ayurveda Prakriti types by machine learning approaches
PLOSONE | https://doi.org/10.1371/journal.pone.0185380 October 5, 2017 13 / 17
clinically important, might not have been captured. Consideration of differential weightage of
questions for estimation of different Prakriti, in different age groups, socio-cultural and geo-
climatic conditions (ethnicity) might be required in future modelling studies for universal
applicability.
Conclusion
This study thus reveals that the clinical methods of Prakriti evaluation are non-empirical and
further it can be recapitulated and formalised through advanced machine learning approaches.
Amidst the spectrum of phenotypic heterogeneity even within the genetically homogeneous
population, the interconnectedness of sub-phenotypes of different systems get highlighted in
the Prakriti groups.
Through supervised modelling, we have achieved reduction in features and questions
required for accurate Prakriti prediction. This would aid the decision making process of Prak-
riti evaluation even by trained Ayurveda physicians. These models would be useful for identifi-
cation of endo-phenotypes within and across heterogeneous populations and help decipher
novel link of genotypes to multisystem phenotypes in association studies.
Supporting information
S1 Fig. Flow-chart depicting the steps of the analysis followed.
(PDF)
S2 Fig. PCA plot of study population along with other Indian population.
(PDF)
S3 Fig. MDS visualization of non-extreme Prakriti samples with respect to extreme Prakriti
sample.
(PDF)
S4 Fig. MDS plot of unsupervised clustering using random forests performed on extreme
Prakriti male (4a) and female (4b) subjects separately.
(PDF)
S5 Fig. Savannah plot for unsupervised clustering of extreme Prakritimale and female
data.
(PDF)
S6 Fig. Plot for 39 important features selected from LASSOmodel.
(PDF)
S7 Fig. Plot for 61 important features selected from Elastic net model.
(PDF)
S8 Fig. Plot for 59 important features selected from Random forests model.
(PDF)
S1 Table. Important Features from LASSO, Elastic net and random forests.
(DOCX)
S2 Table. Confusion matrices for 10% validation data (Vadu population).
(DOCX)
S3 Table. Confusion matrices for validation on North Indian population.
(DOCX)
Modelling of Ayurveda Prakriti types by machine learning approaches
PLOSONE | https://doi.org/10.1371/journal.pone.0185380 October 5, 2017 14 / 17
S4 Table. Confusion matrices for extreme vs non-extreme modelling.
(DOCX)
S1 Appendix. Modelling of North Indian population data and validation on Vadu cohort
data.
(DOCX)
Acknowledgments
Authors acknowledge all field staffs and study population from KEMHRC-VADU. Authors also
acknowledge Binuja Varma, Amruta Vasudevan for help in genotyping experiments and Ankita
Narang in genotype analysis. Indian Genome Variation Consortium (IGVC) is also acknowl-
edged for genotype data for diverse Indian population. Project funding MLP901 from Council
of Scientific & Industrial Research (http://www.csir.res.in and DBT-BINC fellowship to PT are
acknowledged. CSIR-IGIB is acknowledged for infrastructure support including the data centre.
Author Contributions
Conceptualization:Mitali Mukerji, Bhavana Prasher.
Data curation: Pradeep Tiwari, Rintu Kutum, Ankita Shrivastava, Bhushan Girase, Shilpi
Aggarwal, Rutuja Patil, Dhiraj Agarwal, Pramod Gautam, Sanjay Juvekar, Mitali Mukerji,
Bhavana Prasher.
Formal analysis: Pradeep Tiwari, Rintu Kutum, Tavpritesh Sethi, Ankita Shrivastava, Bhushan
Girase, Shilpi Aggarwal, Rutuja Patil, Dhiraj Agarwal, Pramod Gautam, Anurag Agrawal,
Debasis Dash, Saurabh Ghosh, Sanjay Juvekar, Mitali Mukerji, Bhavana Prasher.
Funding acquisition:Mitali Mukerji, Bhavana Prasher.
Investigation: Sanjay Juvekar, Mitali Mukerji, Bhavana Prasher.
Methodology: Pradeep Tiwari, Rintu Kutum, Tavpritesh Sethi, Anurag Agrawal, Debasis
Dash, Saurabh Ghosh, Bhavana Prasher.
Project administration: Sanjay Juvekar, Mitali Mukerji, Bhavana Prasher.
Resources: Sanjay Juvekar, Mitali Mukerji, Bhavana Prasher.
Software: Pradeep Tiwari, Rintu Kutum, Tavpritesh Sethi, Saurabh Ghosh.
Supervision: Anurag Agrawal, Debasis Dash, Saurabh Ghosh, Sanjay Juvekar, Mitali Mukerji,
Bhavana Prasher.
Validation: Pradeep Tiwari, Rintu Kutum, Tavpritesh Sethi, Saurabh Ghosh, Mitali Mukerji.
Visualization: Pradeep Tiwari, Rintu Kutum, Tavpritesh Sethi, Mitali Mukerji, Bhavana
Prasher.
Writing – original draft: Pradeep Tiwari, Rintu Kutum, Tavpritesh Sethi, Mitali Mukerji,
Bhavana Prasher.
Writing – review & editing: Pradeep Tiwari, Rintu Kutum, Tavpritesh Sethi, Anurag Agrawal,
Debasis Dash, Saurabh Ghosh, Sanjay Juvekar, Mitali Mukerji, Bhavana Prasher.
References1. Leboyer M, Leboyer M, Bellivier F, Jouvent R, Nosten-Bertrand M, et al. (1998) Psychiatric genetics:
search for phenotypes. Trends in neurosciences 21: 102–105. PMID: 9530915
Modelling of Ayurveda Prakriti types by machine learning approaches
PLOSONE | https://doi.org/10.1371/journal.pone.0185380 October 5, 2017 15 / 17
2. Almasy L, Blangero J (2001) Endophenotypes as quantitative risk factors for psychiatric disease: ratio-nale and study design. American journal of medical genetics 105: 42–44. PMID: 11424994
3. Flores M, GlusmanG, Brogaard K, Price ND, Hood L (2013) P4 medicine: how systemsmedicine willtransform the healthcare sector and society. Personalized Medicine 10: 565–576. https://doi.org/10.2217/PME.13.57 PMID: 25342952
4. Hood L, Friend SH (2011) Predictive, personalized, preventive, participatory (P4) cancer medicine. NatRev Clin Oncol 8: 184–187. https://doi.org/10.1038/nrclinonc.2010.227 PMID: 21364692
5. Tian Q, Price ND, Hood L (2012) Systems cancer medicine: towards realization of predictive, preven-tive, personalized and participatory (P4) medicine. J Intern Med 271: 111–121. https://doi.org/10.1111/j.1365-2796.2011.02498.x PMID: 22142401
6. Katzenberg D, Young T, Finn L, Lin L, King DP, et al. (1998) A CLOCK polymorphism associated withhuman diurnal preference. Sleep 21: 569–576. PMID: 9779516
7. Roenneberg T, Wirz-Justice A, MerrowM (2003) Life between clocks: daily temporal patterns of humanchronotypes. J Biol Rhythms 18: 80–90. https://doi.org/10.1177/0748730402239679 PMID: 12568247
8. WittmannM, Dinich J, Roenneberg T (2006) Social jet-lag: sleep, well-being and stimulus consumptionof different chronotypes. Chronobiol Int 23: 497–509. https://doi.org/10.1080/07420520500545979PMID: 16687322
9. Sharma P (1999) Susruta-Samhita with English translation of text and Dalhana’s commentary alongwith critical notes. Varanasi, India.
10. Dance A (2016) Medical histories. Nature 537: S52–53. https://doi.org/10.1038/537S52a PMID:27602739
11. Sethi TP, Prasher B, Mukerji M (2011) Ayurgenomics: a new way of threading molecular variability forstratified medicine. ACS Chem Biol 6: 875–880. https://doi.org/10.1021/cb2003016 PMID: 21923095
12. Prasher B, Negi S, Aggarwal S, Mandal AK, Sethi TP, et al. (2008)Whole genome expression and bio-chemical correlates of extreme constitutional types defined in Ayurveda. J Transl Med 6: 48. https://doi.org/10.1186/1479-5876-6-48 PMID: 18782426
13. Prasher B, Varma B, Kumar A, Khuntia BK, Pandey R, et al. (2016) Ayurgenomics for stratified medi-cine: TRISUTRA consortium initiative across ethnically and geographically diverse Indian populations.J Ethnopharmacol.
14. Prasher B, Gibson G, Mukerji M (2016) Genomic insights into ayurvedic and western approaches topersonalized medicine. Journal of genetics 95: 209–228. PMID: 27019453
15. Slinker BK, Glantz SA (1985) Multiple regression for physiological data analysis: the problem of multi-collinearity. Am J Physiol 249: R1–12. PMID: 4014489
16. Farrar DE, Glauber RR (1967) Multicollinearity in regression analysis: the problem revisited. TheReview of Economic and Statistics: 92–107.
17. Tibshirani R (1996) Regression shrinkage and selection via the Lasso. Journal of the Royal StatisticalSociety Series B-Methodological 58: 267–288.
18. Zou H, Hastie T (2005) Regularization and variable selection via the elastic net. Journal of the RoyalStatistical Society Series B-Statistical Methodology 67: 301–320.
19. Breiman L (2001) Random forests. Machine Learning 45: 5–32.
20. Hastie T, Tibshirani R, Friedman J (2009) Unsupervised learning. The elements of statistical learning:Springer. pp. 485–585.
21. Seligson DB, Horvath S, Shi T, Yu H, Tze S, et al. (2005) Global histonemodification patterns predictrisk of prostate cancer recurrence. Nature 435: 1262–1266. https://doi.org/10.1038/nature03672PMID: 15988529
22. Shi T, Seligson D, Belldegrun AS, Palotie A, Horvath S (2005) Tumor classification by tissue microarrayprofiling: random forest clustering applied to renal cell carcinoma. Mod Pathol 18: 547–557. https://doi.org/10.1038/modpathol.3800322 PMID: 15529185
23. (2005) The Indian Genome Variation database (IGVdb): a project overview. HumGenet 118: 1–11.https://doi.org/10.1007/s00439-005-0009-9 PMID: 16133172
24. Price AL, Patterson NJ, Plenge RM,Weinblatt ME, Shadick NA, et al. (2006) Principal componentsanalysis corrects for stratification in genome-wide association studies. Nat Genet 38: 904–909. https://doi.org/10.1038/ng1847 PMID: 16862161
25. Patterson N, Price AL, Reich D (2006) Population structure and eigenanalysis. PLoS Genet 2: e190.https://doi.org/10.1371/journal.pgen.0020190 PMID: 17194218
26. Van der Laan MJ, Pollard KS, Bryan J (2003) A new partitioning aroundmedoids algorithm. Journal ofStatistical Computation and Simulation 73: 575–584.
Modelling of Ayurveda Prakriti types by machine learning approaches
PLOSONE | https://doi.org/10.1371/journal.pone.0185380 October 5, 2017 16 / 17
27. Kaufman L, Rousseeuw PJ (1990) Partitioning aroundmedoids (program pam). Finding groups in data:an introduction to cluster analysis: 68–125.
28. Rousseeuw PJ (1987) Silhouettes—aGraphical Aid to the Interpretation and Validation of Cluster-Anal-ysis. Journal of Computational and Applied Mathematics 20: 53–65.
29. TeamRC (2015) R: A language and environment for statistical computing [Internet]. Vienna, Austria: RFoundation for Statistical Computing; 2014.
30. Liaw A, Wiener M (2002) Classification and regression by randomForest. R news 2: 18–22.
31. Maechler M, Rousseeuw P, Struyf A, Hubert M, Hornik K (2012) Cluster: cluster analysis basics andextensions. R package version 1: 56.
32. Wu TT, Chen YF, Hastie T, Sobel E, Lange K (2009) Genome-wide association analysis by lasso penal-ized logistic regression. Bioinformatics 25: 714–721. https://doi.org/10.1093/bioinformatics/btp041PMID: 19176549
33. Kursa MB, Rudnicki WR (2010) Feature Selection with the Boruta Package. Journal of Statistical Soft-ware 36: 1–13.
34. Friedman J, Hastie T, Tibshirani R (2010) Regularization Paths for Generalized Linear Models via Coor-dinate Descent. J Stat Softw 33: 1–22. PMID: 20808728
35. KuhnM (2008) Building Predictive Models in R Using the caret Package. Journal of Statistical Software28: 1–26.
36. Hanley JA, McNeil BJ (1982) The meaning and use of the area under a receiver operating characteristic(ROC) curve. Radiology 143: 29–36. https://doi.org/10.1148/radiology.143.1.7063747 PMID: 7063747
37. Bradley AP (1997) The use of the area under the roc curve in the evaluation of machine learning algo-rithms. Pattern Recognition 30: 1145–1159.
38. Govindaraj P, Nizamuddin S, Sharath A, Jyothi V, Rotti H, et al. (2015) Genome-wide analysis corre-lates Ayurveda Prakriti. Sci Rep 5: 15786. https://doi.org/10.1038/srep15786 PMID: 26511157
39. Rotti H, Mallya S, Kabekkodu SP, Chakrabarty S, Bhale S, et al. (2015) DNAmethylation analysis ofphenotype specific stratified Indian population. J Transl Med 13: 151. https://doi.org/10.1186/s12967-015-0506-0 PMID: 25952924
40. Aggarwal S, Negi S, Jha P, Singh PK, Stobdan T, et al. (2010) EGLN1 involvement in high-altitudeadaptation revealed through genetic analysis of extreme constitution types defined in Ayurveda. ProcNatl Acad Sci U S A 107: 18961–18966. https://doi.org/10.1073/pnas.1006108107 PMID: 20956315
41. Aggarwal S, Gheware A, Agrawal A, Ghosh S, Prasher B, et al. (2015) Combined genetic effects ofEGLN1 and VWFmodulate thrombotic outcome in hypoxia revealed by Ayurgenomics approach. JTransl Med 13: 184. https://doi.org/10.1186/s12967-015-0542-9 PMID: 26047609
42. Juyal RC, Negi S, Wakhode P, Bhat S, Bhat B, et al. (2012) Potential of ayurgenomics approach in com-plex trait research: leads from a pilot study on rheumatoid arthritis. PLoS One 7: e45752. https://doi.org/10.1371/journal.pone.0045752 PMID: 23049851
Modelling of Ayurveda Prakriti types by machine learning approaches
PLOSONE | https://doi.org/10.1371/journal.pone.0185380 October 5, 2017 17 / 17