Research on the Dynamic-Elegance Property of Fabric
6
, , , ! "#$%"#&’’! &(&"$$")’’ *+! *+ ,+*+! , * *+ ,+*+! - * ,+ ’+ + * *+! + Abstract. Fabric deformation performance is an index that characterizes the dynamic performance of the fabric. However there is no separate study about fabric deformation performance. According to morphological wave data measured by fabric deformation testing device made by ourselves, we have determined to cluster analysis fabric deformation performance with the following six indicators, that is, the wavelength of the first half-wave, amplitude, half-wave area, shape coefficients, amplitude attenuation coefficient, and the number of half-wave, and also have done comparative analysis of deformation characteristics of four types of fabric. The results showed that the six indicators can measure the different kinds of fabric’s deformation characters much better, and showed that the weight of per square meter of fabrics and bending rigidity have influenced significantly. The research results have a realistic meaning for fabric processing technology and the rational use. Introduction Fabric deformation performance is referred to the characteristics of fabric curved surface morphological changes when blown by wind or affected by external forces. It’s the indicator of fabric dynamic performances. Fabrics have different styles of deformation waves. According to the tested one-way deformation wave data got from the device made by ourselves [1] under the constant chuck speed and amplitude, we have measured and classified the fabrics with similar waveform with the clustering analysis [2]. The characteristics of different kinds of deformation waves have been compared, and the key influencing factors also have been analyzed. Materials and experimental procedures The classification of fabric deformation waves. The chuck frequency of deformation testing device is 182rpm, the amplitude is 4.4cm, and the length of samples 31.5in, the width 3.94in. Shot deformation waveform of samples at the same place, determined six clustering analysis indexes, classified the fabrics. The deformation wave morphology is shown in Figure 1. Since the fabric deformation wave morphology is amplitude attenuation form[3], by analyzing many relevant indicators[1], we removed the ones with obvious linear relationship and determined six indicators for clustering analysis, that is, the wavelength of the first half-waveλ, amplitude A, half-wave area S(S=Aλ), shape coefficients Ω ( A/λ ) , amplitude attenuation coefficient ψ ( λ A ln 4 . 4 ln − ), and the number of half-wave N. Fig.1 The deformation wave morphology Advanced Materials Research Vol. 796 (2013) pp 161-165 Online available since 2013/Sep/18 at www.scientific.net © (2013) Trans Tech Publications, Switzerland doi:10.4028/www.scientific.net/AMR.796.161 All rights reserved. No part of contents of this paper may be reproduced or transmitted in any form or by any means without the written permission of TTP, www.ttp.net. (ID: 130.15.241.167, Queen's University, Kingston, Canada-17/08/14,19:39:31)
Transcript of Research on the Dynamic-Elegance Property of Fabric
,
,,
!"#$%"#&'' !&(&"$$")''
*+!*+ ,+*+ !,**+ ,+*+ !-
*,+'+ +**+!+
Abstract. Fabric deformation performance is an index that characterizes the dynamic performance of
the fabric. However there is no separate study about fabric deformation performance. According to
morphological wave data measured by fabric deformation testing device made by ourselves, we have
determined to cluster analysis fabric deformation performance with the following six indicators, that
is, the wavelength of the first half-wave, amplitude, half-wave area, shape coefficients, amplitude
attenuation coefficient, and the number of half-wave, and also have done comparative analysis of
deformation characteristics of four types of fabric. The results showed that the six indicators can
measure the different kinds of fabric’s deformation characters much better, and showed that the
weight of per square meter of fabrics and bending rigidity have influenced significantly. The research
results have a realistic meaning for fabric processing technology and the rational use.
Introduction
Fabric deformation performance is referred to the characteristics of fabric curved surface
morphological changes when blown by wind or affected by external forces. It’s the indicator of fabric
dynamic performances. Fabrics have different styles of deformation waves. According to the tested
one-way deformation wave data got from the device made by ourselves [1] under the constant
chuck speed and amplitude, we have measured and classified the fabrics with similar waveform with
the clustering analysis [2]. The characteristics of different kinds of deformation waves have been
compared, and the key influencing factors also have been analyzed.
Materials and experimental procedures
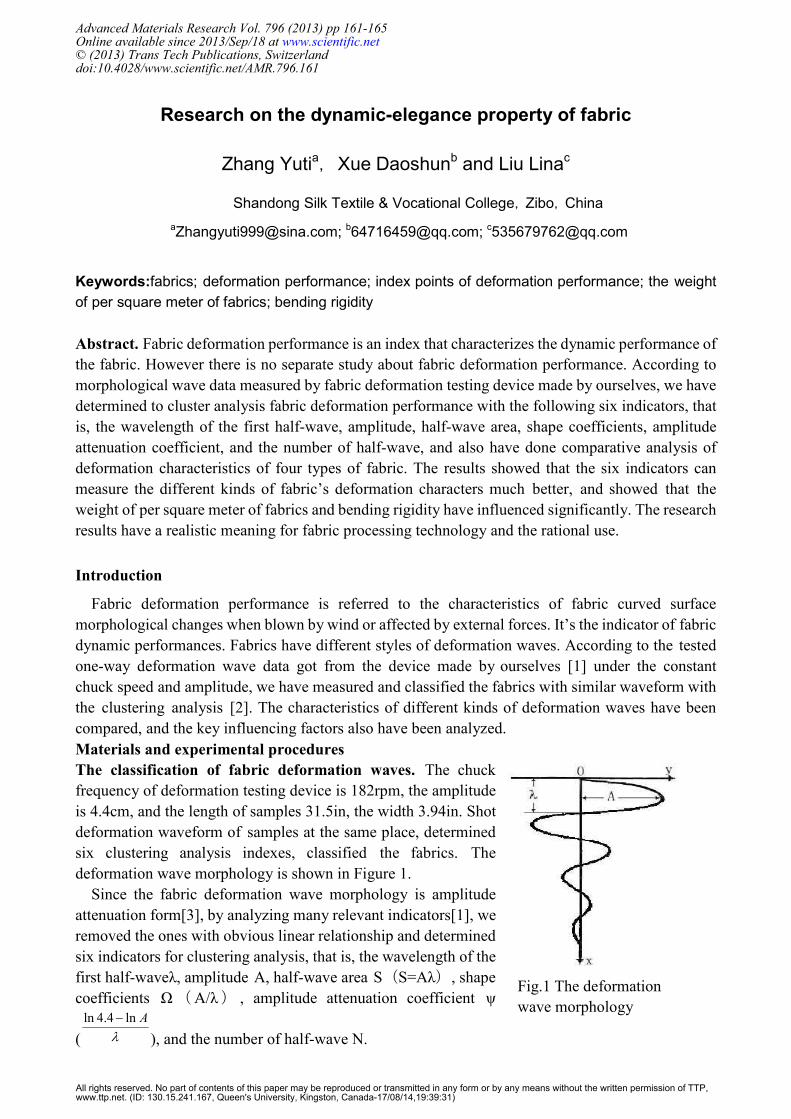
The classification of fabric deformation waves. The chuck
frequency of deformation testing device is 182rpm, the amplitude
is 4.4cm, and the length of samples 31.5in, the width 3.94in. Shot
deformation waveform of samples at the same place, determined
six clustering analysis indexes, classified the fabrics. The
deformation wave morphology is shown in Figure 1.
Since the fabric deformation wave morphology is amplitude
attenuation form[3], by analyzing many relevant indicators[1], we
removed the ones with obvious linear relationship and determined
six indicators for clustering analysis, that is, the wavelength of the
first half-waveλ, amplitude A, half-wave area S(S=Aλ), shape
coefficients Ω(A/λ) , amplitude attenuation coefficient ψ
( λ
Aln4.4ln −
), and the number of half-wave N.
Fig.1 The deformation
wave morphology
Advanced Materials Research Vol. 796 (2013) pp 161-165Online available since 2013/Sep/18 at www.scientific.net© (2013) Trans Tech Publications, Switzerlanddoi:10.4028/www.scientific.net/AMR.796.161
All rights reserved. No part of contents of this paper may be reproduced or transmitted in any form or by any means without the written permission of TTP,www.ttp.net. (ID: 130.15.241.167, Queen's University, Kingston, Canada-17/08/14,19:39:31)
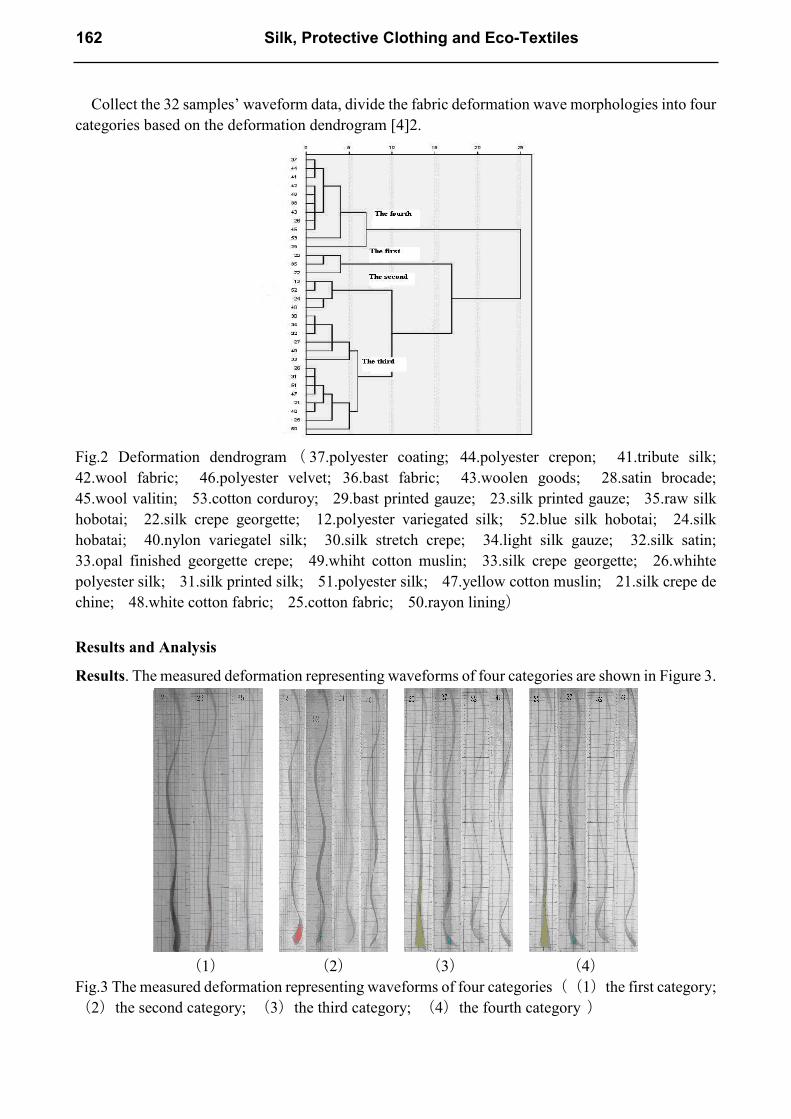
Collect the 32 samples’ waveform data, divide the fabric deformation wave morphologies into four
categories based on the deformation dendrogram [4]2.
Fig.2 Deformation dendrogram ( 37.polyester coating; 44.polyester crepon; 41.tribute silk;
42.wool fabric; 46.polyester velvet; 36.bast fabric; 43.woolen goods; 28.satin brocade;
45.wool valitin; 53.cotton corduroy; 29.bast printed gauze; 23.silk printed gauze; 35.raw silk
hobotai; 22.silk crepe georgette; 12.polyester variegated silk; 52.blue silk hobotai; 24.silk
hobatai; 40.nylon variegatel silk; 30.silk stretch crepe; 34.light silk gauze; 32.silk satin;
33.opal finished georgette crepe; 49.whiht cotton muslin; 33.silk crepe georgette; 26.whihte
polyester silk; 31.silk printed silk; 51.polyester silk; 47.yellow cotton muslin; 21.silk crepe de
chine; 48.white cotton fabric; 25.cotton fabric; 50.rayon lining)
Results and Analysis
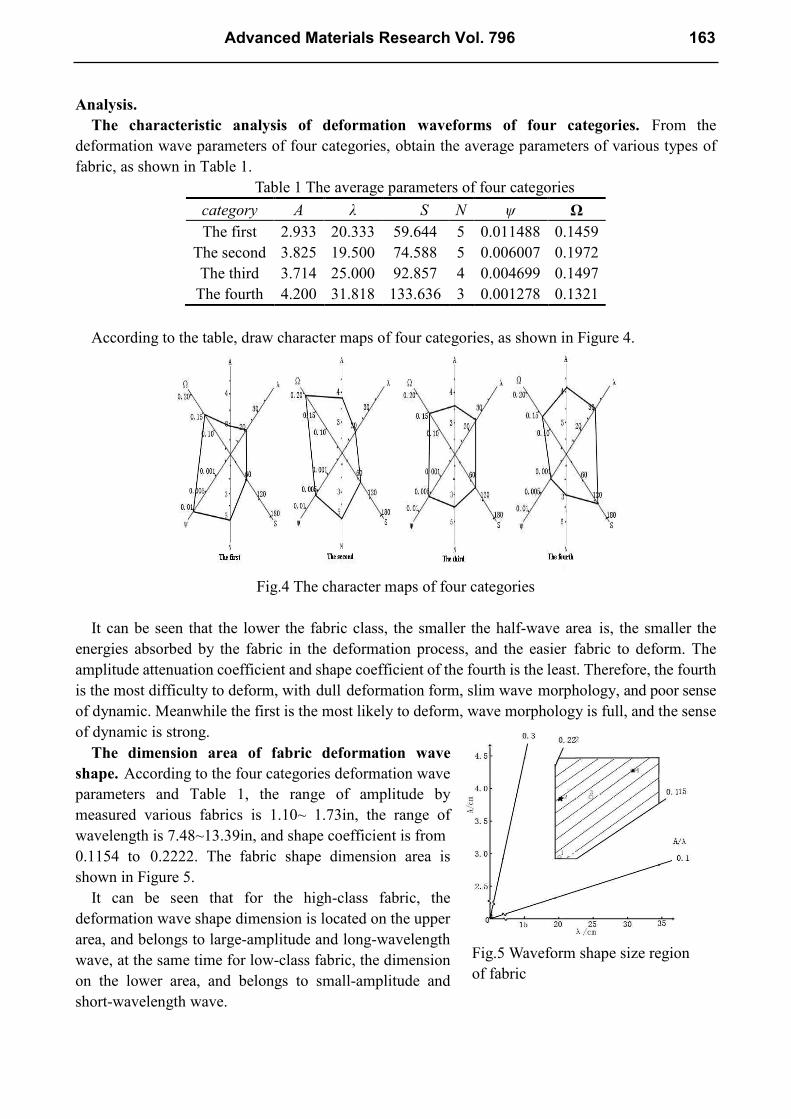
Results. The measured deformation representing waveforms of four categories are shown in Figure 3.
(1) (2) (3) (4)
Fig.3 The measured deformation representing waveforms of four categories((1)the first category;
(2)the second category; (3)the third category; (4)the fourth category )
162 Silk, Protective Clothing and Eco-Textiles
Analysis.
The characteristic analysis of deformation waveforms of four categories. From the
deformation wave parameters of four categories, obtain the average parameters of various types of
fabric, as shown in Table 1.
Table 1 The average parameters of four categories
category A λ S N ψ Ω
The first 2.933 20.333 59.644 5 0.011488 0.1459
The second 3.825 19.500 74.588 5 0.006007 0.1972
The third 3.714 25.000 92.857 4 0.004699 0.1497
The fourth 4.200 31.818 133.636 3 0.001278 0.1321
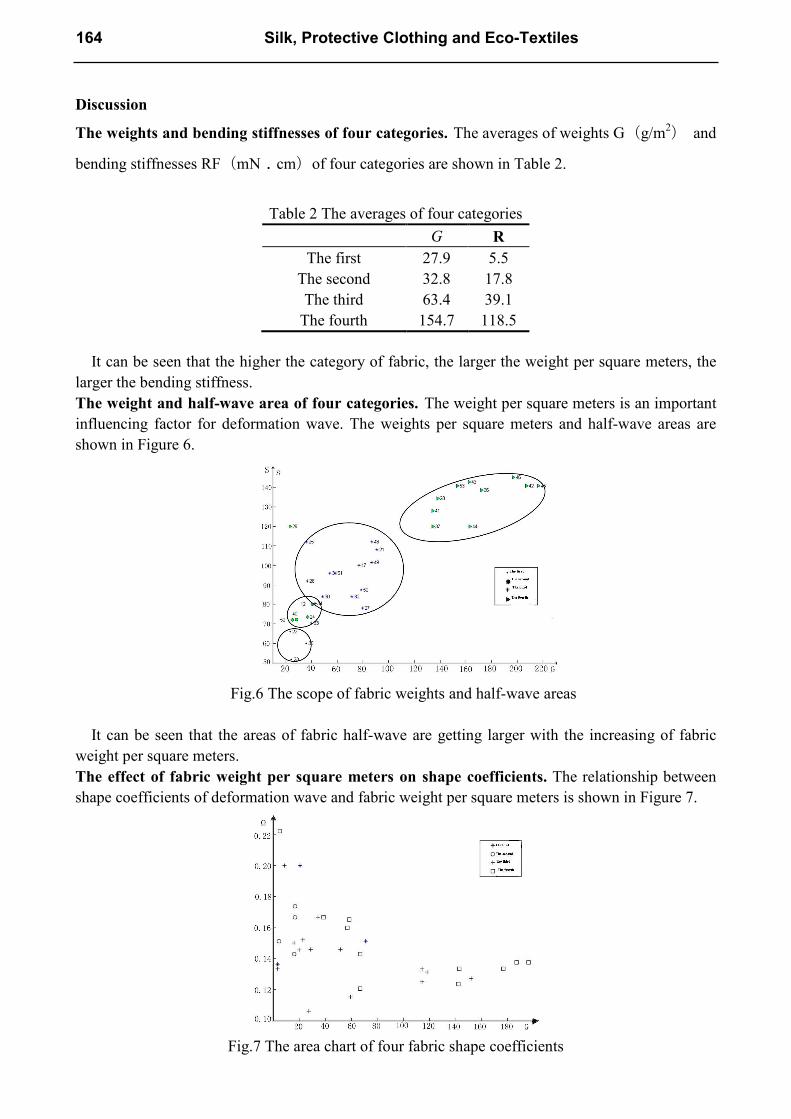
According to the table, draw character maps of four categories, as shown in Figure 4.
Fig.4 The character maps of four categories
It can be seen that the lower the fabric class, the smaller the half-wave area is, the smaller the
energies absorbed by the fabric in the deformation process, and the easier fabric to deform. The
amplitude attenuation coefficient and shape coefficient of the fourth is the least. Therefore, the fourth
is the most difficulty to deform, with dull deformation form, slim wave morphology, and poor sense
of dynamic. Meanwhile the first is the most likely to deform, wave morphology is full, and the sense
of dynamic is strong.
The dimension area of fabric deformation wave
shape. According to the four categories deformation wave
parameters and Table 1, the range of amplitude by
measured various fabrics is 1.10~ 1.73in, the range of
wavelength is 7.48~13.39in, and shape coefficient is from
0.1154 to 0.2222. The fabric shape dimension area is
shown in Figure 5.
It can be seen that for the high-class fabric, the
deformation wave shape dimension is located on the upper
area, and belongs to large-amplitude and long-wavelength
wave, at the same time for low-class fabric, the dimension
on the lower area, and belongs to small-amplitude and
short-wavelength wave.
Fig.5 Waveform shape size region
of fabric
Advanced Materials Research Vol. 796 163
Discussion
The weights and bending stiffnesses of four categories. The averages of weights G(g/m2) and
bending stiffnesses RF(mN﹒cm)of four categories are shown in Table 2.
Table 2 The averages of four categories
G R
The first 27.9 5.5
The second 32.8 17.8
The third 63.4 39.1
The fourth 154.7 118.5
It can be seen that the higher the category of fabric, the larger the weight per square meters, the
larger the bending stiffness.
The weight and half-wave area of four categories. The weight per square meters is an important
influencing factor for deformation wave. The weights per square meters and half-wave areas are
shown in Figure 6.
Fig.6 The scope of fabric weights and half-wave areas
It can be seen that the areas of fabric half-wave are getting larger with the increasing of fabric
weight per square meters.
The effect of fabric weight per square meters on shape coefficients. The relationship between
shape coefficients of deformation wave and fabric weight per square meters is shown in Figure 7.
Fig.7 The area chart of four fabric shape coefficients
164 Silk, Protective Clothing and Eco-Textiles
With the increasing of fabric weight per square meters, the shape coefficients tend to decrease.
And when the former reaches to high level, the latter tends to stable condition. The fabric weights of
per square meters of the third and fourth are the largest, and their shape coefficients are the smallest.
While those of the first and second are higher and more scattering, indicating that the influencing
factors are more complex.
Conclusion
We clustering analyzed 32 kinds of fabrics with six indicators, that is, the wavelength of
half-wave, amplitude, half-wave area, shape coefficients, amplitude attenuation coefficient and the
number of half-wave, and divided them into four categories. Among them, the first ones are thin silk
fabrics belonging to small-amplitude and short-wavelength wave, while the fourth are heavy and
thick fabrics, such as flax, wool and polyester, belonging to large-amplitude and long-wavelength
wave.
With the increasing of the category, the areas of deformation wave half wave are getting larger, and
the amplitude attenuation coefficient, wavelength of half-wave and shape coefficients are getting
small. Among them the average area of half wave of the first is 23.48 in2, which is the least in all
samples, indicating that the energy absorbed by the fabric during deformation is the smallest, so this
category is easy to deform, and the average amplitude attenuation coefficient is 0.011488, which is
the maximum, so the fabrics show the elegant and beautiful morphological changes. The average area
of half wave of the fourth is 52.61in2, which is the largest in all samples, indicating that the energy is
the largest, so this category is hard to deform. The average amplitude attenuation coefficient is
0.001278, which is the minimum, indicating that the energy consumed in the propagation process is
the least and the propagating distance is far. The average shape coefficient is 0.1321, which is the
least in all samples, indicating that the shape is not full and thinner. The second and third are located
in the middle.
The larger the fabric weight of per square meters and bending rigidity are, the higher the category
of fabrics is located. So the fabrics are not easy to perform, and dynamic is also poor.
References
[1] Y.T Zhang. Study on Fabric Possibly Deformation Performance. Scoochow University. 2012.
[2] K.T Fang and E.P Fan .Clustering analysis.Beijing:Geological Publishing House. 1982:
p.23-25.
[3] Y.T Zhang, Y.M Wang and M Yao.Study on Test Methods of Fabric Possibly Deformation
Performance. 8th International Shibori Symposium.2011:p.140.
[4] W.TZhang SPSS11Statistical Analysis Tutorial.Beijing:Hope Electronic Press.2002.
[5] L.H Fan,L.P Shen and Y.F Duan. The relationship between fabric bending properties and
composition parameters.Shanxi Textile.1999(42)2:p.31-33.
Advanced Materials Research Vol. 796 165

Silk, Protective Clothing and Eco-Textiles 10.4028/www.scientific.net/AMR.796 Research on the Dynamic-Elegance Property of Fabric 10.4028/www.scientific.net/AMR.796.161