研究方法の概論(research basics)
74
“Elementary my dear Fukuoka UX Study Group” 「初歩だよ、福岡UX勉強会君」 クルッツ・クリスチャン Basics definitions and common mistakes in research methodology 研究方法の基礎定義及び一般的な間違い Cruz Christian
-
Upload
watanabe-carcass -
Category
Education
-
view
559 -
download
4
Transcript of 研究方法の概論(research basics)

“Elementary my dear Fukuoka UX Study Group”「初歩だよ、福岡UX勉強会君」
クルッツ・クリスチャン
Basics definitions and common mistakes in research methodology 研究方法の基礎定義及び一般的な間違い
Cruz Christian

“Elementary my dear Fukuoka UX Study Group”
Basics definitions and common mistakes in research methodology74
�2
SEARCHRE

“Elementary my dear Fukuoka UX Study Group”
Basics definitions and common mistakes in research methodology74
�3
Systematised effort to gain new knowledge 研究とは体制的に新しい知識を身につける事です。
1000 pt

“Elementary my dear Fukuoka UX Study Group”
Basics definitions and common mistakes in research methodology74
�4
Precise Control over INNOVATION
イノベーションの正確な管理
Random decisions over CREATIVITY 創造力のランダムな決定
Systematised effort to gain new knowledge 研究とは体制的に新しい知識を身につける事です。
SEARCHRE
“Elementary my dear Fukuoka UX Study Group”
Basics definitions and common mistakes in research methodology74
�5
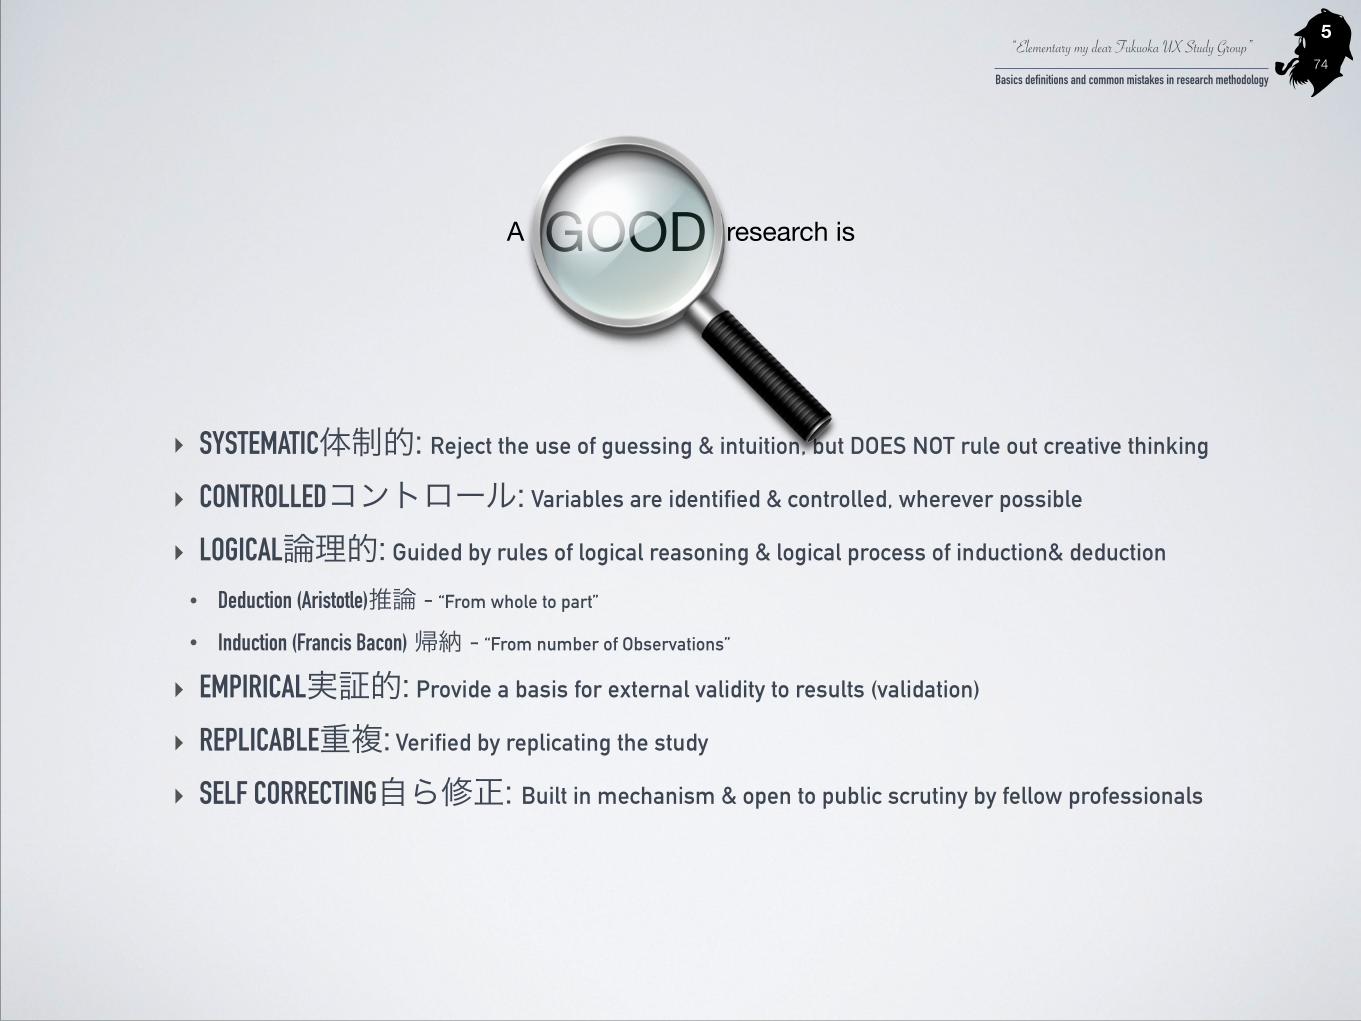
‣ SYSTEMATIC体制的: Reject the use of guessing & intuition, but DOES NOT rule out creative thinking ‣ CONTROLLEDコントロール: Variables are identified & controlled, wherever possible ‣ LOGICAL論理的: Guided by rules of logical reasoning & logical process of induction& deduction
• Deduction (Aristotle)推論 - “From whole to part” • Induction (Francis Bacon) 帰納 - “From number of Observations”
‣ EMPIRICAL実証的: Provide a basis for external validity to results (validation)
‣ REPLICABLE重複: Verified by replicating the study ‣ SELF CORRECTING自ら修正: Built in mechanism & open to public scrutiny by fellow professionals
GOODA research is
“Elementary my dear Fukuoka UX Study Group”
Basics definitions and common mistakes in research methodology74
�6
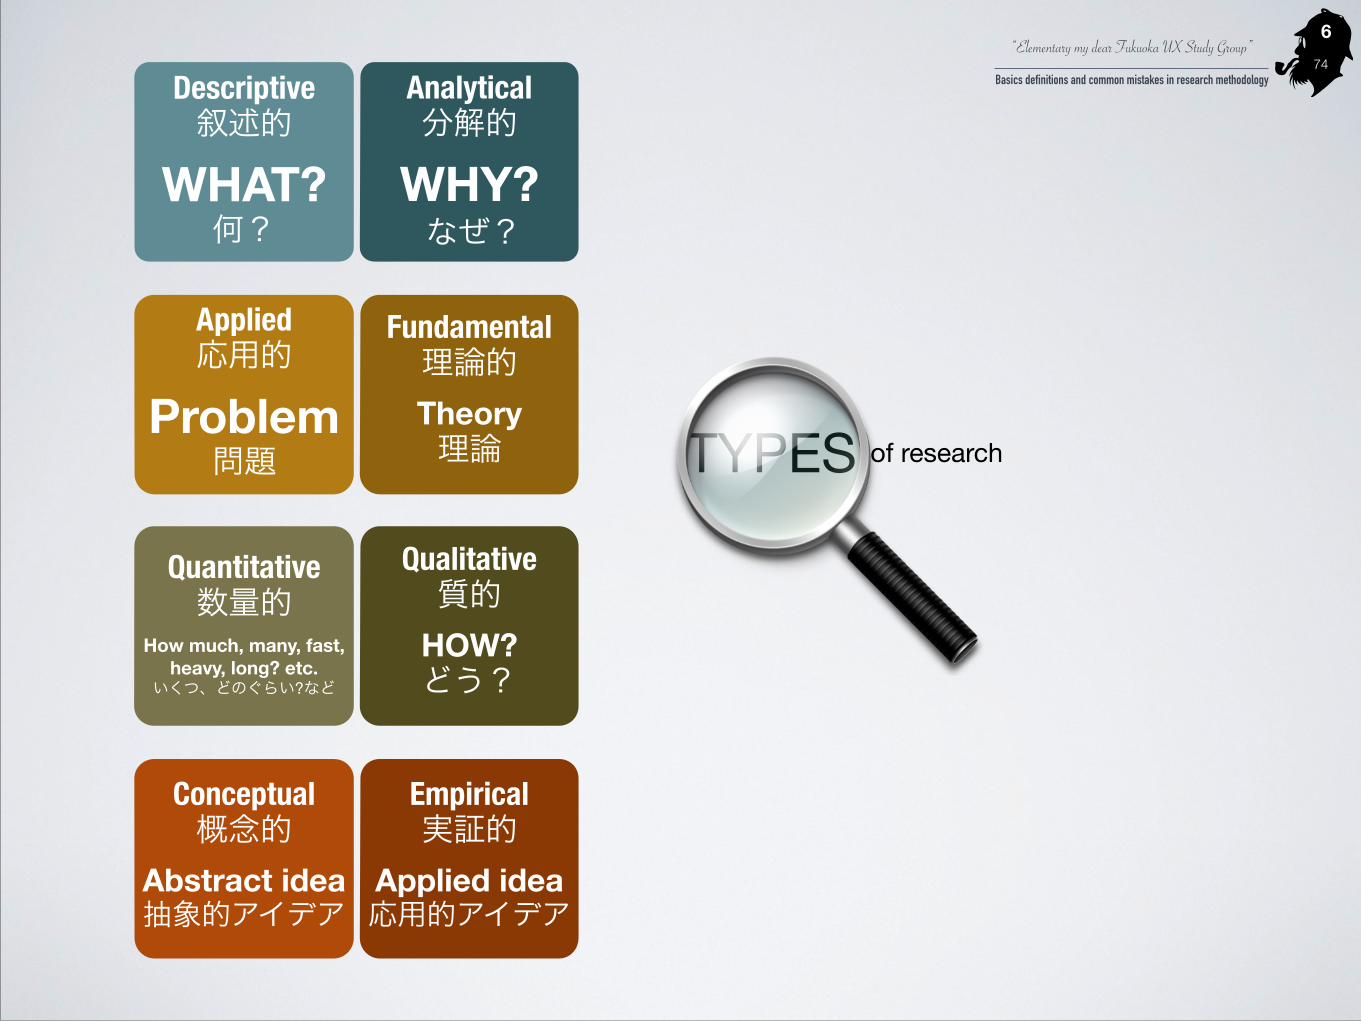
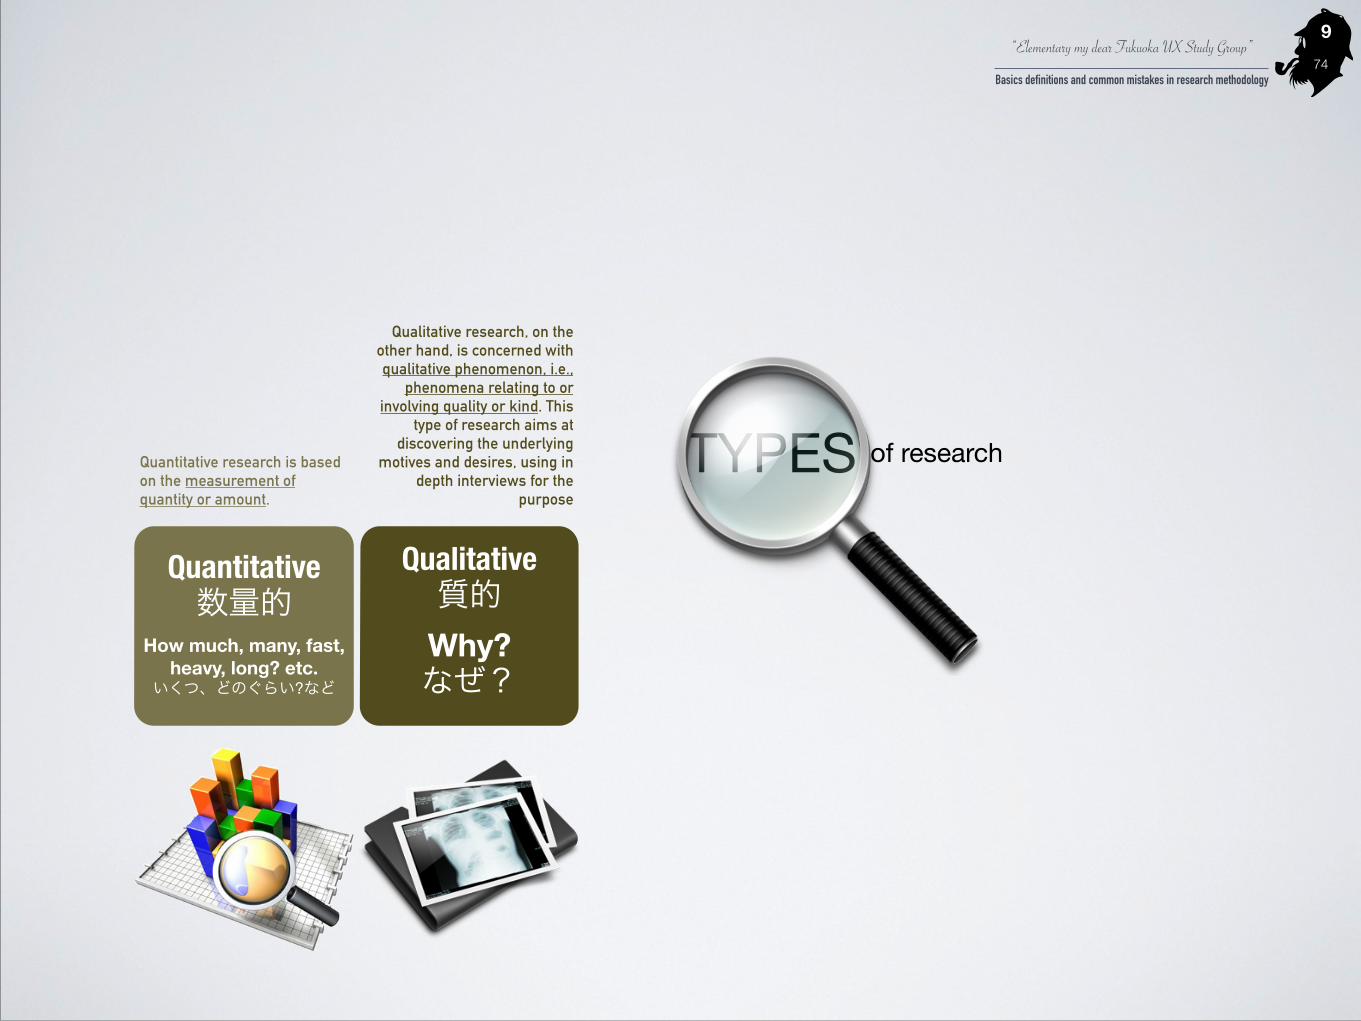
TYPES of research
Descriptive 叙述的
WHAT? 何?
Analytical 分解的
WHY? なぜ?
Applied 応用的
Problem 問題
Fundamental 理論的Theory 理論
Quantitative 数量的
How much, many, fast, heavy, long? etc.
いくつ、どのぐらい?など
Qualitative 質的
HOW? どう?
Conceptual 概念的
Abstract idea 抽象的アイデア
Empirical 実証的
Applied idea 応用的アイデア

“Elementary my dear Fukuoka UX Study Group”
Basics definitions and common mistakes in research methodology74
�7
TYPES of research
Descriptive 叙述的
WHAT? 何?
Analytical 分解的
WHY? なぜ?
The major purpose of descriptive research is description of the state of affairs as it exists at present. The methods of research used in descriptive research are survey methods of all kinds, including comparative and correlational methods.
The analytical research usually concerns itself with cause-
effect relationships

“Elementary my dear Fukuoka UX Study Group”
Basics definitions and common mistakes in research methodology74
�8
TYPES of research
Applied 応用的
Problem 問題
Fundamental 理論的Theory 理論
Applied research aims at finding a solution for an immediate problem facing a society or an industrial/business organisation. ”Discover a solution for some pressing practical problem"
Concerned with generalisations and with the
formulation of a theory.
“Elementary my dear Fukuoka UX Study Group”
Basics definitions and common mistakes in research methodology74
�9
TYPES of research
Quantitative 数量的
How much, many, fast, heavy, long? etc.
いくつ、どのぐらい?など
Qualitative 質的
Why? なぜ?
Quantitative research is based on the measurement of quantity or amount.
Qualitative research, on the other hand, is concerned with qualitative phenomenon, i.e.,
phenomena relating to or involving quality or kind. This
type of research aims at discovering the underlying
motives and desires, using in depth interviews for the
purpose

“Elementary my dear Fukuoka UX Study Group”
Basics definitions and common mistakes in research methodology74
�10
TYPES of research
Conceptual 概念的
Abstract idea 抽象的アイデア
Empirical 実証的
Applied idea 応用的アイデア
Empirical research relies on experience or observation
alone, often without due regard for system and theory. It is
data-based research, coming up with conclusions which are
capable of being verified by observation or experiment.
Conceptual research is that related to some abstract idea(s) or theory. It is generally used by philosophers and thinkers to develop new concepts or to reinterpret existing ones.
“Elementary my dear Fukuoka UX Study Group”
Basics definitions and common mistakes in research methodology74
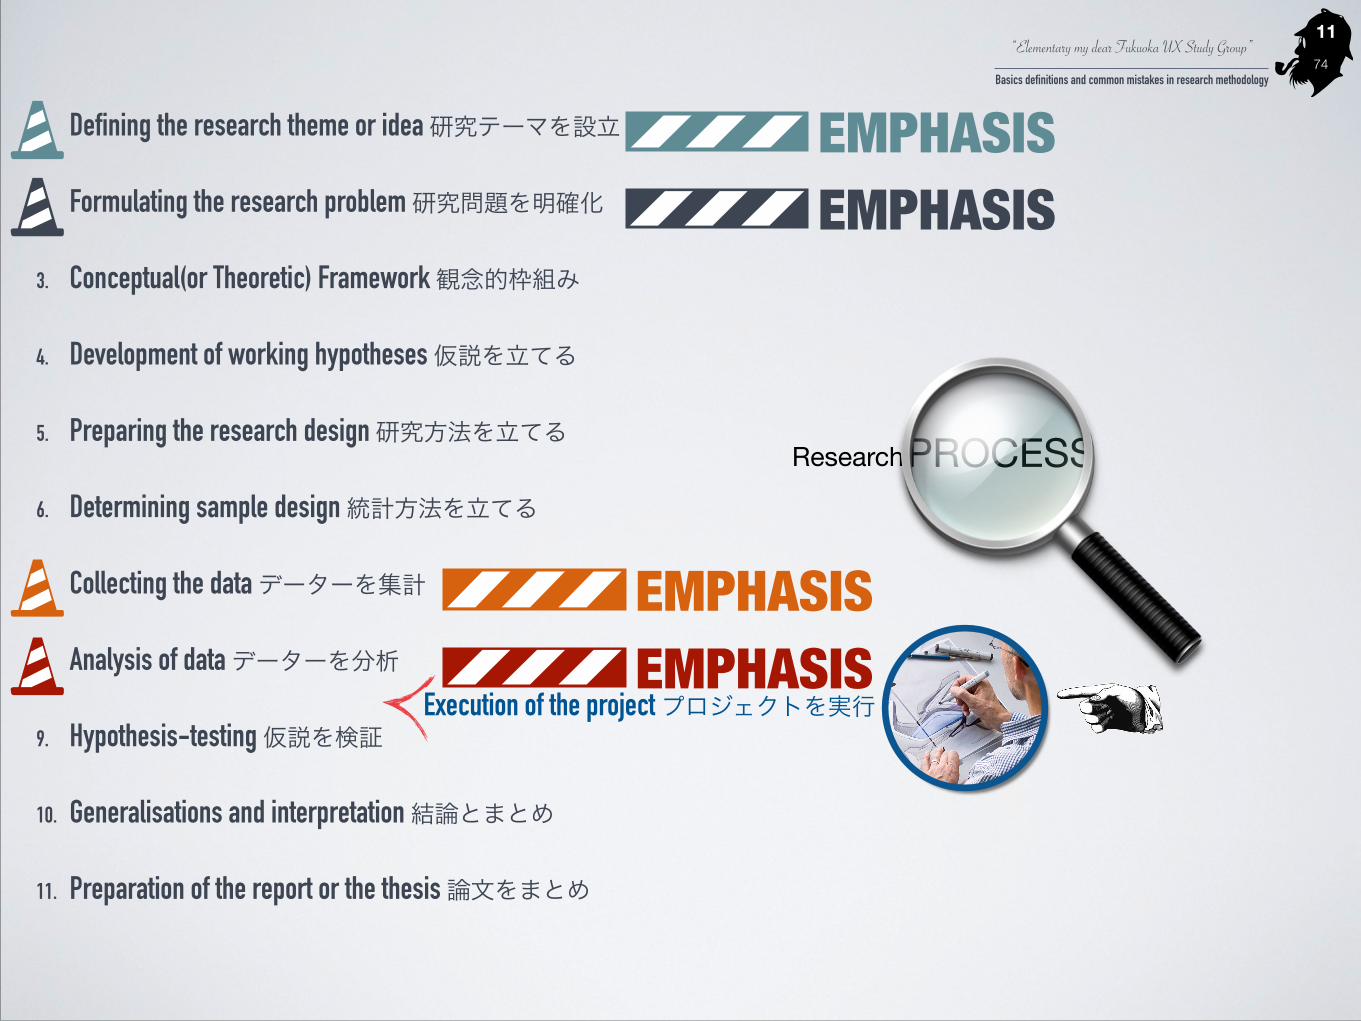
ResearchPROCESS
�11
1. Defining the research theme or idea 研究テーマを設立
2. Formulating the research problem 研究問題を明確化
3. Conceptual(or Theoretic) Framework 観念的枠組み
4. Development of working hypotheses 仮説を立てる
5. Preparing the research design 研究方法を立てる
6. Determining sample design 統計方法を立てる
7. Collecting the data データーを集計
8. Analysis of data データーを分析
9. Hypothesis-testing 仮説を検証
10. Generalisations and interpretation 結論とまとめ
11. Preparation of the report or the thesis 論文をまとめ
EMPHASISEMPHASIS
EMPHASISEMPHASIS
Execution of the project プロジェクトを実行
“Elementary my dear Fukuoka UX Study Group”
Basics definitions and common mistakes in research methodology74
�12
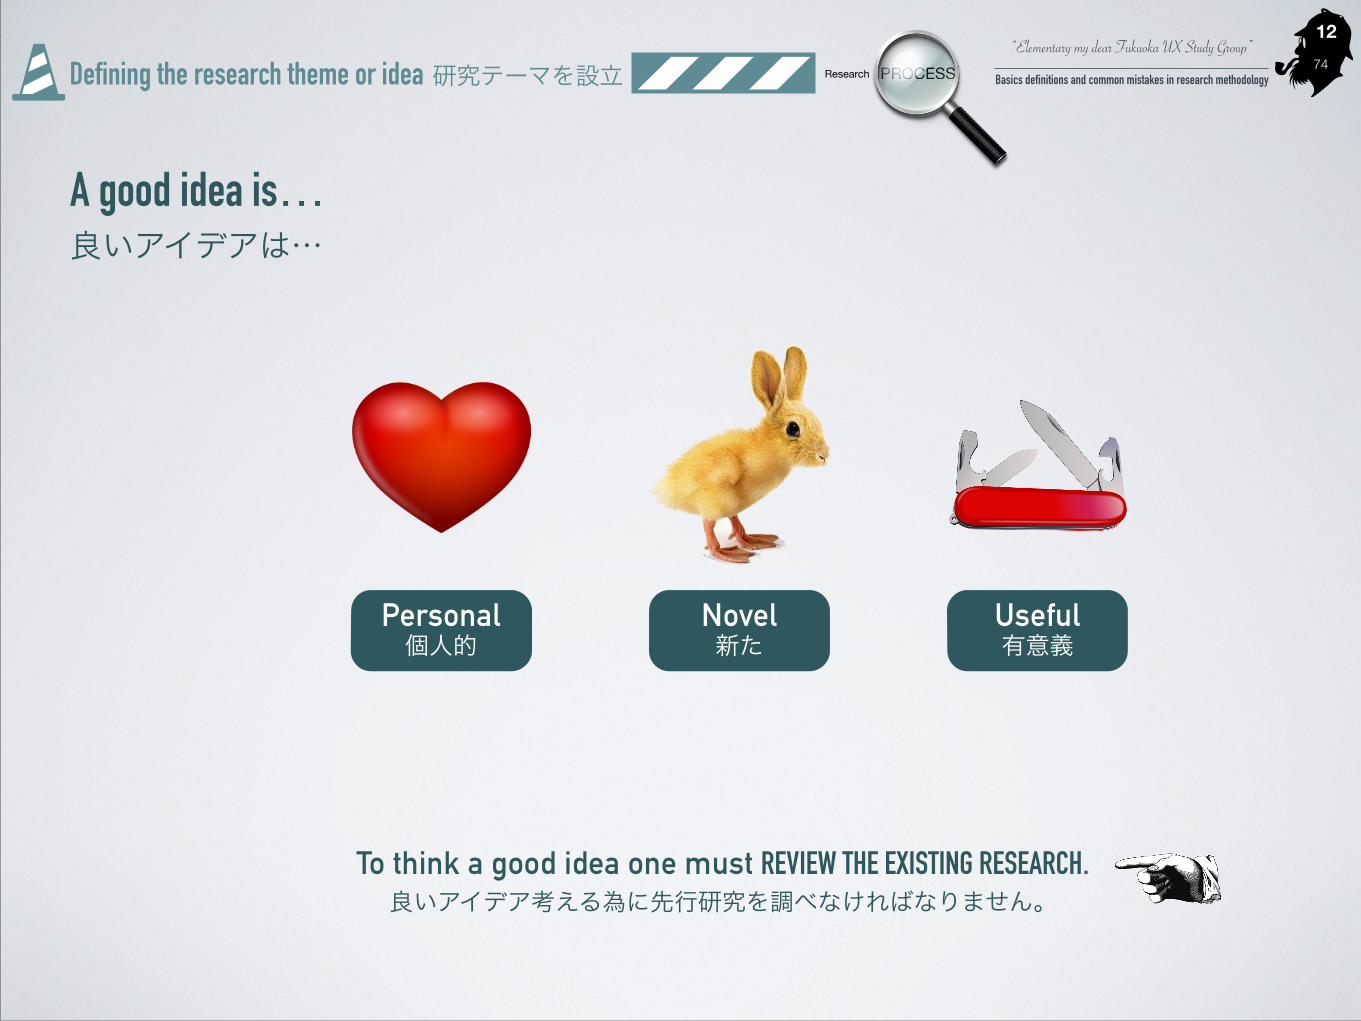
Defining the research theme or idea 研究テーマを設立
A good idea is… 良いアイデアは…
Research PROCESS
Personal 個人的
Novel 新た
Useful 有意義
To think a good idea one must REVIEW THE EXISTING RESEARCH. 良いアイデア考える為に先行研究を調べなければなりません。

“Elementary my dear Fukuoka UX Study Group”
Basics definitions and common mistakes in research methodology74
�13
Formulating the research problem 研究問題を明確化
The problem MUST express one or more relations between variables. 問題点は必ず変数の一つまたは一つ以上と関連する。
Research PROCESS
The Objectives MUST be measurable. 目標は必ず測定可能。!An objective MUST NOT contain moral or aesthetic judgments. 目標は必ず道徳または美感覚を含めない。!
WHAT? 何?
WHO? 誰?
WHEN? いつ?
WHY? なぜ?
HOW? どうやって?
ETC… など・・・
ETC… など・・・
The problem 問題点
Objectives 目標
Research Questions 研究質問
Viability 実行可能性
Relevance 重要
Consequences 結果
Convenience 利便 !Social relevance 社会的関連 !Practical Implications 具体的結果 !Theoretical value 理論的価値 !Methodological value 方法論的価値

“Elementary my dear Fukuoka UX Study Group”
Basics definitions and common mistakes in research methodology74Collecting the data データーを集計 Research PROCESS
�14
Quantitative 数量的
How much, many, fast, heavy, long? etc.
いくつ、どのぐらい?など
Qualitative 質的
HOW? どう?
Measuring sets of variables or quantities and their relationship to one another
Understanding the qualities of a
specific field of inquiry
ETHNOGRAPHY !Interviewインタビュー Focus Groupフォーカスグループ
ETCなど
MEASUREMENT !
態度測定Attitude measurement
アンケートQuestionnaire
一定試験と目録Standardised test and inventories
Research PROCESS
“Elementary my dear Fukuoka UX Study Group”
Basics definitions and common mistakes in research methodology74Collecting the data データーを集計 Research PROCESS
�15
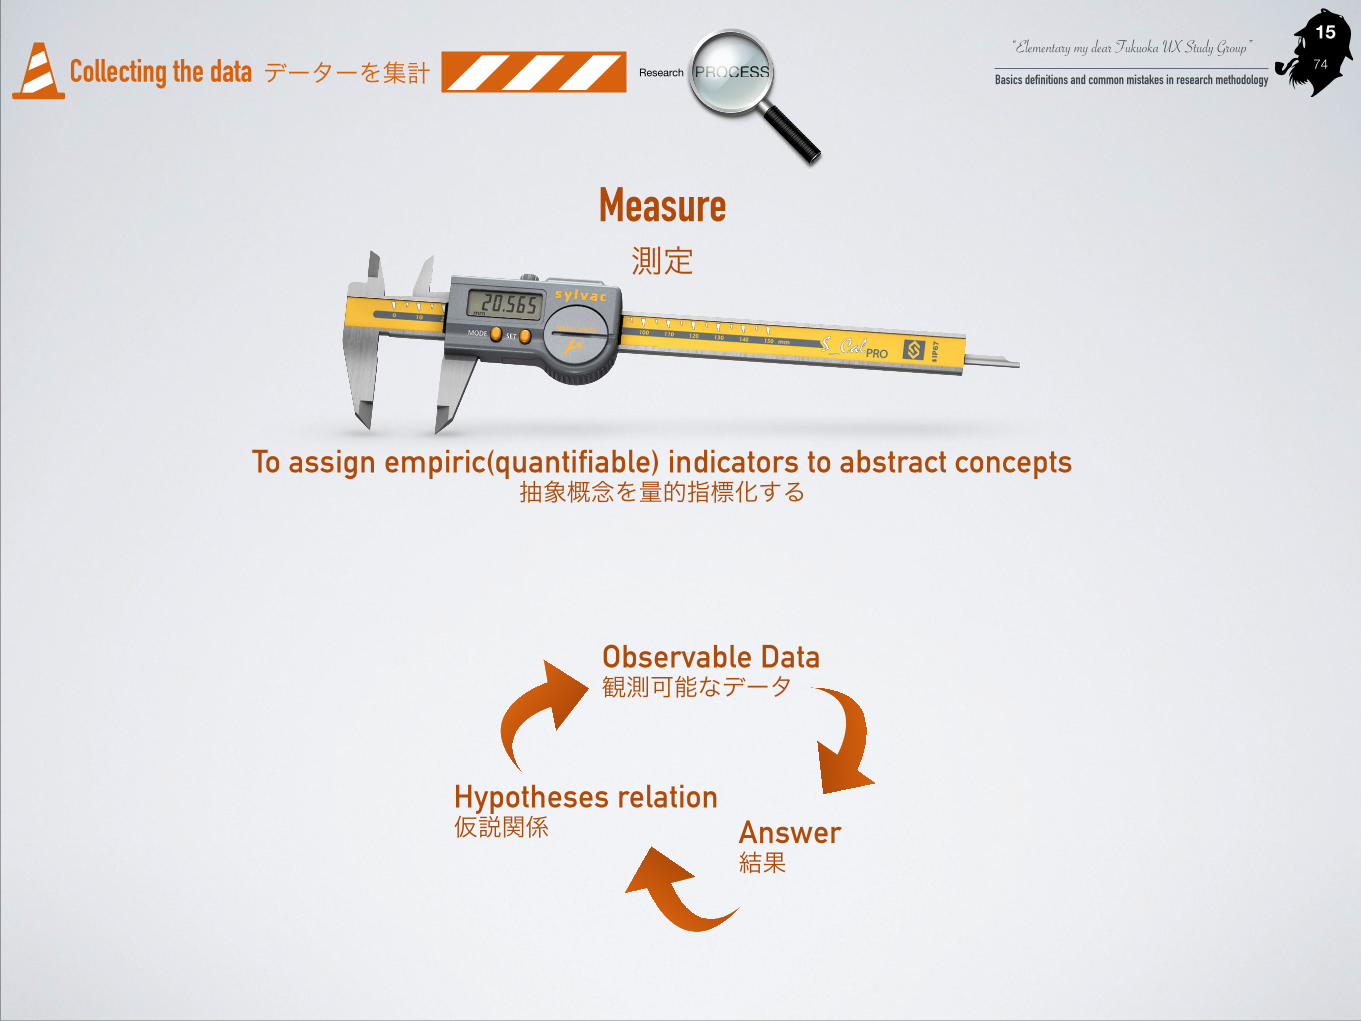
Measure 測定
To assign empiric(quantifiable) indicators to abstract concepts 抽象概念を量的指標化する
Hypotheses relation 仮説関係 Answer
結果
Observable Data 観測可能なデータ

“Elementary my dear Fukuoka UX Study Group”
Basics definitions and common mistakes in research methodology74Collecting the data データーを集計 Research PROCESS
�16
knowledge 知識
Our personal map/model of the World 世界の個人的なモデル。
Data is raw and unorganised fundamental facts. Numerical values !データとは、未処理あるいは未組織な基礎的事実のことです。 「数値」
A property which can change and its variations can be measured.
変化する特徴、この特徴が計る事が出来る。
Variable 変数
information 情報
data データ
When data is processed,
organised, structured or presented in a
given context so as to make it useful, it is called Information.
Meaning
データが処理、整理、構造化されると、役立つデータになり、情報と呼ばれています。「意味」

“Elementary my dear Fukuoka UX Study Group”
Basics definitions and common mistakes in research methodology74Collecting the data データーを集計 Research PROCESS
�17
KEEP CALM
AND
LOVE Evangelion
information 情報
Watch timesmonth A B C D E F G
January 2 4 31 6 8 1 8February 3 7 28 3 5 1 3
March 1 4 31 8 3 1 3April 4 8 30 4 4 4 4May 5 3 31 5 2 1 5June 12 3 30 6 1 2 1July 5 14 31 5 4 5 3
August 6 6 31 7 1 2 3September 8 8 30 8 4 2 3
October 3 6 31 5 5 2 1November 5 4 30 5 7 2 2December 1 0 31 12 8 1 1
Variable 変数
A property which can change and its variations can be measured.
変化する特徴、この特徴が計る事が出来る。
Variable 変数
Watch timesmonth times
JanuaryFebruary
MarchAprilMayJuneJuly
AugustSeptember
OctoberNovemberDecember
data データ

“Elementary my dear Fukuoka UX Study Group”
Basics definitions and common mistakes in research methodology74Collecting the data データーを集計 Research PROCESS
�18
Collection Instrument 手法
RELIABILITY 確実性The degree in which the repeated application produces the same results. 繰り返す適用の程度は同じ結果を生成している
VALIDITY 妥当性
The degree in which an instrument really
measures what is intended to be measured. 本当に測定する手法の程度は
意図している測定です。

“Elementary my dear Fukuoka UX Study Group”
Basics definitions and common mistakes in research methodology74Collecting the data データーを集計 Research PROCESS
�19
Collection Instrument 手法
RELIABILITY 確実性
VALIDITY 妥当性
Factors that affect Validity and Reliability 妥当性と確実性に影響を与える要因
Cultural Context and Time 文化的文脈と時間
Morphology 形態論
e.g. Not enough space for writing e.g. Too small characters
Improvisation 即興 e.g. Intelligence measurement e.g. Behaviour measurement
Environment 環境 e.g. Weather e.g. Lunch time
Empathy 共感
e.g. Complicated language e.g. economical background e.g. educational background
“Elementary my dear Fukuoka UX Study Group”
Basics definitions and common mistakes in research methodology74Collecting the data データーを集計 Research PROCESS
�20
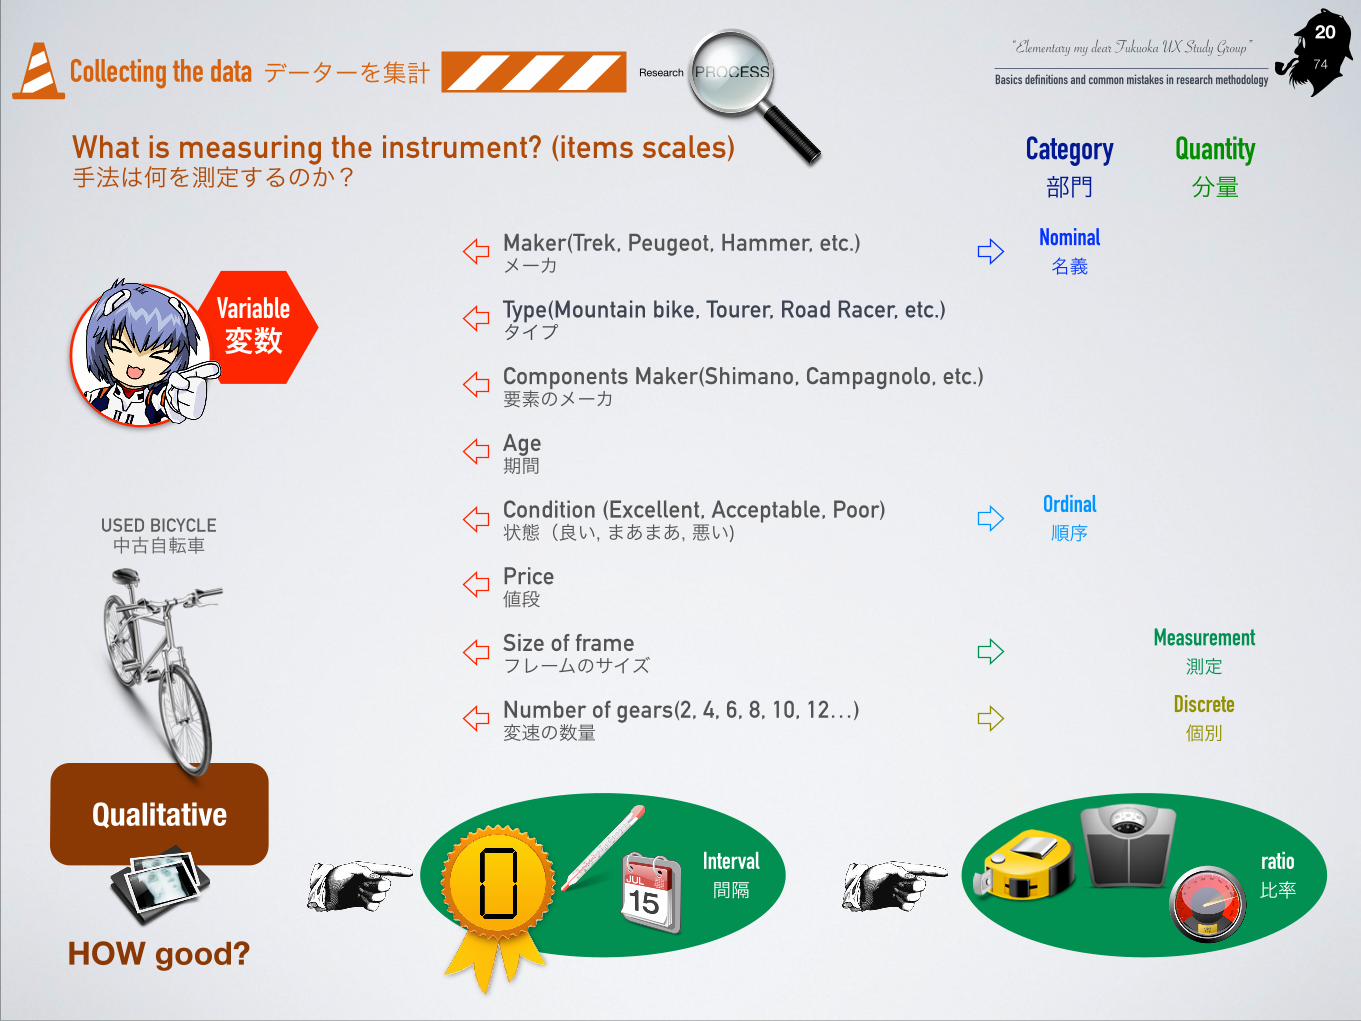
Category 部門
Quantity 分量
Interval 間隔
ratio 比率
Ordinal 順序
Measurement 測定
Discrete 個別
Type(Mountain bike, Tourer, Road Racer, etc.) タイプ
Components Maker(Shimano, Campagnolo, etc.) 要素のメーカ
Age 期間
Condition (Excellent, Acceptable, Poor) 状態(良い, まあまあ, 悪い)
Price 値段
Size of frame フレームのサイズ
Number of gears(2, 4, 6, 8, 10, 12…) 変速の数量
Maker(Trek, Peugeot, Hammer, etc.) メーカ
Nominal 名義
What is measuring the instrument? (items scales) 手法は何を測定するのか?
USED BICYCLE 中古自転車
Qualitative
HOW good?
Variable 変数

“Elementary my dear Fukuoka UX Study Group”
Basics definitions and common mistakes in research methodology74Collecting the data データーを集計 Research PROCESS
�21
Learned predisposition to react in favor or against to objects or symbols 態度は物がシンボルに対する賛成か反対かを反映する学習の偏向です。
attitude 態度
Quantitative 数量的
MEASUREMENT 態度測定Attitude measurement

“Elementary my dear Fukuoka UX Study Group”
Basics definitions and common mistakes in research methodology74Collecting the data データーを集計 Research PROCESS
�22
Quantitative 数量的
MEASUREMENT 態度測定Attitude measurement
Learned predisposition to react in favor or against to objects or symbols
!態度は物がシンボルに対する賛成か反対かを反映す
る学習の偏向です。
Attitudes are INDICATORS of conduct but NOT the conduct itself.
!態度は、行動ではなく、行動の指標です。
Attitudes are symptoms only. !
態度は兆候だけです。
?態度ATTITUDE
“Elementary my dear Fukuoka UX Study Group”
Basics definitions and common mistakes in research methodology74Collecting the data データーを集計 Research PROCESS
�23
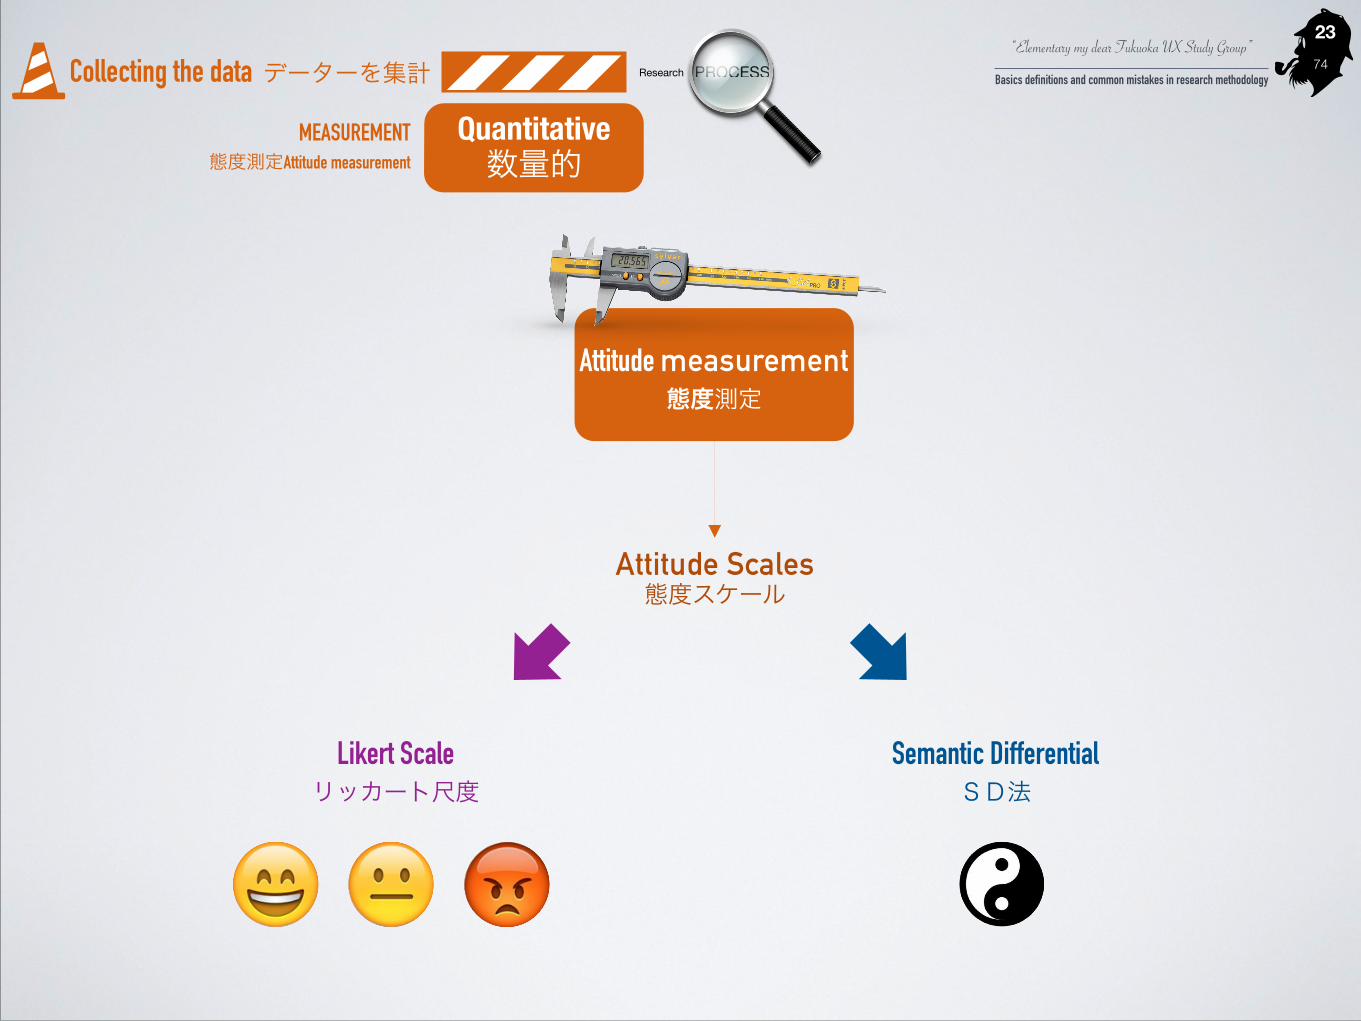
Quantitative 数量的
MEASUREMENT 態度測定Attitude measurement
Attitude measurement 態度測定
Attitude Scales 態度スケール
Semantic Differential SD法
Likert Scale リッカート尺度
“Elementary my dear Fukuoka UX Study Group”
Basics definitions and common mistakes in research methodology74Collecting the data データーを集計 Research PROCESS
�24
Quantitative 数量的
MEASUREMENT 態度測定Attitude measurement
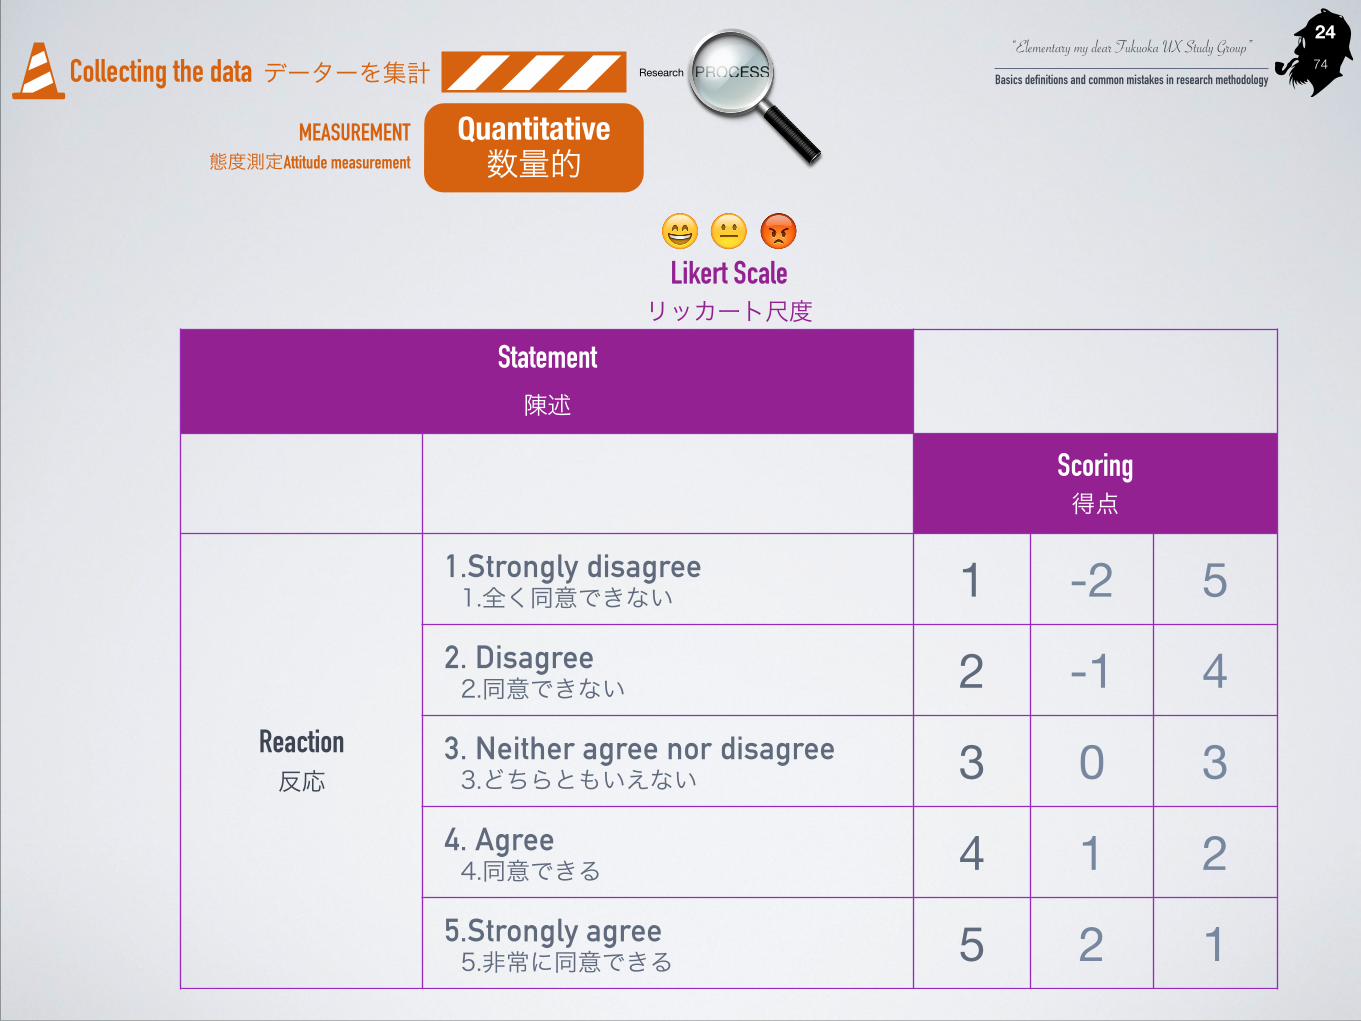
Statement
陳述
Scoring 得点
Reaction 反応
1.Strongly disagree 1.全く同意できない 1 -2 5
2. Disagree 2.同意できない 2 -1 4
3. Neither agree nor disagree 3.どちらともいえない 3 0 3
4. Agree 4.同意できる 4 1 2
5.Strongly agree 5.非常に同意できる 5 2 1
Likert Scale リッカート尺度

“Elementary my dear Fukuoka UX Study Group”
Basics definitions and common mistakes in research methodology74Collecting the data データーを集計 Research PROCESS
�25
Quantitative 数量的
MEASUREMENT 態度測定Attitude measurement
Variable 変数
Item アイテム
Category カテゴリー
Codes コード化
Column 列
What is being measured 何を測定するのか?
Statement 1 陳述1
1.Strongly disagree 1.全く同意できない 1
12. Disagree 2.同意できない 2
3. Neither agree nor disagree 3.どちらともいえない 3
4. Agree 4.同意できる 4
5.Strongly agree 5.非常に同意できる 5
Statement 2 陳述2
1.Strongly disagree 1.全く同意できない 1
22. Disagree 2.同意できない 2
3. Neither agree nor disagree 3.どちらともいえない 3
4. Agree 4.同意できる 4
5.Strongly agree 5.非常に同意できる 5
Statement n 陳述 n
1.Strongly disagree 1.全く同意できない 1
n2. Disagree 2.同意できない 2
3. Neither agree nor disagree 3.どちらともいえない 3
4. Agree 4.同意できる 4
5.Strongly agree 5.非常に同意できる 5
Codebook (Likert Scale) コードブック (リッカート尺度)

“Elementary my dear Fukuoka UX Study Group”
Basics definitions and common mistakes in research methodology74Collecting the data データーを集計 Research PROCESS
�26
Quantitative 数量的
MEASUREMENT 態度測定Attitude measurement
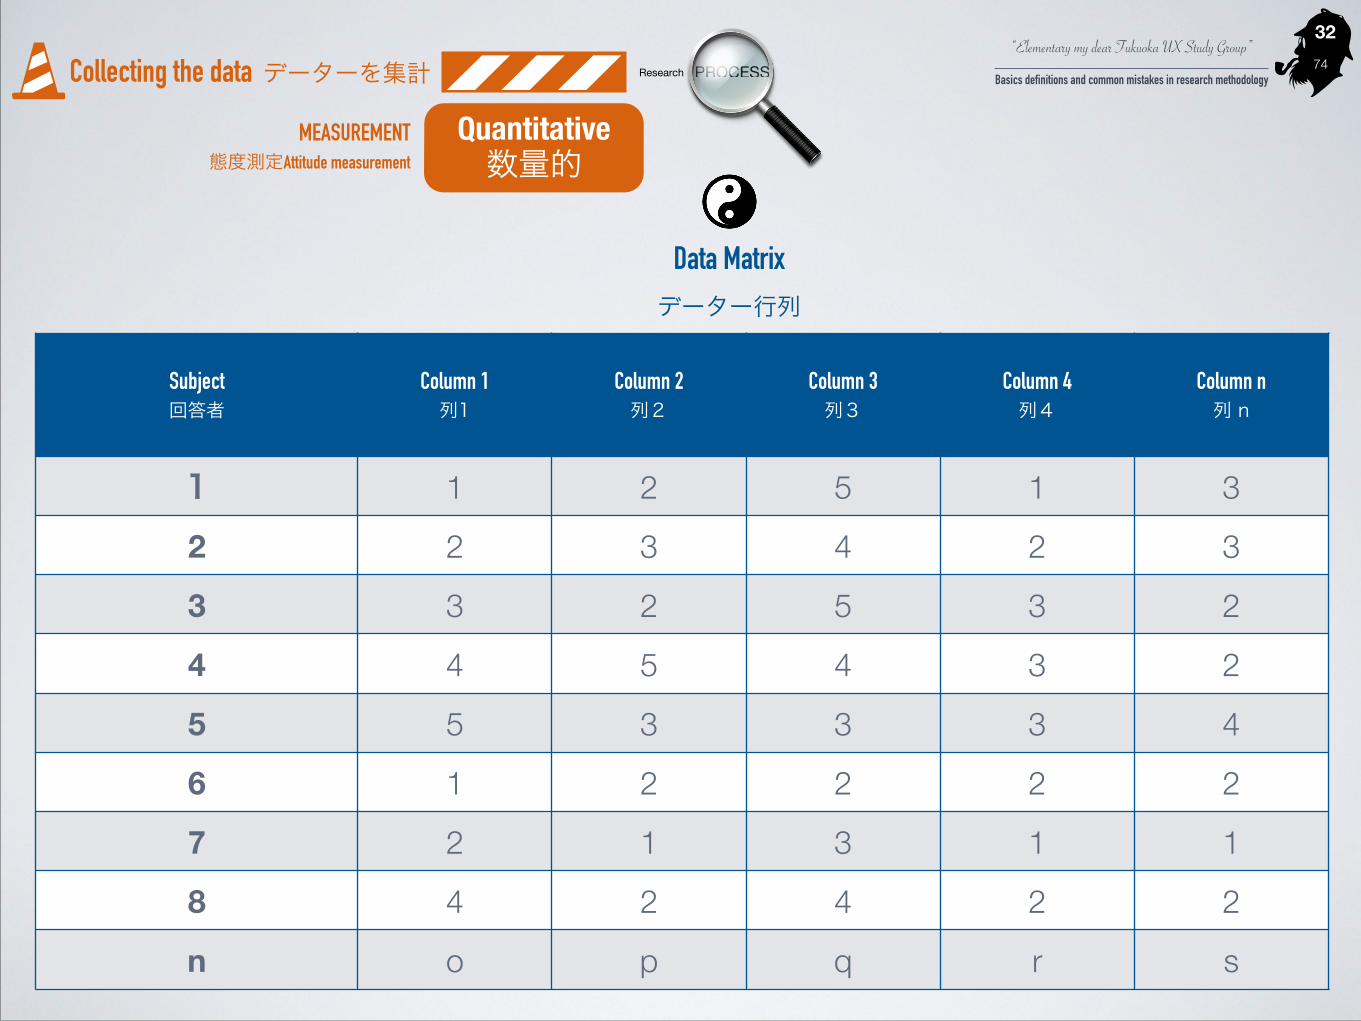
Data Matrix データー行列
Subject 回答者
Column 1 列1
Column 2 列2
Column 3 列3
Column 4 列4
Column n 列 n
1 1 2 5 1 3
2 2 3 4 2 3
3 3 2 5 3 2
4 4 5 4 3 2
5 5 3 3 3 4
6 1 2 2 2 2
7 2 1 3 1 1
8 4 2 4 2 2
n o p q r s

“Elementary my dear Fukuoka UX Study Group”
Basics definitions and common mistakes in research methodology74Collecting the data データーを集計 Research PROCESS
�27
Quantitative 数量的
MEASUREMENT 態度測定Attitude measurement
Subject回答者
Column 1列1
Column 2列2
Column 3列3
Column 4列4
Average平均
1 1 2 5 1 2.25
2 2 3 4 2 2.75
3 3 2 5 3 3.25
4 4 5 4 3 4
5 5 3 3 3 3.5
6 1 2 2 2 1.75
7 2 1 3 1 1.75
8 4 2 4 2 3
Level of Agreement (per Subject)
Agre
emen
t Lev
el
0
1
3
4
5
Subject 1 Subject 2 Subject 3 Subject 4 Subject 5 Subject 6 Subject 7 Subject 8
3
1.751.75
3.5
4
3.25
2.75
2.25
Column 1 Column 2 Column 3 Column 4 AverageSubject回答者
Column 1列1
Column 2列2
Column 3列3
Column 4列4
1 1 2 5 1
2 2 3 4 2
3 3 2 5 3
4 4 5 4 3
5 5 3 3 3
6 1 2 2 2
7 2 1 3 1
8 4 2 4 2
Average平均 2.75 2.5 3.75 2.125
Level of Agreement Average (per Statement)Ag
reem
ent L
evel
0
1
2
3
4
5
Statements
2.125
3.75
2.52.75
Column 1 Column 2 Column 3 Column 4
Likert Scale リッカート尺度

“Elementary my dear Fukuoka UX Study Group”
Basics definitions and common mistakes in research methodology74Collecting the data データーを集計 Research PROCESS
�28
Quantitative 数量的
MEASUREMENT 態度測定Attitude measurement
Likert Scale リッカート尺度
Percentage of Selections (Total)
30%
17%11%
23%
20%
1.Strongly disagree 2. Disagree 3. Neither agree nor disagree4. Agree 5.Strongly agree
Percentage of Selections (Statement 1)
18%
5%3%
50%
25%
1.Strongly disagree 2. Disagree 3. Neither agree nor disagree4. Agree 5.Strongly agree

“Elementary my dear Fukuoka UX Study Group”
Basics definitions and common mistakes in research methodology74Collecting the data データーを集計 Research PROCESS
�29
Quantitative 数量的
MEASUREMENT 態度測定Attitude measurement
Likert Scale リッカート尺度
Comparission of the Agreement Level Average and Best Possible Selection
Leve
l of A
gree
men
t
012345
Column 1 Column 2 Column 3 Column 4
Average Best Possible
5
3.75
2.52.752.75 2.5
3.75
5
Comparission of the Agreement Level for Each Statement (Number of selections)
Num
ber o
f Peo
ple
0
10
20
30
40
Statement 1 Statement 2 Statement 3 Statement 4 Statement 5 Statement 6
21
27
20
14
710
1
10107
2
20
21121
5
13
1
5
10
20
3
23
14
710
1.Strongly disagree 2. Disagree 3. Neither agree nor disagree 4. Agree5.Strongly agree
“Elementary my dear Fukuoka UX Study Group”
Basics definitions and common mistakes in research methodology74Collecting the data データーを集計 Research PROCESS
�30
Quantitative 数量的
MEASUREMENT 態度測定Attitude measurement
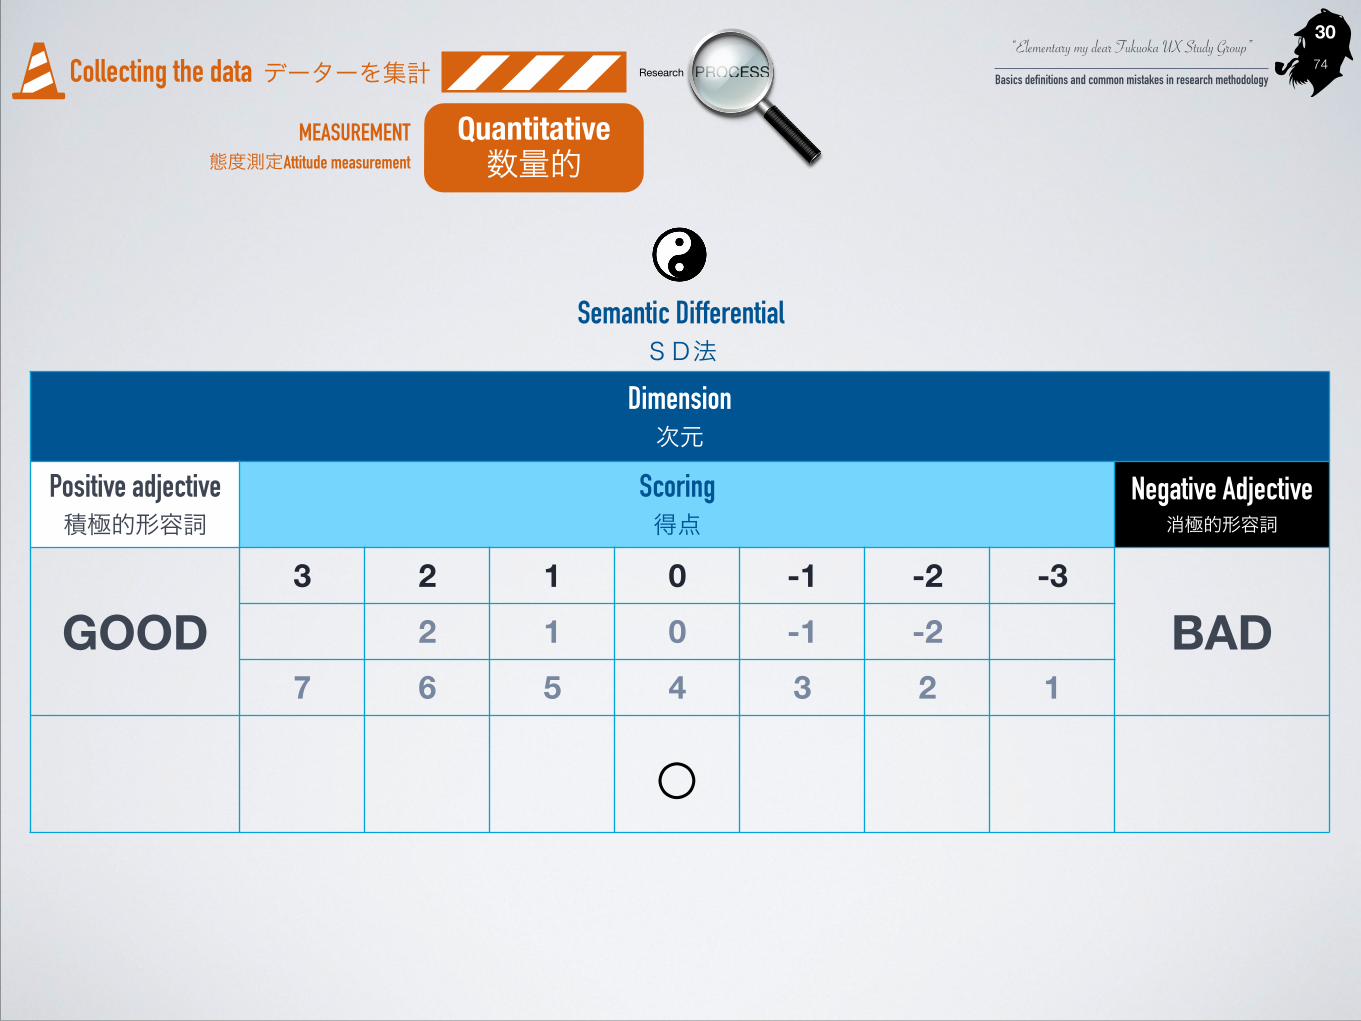
Dimension 次元
Positive adjective 積極的形容詞
Scoring 得点
Negative Adjective 消極的形容詞
GOOD3 2 1 0 -1 -2 -3
BAD2 1 0 -1 -27 6 5 4 3 2 1
○
Semantic Differential SD法

“Elementary my dear Fukuoka UX Study Group”
Basics definitions and common mistakes in research methodology74Collecting the data データーを集計 Research PROCESS
�31
Quantitative 数量的
MEASUREMENT 態度測定Attitude measurement
Dimension 次元
Bipolar Adjectives Pair 正反対的形容詞双
Codes コード化
Column 列
What is being measured 何を測定するのか?
Positive adjective 1 積極的形容詞1
Negative Adjective 1 消極的形容詞
2
11
0
-1
-2
Positive adjective 2 積極的形容詞2
Negative Adjective 2 消極的形容詞2
2
21
0
-1
-2
Positive adjective n 積極的形容詞 n
Negative Adjective n 消極的形容詞
2
n1
0
-1
-2
Codebook(Semantic Differential) コードブック (SD法)
“Elementary my dear Fukuoka UX Study Group”
Basics definitions and common mistakes in research methodology74Collecting the data データーを集計 Research PROCESS
�32
Quantitative 数量的
MEASUREMENT 態度測定Attitude measurement
Data Matrix データー行列
Subject 回答者
Column 1 列1
Column 2 列2
Column 3 列3
Column 4 列4
Column n 列 n
1 1 2 5 1 3
2 2 3 4 2 3
3 3 2 5 3 2
4 4 5 4 3 2
5 5 3 3 3 4
6 1 2 2 2 2
7 2 1 3 1 1
8 4 2 4 2 2
n o p q r s

“Elementary my dear Fukuoka UX Study Group”
Basics definitions and common mistakes in research methodology74Collecting the data データーを集計 Research PROCESS
�33
Quantitative 数量的
MEASUREMENT 態度測定Attitude measurement
Dimension 1 Dimension 2 Dimension 3 Dimension 4 Average
+ / - 1 4 1 3 1 2.25
+ / - 2 4 1 2 2 2.25
+ / - 3 4 1 3 3 2.75
+ / - 4 5 2 2 4 3.25
+ / - 5 3 3 2 4 3
+ / - 6 4 4 2 4 3.5
+ / - 7 2 5 2 4 3.25
+ / - 8 3 5 2 4 3.5
+ / - 9 4 5 2 4 3.75
+ / - 10 5 4 2 4 3.75
+ / - 11 3 3 3 3 3
+ / - 12 2 4 4 2 3
+ / - 13 3 3 5 2 3.25
+ / - 14 2 4 3 2 2.75
+ / - 15 2 3 2 2 2.25
+ / - 16 2 2 2 2 2
+ / - 17 3 1 3 1 2
+ / - 18 4 4 4 1 3.25
+ / - 19 3 5 5 1 3.5
+ / - 20 2 2 5 2 2.75
Semantic Differential SD法

“Elementary my dear Fukuoka UX Study Group”
Basics definitions and common mistakes in research methodology74Collecting the data データーを集計 Research PROCESS
�34
a set of questions about a certain variable 特定の変数についての質問のセット
questionnaire アンケート
Quantitative 数量的
MEASUREMENT アンケートQuestionnaire

“Elementary my dear Fukuoka UX Study Group”
Basics definitions and common mistakes in research methodology74Collecting the data データーを集計 Research PROCESS
�35
questionnaire アンケート
Quantitative 数量的
MEASUREMENT アンケートQuestionnaire
OPENCLOSEDANSWER 1
ANSWER 2
ANSWER 3
ANSWER 4
Delimited Categories or Alternatives of answers 限定するカテゴリーの自由な答えあるいは提供された選択
肢からの答え
“Elementary my dear Fukuoka UX Study Group”
Basics definitions and common mistakes in research methodology74Collecting the data データーを集計 Research PROCESS
�36
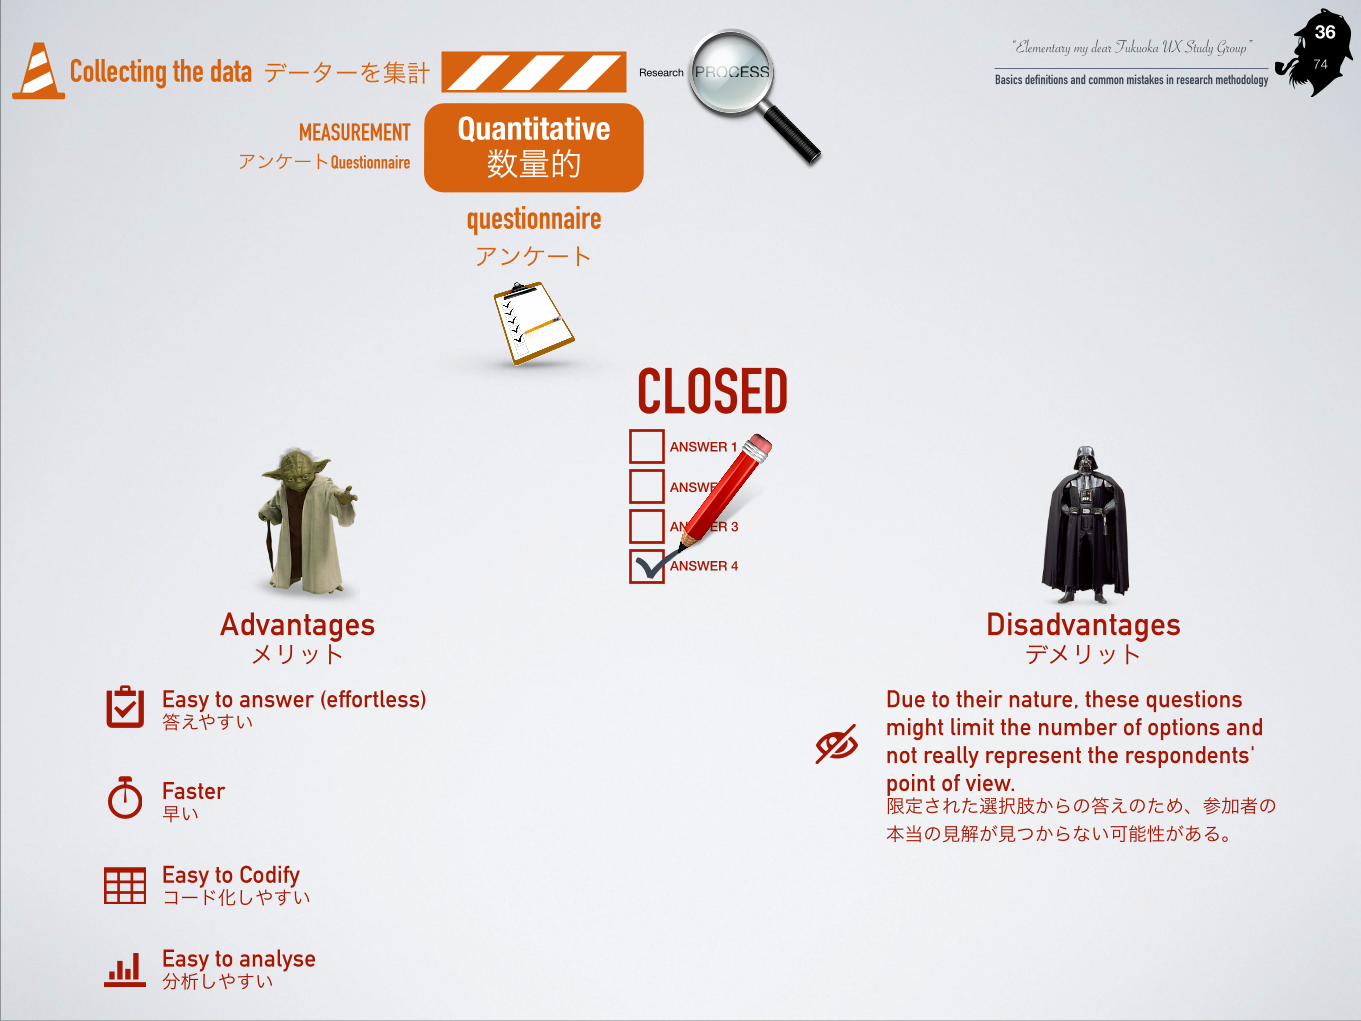
questionnaire アンケート
Quantitative 数量的
MEASUREMENT アンケートQuestionnaire
CLOSEDANSWER 1
ANSWER 2
ANSWER 3
ANSWER 4
Advantages メリット
Disadvantages デメリット
Easy to answer (effortless) 答えやすい !Faster 早い !Easy to Codify コード化しやすい !Easy to analyse 分析しやすい
Due to their nature, these questions might limit the number of options and not really represent the respondents' point of view. 限定された選択肢からの答えのため、参加者の本当の見解が見つからない可能性がある。

“Elementary my dear Fukuoka UX Study Group”
Basics definitions and common mistakes in research methodology74Collecting the data データーを集計 Research PROCESS
�37
questionnaire アンケート
Quantitative 数量的
MEASUREMENT アンケートQuestionnaire
OPEN
Advantages メリット
Disadvantages デメリット
These questions allow the gathering of more detailed data about the measured topic これらの質問は、測定されたトピックに関するより詳細なデータの収集を可能にする
Slower 遅い !Difficult to Codify コード化しづらい !Difficult to analyse 分析しづらい

“Elementary my dear Fukuoka UX Study Group”
Basics definitions and common mistakes in research methodology74Collecting the data データーを集計 Research PROCESS
�38
Quantitative 数量的
MEASUREMENT アンケートQuestionnaire
OPEN
Questions must… 質問は必ず…
questionnaire アンケート
CLOSEDANSWER 1
ANSWER 2
ANSWER 3
ANSWER 4
!BE Clear and Easy to understand わかりやすい、理解しやすい !NOT be uncomfortable or disturbing 不快なことは与えない !BE oriented toward a UNIQUE logical aspect. 固有の論理の側面に行 !NOT contain the answers or elements which negate the free will of the respondent 全く自由意志否定ません !Be according to the social, cultural, and intellectual characteristics of the respondent 回答者の社会的・文化的・知的特性に応じたこと !NOT express ideas supported by institutions, organisations, or groups. 組織やグループなどの考えを表現しない !Include clear and easy to understand INSTRUCTIONS. わかりやすい、理解しやすい説明があり
“Elementary my dear Fukuoka UX Study Group”
Basics definitions and common mistakes in research methodology74Collecting the data データーを集計 Research PROCESS
�39
Quantitative 数量的
MEASUREMENT アンケートQuestionnaire
OPEN
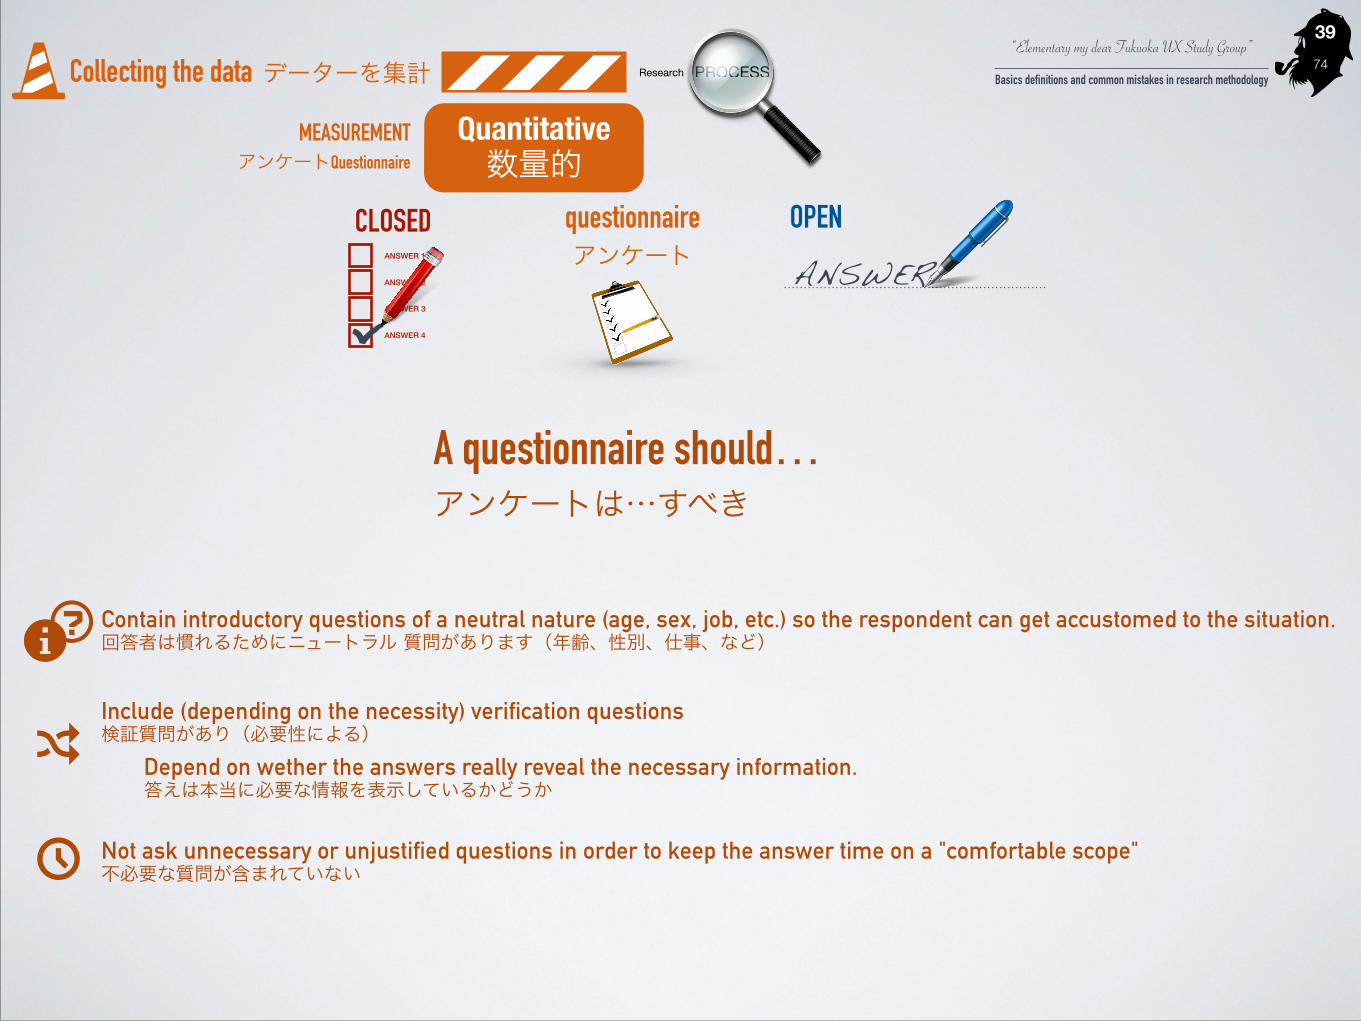
A questionnaire should… アンケートは…すべき
questionnaire アンケート
CLOSEDANSWER 1
ANSWER 2
ANSWER 3
ANSWER 4
Contain introductory questions of a neutral nature (age, sex, job, etc.) so the respondent can get accustomed to the situation. 回答者は慣れるためにニュートラル 質問があります(年齢、性別、仕事、など) !Include (depending on the necessity) verification questions 検証質問があり(必要性による)
Depend on wether the answers really reveal the necessary information. 答えは本当に必要な情報を表示しているかどうか
!Not ask unnecessary or unjustified questions in order to keep the answer time on a "comfortable scope" 不必要な質問が含まれていない

“Elementary my dear Fukuoka UX Study Group”
Basics definitions and common mistakes in research methodology74Collecting the data データーを集計 Research PROCESS
�40
Category 部門
Quantity 分量
Interval 間隔
ratio 比率
Ordinal 順序
Measurement 測定
Discrete 個別
Type(Mountain bike, Tourer, Road Racer, etc.) タイプ
Components Maker(Shimano, Campagnolo, etc.) 要素のメーカ
Age 期間
Condition (Excellent, Acceptable, Poor) 状態(良い, まあまあ, 悪い)
Price 値段
Size of frame フレームのサイズ
Number of gears(2, 4, 6, 8, 10, 12…) 変速の数量
Maker(Trek, Peugeot, Hammer, etc.) メーカ
Nominal 名義
What is measuring the instrument? (items scales) 手法は何を測定するのか?
USED BICYCLE 中古自転車
Qualitative
HOW good?
Variable 変数
“Elementary my dear Fukuoka UX Study Group”
Basics definitions and common mistakes in research methodology74Analysis of data データーを分析 Research PROCESS
�41
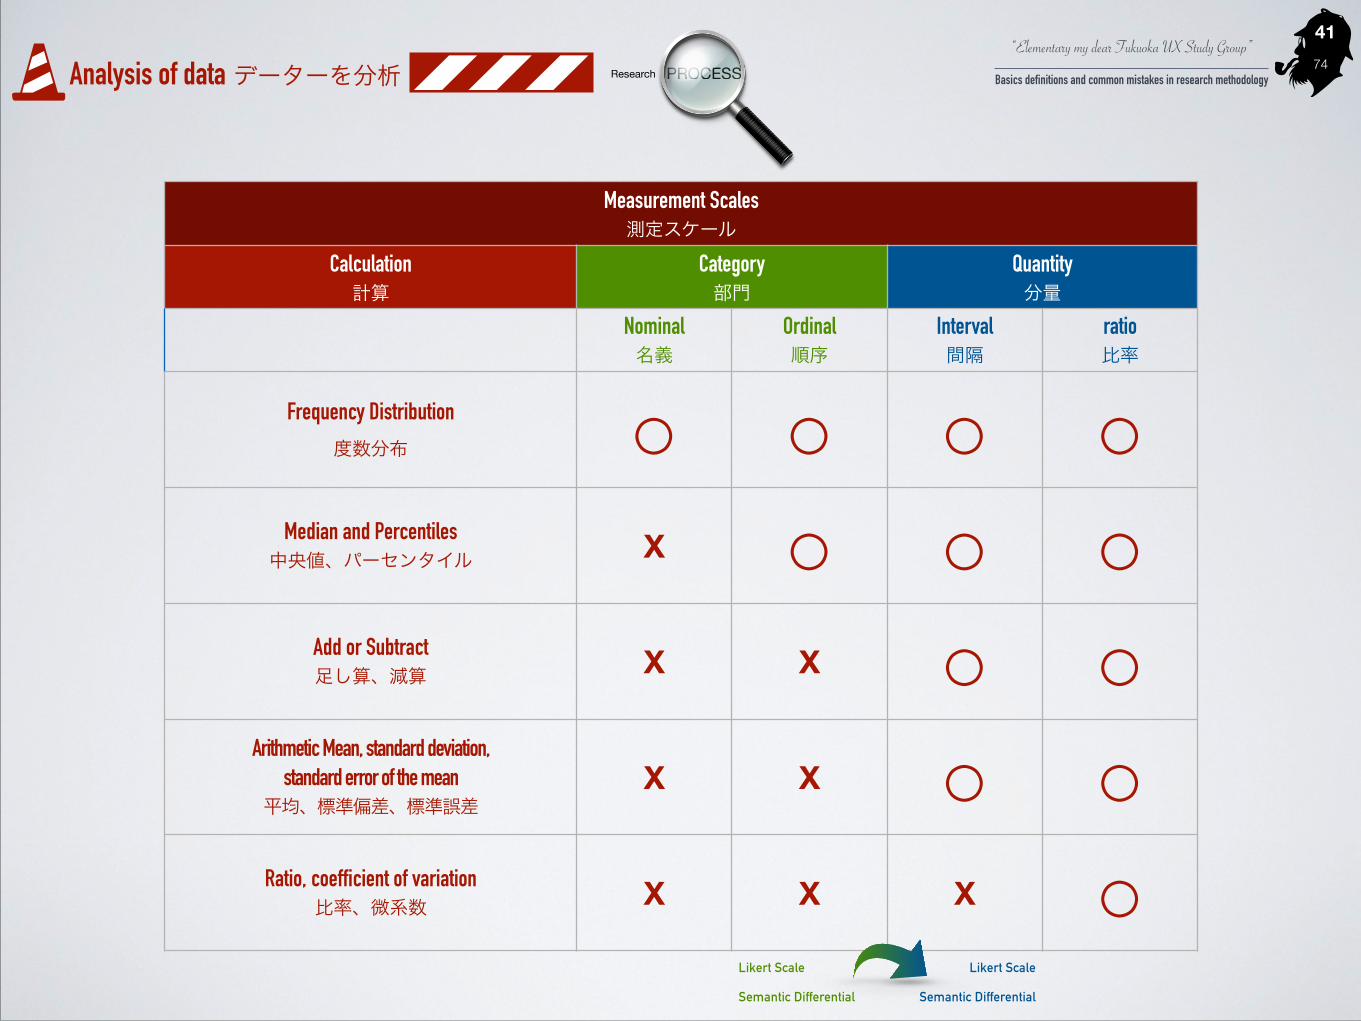
Measurement Scales 測定スケール
Calculation 計算
Category 部門
Quantity 分量
Nominal 名義
Ordinal 順序
Interval 間隔
ratio 比率
Frequency Distribution
度数分布 ○ ○ ○ ○Median and Percentiles 中央値、パーセンタイル X ○ ○ ○
Add or Subtract 足し算、減算 X X ○ ○
Arithmetic Mean, standard deviation, standard error of the mean
平均、標準偏差、標準誤差X X ○ ○
Ratio, coefficient of variation 比率、微系数 X X X ○
Likert Scale !Semantic Differential
Likert Scale !Semantic Differential

“Elementary my dear Fukuoka UX Study Group”
Basics definitions and common mistakes in research methodology74Analysis of data データーを分析 Research PROCESS
�42
age 年齢
gender 性別
income 給料
health 健康
Cross-Breaks | Cross-Tabulations クロス集計

“Elementary my dear Fukuoka UX Study Group”
Basics definitions and common mistakes in research methodology74Analysis of data データーを分析 Research PROCESS
�43
“Statistical Thinking” 統計的な考え

“Elementary my dear Fukuoka UX Study Group”
Basics definitions and common mistakes in research methodology74Analysis of data データーを分析 Research PROCESS
�44
Summarising our experience so that we and other people can understand its essential features. 皆が分かるために我々の経験をまとめます !Using the summary to make estimates or predictions about what is likely to be the case in other (perhaps future) situations. 未来を予測するためにその経験を使います
2010 18歳
2011 19歳
2012 20歳
2013 21歳 ?

“Elementary my dear Fukuoka UX Study Group”
Basics definitions and common mistakes in research methodology74Analysis of data データーを分析 Research PROCESS
�45
Statistics 統計
A set of methods used to collect or process or interpret quantitative data. 統計とは数量的なデータを集計し、手順を整理する及び判断する手法。
Descriptive Statistics 要約統計量Methods to summarise or describe our observations
Inferential Statistics 推計統計量Using those observations as a basis for making estimates or predictions, i.e. inferences about a situation that has not been observed.

“Elementary my dear Fukuoka UX Study Group”
Basics definitions and common mistakes in research methodology74Analysis of data データーを分析 Research PROCESS
�46
Population 母集団 !Refers to ALL the finite or infinite collection of items under consideration. 母集団とは、調査対象のとなる数値,属性等の源となる集合全体を意味する。
Representatively generalise from a Sample to the population 標本は母集団を代表する
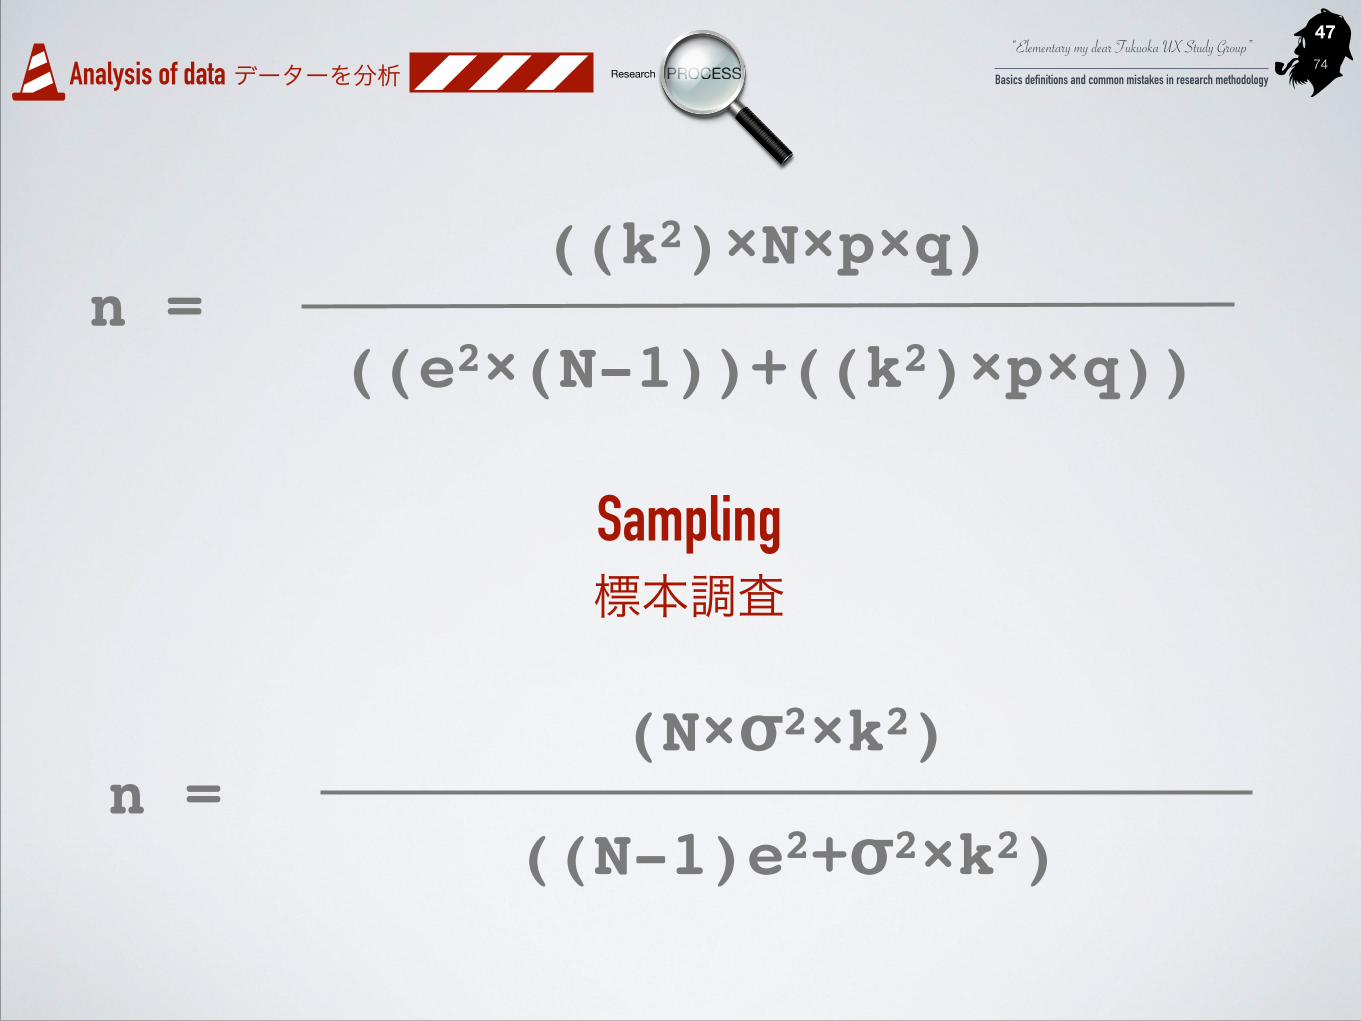
Sampling 標本調査
Sample 標本 !A portion from a population 標本とは、母集団の部分集合のこと
“Elementary my dear Fukuoka UX Study Group”
Basics definitions and common mistakes in research methodology74Analysis of data データーを分析 Research PROCESS
�47
Sampling 標本調査
n =((e2×(N-1))+((k2)×p×q))
((k2)×N×p×q)
n =((N-1)e2+σ2×k2)
(N×σ2×k2)
“Elementary my dear Fukuoka UX Study Group”
Basics definitions and common mistakes in research methodology74Analysis of data データーを分析 Research PROCESS
�48
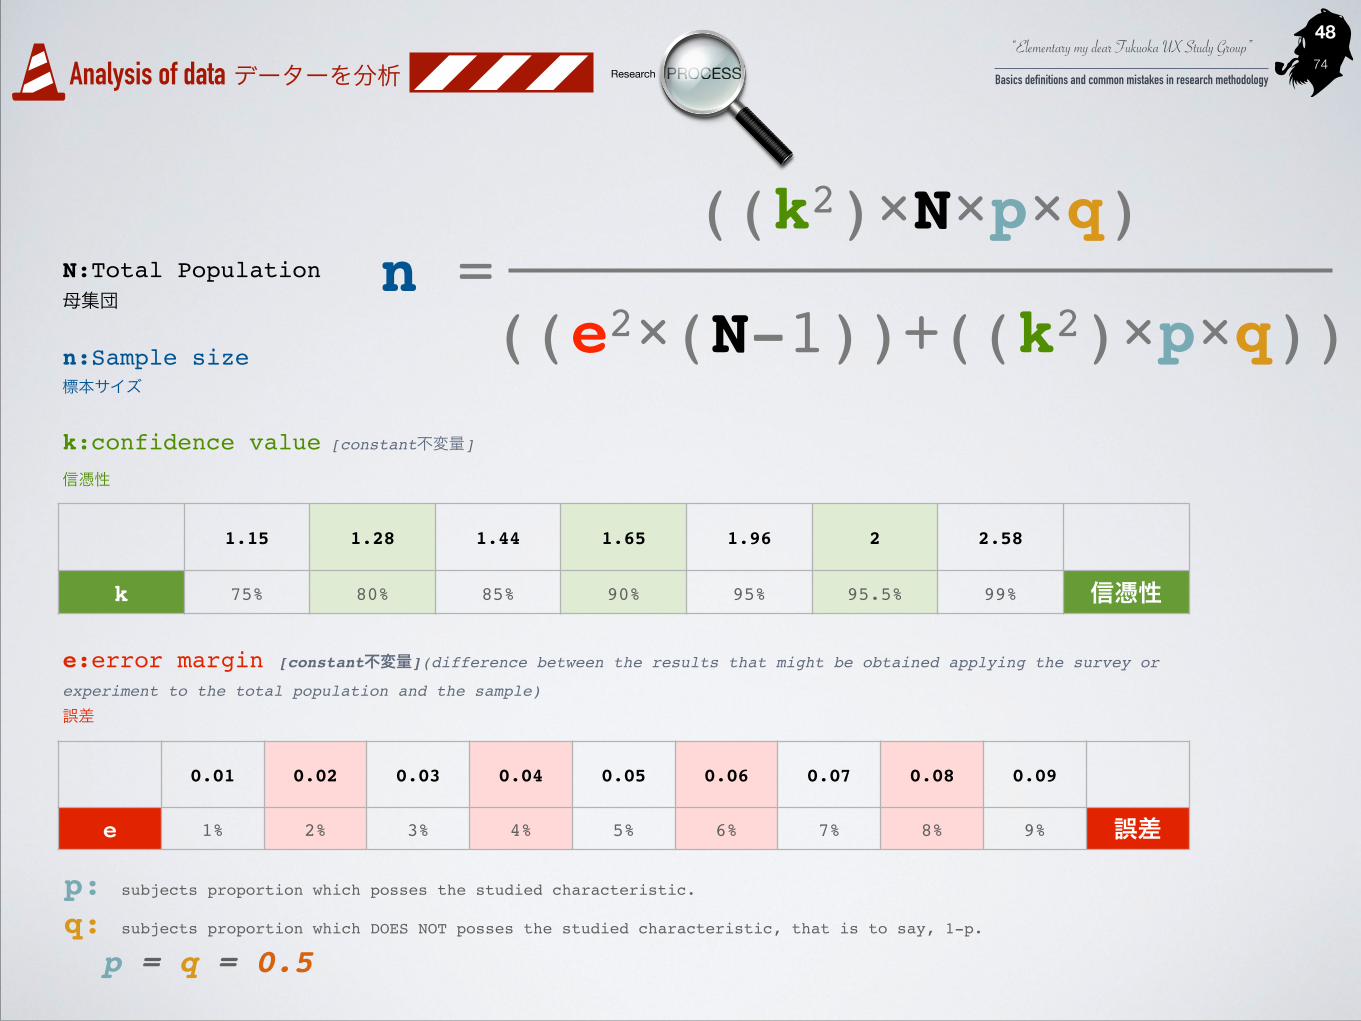
p: subjects proportion which posses the studied characteristic.!
q: subjects proportion which DOES NOT posses the studied characteristic, that is to say, 1-p.! p = q = 0.5
k:confidence value [constant不変量]!
信憑性
1.15 1.28 1.44 1.65 1.96 2 2.58
k 75% 80% 85% 90% 95% 95.5% 99% 信憑性
0.01 0.02 0.03 0.04 0.05 0.06 0.07 0.08 0.09
e 1% 2% 3% 4% 5% 6% 7% 8% 9% 誤差
e:error margin [constant不変量](difference between the results that might be obtained applying the survey or experiment to the total population and the sample)!誤差
N:Total Population"母集団
n:Sample size"標本サイズ
n =((e2×(N-1))+((k2)×p×q))
((k2)×N×p×q)
“Elementary my dear Fukuoka UX Study Group”
Basics definitions and common mistakes in research methodology74Analysis of data データーを分析 Research PROCESS
�49
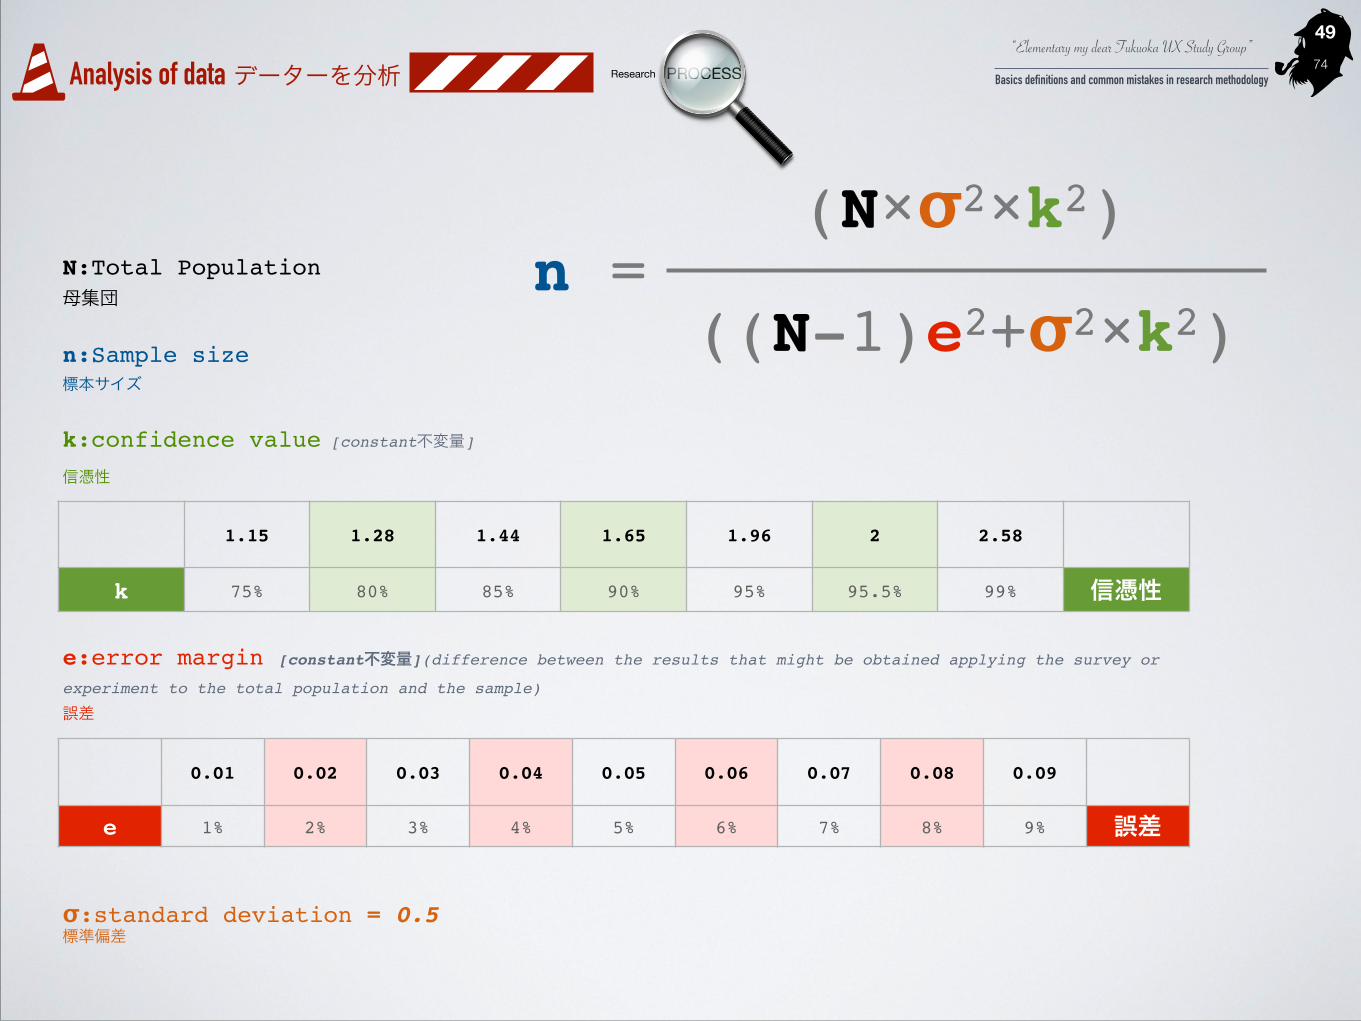
k:confidence value [constant不変量]!
信憑性
1.15 1.28 1.44 1.65 1.96 2 2.58
k 75% 80% 85% 90% 95% 95.5% 99% 信憑性
0.01 0.02 0.03 0.04 0.05 0.06 0.07 0.08 0.09
e 1% 2% 3% 4% 5% 6% 7% 8% 9% 誤差
e:error margin [constant不変量](difference between the results that might be obtained applying the survey or experiment to the total population and the sample)!誤差
N:Total Population"母集団
n:Sample size"標本サイズ
n =((N-1)e2+σ2×k2)
(N×σ2×k2)
σ:standard deviation = 0.5!標準偏差
“Elementary my dear Fukuoka UX Study Group”
Basics definitions and common mistakes in research methodology74Analysis of data データーを分析 Research PROCESS
�50
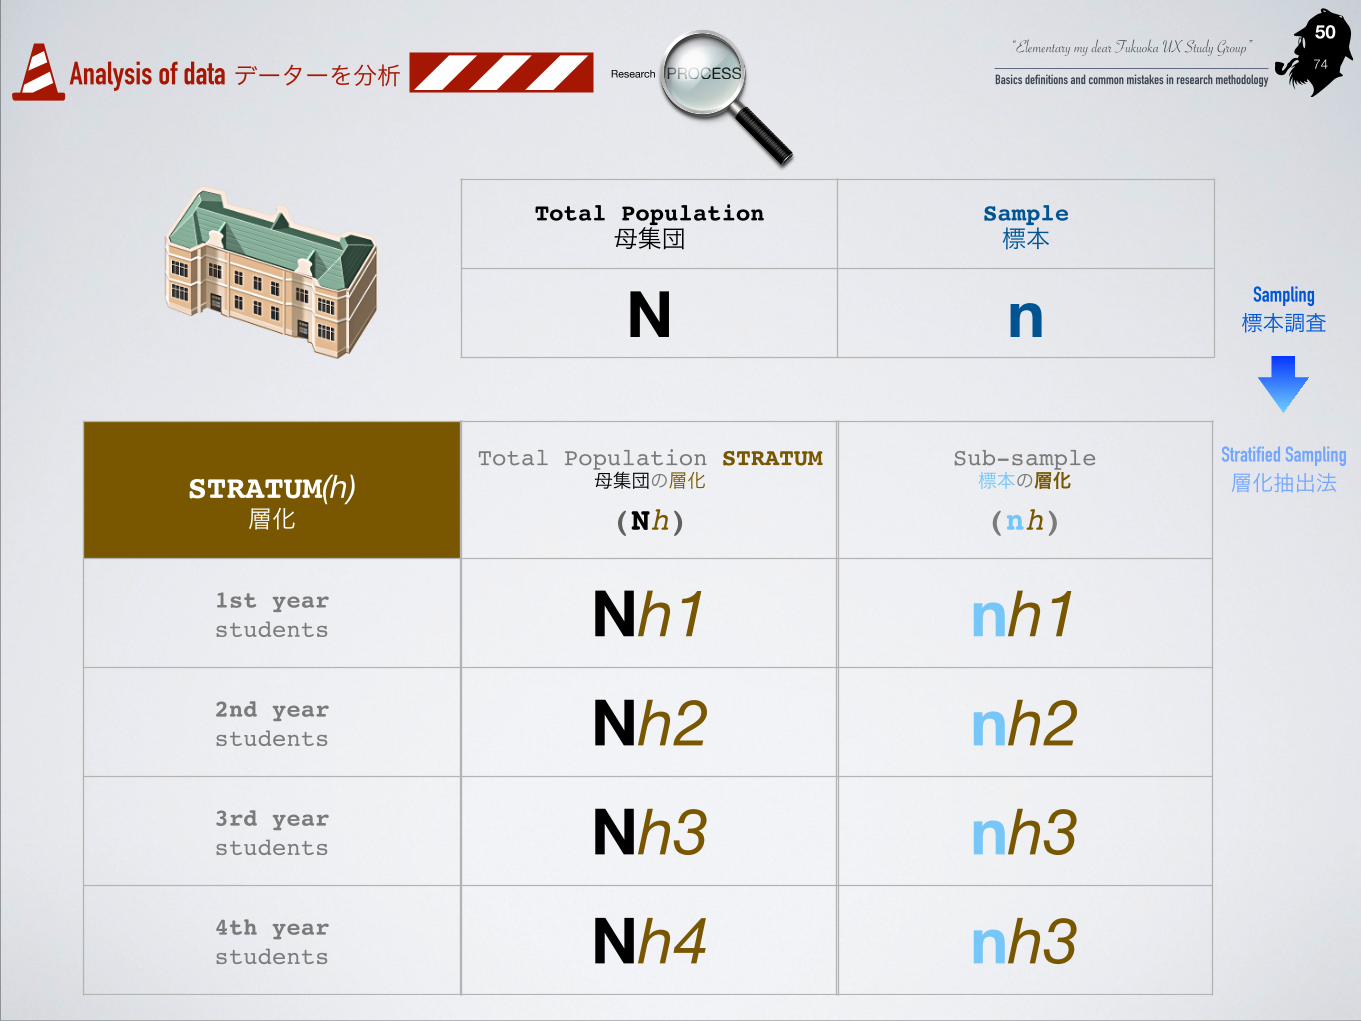
!STRATUM(h)
層化
1st year"students
2nd year"students
3rd year"students
4th year"students
Sampling 標本調査
Stratified Sampling 層化抽出法
Total Population"母集団
Sample"標本
N n
Total Population STRATUM!母集団の層化"
(Nh)
Nh1Nh2Nh3Nh4
Sub-sample!標本の層化"
(nh)
nh1nh2nh3nh3
“Elementary my dear Fukuoka UX Study Group”
Basics definitions and common mistakes in research methodology74Analysis of data データーを分析 Research PROCESS
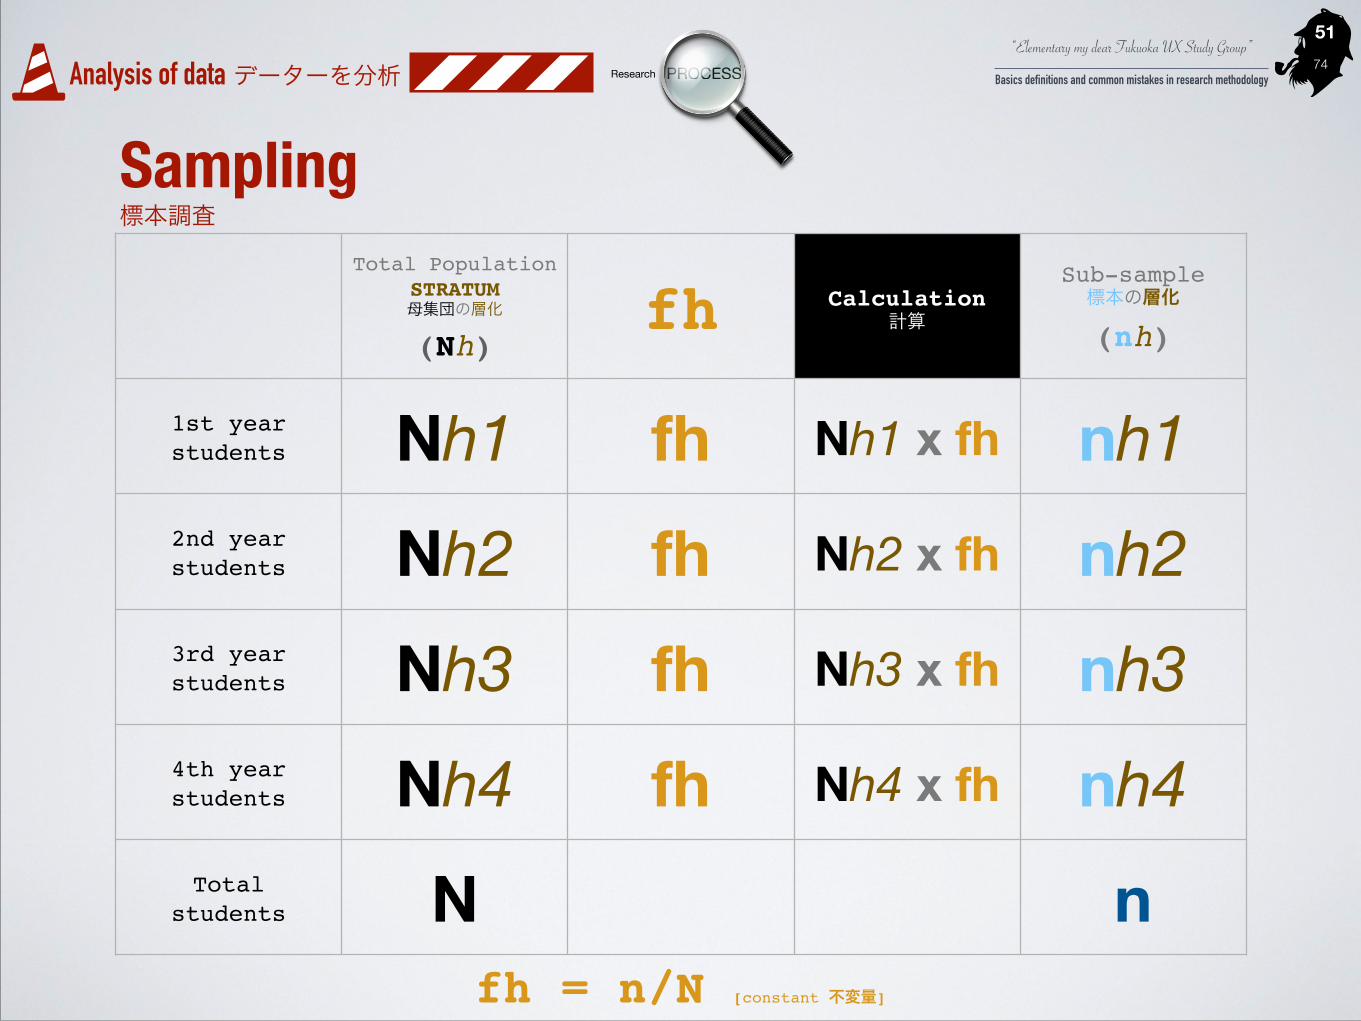
�51
fh = n/N [constant 不変量]
Total Population STRATUM!母集団の層化"
(Nh)fh Calculation"
計算
Sub-sample!標本の層化"
(nh)
1st year!students Nh1 fh Nh1 x fh nh12nd year!students Nh2 fh Nh2 x fh nh23rd year!students Nh3 fh Nh3 x fh nh34th year!students Nh4 fh Nh4 x fh nh4Total!
students N n
Sampling 標本調査

“Elementary my dear Fukuoka UX Study Group”
Basics definitions and common mistakes in research methodology74Analysis of data データーを分析 Research PROCESS
�52
Every item has the same chance of being selected 各アイテムが選ばれる可能性は同じ
I = N/n
Random ランダム
Systematic 体制的
I:Approximate integer!近似整数!
N:Total Population!母集団!
n:Sample size"標本サイズ
Sampling 標本調査

“Elementary my dear Fukuoka UX Study Group”
Basics definitions and common mistakes in research methodology74Analysis of data データーを分析 Research PROCESS
�53
Every important characteristic of the population is likely to have one or more
representative in the sample
?
The probability that a one-time-in-twenty phenomenon will not appear
at all in a simple random sample of size 60 is 0.46
Representatively generalise from a Sample to the population 標本は母集団を代表する
Sampling 標本調査
“Elementary my dear Fukuoka UX Study Group”
Basics definitions and common mistakes in research methodology74Analysis of data データーを分析 Research PROCESS
�54
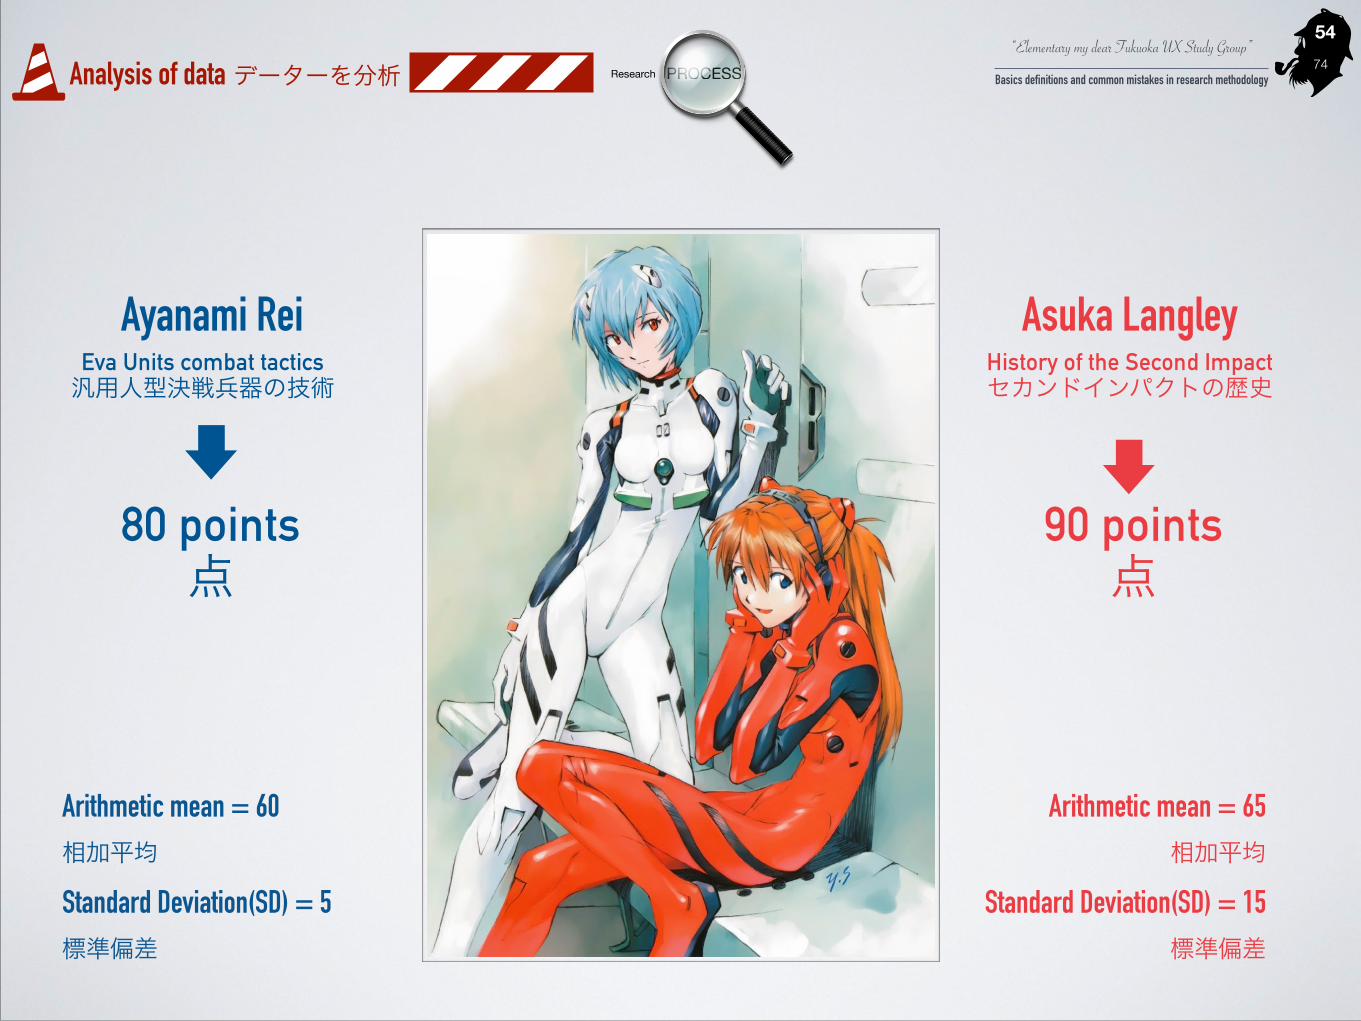
Asuka LangleyAyanami Rei
80 points 点
Eva Units combat tactics 汎用人型決戦兵器の技術
History of the Second Impact セカンドインパクトの歴史
Standard Deviation(SD) = 5 標準偏差
Arithmetic mean = 60 相加平均
90 points 点
Standard Deviation(SD) = 15 標準偏差
Arithmetic mean = 65 相加平均
“Elementary my dear Fukuoka UX Study Group”
Basics definitions and common mistakes in research methodology74Analysis of data データーを分析 Research PROCESS
�55
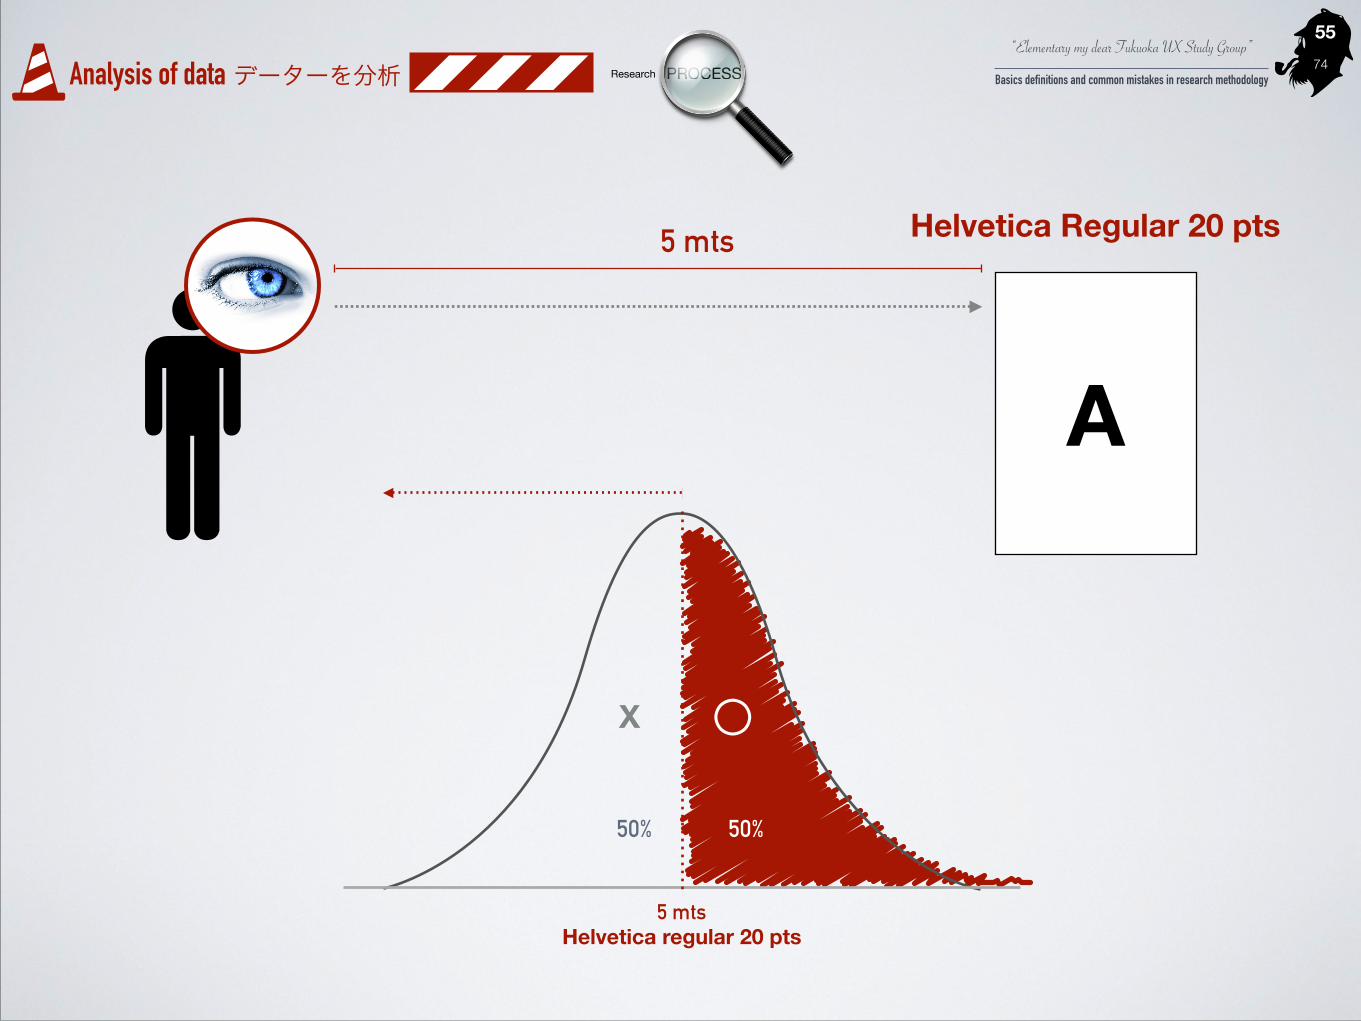
A
Helvetica Regular 20 pts5 mts
5 mts Helvetica regular 20 pts
50% 50%
○X

“Elementary my dear Fukuoka UX Study Group”
Basics definitions and common mistakes in research methodology74Analysis of data データーを分析 Research PROCESS
�56
A
Helvetica Regular 20 pts5 mts
2.35% 0.15%
M-1SD +1SD
34% 34%13.5% 13.5%2.35%0.15%
-2SD-3SD +2SD +3SD
68%
95%99.7%
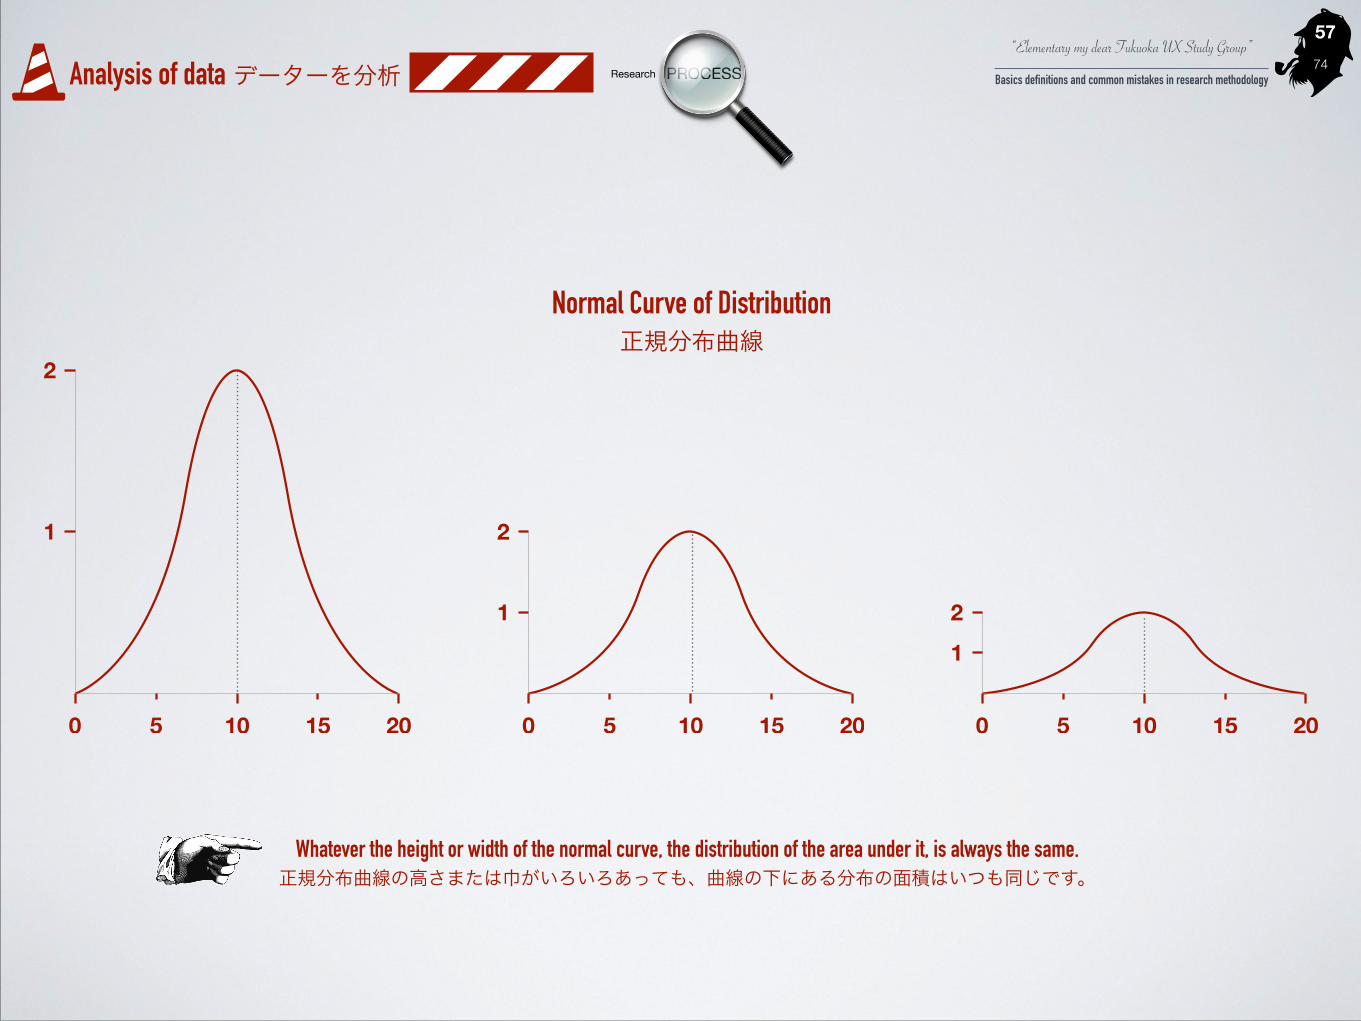
Normal Curve of Distribution 正規分布曲線
“Elementary my dear Fukuoka UX Study Group”
Basics definitions and common mistakes in research methodology74Analysis of data データーを分析 Research PROCESS
�57
Whatever the height or width of the normal curve, the distribution of the area under it, is always the same. 正規分布曲線の高さまたは巾がいろいろあっても、曲線の下にある分布の面積はいつも同じです。
Normal Curve of Distribution 正規分布曲線

“Elementary my dear Fukuoka UX Study Group”
Basics definitions and common mistakes in research methodology74Analysis of data データーを分析 Research PROCESS
89 68 92 74 76 65 77 83 75 87
85 64 79 77 96 80 70 85 80 80
82 81 86 71 90 87 71 72 62 78
77 90 83 81 73 80 78 81 81 75
82 88 79 79 94 82 66 78 74 72
�58
Pulse-rate (beats per minute) of 50 students 50人学生の心拍数
Cross-Breaks | Cross-Tabulations クロス集計
Look for patterns! パターンを探そう!
“Elementary my dear Fukuoka UX Study Group”
Basics definitions and common mistakes in research methodology74Analysis of data データーを分析 Research PROCESS
�59
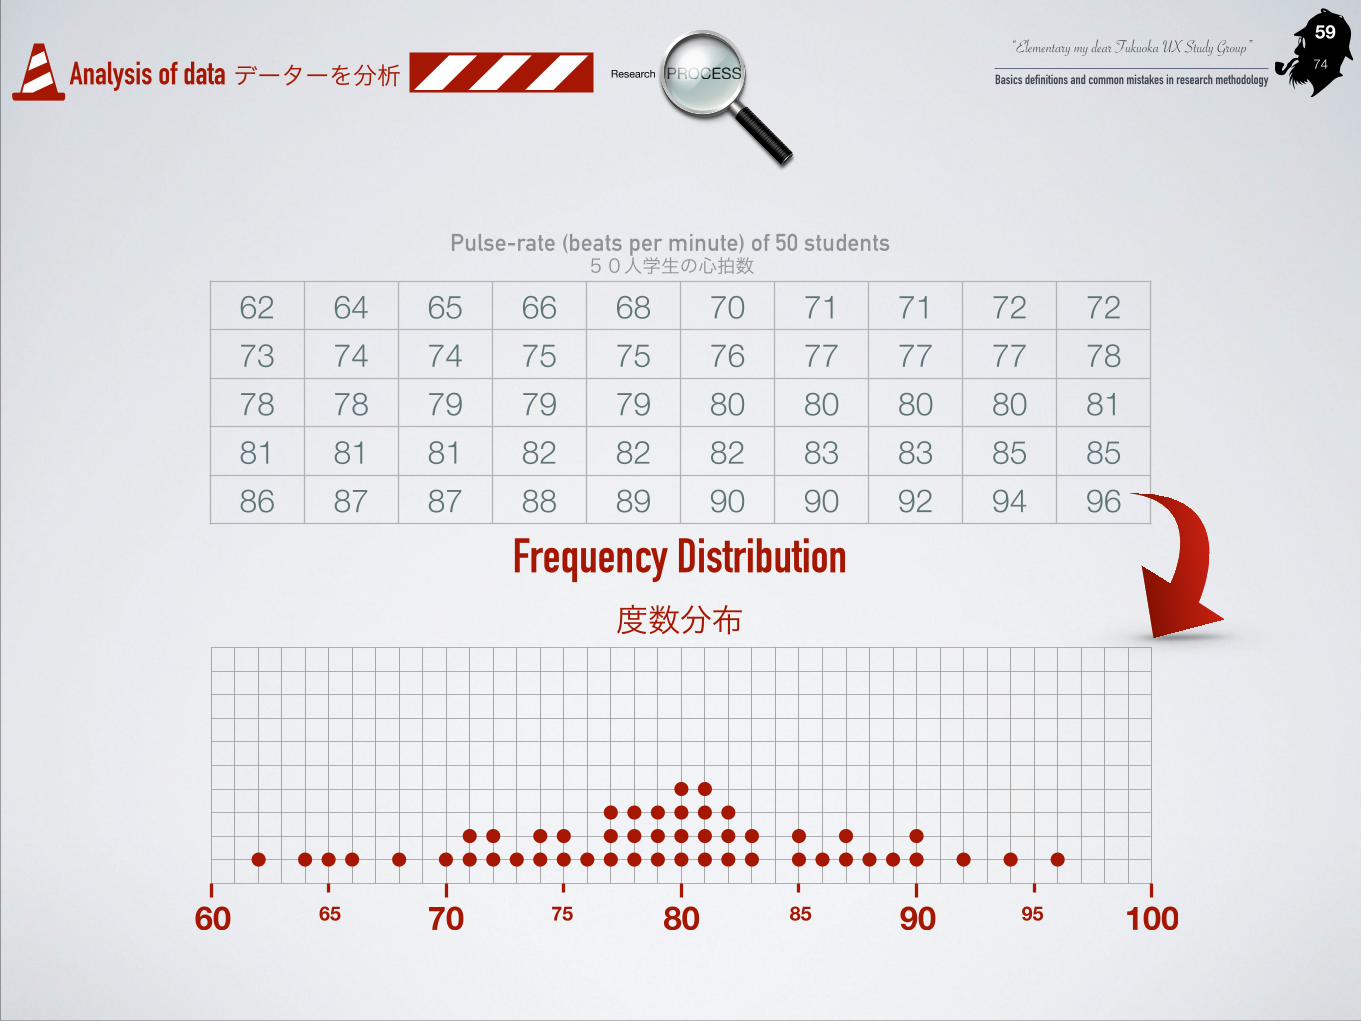
62 64 65 66 68 70 71 71 72 7273 74 74 75 75 76 77 77 77 7878 78 79 79 79 80 80 80 80 8181 81 81 82 82 82 83 83 85 8586 87 87 88 89 90 90 92 94 96
Pulse-rate (beats per minute) of 50 students 50人学生の心拍数
Frequency Distribution 度数分布
“Elementary my dear Fukuoka UX Study Group”
Basics definitions and common mistakes in research methodology74Analysis of data データーを分析 Research PROCESS
�60
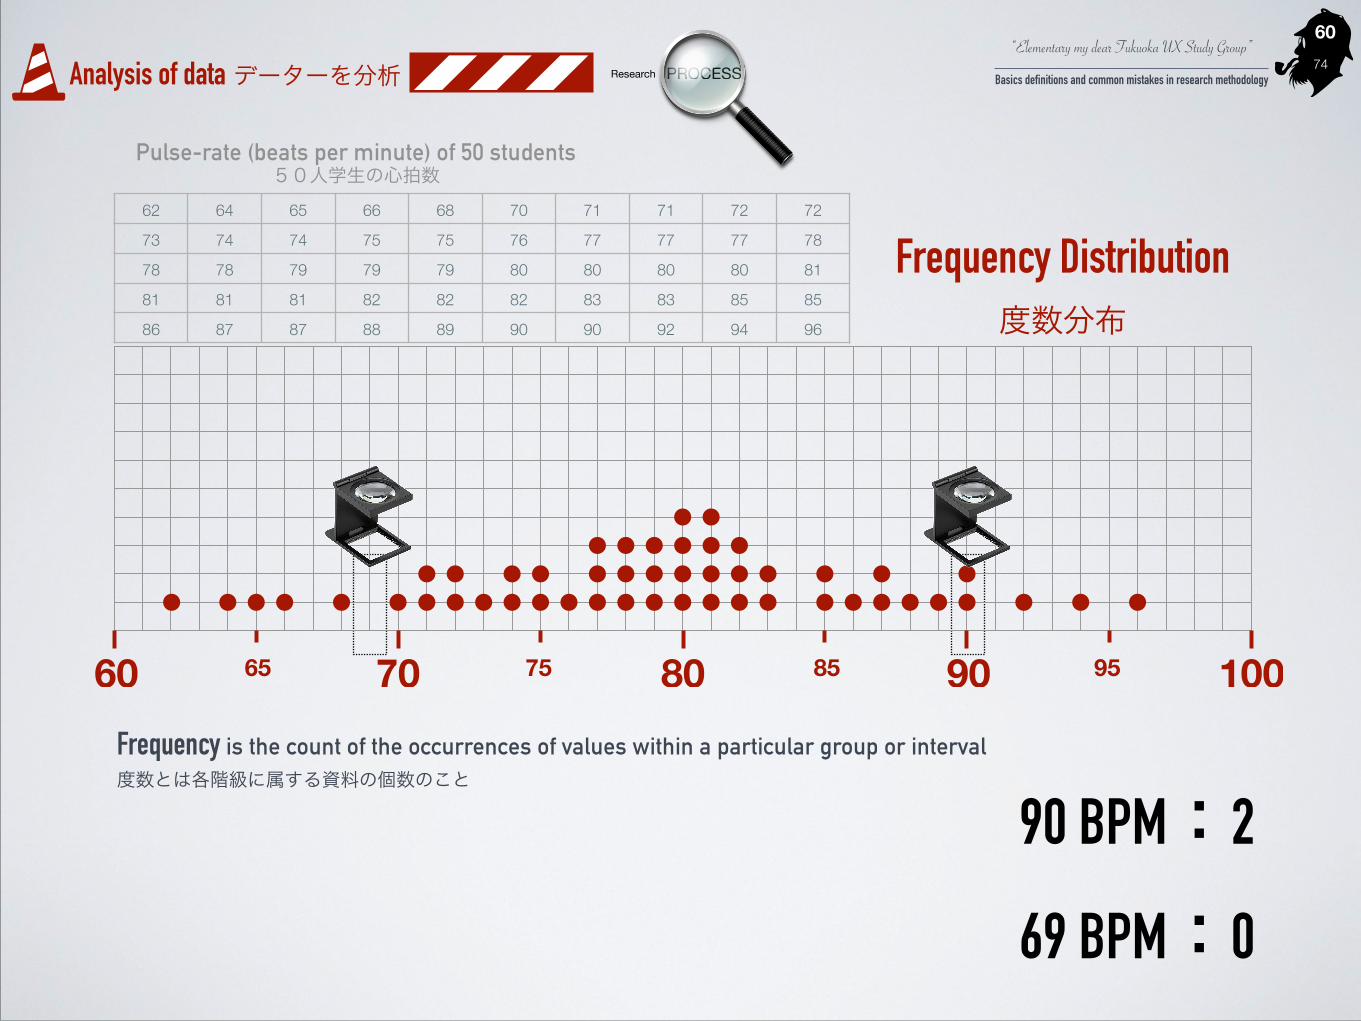
62 64 65 66 68 70 71 71 72 72
73 74 74 75 75 76 77 77 77 78
78 78 79 79 79 80 80 80 80 81
81 81 81 82 82 82 83 83 85 85
86 87 87 88 89 90 90 92 94 96
90 BPM:2
69 BPM:0
Frequency is the count of the occurrences of values within a particular group or interval 度数とは各階級に属する資料の個数のこと
Pulse-rate (beats per minute) of 50 students 50人学生の心拍数
Frequency Distribution 度数分布

“Elementary my dear Fukuoka UX Study Group”
Basics definitions and common mistakes in research methodology74Analysis of data データーを分析 Research PROCESS
�61
Pulse-rate 心拍数
Nº students 学生人数
60-64 265-69 370-74 875-79 12
80-84 13
85-89 7
90-94 495-99 1
50
Grouped Frequency Distribution
グループ化された度数分布
Gro
uped
Fre
quen
cy d
istrib
utio
n 度数(各グループの人数)
0
4
7
11
14
Pulse-rate 心拍数(BPM)62 67 72 77 82 87 92 97 102
01
4
7
1312
8
32
60-64 65-69 70-74 75-79 80-84 85-89 90-94 95-99
62 64 65 66 68 70 71 71 72 72
73 74 74 75 75 76 77 77 77 78
78 78 79 79 79 80 80 80 80 81
81 81 81 82 82 82 83 83 85 85
86 87 87 88 89 90 90 92 94 96Arithmetic mean = 79.1
相加平均Median = 79.5
中央値Range = 34
レンジMode = 80-81
最頻値
Modal Class = 80-84
最頻値的なクラス
Central Tendency 中心傾向
Statistical Dispersion 統計的ばらつき
Pulse-rate (beats per minute) of 50 students 50人学生の心拍数
“Elementary my dear Fukuoka UX Study Group”
Basics definitions and common mistakes in research methodology74Analysis of data データーを分析 Research PROCESS
�62
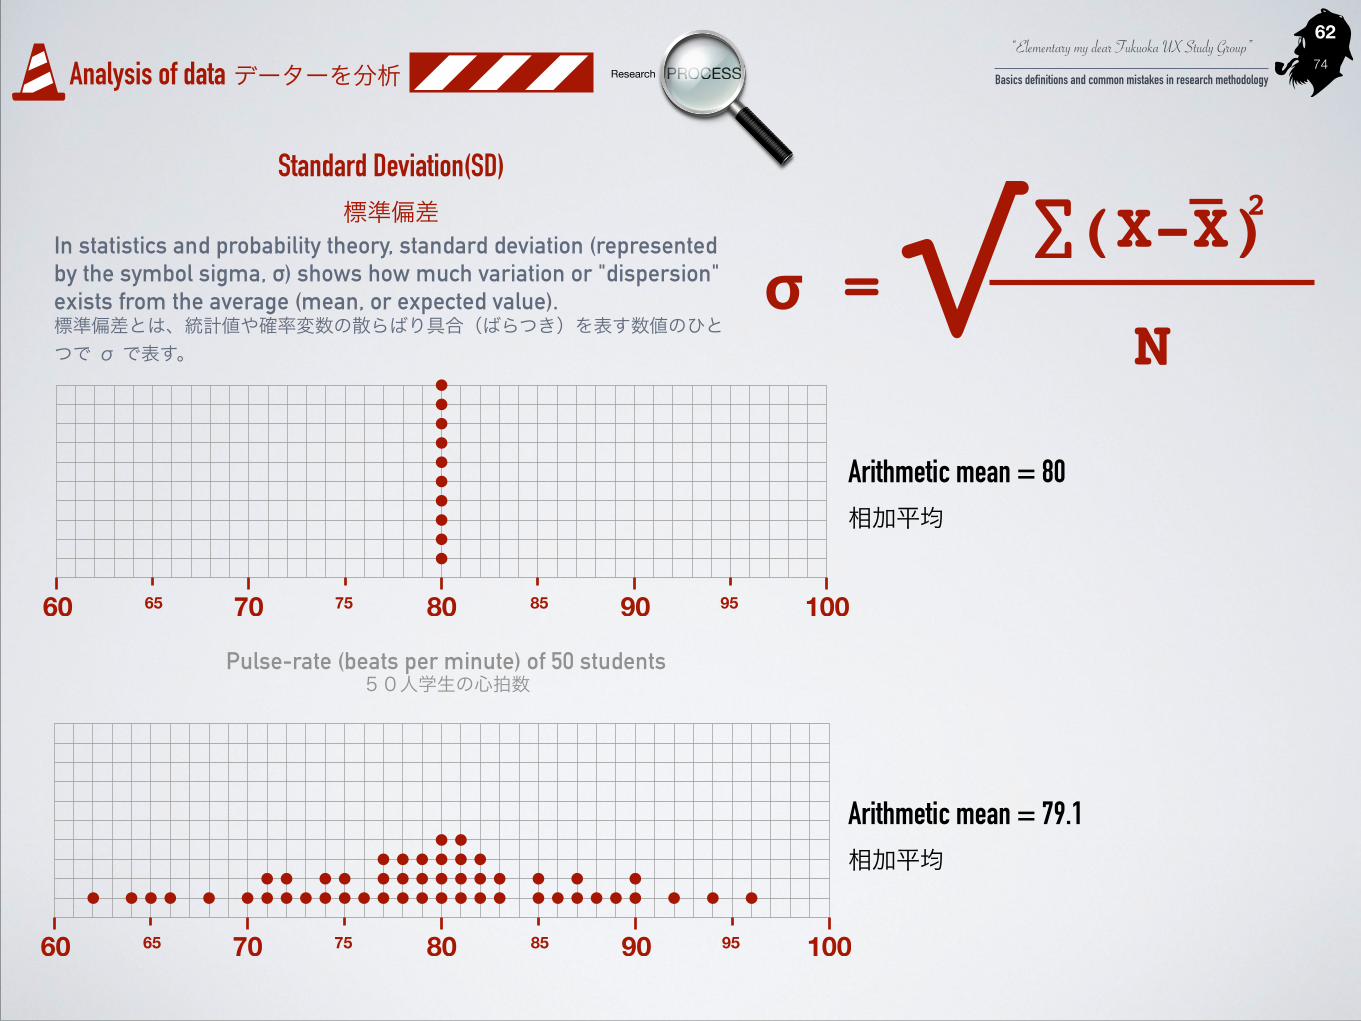
Standard Deviation(SD) 標準偏差
In statistics and probability theory, standard deviation (represented by the symbol sigma, σ) shows how much variation or "dispersion" exists from the average (mean, or expected value). 標準偏差とは、統計値や確率変数の散らばり具合(ばらつき)を表す数値のひとつで σ で表す。
σN
∑(X-X)=√ 2
Arithmetic mean = 80 相加平均
Arithmetic mean = 79.1 相加平均
Pulse-rate (beats per minute) of 50 students 50人学生の心拍数

“Elementary my dear Fukuoka UX Study Group”
Basics definitions and common mistakes in research methodology74Analysis of data データーを分析 Research PROCESS
�63
Pulse-rate (beats per minute) of 50 students [ 50人学生の心拍数 ]
0
3
6
9
12
15
55 60 65 70 75 80 85 90 95 100
Pulse-rate (beats per minute) of 75 students [75人学生の心拍数]
0
3
6
9
12
15
55 60 65 70 75 80 85 90 95 100
Pulse-rate (beats per minute) of 100 students [100人学生の心拍数]
0
3
6
9
12
15
55 60 65 70 75 80 85 90 95 100
Pulse-rate (beats per minute) of 150 students [150人学生の心拍数]
0
3
6
9
12
15
55 60 65 70 75 80 85 90 95 100
“Elementary my dear Fukuoka UX Study Group”
Basics definitions and common mistakes in research methodology74Analysis of data データーを分析 Research PROCESS
�64
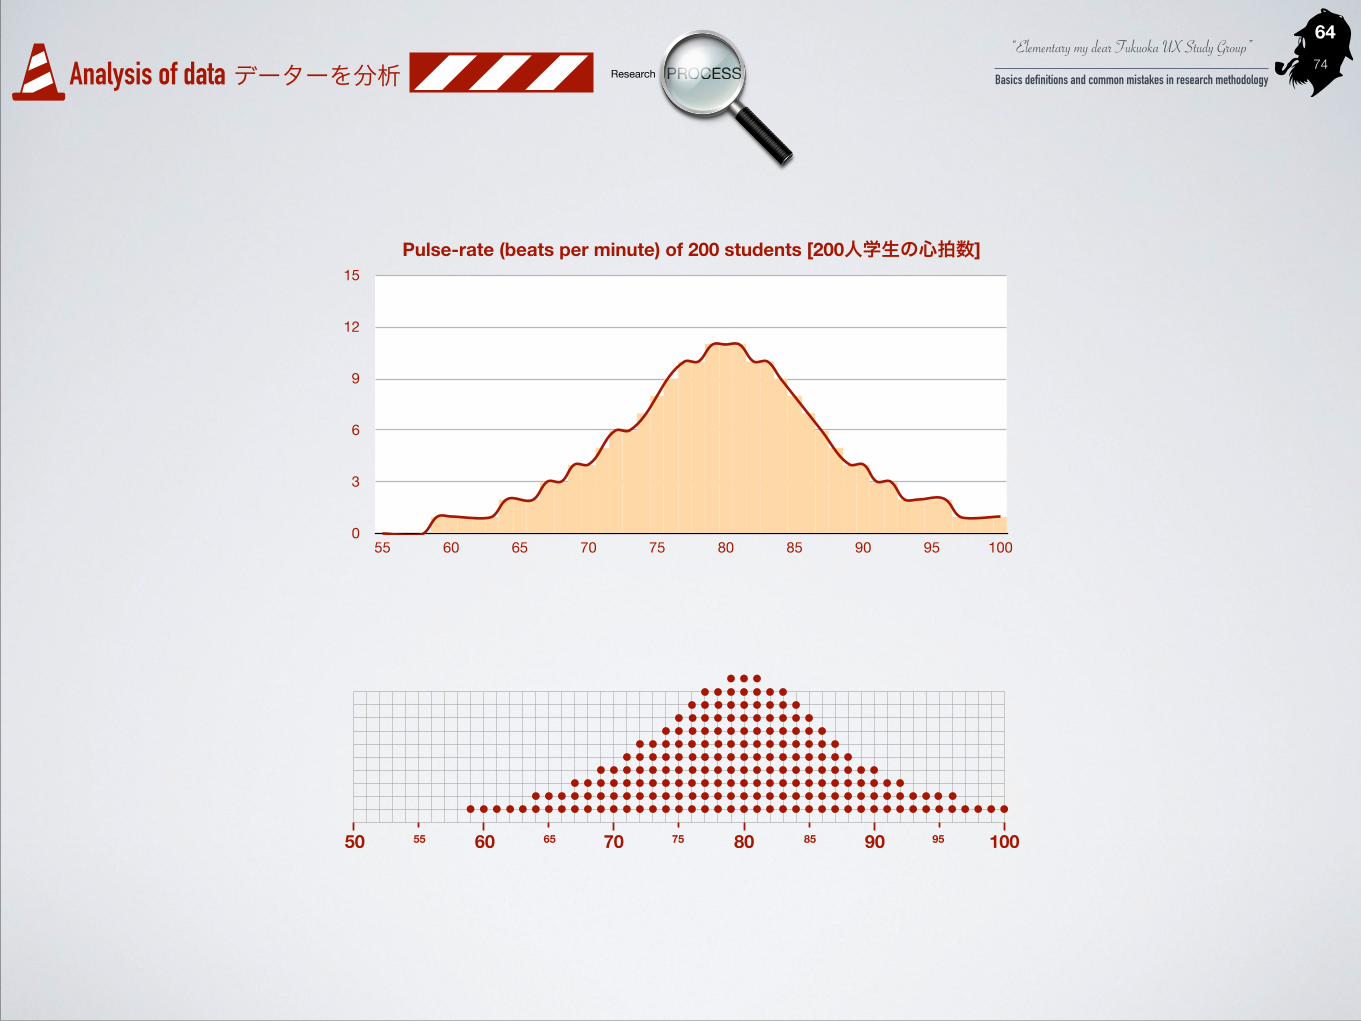
Pulse-rate (beats per minute) of 200 students [200人学生の心拍数]
0
3
6
9
12
15
55 60 65 70 75 80 85 90 95 100
“Elementary my dear Fukuoka UX Study Group”
Basics definitions and common mistakes in research methodology74Analysis of data データーを分析 Research PROCESS
�65
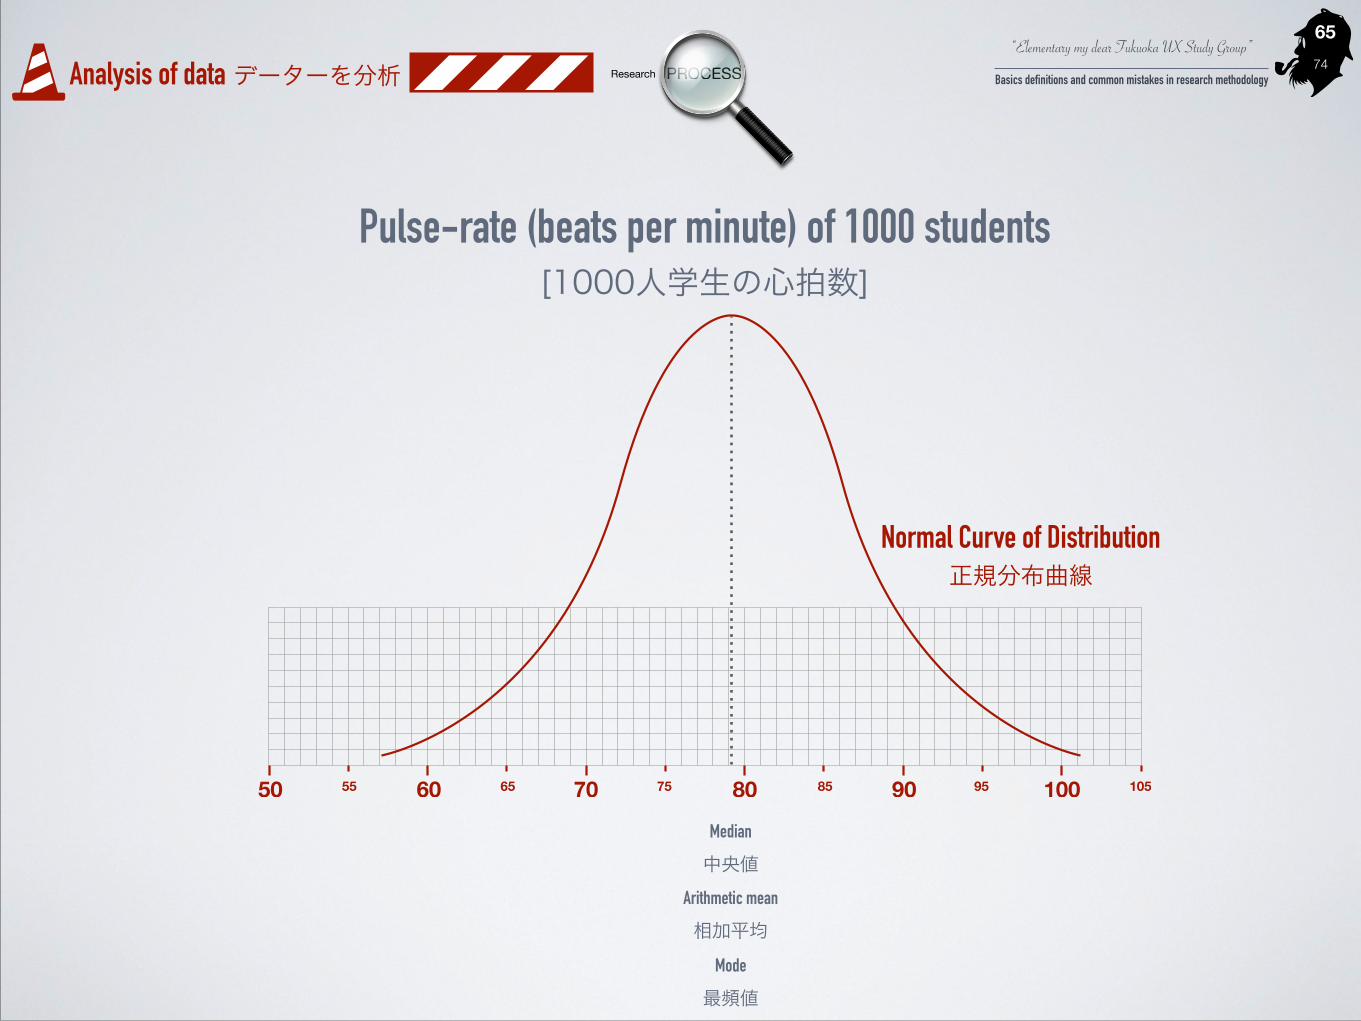
Pulse-rate (beats per minute) of 1000 students [1000人学生の心拍数]
Arithmetic mean
相加平均
Median
中央値
Mode
最頻値
Normal Curve of Distribution 正規分布曲線
“Elementary my dear Fukuoka UX Study Group”
Basics definitions and common mistakes in research methodology74Analysis of data データーを分析 Research PROCESS
�66
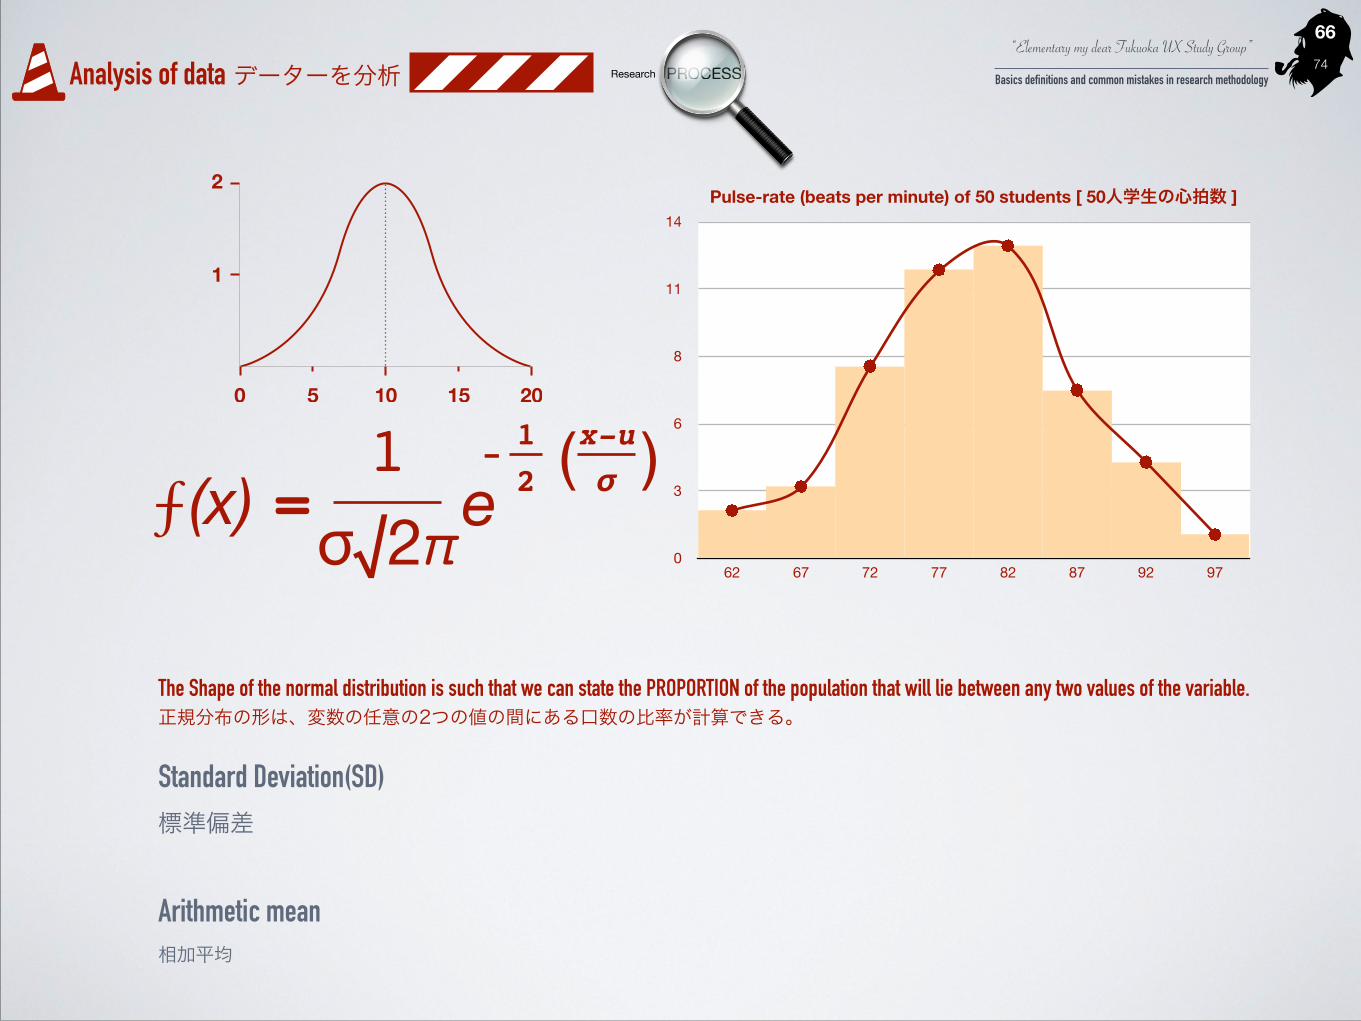
The Shape of the normal distribution is such that we can state the PROPORTION of the population that will lie between any two values of the variable. 正規分布の形は、変数の任意の2つの値の間にある口数の比率が計算できる。
Pulse-rate (beats per minute) of 50 students [ 50人学生の心拍数 ]
0
3
6
8
11
14
62 67 72 77 82 87 92 97
Standard Deviation(SD) 標準偏差 !Arithmetic mean 相加平均
⨍(x) σ√2π1
=1"2e
- x-u!σ )(

“Elementary my dear Fukuoka UX Study Group”
Basics definitions and common mistakes in research methodology74Analysis of data データーを分析 Research PROCESS
Arithmetic mean = 79.1
相加平均
�67
62 64 65 66 68 70 71 71 72 72
73 74 74 75 75 76 77 77 77 78
78 78 79 79 79 80 80 80 80 81
81 81 81 82 82 82 83 83 85 85
86 87 87 88 89 90 90 92 94 96
Standard Deviation(SD) = 6 標準偏差
Arithmetic mean = 80 相加平均
Pulse-rate (beats per minute) of 50 students 50人学生の心拍数
-2 SD-1 SD
-1/2 SD +1 SD
+1 1/2 SD+3 SD
Arithmetic mean = 80 相加平均
Z-Values 偏差値

“Elementary my dear Fukuoka UX Study Group”
Basics definitions and common mistakes in research methodology74Analysis of data データーを分析 Research PROCESS
�68
M
68% of all observations
(34%) (34%)
-1SD +1SD
M ± 1SD
Point of Inflection 編曲点
Point of Inflection 編曲点
“Elementary my dear Fukuoka UX Study Group”
Basics definitions and common mistakes in research methodology74Analysis of data データーを分析 Research PROCESS
�69
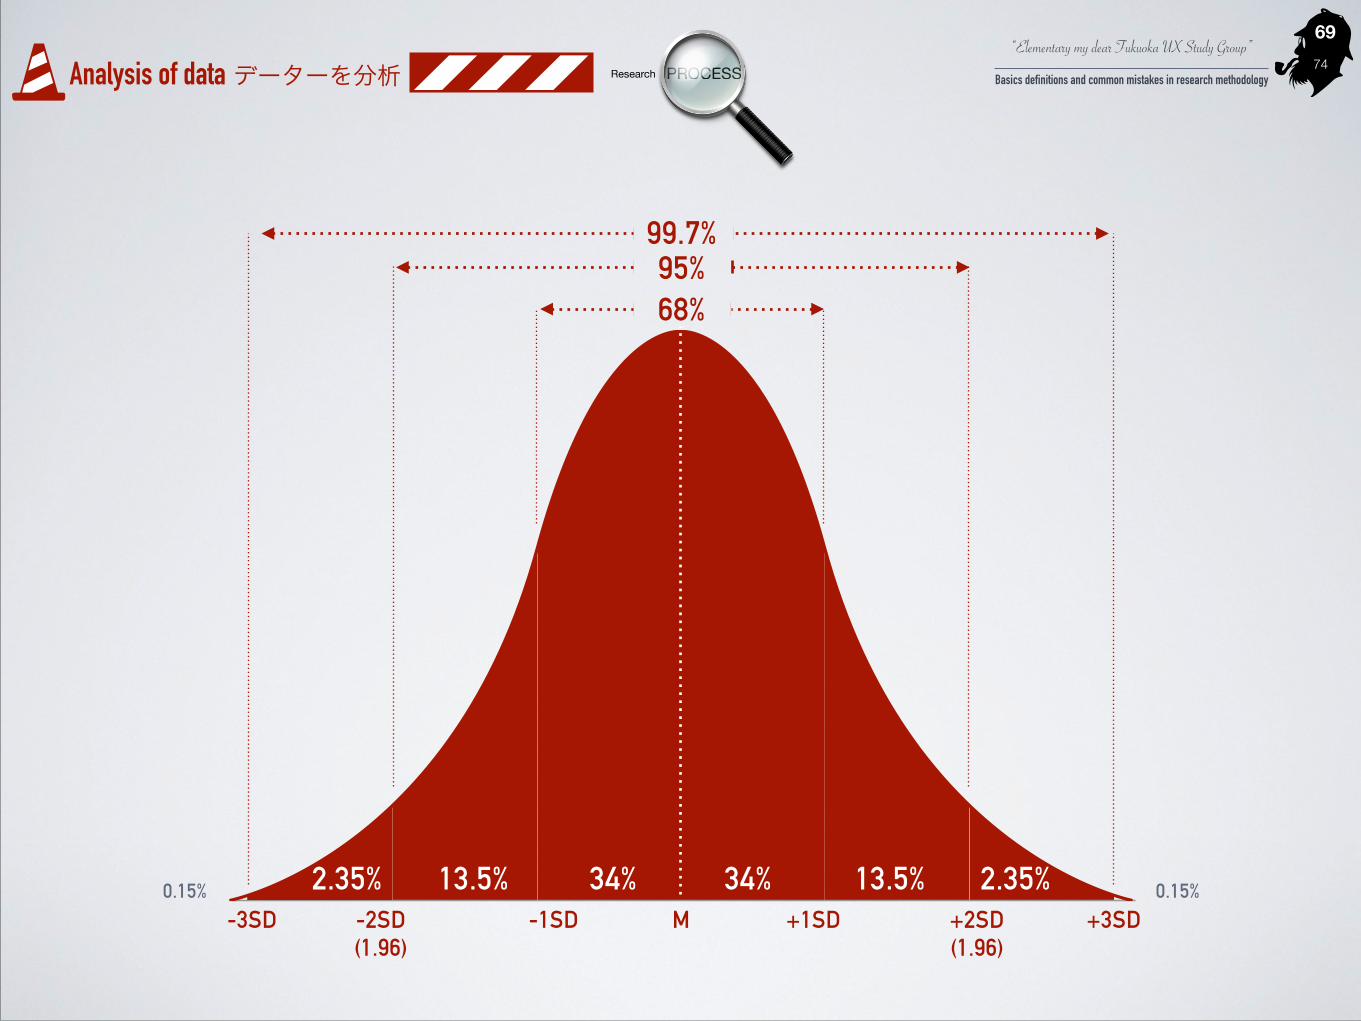
+3SD0.15%
M-1SD +1SD-2SD (1.96)
+2SD (1.96)
95%
-3SD
99.7%
68%
34%13.5%2.35%0.15% 34% 13.5% 2.35%
“Elementary my dear Fukuoka UX Study Group”
Basics definitions and common mistakes in research methodology74Analysis of data データーを分析 Research PROCESS
�70
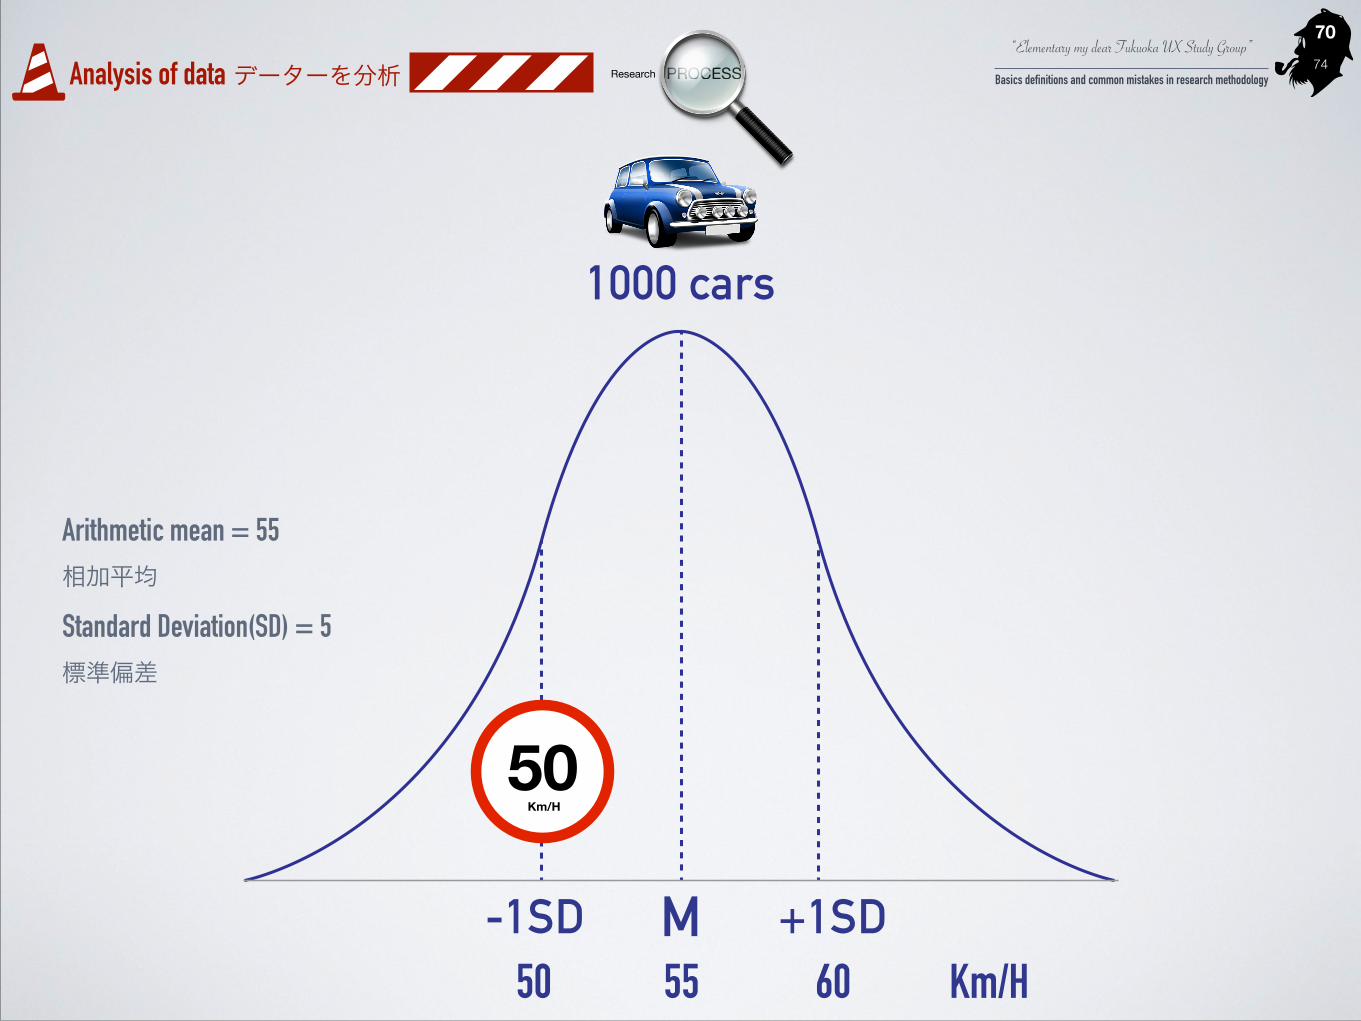
M-1SD +1SD50 55 60 Km/H
50Km/H
Standard Deviation(SD) = 5 標準偏差
Arithmetic mean = 55 相加平均
1000 cars

“Elementary my dear Fukuoka UX Study Group”
Basics definitions and common mistakes in research methodology74Analysis of data データーを分析 Research PROCESS
�71
34% 50%
84%50
Km/H
Standard Deviation(SD) = 5 標準偏差
Arithmetic mean = 55 相加平均
M-1SD +1SD50 55 60 Km/H
1000 cars

“Elementary my dear Fukuoka UX Study Group”
Basics definitions and common mistakes in research methodology74Analysis of data データーを分析 Research PROCESS
�72
Asuka LangleyAyanami Rei
80 points 点
Eva Units combat tactics 汎用人型決戦兵器の技術
History of the Second Impact セカンドインパクトの歴史
Standard Deviation(SD) = 5 標準偏差
Arithmetic mean = 60 相加平均
90 points 点
Standard Deviation(SD) = 15 標準偏差
Arithmetic mean = 65 相加平均

“Elementary my dear Fukuoka UX Study Group”
Basics definitions and common mistakes in research methodology74Analysis of data データーを分析 Research PROCESS
90
�73
65 70 75 80605550
60 75 105453015
+3SD0.15%
M-1SD +1SD-2SD (1.96)
+2SD (1.96)
95%
-3SD
99.7%
68%
34%13.5%2.35%0.15% 34% 13.5% 2.35%
Eva Units combat tactics 汎用人型決戦兵器の技術History of the Second Impact セカンドインパクトの歴史

“Elementary my dear Fukuoka UX Study Group”
Basics definitions and common mistakes in research methodology74
�74
SEARCHRE