Relationship between Fatigue Limit and Defect Size in · PDF filespheroidizing agent. Tensile...
7
Relationship between Fatigue Limit and Defect Size in Spheroidal Graphite Cast Iron with Different Graphite Spheroidization Ratios and Microstructures +1 Naoto Shiraki 1 , Takuya Watanabe 1,+2 and Toshitake Kanno 2 1 Faculty of Engineering, Tokyo City University, Tokyo 158-8557, Japan 2 Kimura Chuzosho Co., LTD., Omaezaki 437-1615, Japan The purpose of this study is to investigate that effects of graphite spheroidization ratio and microstructure on the characteristics of fatigue limit in spheroidal graphite cast iron. Ferritic spheroidal graphite cast iron (FDI), pearlitic spheroidal graphite cast iron (PDI) and austempered spheroidal graphite cast iron (ADI) were used as specimens. The graphite spheroidization ratio was varied between 63³94% by the addition of a spheroidizing agent. Tensile test was carried out in air at room temperature. The experiment conformed to JIS (Japan Industrial Standards). Rotating bending fatigue test was also carried out using these materials. The experiment conformed also to JIS. Stress ratio R was ¹1, and the specimen used was type 1(JIS) with a diameter of 8 mm. The test was carried out in air at room temperature. The relationship between fatigue limit and graphite spheroidization ratio was investigated, as well as the correlation between fatigue limit and defect size. When the graphite spheroidization ratio was over 80%, the fatigue limit was not influenced. Fracture origins were micro-shrinkage, aggregate graphite, and unspheroidized graphite. When graphite spheroidization decreased, the ratio of unspheroidized graphite at the fracture origin increased. The defect size that transitioned from region I to II differed according to the microstructure: the defect size of PDI was the smallest, and that of FDI was larger than ADI. When there are no large defects in FDI, the fatigue limit can be estimated by tensile strength. However, in PDI and ADI, it must be estimated taking into account the size of existing defects in specimens. [doi:10.2320/matertrans.F-M2015826] (Received June 24, 2015; Accepted September 3, 2015; Published October 23, 2015) Keywords: graphite spheroidization, microstructure, spheroidal graphite cast iron, rotating bending fatigue test, fatigue limit, defect size, fracture origin 1. Introduction Spheroidal graphite cast iron has many excellent properties and is considered to be a promising structural material alternative to steel. In the Japanese Industrial Standard, spheroidal graphite cast iron is defined to have a graphite spheroidization ratio of 80% or more. 1) In addition, there’ s also a written description of tensile strength. For example spheroidal graphite cast iron (such as FCD700) has a tensile strength of 700 MPa or more. The spheroidal graphite cast iron is defined as having an approximately constant tensile strength with the graphite spheroidization ratio of 80% or more. On the other hand, spheroidal graphite cast iron contains graphite, which may become the origin of a fatigue fracture. 2) In addition, it is reported that unspheroidal graphite can become a fracture origin. 3) Materials with a graphite spheroidization ratio of 80% or more are categorized as the same material, while researchers do not yet fully understand how the spheroidizing ratio influences the fatigue strength. In other words, even in the case that the spheroidizing ratio satisfies the prescription, it is expected that stress concentration may be occured at the edge of the unspheroidal graphite or a coarse graphite grain may trigger fatigue fracture. This means that even if a spheroidizing ratio is large enough for providing a sufficient static strength, it may be not large enough to provide a satisfactory fatigue strength. Further, it is desired to establish a safe and simple method using for strength design because experimental determination of fatigue limit spends enormous time and effort. 4) Generally, the fatigue limit of steels is said to be equal to 0.5· B (half of the tensile strength). However, the evaluation with only tensile strength may not always be sufficient because inherent defects in spheroidal graphite cast iron is large. 5) Murakami et al. proposed the four-parameters method to predict the fatigue limit in consideration of the hardness of the matrix and defect size in a material, and showed that the fatigue limit can be evaluated with a good accuracy for a material with a defect size of about 1,000 μm. 6) In this study, we performed a rotating bending fatigue test of ferritic spheroidal graphite cast iron, pearlitic spheroidal graphite cast iron, and austempered spheroidal graphite cast iron with different spheroidizing ratios obtained by different conditions of heat-treatment to study the influence of spheroidization ratio on the fatigue limit. In addition, we examined the correlation between fatigue limit and defect size which is dependent on the matrix. 2. Sample Materials Test ingots of 230 mm © 190 mm © 170 mm were pre- pared by melting 54 kg of metal in an electric furnace, and pouring it from the upper opening with a tapping temperature of 1773 K and a pouring temperature of 1653 K. The graphite spheroidization ratio of test materials was controlled by changing the quantity of a spheroidizing agent addition. Materials including four kinds of ferritic spheroidal graphite cast iron (FDI), five kinds of pearlitic spheroidal graphite cast iron (PDI), and four kinds of austempered spheroidal graphite cast iron (ADI) with different values of spheroidization ratio were prepared for the experiment. Table 1 shows the chemical components of the test materials. In addition, the name of each material is shown in conjunction with the graphite spheroidization ratio (e.g., FDI.94). +1 This Paper was Originally Published in Japanese in J. JFS 86 (2014) 454- 460. +2 Graduate Student, Tokyo City University Materials Transactions, Vol. 56, No. 12 (2015) pp. 2010 to 2016 © 2015 Japan Foundry Engineering Society
Transcript of Relationship between Fatigue Limit and Defect Size in · PDF filespheroidizing agent. Tensile...
Relationship between Fatigue Limit and Defect Size in Spheroidal Graphite Cast Ironwith Different Graphite Spheroidization Ratios and Microstructures+1
Naoto Shiraki1, Takuya Watanabe1,+2 and Toshitake Kanno2
1Faculty of Engineering, Tokyo City University, Tokyo 158-8557, Japan2Kimura Chuzosho Co., LTD., Omaezaki 437-1615, Japan
The purpose of this study is to investigate that effects of graphite spheroidization ratio and microstructure on the characteristics of fatiguelimit in spheroidal graphite cast iron. Ferritic spheroidal graphite cast iron (FDI), pearlitic spheroidal graphite cast iron (PDI) and austemperedspheroidal graphite cast iron (ADI) were used as specimens. The graphite spheroidization ratio was varied between 63³94% by the addition of aspheroidizing agent. Tensile test was carried out in air at room temperature. The experiment conformed to JIS (Japan Industrial Standards).Rotating bending fatigue test was also carried out using these materials. The experiment conformed also to JIS. Stress ratio R was ¹1, and thespecimen used was type 1(JIS) with a diameter of 8mm. The test was carried out in air at room temperature. The relationship between fatiguelimit and graphite spheroidization ratio was investigated, as well as the correlation between fatigue limit and defect size.
When the graphite spheroidization ratio was over 80%, the fatigue limit was not influenced. Fracture origins were micro-shrinkage,aggregate graphite, and unspheroidized graphite. When graphite spheroidization decreased, the ratio of unspheroidized graphite at the fractureorigin increased. The defect size that transitioned from region I to II differed according to the microstructure: the defect size of PDI was thesmallest, and that of FDI was larger than ADI. When there are no large defects in FDI, the fatigue limit can be estimated by tensile strength.However, in PDI and ADI, it must be estimated taking into account the size of existing defects in specimens.[doi:10.2320/matertrans.F-M2015826]
(Received June 24, 2015; Accepted September 3, 2015; Published October 23, 2015)
Keywords: graphite spheroidization, microstructure, spheroidal graphite cast iron, rotating bending fatigue test, fatigue limit, defect size,fracture origin
1. Introduction
Spheroidal graphite cast iron has many excellent propertiesand is considered to be a promising structural materialalternative to steel. In the Japanese Industrial Standard,spheroidal graphite cast iron is defined to have a graphitespheroidization ratio of 80% or more.1) In addition, there’salso a written description of tensile strength. For examplespheroidal graphite cast iron (such as FCD700) has a tensilestrength of 700MPa or more. The spheroidal graphite castiron is defined as having an approximately constant tensilestrength with the graphite spheroidization ratio of 80% ormore. On the other hand, spheroidal graphite cast ironcontains graphite, which may become the origin of a fatiguefracture.2) In addition, it is reported that unspheroidal graphitecan become a fracture origin.3) Materials with a graphitespheroidization ratio of 80% or more are categorized as thesame material, while researchers do not yet fully understandhow the spheroidizing ratio influences the fatigue strength.In other words, even in the case that the spheroidizingratio satisfies the prescription, it is expected that stressconcentration may be occured at the edge of the unspheroidalgraphite or a coarse graphite grain may trigger fatiguefracture. This means that even if a spheroidizing ratio islarge enough for providing a sufficient static strength, itmay be not large enough to provide a satisfactory fatiguestrength.
Further, it is desired to establish a safe and simple methodusing for strength design because experimental determinationof fatigue limit spends enormous time and effort.4) Generally,
the fatigue limit of steels is said to be equal to 0.5·B (halfof the tensile strength). However, the evaluation with onlytensile strength may not always be sufficient because inherentdefects in spheroidal graphite cast iron is large.5) Murakamiet al. proposed the four-parameters method to predict thefatigue limit in consideration of the hardness of the matrixand defect size in a material, and showed that the fatigue limitcan be evaluated with a good accuracy for a material with adefect size of about 1,000 µm.6)
In this study, we performed a rotating bending fatigue testof ferritic spheroidal graphite cast iron, pearlitic spheroidalgraphite cast iron, and austempered spheroidal graphite castiron with different spheroidizing ratios obtained by differentconditions of heat-treatment to study the influence ofspheroidization ratio on the fatigue limit. In addition, weexamined the correlation between fatigue limit and defectsize which is dependent on the matrix.
2. Sample Materials
Test ingots of 230mm © 190mm © 170mm were pre-pared by melting 54 kg of metal in an electric furnace, andpouring it from the upper opening with a tapping temperatureof 1773K and a pouring temperature of 1653K. The graphitespheroidization ratio of test materials was controlled bychanging the quantity of a spheroidizing agent addition.Materials including four kinds of ferritic spheroidal graphitecast iron (FDI), five kinds of pearlitic spheroidal graphite castiron (PDI), and four kinds of austempered spheroidal graphitecast iron (ADI) with different values of spheroidization ratiowere prepared for the experiment. Table 1 shows thechemical components of the test materials. In addition, thename of each material is shown in conjunction with thegraphite spheroidization ratio (e.g., FDI.94).
+1This Paper was Originally Published in Japanese in J. JFS 86 (2014) 454460.
+2Graduate Student, Tokyo City University
Materials Transactions, Vol. 56, No. 12 (2015) pp. 2010 to 2016©2015 Japan Foundry Engineering Society
Removing 10mm of height from the lowermost part ofeach ingot, and the specimen for the tensile test and therotating bending fatigue test was taken from a section of70mm from that height.
Specimens from each ingot were roughly shaped into around bar with a diameter of 18mm and went throughferritization annealing, pearlite transformation normalizingannealing, and austempering processes, respectively. Ferriti-zation annealing process includes holding at 1123K for 18 ksin an atmospheric furnace, cooling at a speed of 8.3 © 10¹3
K/s and then 1.4 © 10¹2K/s, and finally air-cooling. Thepearlite transformation normalization steps consist of holdingat 1203K for 18 ks and air-cooling. The austemperingprocess consists of holding at 1123K for 3.6 ks (austenitizingannealing), an isothermal transformation process in a salt-bath furnace at 648K for 3.6 ks, and then air-cooling.
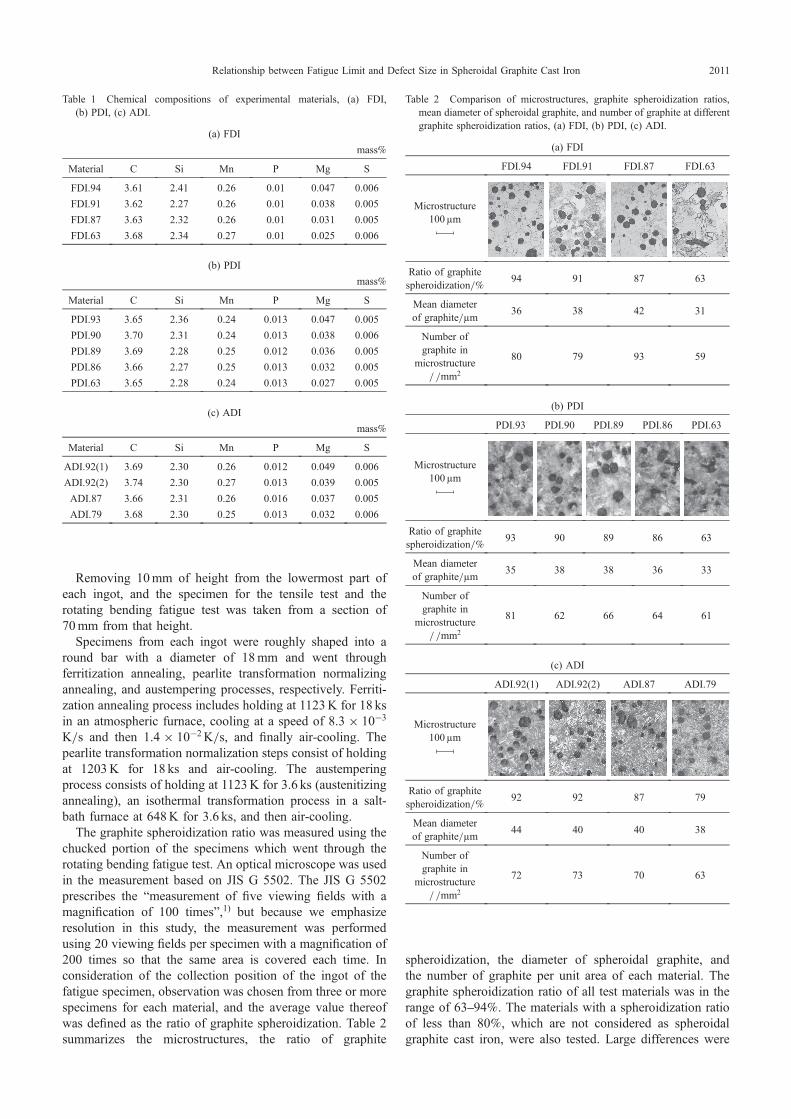
The graphite spheroidization ratio was measured using thechucked portion of the specimens which went through therotating bending fatigue test. An optical microscope was usedin the measurement based on JIS G 5502. The JIS G 5502prescribes the “measurement of five viewing fields with amagnification of 100 times”,1) but because we emphasizeresolution in this study, the measurement was performedusing 20 viewing fields per specimen with a magnification of200 times so that the same area is covered each time. Inconsideration of the collection position of the ingot of thefatigue specimen, observation was chosen from three or morespecimens for each material, and the average value thereofwas defined as the ratio of graphite spheroidization. Table 2summarizes the microstructures, the ratio of graphite
spheroidization, the diameter of spheroidal graphite, andthe number of graphite per unit area of each material. Thegraphite spheroidization ratio of all test materials was in therange of 6394%. The materials with a spheroidization ratioof less than 80%, which are not considered as spheroidalgraphite cast iron, were also tested. Large differences were
Table 1 Chemical compositions of experimental materials, (a) FDI,(b) PDI, (c) ADI.
(a) FDI
mass%
Material C Si Mn P Mg S
FDI.94 3.61 2.41 0.26 0.01 0.047 0.006
FDI.91 3.62 2.27 0.26 0.01 0.038 0.005
FDI.87 3.63 2.32 0.26 0.01 0.031 0.005
FDI.63 3.68 2.34 0.27 0.01 0.025 0.006
(b) PDI
mass%
Material C Si Mn P Mg S
PDI.93 3.65 2.36 0.24 0.013 0.047 0.005
PDI.90 3.70 2.31 0.24 0.013 0.038 0.006
PDI.89 3.69 2.28 0.25 0.012 0.036 0.005
PDI.86 3.66 2.27 0.25 0.013 0.032 0.005
PDI.63 3.65 2.28 0.24 0.013 0.027 0.005
(c) ADI
mass%
Material C Si Mn P Mg S
ADI.92(1) 3.69 2.30 0.26 0.012 0.049 0.006
ADI.92(2) 3.74 2.30 0.27 0.013 0.039 0.005
ADI.87 3.66 2.31 0.26 0.016 0.037 0.005
ADI.79 3.68 2.30 0.25 0.013 0.032 0.006
Table 2 Comparison of microstructures, graphite spheroidization ratios,mean diameter of spheroidal graphite, and number of graphite at differentgraphite spheroidization ratios, (a) FDI, (b) PDI, (c) ADI.
(a) FDI
FDI.94 FDI.91 FDI.87 FDI.63
Microstructure100µm
Ratio of graphitespheroidization/%
94 91 87 63
Mean diameterof graphite/µm
36 38 42 31
Number ofgraphite in
microstructure/ /mm2
80 79 93 59
(b) PDI
PDI.93 PDI.90 PDI.89 PDI.86 PDI.63
Microstructure100µm
Ratio of graphitespheroidization/%
93 90 89 86 63
Mean diameterof graphite/µm
35 38 38 36 33
Number ofgraphite in
microstructure/ /mm2
81 62 66 64 61
(c) ADI
ADI.92(1) ADI.92(2) ADI.87 ADI.79
Microstructure100µm
Ratio of graphitespheroidization/%
92 92 87 79
Mean diameterof graphite/µm
44 40 40 38
Number ofgraphite in
microstructure/ /mm2
72 73 70 63
Relationship between Fatigue Limit and Defect Size in Spheroidal Graphite Cast Iron 2011
not observed in the diameter of spheroidal graphite and thenumber of graphite per unit area in each material.
3. Experimental Procedure
3.1 Tensile testIn the tensile test, the shape and dimensions of tensile test
specimens was compliant with the 14A tensile test specimenof JIS Z 2241, which has a diameter 8mm in the parallelportion.7) The tensile test was conducted in the atmosphere atroom temperature using the AUTOGRAPH AG-Xplus and acrosshead displacement speed of 0.5mm/min. The parallelportion of the specimens was polished using #400 abrasivepaper, and a pair of foil type strain gauges of length 2mmwere attached to the left and right sides of the center of theparallel portion of the specimens. Young’s modulus wascalculated from the strain measured by the tensile test, andproof stress 0.2% was measured by the offset method.
3.2 Hardness testThe hardness of the matrix of each material was obtained
by the Vickers test. The specimen was polished using a#2000 abrasive paper, and the test surface was buff-polishedwith diamond paste of an average particle size of 0.25 µm. Amicro-Vickers hardness tester was used. The test conditionswere an applied testing load of 1.96N and 50 measurementpoints with load holding time of 15 sec. The average of 30measurement points, from which the top and bottom 10points were excluded, was defined as the hardness.
3.3 Rotating bending fatigue testThe shape and the dimensions of fatigue test specimens
were compliant with the No. 1 test specimen of JIS Z 2274,which has a diameter of 8mm in the parallel portion.8) Thenumber of the specimens was 1223 for each material.Further, the parallel portion was mirror-polished usingabrasive papers and by buff polishing. In the rotating bendingfatigue test, Ono-type rotating bending fatigue testingmachine (98Nm) was used with a loading frequency of47 rps at room temperature in the atmosphere. The number ofrepetitions for the fatigue test was 1 © 107 cycles for the FDIand PDI materials and 3 © 107 cycles for the ADI material.The approximation of S-N diagrams obtained by the rotatingbending fatigue test and the fatigue limit were calculated inconformity with JSMS-SD-6-02.9) The fracture origins andtheir peripheral areas of all specimens fractured after thefatigue test were observed using a scanning electron micro-scope.
4. Experimental Results and Discussion
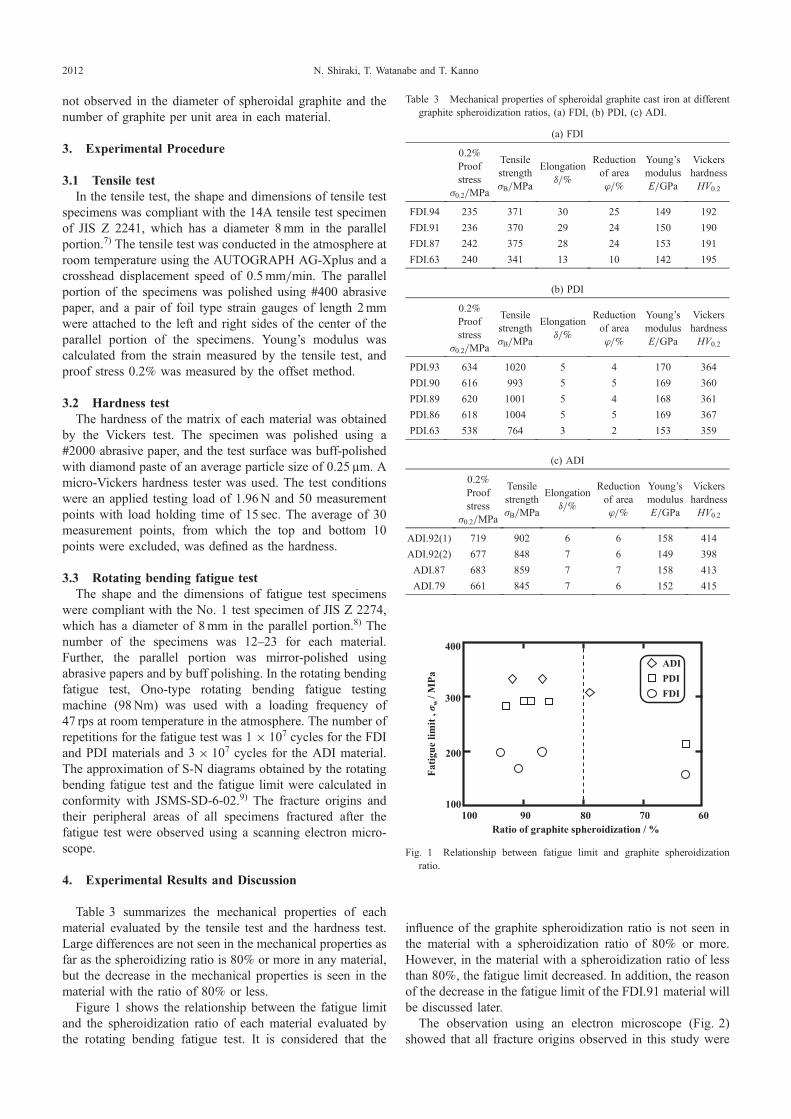
Table 3 summarizes the mechanical properties of eachmaterial evaluated by the tensile test and the hardness test.Large differences are not seen in the mechanical properties asfar as the spheroidizing ratio is 80% or more in any material,but the decrease in the mechanical properties is seen in thematerial with the ratio of 80% or less.
Figure 1 shows the relationship between the fatigue limitand the spheroidization ratio of each material evaluated bythe rotating bending fatigue test. It is considered that the
influence of the graphite spheroidization ratio is not seen inthe material with a spheroidization ratio of 80% or more.However, in the material with a spheroidization ratio of lessthan 80%, the fatigue limit decreased. In addition, the reasonof the decrease in the fatigue limit of the FDI.91 material willbe discussed later.
The observation using an electron microscope (Fig. 2)showed that all fracture origins observed in this study were
Table 3 Mechanical properties of spheroidal graphite cast iron at differentgraphite spheroidization ratios, (a) FDI, (b) PDI, (c) ADI.
(a) FDI
0.2%Proofstress
·0.2/MPa
Tensilestrength·B/MPa
Elongation¤/%
Reductionof area¤/%
Young’smodulusE/GPa
VickershardnessHV0.2
FDI.94 235 371 30 25 149 192
FDI.91 236 370 29 24 150 190
FDI.87 242 375 28 24 153 191
FDI.63 240 341 13 10 142 195
(b) PDI
0.2%Proofstress
·0.2/MPa
Tensilestrength·B/MPa
Elongation¤/%
Reductionof area¤/%
Young’smodulusE/GPa
VickershardnessHV0.2
PDI.93 634 1020 5 4 170 364
PDI.90 616 993 5 5 169 360
PDI.89 620 1001 5 4 168 361
PDI.86 618 1004 5 5 169 367
PDI.63 538 764 3 2 153 359
(c) ADI
0.2%Proofstress
·0.2/MPa
Tensilestrength·B/MPa
Elongation¤/%
Reductionof area¤/%
Young’smodulusE/GPa
VickershardnessHV0.2
ADI.92(1) 719 902 6 6 158 414
ADI.92(2) 677 848 7 6 149 398
ADI.87 683 859 7 7 158 413
ADI.79 661 845 7 6 152 415
60Ratio of graphite spheroidization / %
Fatig
ue li
mit
, σw
/ MPa
100 80100
400
200
7090
FDI
ADIPDI
300
Fig. 1 Relationship between fatigue limit and graphite spheroidizationratio.
N. Shiraki, T. Watanabe and T. Kanno2012
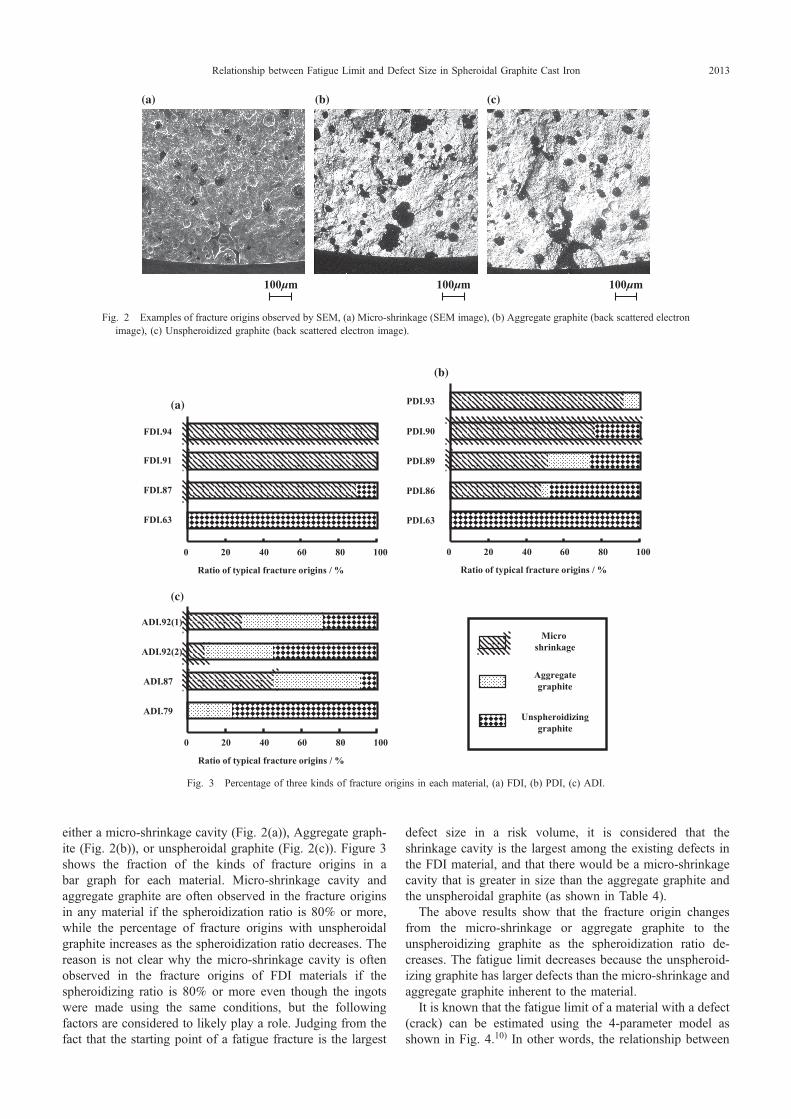
either a micro-shrinkage cavity (Fig. 2(a)), Aggregate graph-ite (Fig. 2(b)), or unspheroidal graphite (Fig. 2(c)). Figure 3shows the fraction of the kinds of fracture origins in abar graph for each material. Micro-shrinkage cavity andaggregate graphite are often observed in the fracture originsin any material if the spheroidization ratio is 80% or more,while the percentage of fracture origins with unspheroidalgraphite increases as the spheroidization ratio decreases. Thereason is not clear why the micro-shrinkage cavity is oftenobserved in the fracture origins of FDI materials if thespheroidizing ratio is 80% or more even though the ingotswere made using the same conditions, but the followingfactors are considered to likely play a role. Judging from thefact that the starting point of a fatigue fracture is the largest
defect size in a risk volume, it is considered that theshrinkage cavity is the largest among the existing defects inthe FDI material, and that there would be a micro-shrinkagecavity that is greater in size than the aggregate graphite andthe unspheroidal graphite (as shown in Table 4).
The above results show that the fracture origin changesfrom the micro-shrinkage or aggregate graphite to theunspheroidizing graphite as the spheroidization ratio de-creases. The fatigue limit decreases because the unspheroid-izing graphite has larger defects than the micro-shrinkage andaggregate graphite inherent to the material.
It is known that the fatigue limit of a material with a defect(crack) can be estimated using the 4-parameter model asshown in Fig. 4.10) In other words, the relationship between
100μm 100μm 100μm
(a) (b) (c)
Fig. 2 Examples of fracture origins observed by SEM, (a) Micro-shrinkage (SEM image), (b) Aggregate graphite (back scattered electronimage), (c) Unspheroidized graphite (back scattered electron image).
FDI.94
FDI.91
FDI.87
FDI.63
0 10080604020
Ratio of typical fracture origins / %
PDI.93
PDI.90
PDI.89
PDI.86
PDI.63
Ratio of typical fracture origins / %
0 10080604020
ADI.92(1)
ADI.92(2)
ADI.87
ADI.79
0 10080604020
Ratio of typical fracture origins / %
Microshrinkage
Unspheroidizinggraphite
Aggregategraphite
(b)
(a)
(c)
Fig. 3 Percentage of three kinds of fracture origins in each material, (a) FDI, (b) PDI, (c) ADI.
Relationship between Fatigue Limit and Defect Size in Spheroidal Graphite Cast Iron 2013

the fatigue limit and defect size is classified into three regionsas shown below.
Region I: A region strongly ruled by mechanical propertiesRegion II: A region strongly ruled by the resistance against
the propagation of a small defect (crack)Region III: A region strongly ruled by the resistance
against the propagation of a large defect(crack)
In the case of steels, the size of defects and inclusionsformed in the normal manufacturing process is as small asseveral 10 µm. Therefore, the fatigue limit is not affected bythe size of defects and inclusions as far as the hardness isrelatively small, and the proportional relationship of eq. (1)generally holds (in Region I) between the fatigue limit ·wIand the tensile strength ·B of the steel.11)
·WI ¼ 0:5·B ð1ÞOn the other hand, spheroidal graphite cast iron has low
strength graphite grains, which could be regarded as defectsin same ways. In addition, there exists a micro-shrinkage witha size of several hundred µm as observed on the fracturedsurface. Because stress concentration occurs in a materialcontaining defects of a size of several hundred µm or larger, it
is known that, affected by the defect size and the hardness ofthe matrix, the fatigue limit becomes lower than the valuepredicted by eq. (1). Murakami et al. attempted to estimatethe fatigue limit of a material containing defects of a size ofseveral hundred µm or larger.6) As a result, it was shown thatthe fatigue limit could be accurately estimated using eq. (2)for the material with defects of the size smaller than 1,000 µm(Region II).
·WII ¼¡ðHV þ 120Þ
ffiffiffiffiffiffiffiffiffi
areap 1=6
ð2Þ
HV is the Vickers hardness and ¡ is a coefficient, whichdepends on the position of a defect: it equals to 1.43 if thefracture origin exists near the surface or 1.56 if it exists in theinside.
ffiffiffiffiffiffiffiffiffi
areap
, of which the unit is µm, is the square root ofthe area obtained by projecting the defect to the largest mainstress surface.
Therefore we measured the defect size at the origin of thefatigue fracture. In the measurement of the defect size in anyfractured specimen, the fracture origin was approximated bya square, as shown in Fig. 5, disregarding the differences inthe shape of fracture origins, and the square root of the areawas assumed to be the defect size
ffiffiffiffiffiffiffiffiffi
areap
. In addition, byplotting the measured results with
ffiffiffiffiffiffiffiffiffi
areap
on a gumbel paper,where the vertical axis shows the standardized variable andthe cumulative distribution function and the horizontal axisshows the defect size
ffiffiffiffiffiffiffiffiffiffiffiffiffiffiffiffiffiffiffiffi
areaF¼50%p
. A tendency was observedthat
ffiffiffiffiffiffiffiffiffiffiffiffiffiffiffiffiffiffiffiffi
areaF¼50%p
increased as the spheroidization ratiodecreased.
In the study, in the case of a spheroidization ratio 80% ormore, the starting point of the fatigue fracture was a micro-shrinkage, an aggregate graphite, or unspheroidizing graphiteof a size of approximately 100600 µm, while an aggregategraphite or unspheroidizing graphite of a size of approx-imately 200950 µm was the starting point in the case of aspheroidization ratio of less than 80%. It is estimated fromthe defect size that they belong to Region I or II in the 4-parameter method. Table 4(a)(c) shows the fatigue limit and
RegionRegion Region
areaDefect size , log
Fatig
ue li
mit
, log
σw
BW σσ ∝ HV∝Wσ thW KΔ∝σ
Fig. 4 Schematic illustration of relationship between fatigue limit anddefect size,
ffiffiffiffiffiffiffiffiffi
areap
(4 parameter model).
100μm
(a)
(c)
(b)
Fig. 5 SEM image and approximate rectangle area of fracture origins, (a) Micro-shrinkage, (b) Aggregate graphite, (c) Unspheroidizedgraphite.
N. Shiraki, T. Watanabe and T. Kanno2014
the average defect sizeffiffiffiffiffiffiffiffiffiffiffiffiffiffiffiffiffiffiffiffi
areaF¼50%p
of the material; thefatigue limit estimated using eq. (1) as a function of tensilestrength ·B; and the fatigue limit estimated using eq. (2) as afunction of both average defect size
ffiffiffiffiffiffiffiffiffiffiffiffiffiffiffiffiffiffiffiffi
areaF¼50%p
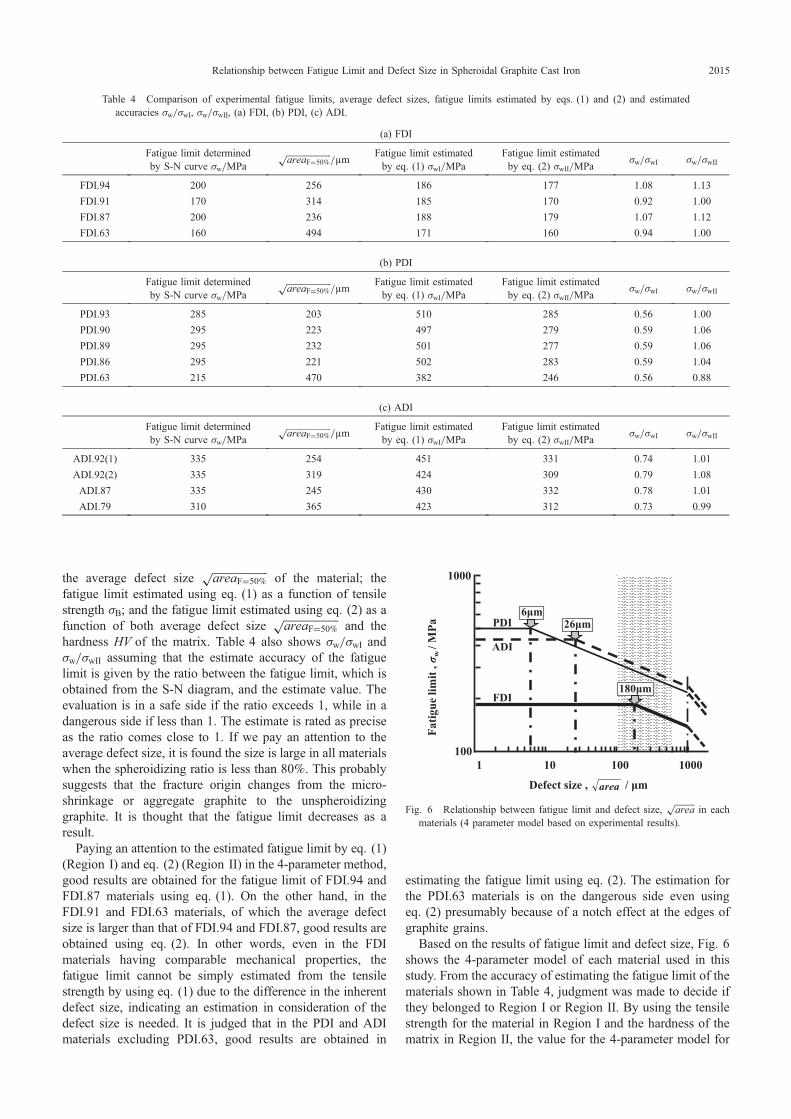
and thehardness HV of the matrix. Table 4 also shows ·w/·wI and·w/·wII assuming that the estimate accuracy of the fatiguelimit is given by the ratio between the fatigue limit, which isobtained from the S-N diagram, and the estimate value. Theevaluation is in a safe side if the ratio exceeds 1, while in adangerous side if less than 1. The estimate is rated as preciseas the ratio comes close to 1. If we pay an attention to theaverage defect size, it is found the size is large in all materialswhen the spheroidizing ratio is less than 80%. This probablysuggests that the fracture origin changes from the micro-shrinkage or aggregate graphite to the unspheroidizinggraphite. It is thought that the fatigue limit decreases as aresult.
Paying an attention to the estimated fatigue limit by eq. (1)(Region I) and eq. (2) (Region II) in the 4-parameter method,good results are obtained for the fatigue limit of FDI.94 andFDI.87 materials using eq. (1). On the other hand, in theFDI.91 and FDI.63 materials, of which the average defectsize is larger than that of FDI.94 and FDI.87, good results areobtained using eq. (2). In other words, even in the FDImaterials having comparable mechanical properties, thefatigue limit cannot be simply estimated from the tensilestrength by using eq. (1) due to the difference in the inherentdefect size, indicating an estimation in consideration of thedefect size is needed. It is judged that in the PDI and ADImaterials excluding PDI.63, good results are obtained in
estimating the fatigue limit using eq. (2). The estimation forthe PDI.63 materials is on the dangerous side even usingeq. (2) presumably because of a notch effect at the edges ofgraphite grains.
Based on the results of fatigue limit and defect size, Fig. 6shows the 4-parameter model of each material used in thisstudy. From the accuracy of estimating the fatigue limit of thematerials shown in Table 4, judgment was made to decide ifthey belonged to Region I or Region II. By using the tensilestrength for the material in Region I and the hardness of thematrix in Region II, the value for the 4-parameter model for
Defect size , / μmarea
6μm26μm
1100
1000
10 100 1000
Fatig
ue li
mit
, σw
/ MPa
180μm
ADI
PDI
FDI
Fig. 6 Relationship between fatigue limit and defect size,ffiffiffiffiffiffiffiffiffi
areap
in eachmaterials (4 parameter model based on experimental results).
Table 4 Comparison of experimental fatigue limits, average defect sizes, fatigue limits estimated by eqs. (1) and (2) and estimatedaccuracies ·w/·wI, ·w/·wII, (a) FDI, (b) PDI, (c) ADI.
(a) FDI
Fatigue limit determinedby S-N curve ·w/MPa
ffiffiffiffiffiffiffiffiffiffiffiffiffiffiffiffiffiffiffiffi
areaF¼50%p
/µmFatigue limit estimatedby eq. (1) ·wI/MPa
Fatigue limit estimatedby eq. (2) ·wII/MPa
·w/·wI ·w/·wII
FDI.94 200 256 186 177 1.08 1.13
FDI.91 170 314 185 170 0.92 1.00
FDI.87 200 236 188 179 1.07 1.12
FDI.63 160 494 171 160 0.94 1.00
(b) PDI
Fatigue limit determinedby S-N curve ·w/MPa
ffiffiffiffiffiffiffiffiffiffiffiffiffiffiffiffiffiffiffiffi
areaF¼50%p
/µmFatigue limit estimatedby eq. (1) ·wI/MPa
Fatigue limit estimatedby eq. (2) ·wII/MPa
·w/·wI ·w/·wII
PDI.93 285 203 510 285 0.56 1.00
PDI.90 295 223 497 279 0.59 1.06
PDI.89 295 232 501 277 0.59 1.06
PDI.86 295 221 502 283 0.59 1.04
PDI.63 215 470 382 246 0.56 0.88
(c) ADI
Fatigue limit determinedby S-N curve ·w/MPa
ffiffiffiffiffiffiffiffiffiffiffiffiffiffiffiffiffiffiffiffi
areaF¼50%p
/µmFatigue limit estimatedby eq. (1) ·wI/MPa
Fatigue limit estimatedby eq. (2) ·wII/MPa
·w/·wI ·w/·wII
ADI.92(1) 335 254 451 331 0.74 1.01
ADI.92(2) 335 319 424 309 0.79 1.08
ADI.87 335 245 430 332 0.78 1.01
ADI.79 310 365 423 312 0.73 0.99
Relationship between Fatigue Limit and Defect Size in Spheroidal Graphite Cast Iron 2015

each material was subtracted from the estimated fatigue limitobtained using eq. (2). Then the defect size that shows thetransition from Region I to Region II is shown by the arrowand dash line for each material. In addition, the defect sizefrom which the transition to Region III (the domain stronglyruled by the resistance against the propagation of a largedefect (crack)) assumed to 1,000 µm, which is said to be theapplication limit of Region II, is shown by the two-dot chainline. The defect size domain (approximately 100600 µm)that corresponds to a spheroidization ratio of 80% or more asevaluated in this study is shown by the hatched area in thefigure.
Paying an attention to the hatched area and the defect sizewhich shows the transition from Region I to Region II inFig. 6, the FDI materials belong either to Region I orRegion II, while both of the PDI and ADI materials evaluatedin this study, of which defects being much larger than thetransition defect size (6 µm, 26 µm), belong to Region II. Inaddition, the transition defect size of the PDI and ADImaterials is smaller than the diameter of spheroidal graphiteof the spheroidal graphite cast iron used in this study. Thissuggests that, even if the inherent micro-shrinkage is verysmall and the ratio of graphite spheroidization is large, anyinherent graphite of which the size is greater than that of thetransition defect size may become the starting point of fatiguefracture. The transition defect size of each material dependson the matrix. The size increases in the order of PDI, ADI,and FDI. In other words, it can be said that the fatigue limit ofFDI materials without large inherent defects is estimatedfrom the tensile strength using eq. (1). However, in PDI andADI materials of which the transition defect size is smallerthan that of FDI materials, the fatigue limit cannot be simplypredicted from the tensile strength in any event and it isnecessary to consider the inherent defect size including thediameter of spheroidal graphite and the spheroidization ratio.
5. Conclusions
By carrying out the rotating bending fatigue test for the
spheroidal graphite cast iron with different matrices andratios of graphite spheroidization, the following conclusionswere obtained.(1) If the graphite spheroidization ratio is 80% or more, the
fatigue limit is not affected by graphite spheroidizationratio.
(2) In any material, if the spheroidizing ratio is 80% ormore, mainly micro-shrinkage and aggregate graphiteare found at the fracture origins and the ratio of thefracture origins with unspheroidizing graphite increasesas the spheroidizing ratio decreases.
(3) In any material, the defect size from parameter whichtransition occurs from Region I to Region II dependson the matrix and increases in the order of PDI, ADI,and FDI.
(4) It can be considered that, in the FDI material withoutlarge inherent defects, the fatigue limit is estimatedfrom the tensile strength. However, in the PDI and ADImaterials, it is considered necessary to estimate thefatigue limit in consideration of inherent defect sizeincluding the diameter of spheroidal graphite and thespheroidization ratio.
REFERENCES
1) JIS G 5502: Spheroidal Graphite Iron Castings, (2007).2) T. Shiota and S. Komatsu: J. JFS 54 (1982) 434439.3) Y. Sugiyama, K. Asami and H. Wakasa: J. JFS 66 (1994) 666671.4) K. Ohji: Hakai-Kyodo-Gaku, (Ohmsha, 1985) p. 194.5) H. Tamura, Y. Sugiyama and T. Kimura: J. JFS 69 (1997) 234239.6) Y. Murakami: Metal Fatigue, Effects of Small Defects and Nonmetallic
Inclusions, (Yokendo, 1993) p. 43.7) JIS Z 2241: Method of Tensile Test for Metallic Materials, (2011).8) JIS Z 2274: Method of Rotating Bending Fatigue Testing of Metals,
(1978).9) JSMS-SD-6-02: Standard Evaluation Method of Fatigue Reliability for
Metallic Materials, Standard Regression Method of S-N Curves,(2002).
10) Y. Sugiyama, K. Asami and S. Matsuoka: Trans. JSME(A) 58 (1992)22872292 (in Japanese).
11) H. Nakazawa and H. Honma: Kinzoku-no-Hiroukyodo, (Yokendo,1982) p. 10.
N. Shiraki, T. Watanabe and T. Kanno2016