Regulation of Financial Institutions Eric S. Rosengren President & CEO Federal Reserve Bank of...
22
Regulation of Financial Institutions Eric S. Rosengren President & CEO Federal Reserve Bank of Boston Open Classroom Northeastern University Boston, MA November 30, 2011 www.bostonfed.or g
-
Upload
cecil-bradford -
Category
Documents
-
view
215 -
download
0
Transcript of Regulation of Financial Institutions Eric S. Rosengren President & CEO Federal Reserve Bank of...
Regulation of Financial Institutions
Eric S. RosengrenPresident & CEO
Federal Reserve Bank of Boston
Open ClassroomNortheastern University
Boston, MA
November 30, 2011
www.bostonfed.org

Why Do We Regulate Financial Institutions?
If everyone wants funds at the same time cannot liquidate loans Depositors want immediate access to funds Borrowers want longer-term financing
Financial intermediaries borrow short and lend long – assume diversification reduces risk from maturity mismatch
Depression – bank runs – widespread bank closures
2
Depression Era Solution
Deposit Insurance – FDIC Banks have special role – depositors get
limited government guarantee Taxpayers at risk during failure
Banks limited in what risk they take Banks have capital requirements – CAMELS Regular bank exams
3
Problems Emerge
Interest on deposits does not rise at weaker banks Weak banks have incentive to take more risk Gains go to shareholders, losses go to
taxpayers Use financial institutions for other goals
Savings and Loans GSEs
Banks become larger and more complicated
4
Too Big to Fail
International loans – assumption that governments would not default
Real estate loans – assumption real estate values would not fall
Real estate securities – assumption securities with national pools of mortgages would be protected since national housing prices had not fallen
5
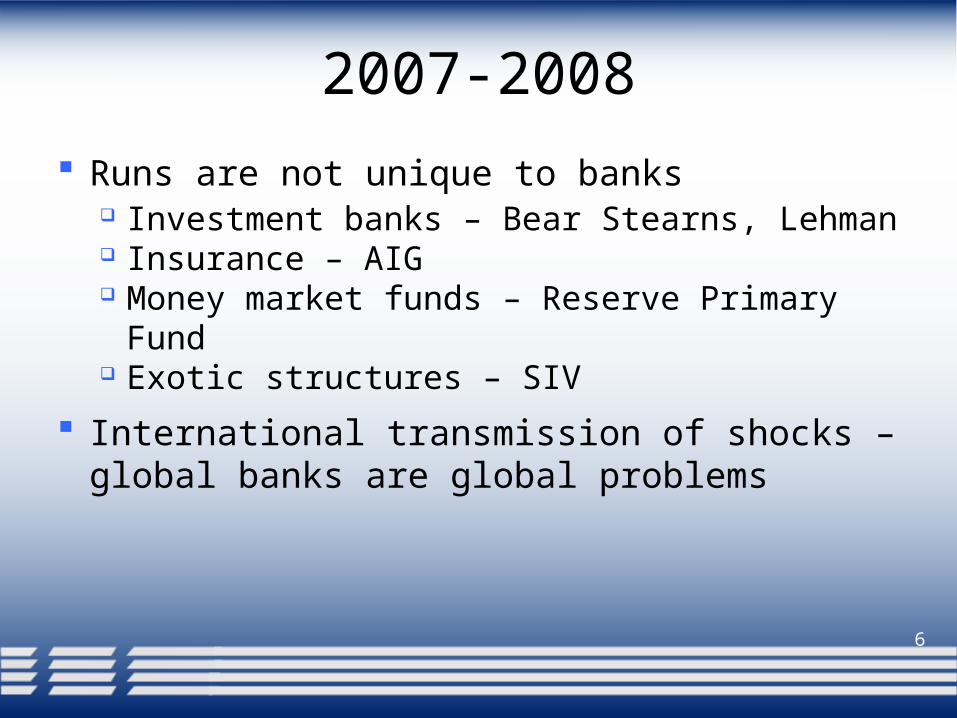
2007-2008
Runs are not unique to banks Investment banks – Bear Stearns, Lehman Insurance – AIG Money market funds – Reserve Primary Fund Exotic structures – SIV
International transmission of shocks – global banks are global problems
6
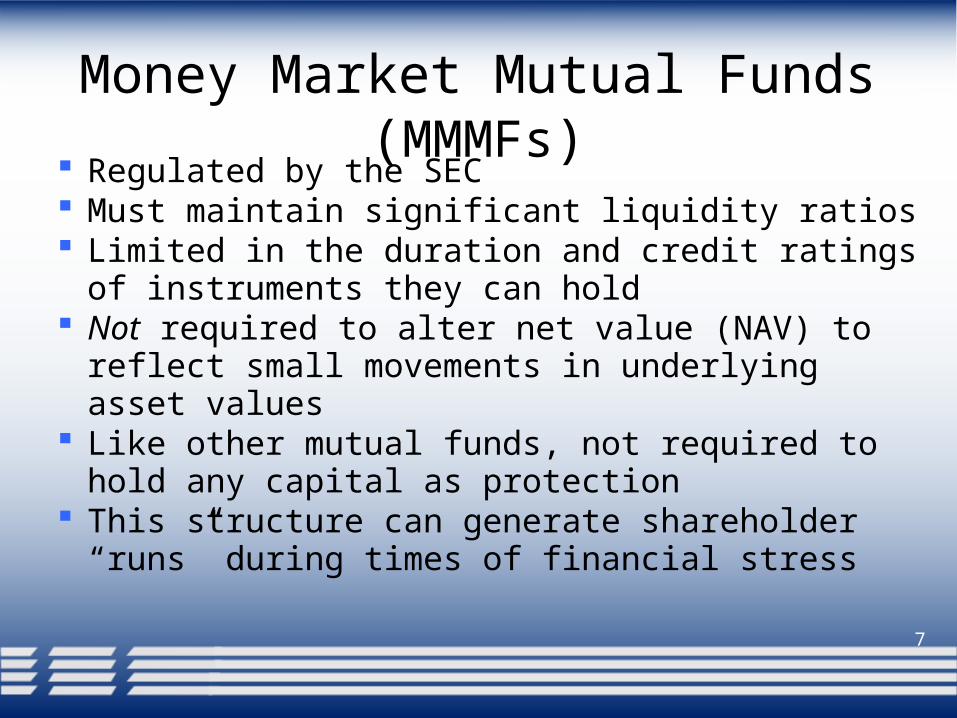
Money Market Mutual Funds (MMMFs)
Regulated by the SEC Must maintain significant liquidity ratios Limited in the duration and credit ratings of
instruments they can hold Not required to alter net value (NAV) to reflect
small movements in underlying asset values Like other mutual funds, not required to hold
any capital as protection This structure can generate shareholder “runs”
during times of financial stress7

Importance ofMoney Market Mutual Funds
Critical players in short-term credit markets Significant buyers of CP, ABCP and CDs Important source of financing for organizations
dependent on wholesale financing Largest investor focused on high-quality, very
short-term paper
8
9
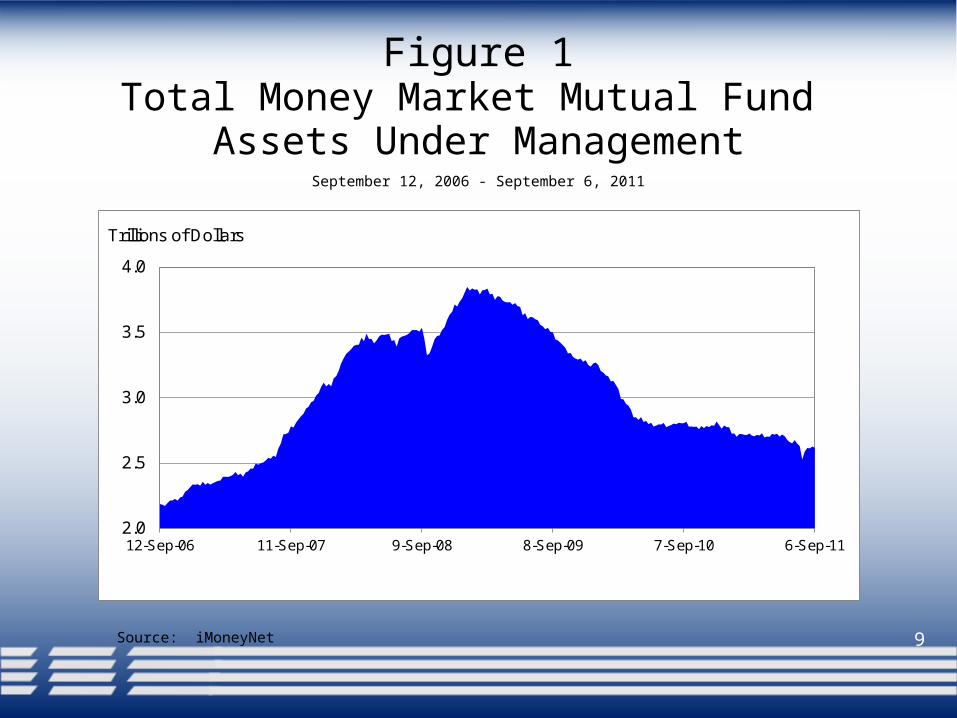
Figure 1Total Money Market Mutual Fund
Assets Under Management
Source: iMoneyNet
September 12, 2006 - September 6, 2011
2.0
2.5
3.0
3.5
4.0
12-Sep-06 11-Sep-07 9-Sep-08 8-Sep-09 7-Sep-10 6-Sep-11
Trillions of Dollars

10
Figure 2Total Money Market Mutual Fund
Assets Under Management by Type of Fund
Source: iMoneyNet
September 12, 2006 - September 6, 2011
0.0
0.5
1.0
1.5
2.0
2.5
12-Sep-06 11-Sep-07 9-Sep-08 8-Sep-09 7-Sep-10 6-Sep-11
Trillions of Dollars
Prime
Government
Tax-Free
LehmanFails (Sep 15)
11
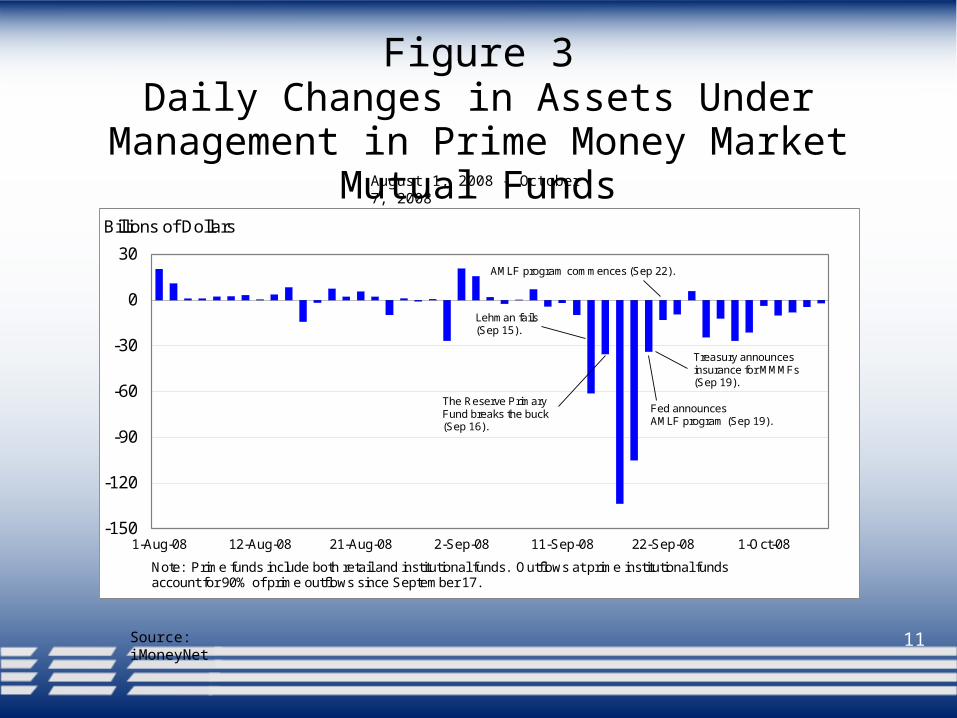
Figure 3Daily Changes in Assets Under Management
in Prime Money Market Mutual FundsAugust 1, 2008 - October 7, 2008
Source: iMoneyNet
-150
-120
-90
-60
-30
0
30
1-Aug-08 12-Aug-08 21-Aug-08 2-Sep-08 11-Sep-08 22-Sep-08 1-Oct-08
Note: Prime funds include both retail and institutional funds. Outflows at prime institutional funds account for 90% of prime outflows since September 17.
Billions of Dollars
Lehman fails(Sep 15).
The Reserve Primary Fund breaks the buck (Sep 16).
Fed announcesAMLF program (Sep 19).
AMLF program commences (Sep 22).
Treasury announces insurance for MMMFs (Sep 19).
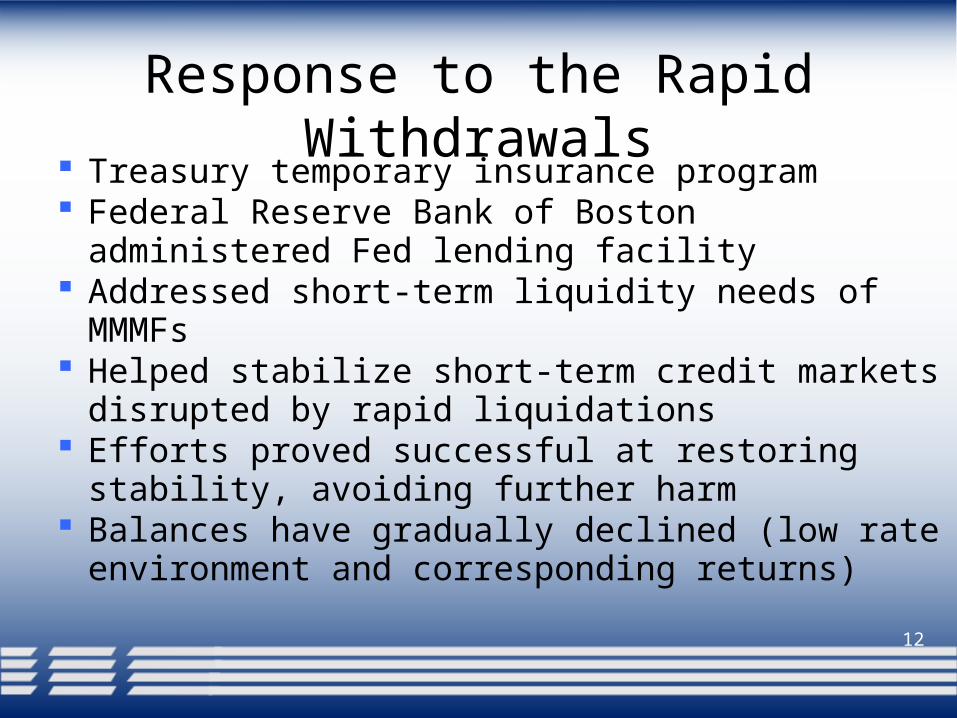
Response to the Rapid Withdrawals
Treasury temporary insurance program Federal Reserve Bank of Boston administered
Fed lending facility Addressed short-term liquidity needs of MMMFs Helped stabilize short-term credit markets
disrupted by rapid liquidations Efforts proved successful at restoring stability,
avoiding further harm Balances have gradually declined (low rate
environment and corresponding returns)12
13
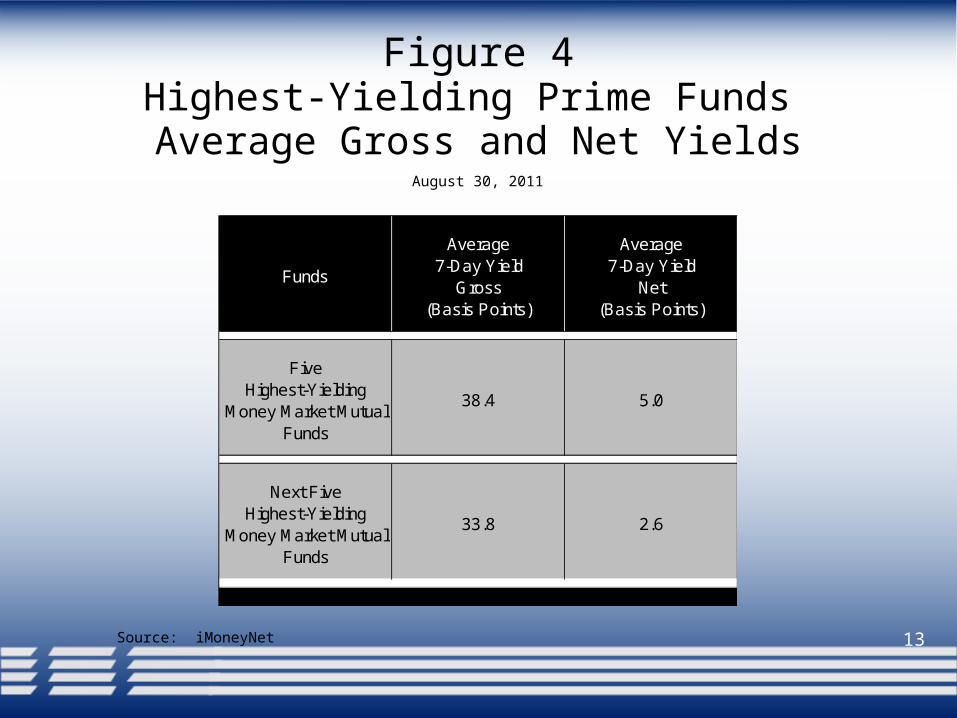
Figure 4Highest-Yielding Prime Funds Average Gross and Net Yields
Source: iMoneyNet
August 30, 2011
Funds
Average 7-Day Yield
Gross (Basis Points)
Average 7-Day Yield
Net (Basis Points)
Five Highest-Yielding
Money Market Mutual Funds
38.4 5.0
Next Five Highest-Yielding
Money Market Mutual Funds
33.8 2.6

14
Figure 5Foreign Exposure of Five Largest Prime
Money Market Mutual Funds
Source: Crane Data, Mutual Fund Company Websites
As of February 28, 2011 and August 31, 2011
-20
0
20
40
60
80
TotalForeign
Europe France UK Germany Italy
as of February 28, 2011
as of August 31, 2011
Change (Percentage Point Difference)
Percent
Financial Stability and MMMFs
Actions have been taken recently – improved liquidity and monthly reporting of holdings
Credit risk and MMMFs holdings Is the current structure appropriate given the
critical role of MMMFs to short-term credit markets?
15
No One Proposal has beenSettled on – My Preferred Approach
A meaningful capital-like buffer – perhaps 3%
If violated, automatically leads to conversion to a floating NAV
If plan for a buffer isn’t produced and accepted, require MMMFs to float NAV
16
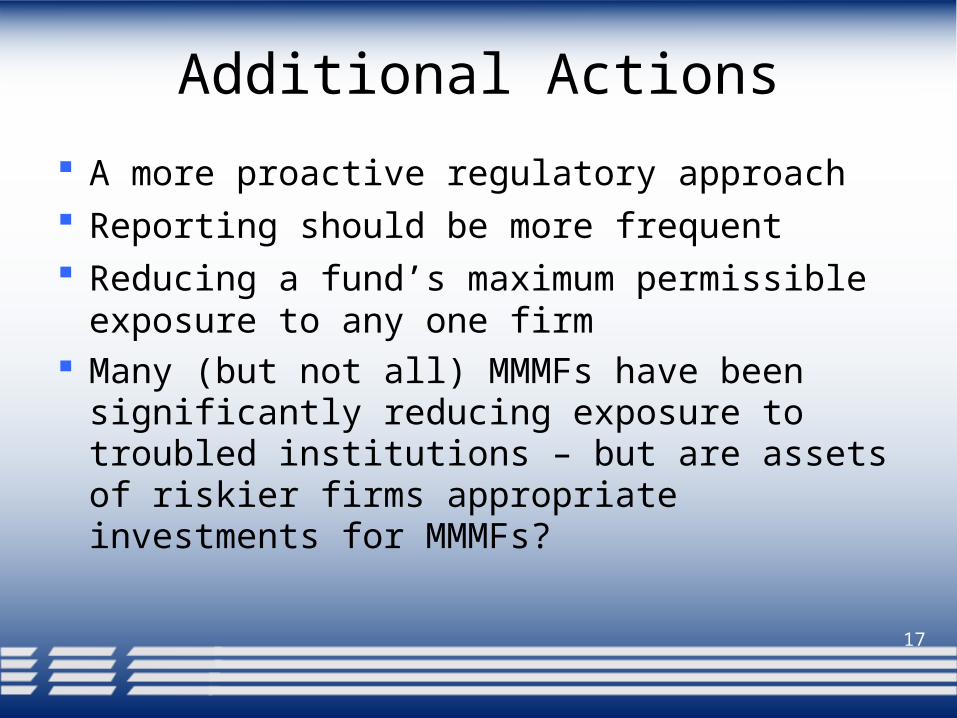
Additional Actions
A more proactive regulatory approach Reporting should be more frequent Reducing a fund’s maximum permissible
exposure to any one firm Many (but not all) MMMFs have been
significantly reducing exposure to troubled institutions – but are assets of riskier firms appropriate investments for MMMFs?
17

MMMFs are Intertwined with Another Systemic Risk Issue
Dependence of foreign branches and agencies in the U.S. on short-term wholesale funding
Not able to get deposit insurance or FHLB membership
Issuing jumbo CDs, CP, and repurchase agreements
During times of stress, less stable than retail deposits
18
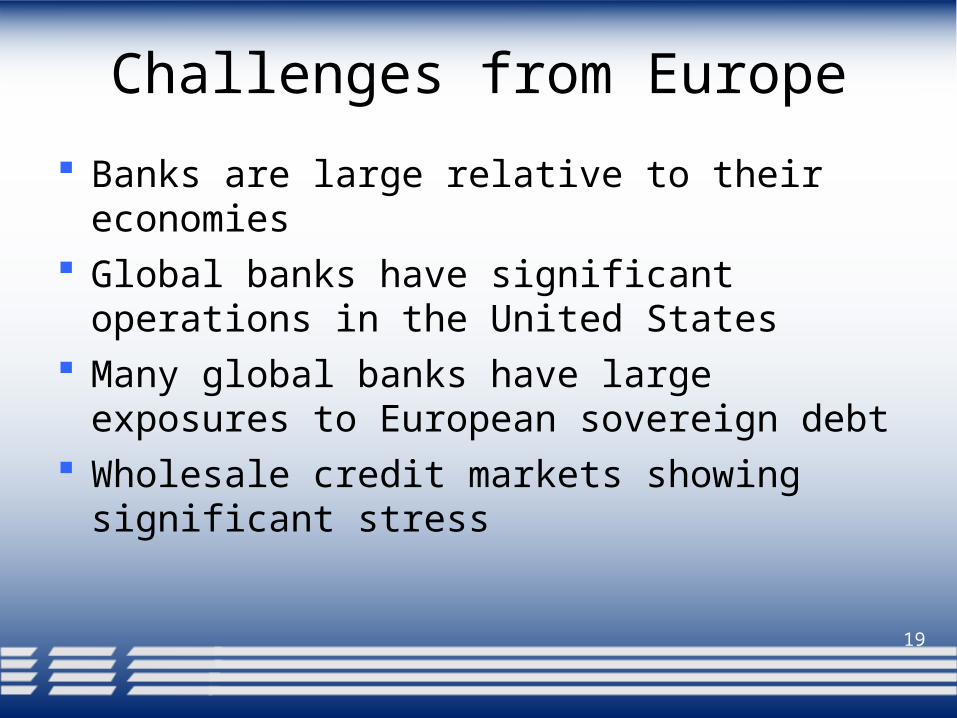
Challenges from Europe
Banks are large relative to their economies Global banks have significant operations in
the United States Many global banks have large exposures to
European sovereign debt Wholesale credit markets showing significant
stress
19

20
Figure 6Bank Size Relative to Country Size:
Assets of Largest Bank as a Share of GDP
Source: Global Finance, IMF
as of Year End 2010
Note: Includes the U.S. and all European countries with a bank ranked in the top 50 worldwide as of year end 2010.
0
50
100
150
200
250
300
Percent
Switzerland
Netherlands
DenmarkSweden
Belgium
SpainUnited
KingdomFrance
GermanyItaly
United States
21
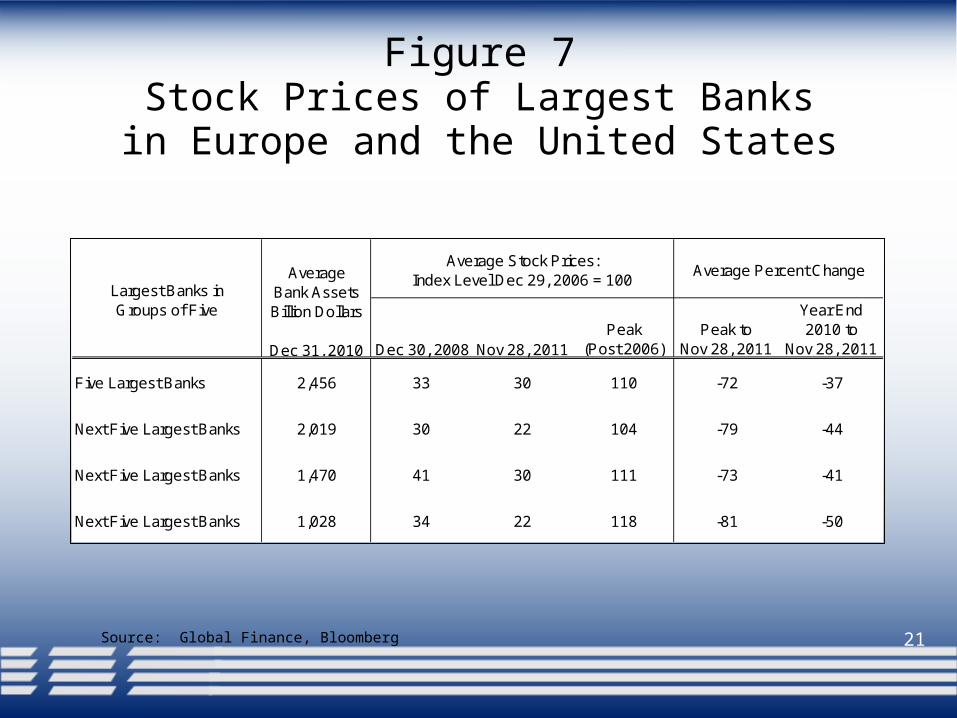
Figure 7Stock Prices of Largest Banks
in Europe and the United States
Source: Global Finance, Bloomberg
Dec 30, 2008 Nov 28, 2011Peak
(Post 2006)Peak to
Nov 28, 2011
Year End 2010 to
Nov 28, 2011
2,456 33 30 110 -72 -37
2,019 30 22 104 -79 -44
1,470 41 30 111 -73 -41
1,028 34 22 118 -81 -50
Largest Banks in Groups of Five
Next Five Largest Banks
Average Percent ChangeAverage Stock Prices:
Index Level Dec 29, 2006 = 100Average Bank Assets Billion Dollars sssssssssss Dec 31, 2010
Five Largest Banks
Next Five Largest Banks
Next Five Largest Banks
Final Thoughts
Financial markets remain stressed Many global banks are experiencing
wholesale funding issues We are not insulated from European stress Political will in many countries is lagging for
directly addressing problems
22


![[Kestävän aluesuunnittelun työkalut käyttöön 3.10.2013] Katriina Rosengren, SYKE: KEKO B-tutkimuskokonaisuus ja tulosodotukset](https://static.fdocument.pub/doc/165x107/547175b4b4af9fae0a8b4bb9/kestaevaen-aluesuunnittelun-tyoekalut-kaeyttoeoen-3102013-katriina-rosengren-syke-keko-b-tutkimuskokonaisuus-ja-tulosodotukset.jpg)