Regional Transportation Telephone Survey Results
162
Southeastern Institute of Research Long Range Transportation Plan Marketing Research Study Prepared By Fall 2009
-
Upload
marti-donley -
Category
Technology
-
view
627 -
download
2
description
Transcript of Regional Transportation Telephone Survey Results
Southeastern Institute of Research
Long Range Transportation Plan Marketing Research
Study
Prepared By
Fall 2009
Southeastern Institute of Research
Table of Contents
• Study Background, Objectives, and Methodology
• Respondent Profile• Detailed Findings:
– Transportation System– Long Range Transportation Plan– Funding
• Strategic Implications• Appendix
2

Southeastern Institute of Research3
Study Background
Objectives & Methodology
Southeastern Institute of Research4
Study Background• This study concept was first introduced in
2008’s UPWP – “Conduct Opinion - Behavioral surveys of regional residents with regard to transportation issues, policies, and regional governance.”
• The study was twice authorized by the FAMPO Policy Committee
– Once in adoption of UPWP– Once in adoption of FAMPO Resolution 08-21
(RSTP funds were then allocated to the study through TIP amendment)
– Both were reviewed by the Technical Committee and the Transportation Advisory Committee
Southeastern Institute of Research5
Study BackgroundContinued
• Following adoption of 2035 Long Range Transportation Plan (LRTP) in January of 2009, SIR was asked (through Kimley-Horn) to develop Task Order Scope
– Objectives developed from scope
– Topics guide developed from objectives (March 2009)
– Questionnaire developed from topics guide (April 2009)
Southeastern Institute of Research6
Survey ObjectivesAs Laid Out in Task Order Scope
• Assess residents’ ratings of the George Washington Region’s existing transportation system overall.
• Identify residents’ expectations – importance ratings – of different aspects of the George Washington Region’s transportation system across key variables such as variety of transportation options, safety, convenience, dependability, ease of getting around, etc.
• Identify residents’ ratings of George Washington Region’s performance in delivering on these same aspects of the region’s transportation system.
• Identify the current gaps in performance.
Southeastern Institute of Research7
Survey Objectives (continued)
• Assess residents’ awareness and familiarity with FAMPO’s 2035 Long Range Transportation Plan (LRTP). Understand residents’ perceptions and misperceptions toward major elements of the 2035 LRTP such as the “Smart Growth” concept.
• Assess the effectiveness of FAMPO’s outreach efforts advancing the 2035 LRTP.
• Assess residents’ opinions regarding alternative transportation funding levels and alternative sources of funds.
Southeastern Institute of Research8
• Collect survey respondents’ demographic information in order to view important subgroups of the population – men/women, commuters outside the region, long-term residents/new residents, etc.
• Through the survey process, build an online residents’ feedback panel that FAMPO may use for future quick polls on different planning issues.
Survey Objectives (continued)
Southeastern Institute of Research9
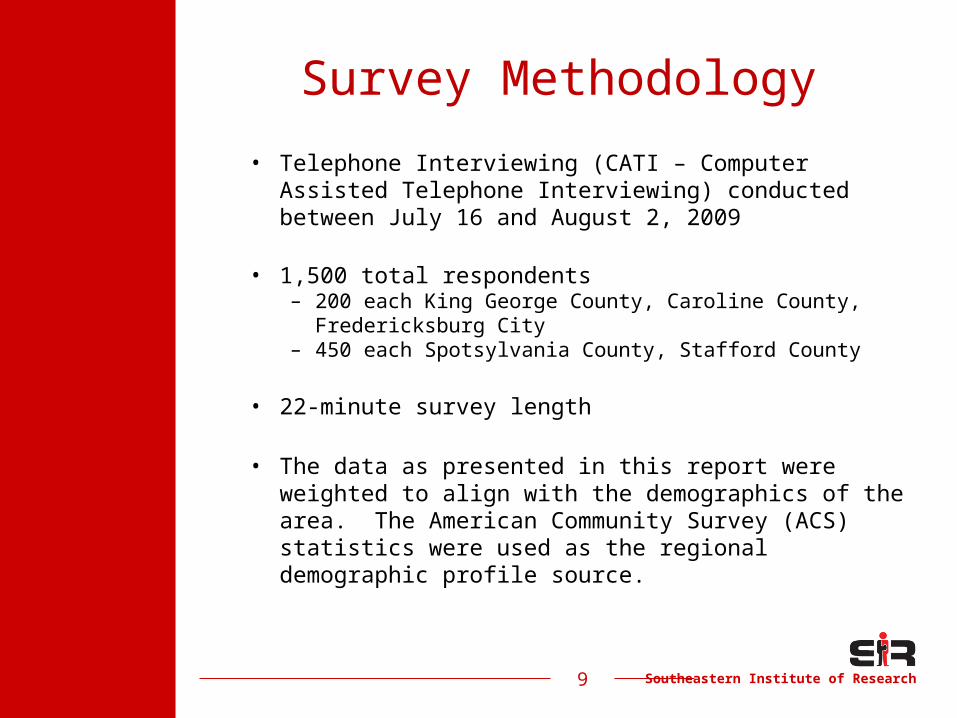
Survey Methodology
• Telephone Interviewing (CATI – Computer Assisted Telephone Interviewing) conducted between July 16 and August 2, 2009
• 1,500 total respondents– 200 each King George County, Caroline County,
Fredericksburg City– 450 each Spotsylvania County, Stafford County
• 22-minute survey length
• The data as presented in this report were weighted to align with the demographics of the area. The American Community Survey (ACS) statistics were used as the regional demographic profile source.
Southeastern Institute of Research
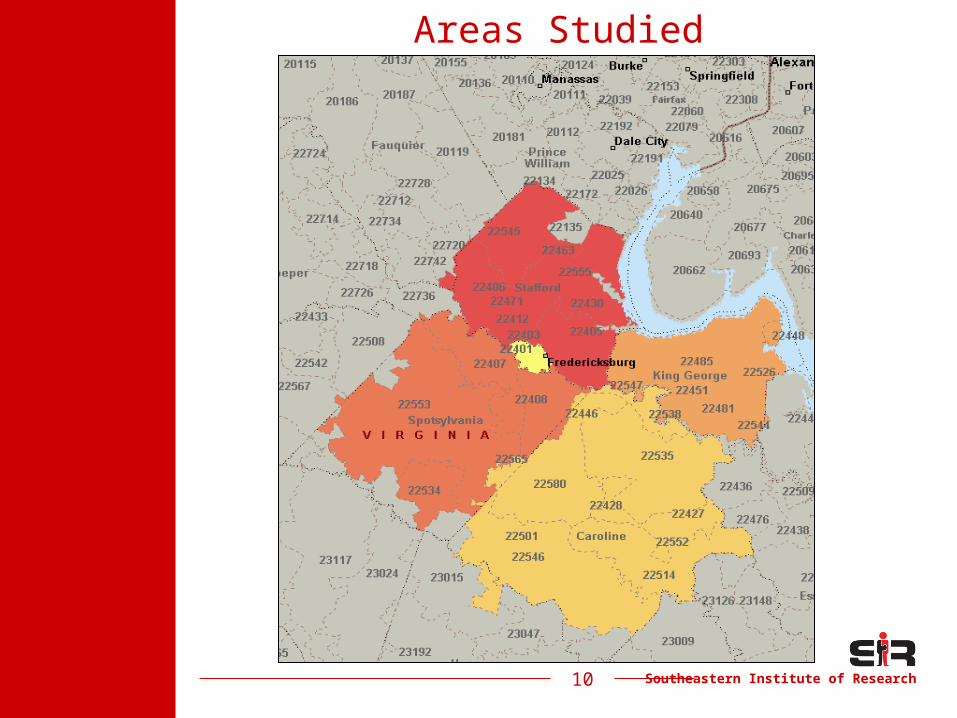
Areas Studied
10
Southeastern Institute of Research11
RespondentProfile
Southeastern Institute of Research
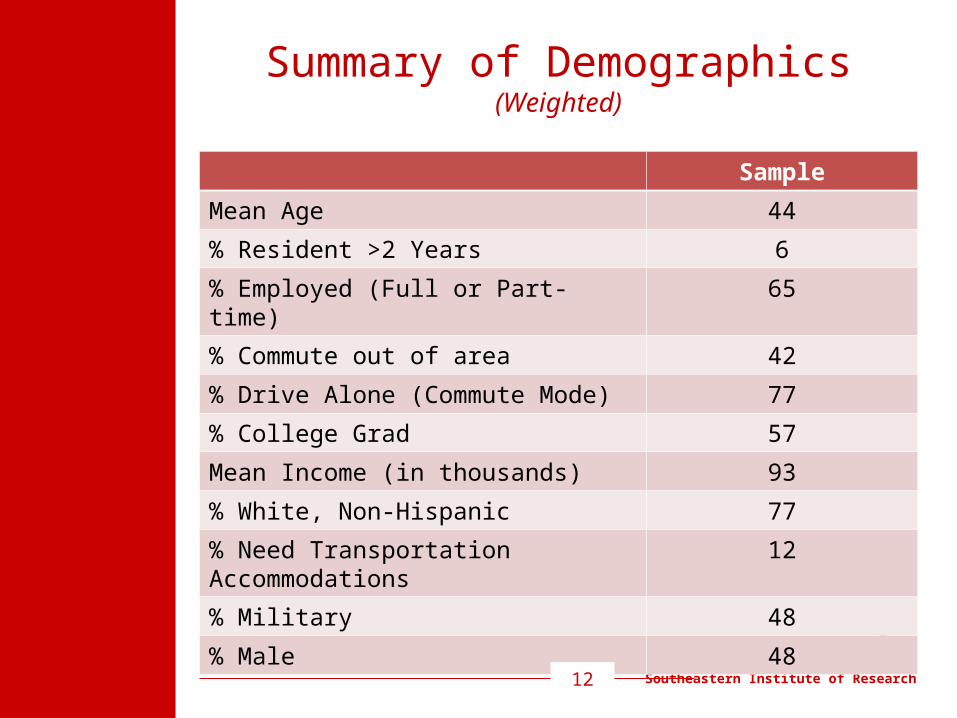
Summary of Demographics(Weighted)
Sample
Mean Age 44
% Resident >2 Years 6
% Employed (Full or Part-time) 65
% Commute out of area 42
% Drive Alone (Commute Mode) 77
% College Grad 57
Mean Income (in thousands) 93
% White, Non-Hispanic 77
% Need Transportation Accommodations
12
% Military 48
% Male 48
12
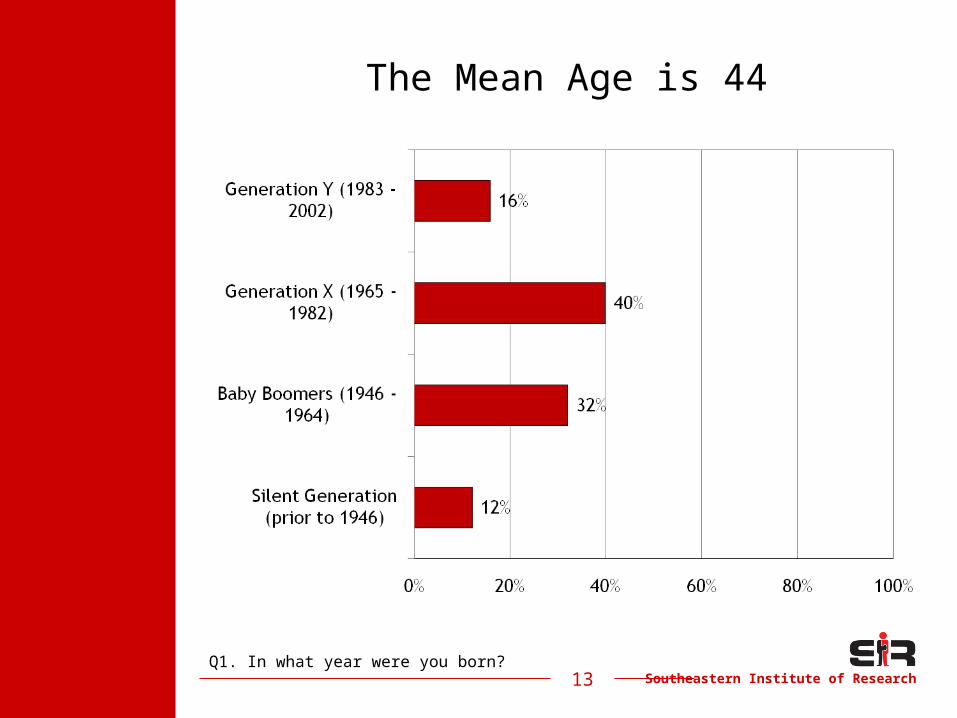
Southeastern Institute of Research13
The Mean Age is 44
Q1. In what year were you born?
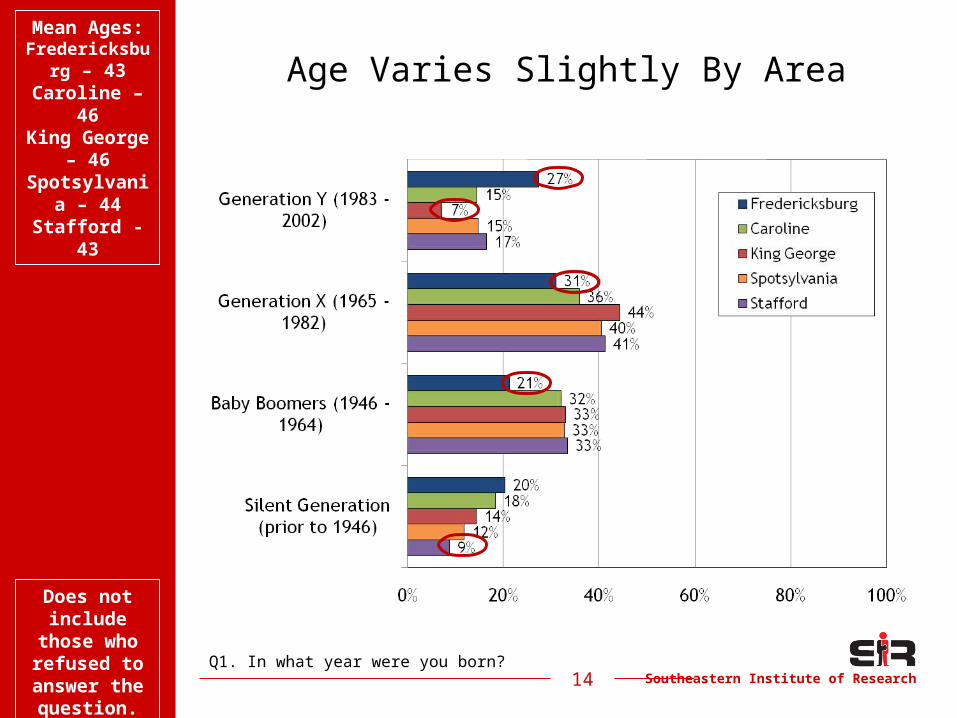
Southeastern Institute of Research14
Age Varies Slightly By Area
Does not include
those who refused to answer the question.
Mean Ages:Fredericksb
urg – 43Caroline –
46King
George – 46Spotsylvani
a – 44Stafford -
43
Q1. In what year were you born?
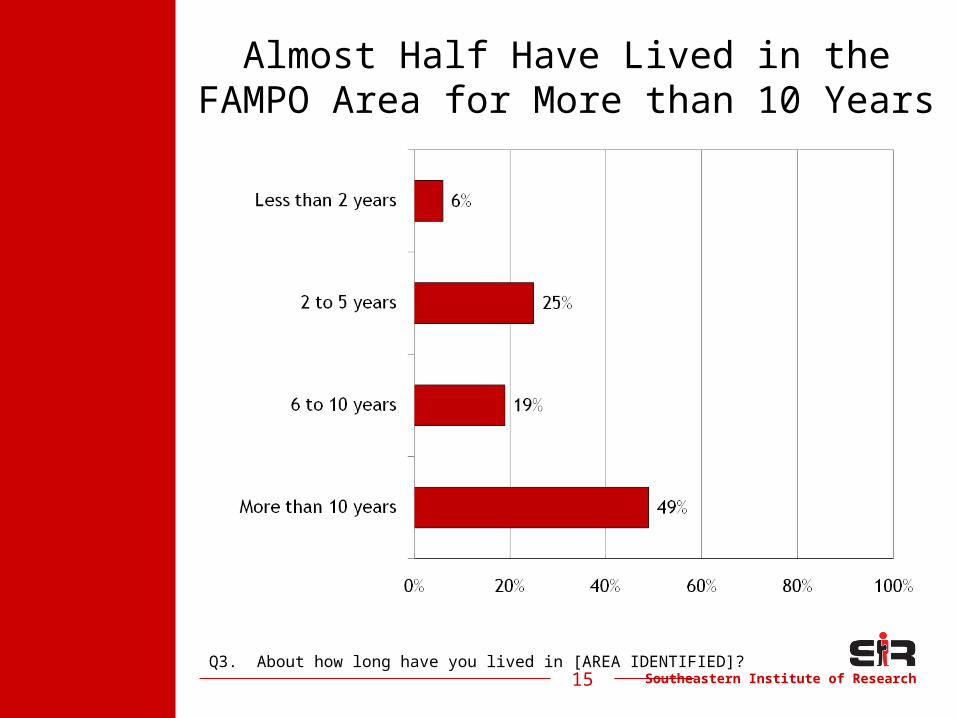
Southeastern Institute of Research15
Almost Half Have Lived in the FAMPO Area for More than 10 Years
Q3. About how long have you lived in [AREA IDENTIFIED]?
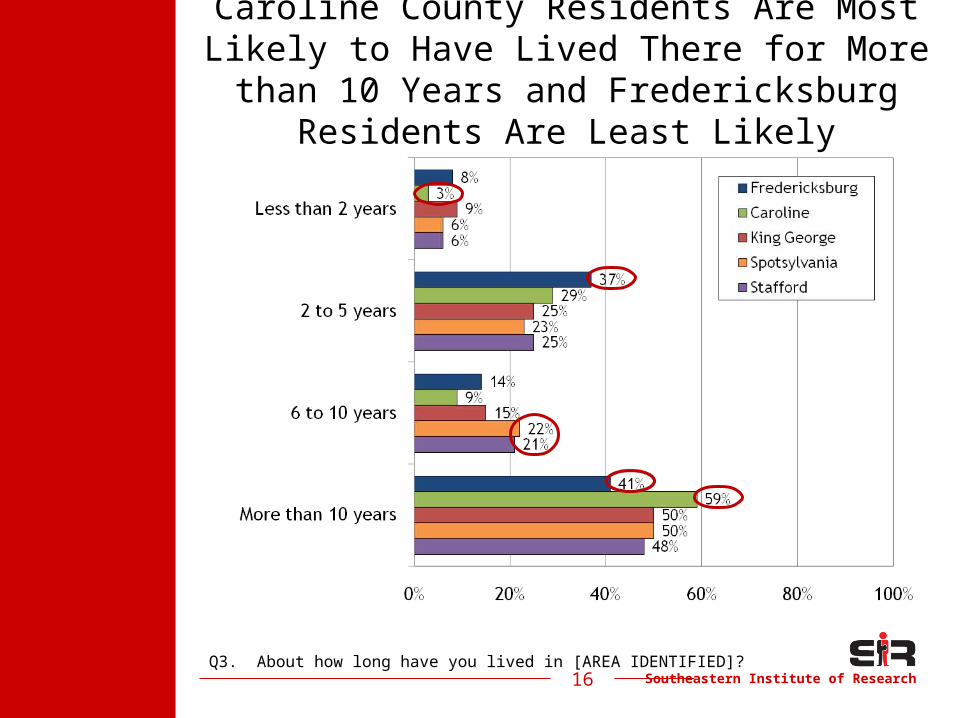
Southeastern Institute of Research16
Caroline County Residents Are Most Likely to Have Lived There for More than 10
Years and Fredericksburg Residents Are Least Likely
Q3. About how long have you lived in [AREA IDENTIFIED]?
Southeastern Institute of Research17
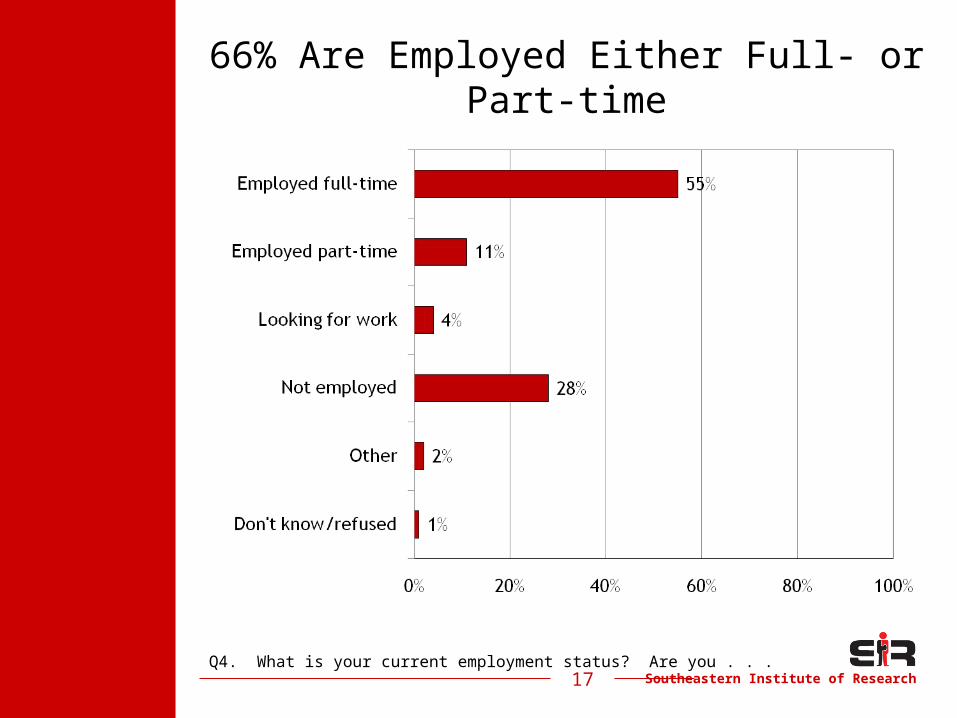
66% Are Employed Either Full- or Part-time
Q4. What is your current employment status? Are you . . .
Southeastern Institute of Research18
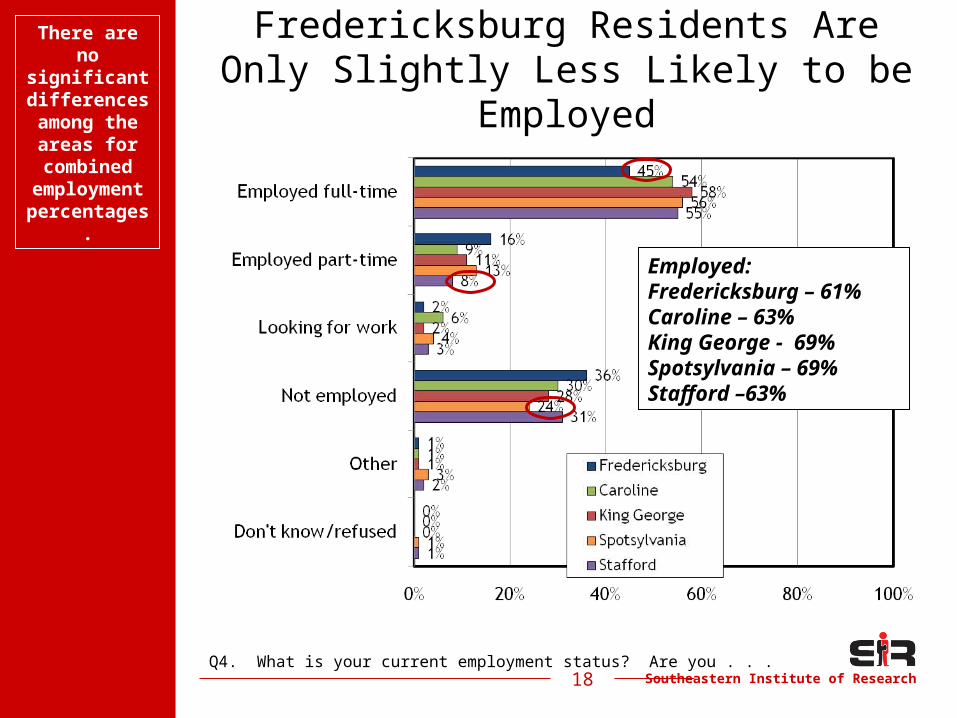
Fredericksburg Residents AreOnly Slightly Less Likely to be
Employed
Q4. What is your current employment status? Are you . . .
Employed:Fredericksburg – 61%Caroline – 63%King George - 69%Spotsylvania – 69%Stafford –63%
There are no
significant differences among the areas for combined
employment
percentages.
Southeastern Institute of Research19
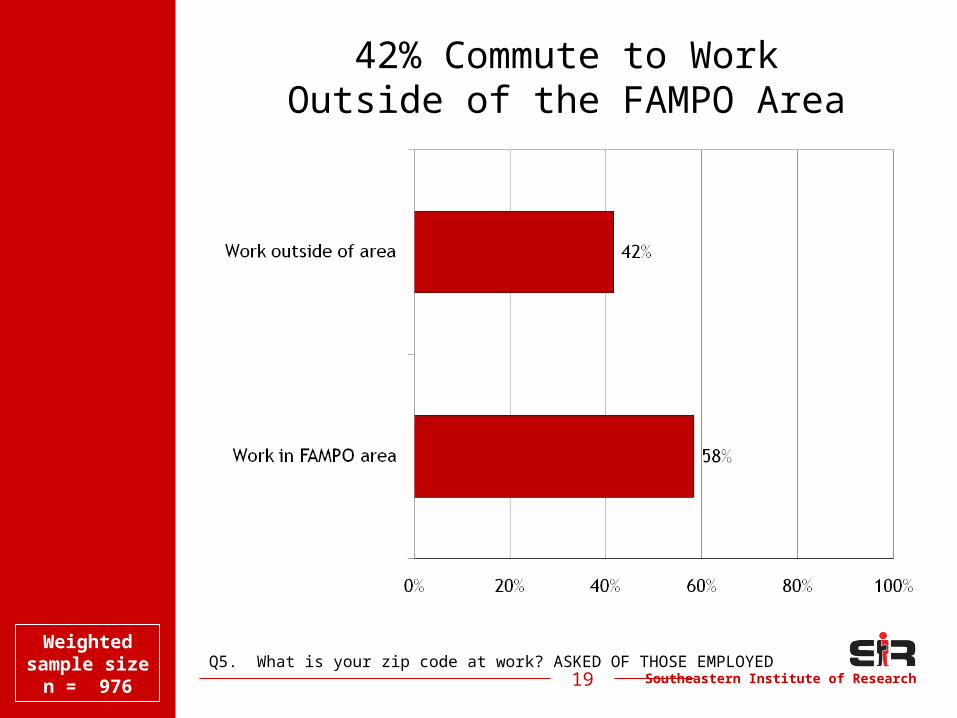
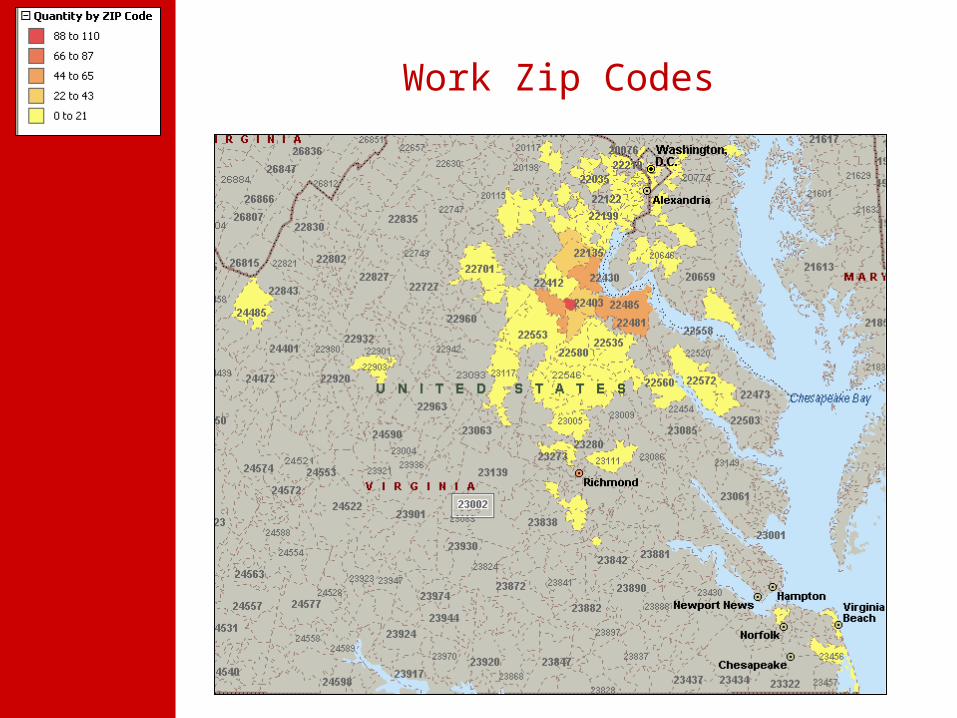
42% Commute to WorkOutside of the FAMPO Area
Q5. What is your zip code at work? ASKED OF THOSE EMPLOYEDWeighted
sample size n = 976
Southeastern Institute of Research20
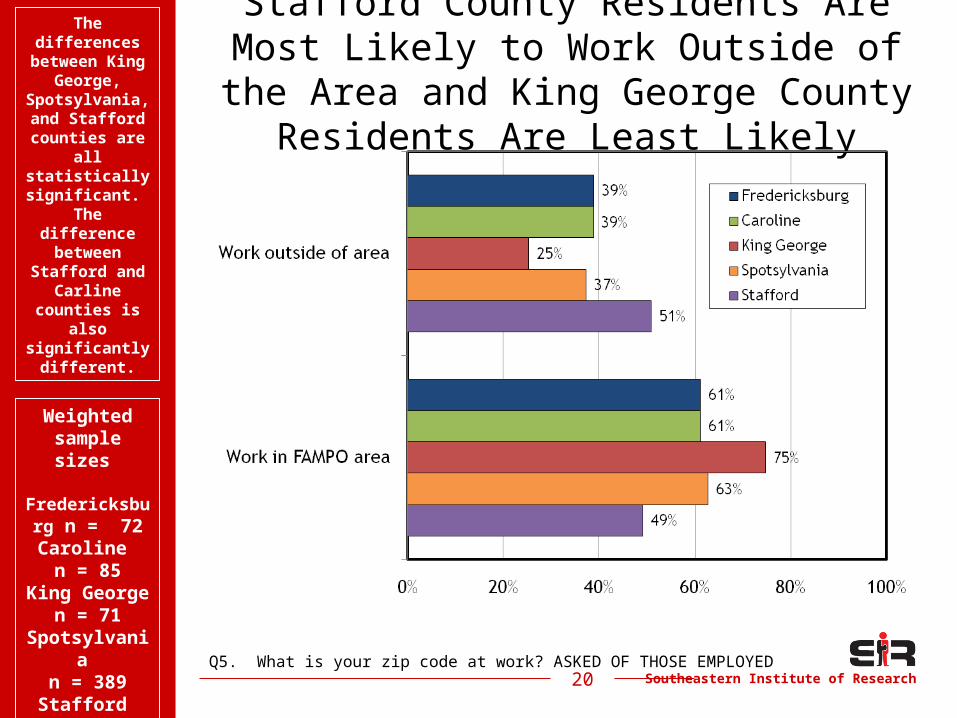
Stafford County Residents Are Most Likely to Work Outside of the Area and
King George County Residents Are Least Likely
Q5. What is your zip code at work? ASKED OF THOSE EMPLOYED
Weighted sample sizes
Fredericksburg n = 72Caroline n = 85King
George n = 71
Spotsylvania
n = 389Stafford n = 358
The differences
between King George,
Spotsylvania, and Stafford counties are
all statistically significant.
The difference between
Stafford and Carline
counties is also
significantly different.
Southeastern Institute of Research
Work Zip Codes
21
Southeastern Institute of Research22
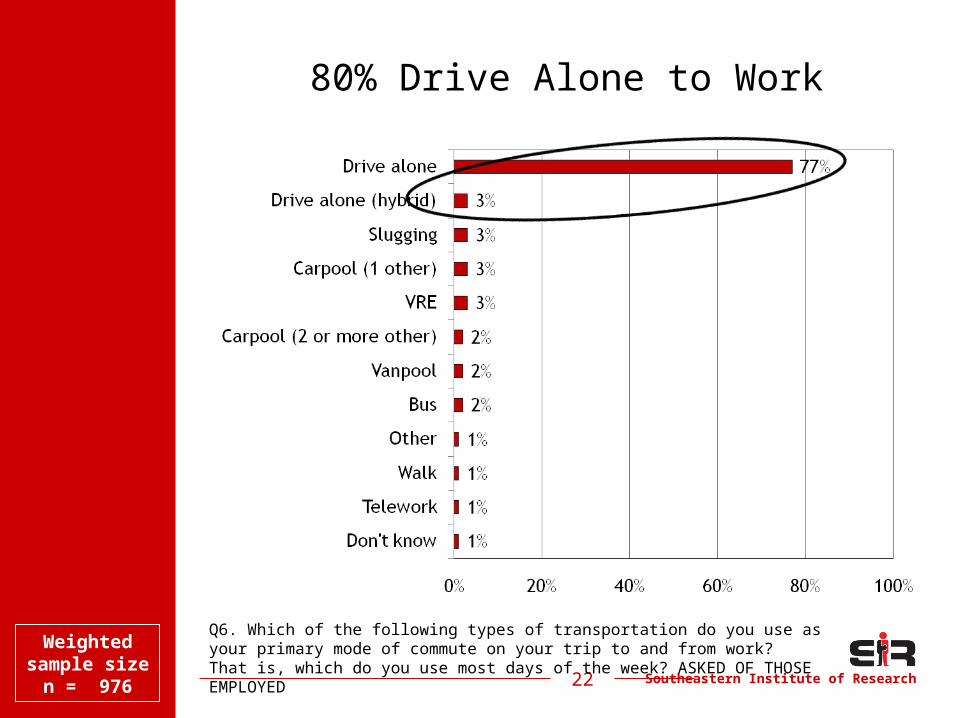
80% Drive Alone to Work
Q6. Which of the following types of transportation do you use as your primary mode of commute on your trip to and from work? That is, which do you use most days of the week? ASKED OF THOSE EMPLOYED
Weighted sample size
n = 976
Southeastern Institute of Research23
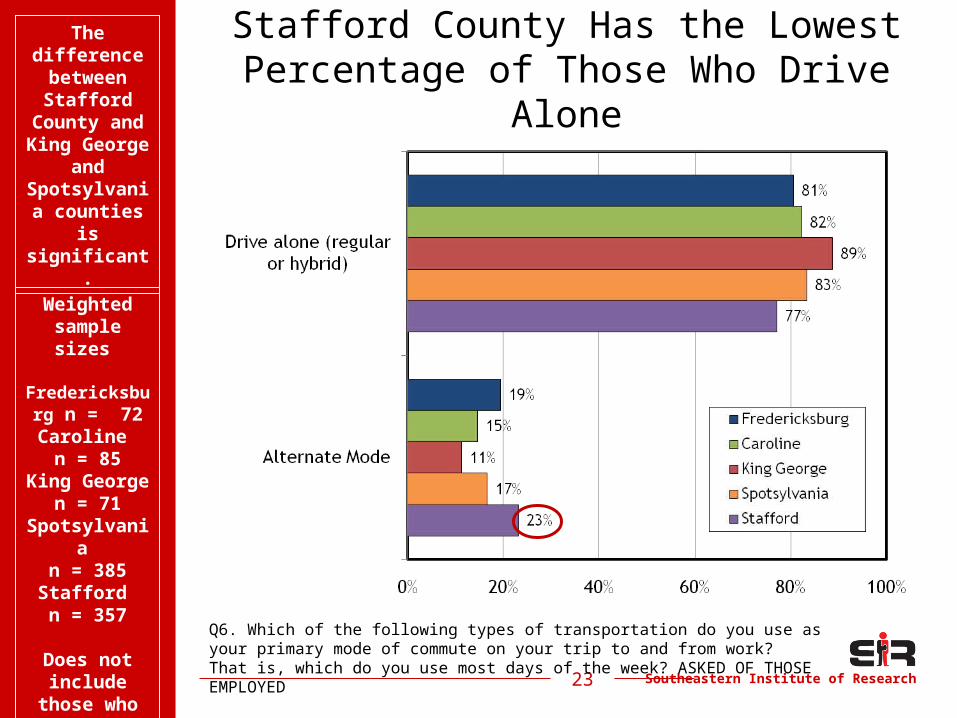
Stafford County Has the LowestPercentage of Those Who Drive Alone
Weighted sample sizes
Fredericksburg n = 72Caroline n = 85King
George n = 71
Spotsylvania
n = 385Stafford n = 357
Does not include
those who did not answer
Q6. Which of the following types of transportation do you use as your primary mode of commute on your trip to and from work? That is, which do you use most days of the week? ASKED OF THOSE EMPLOYED
The difference between Stafford
County and King
George and Spotsylvania counties
is significant.
Southeastern Institute of Research24
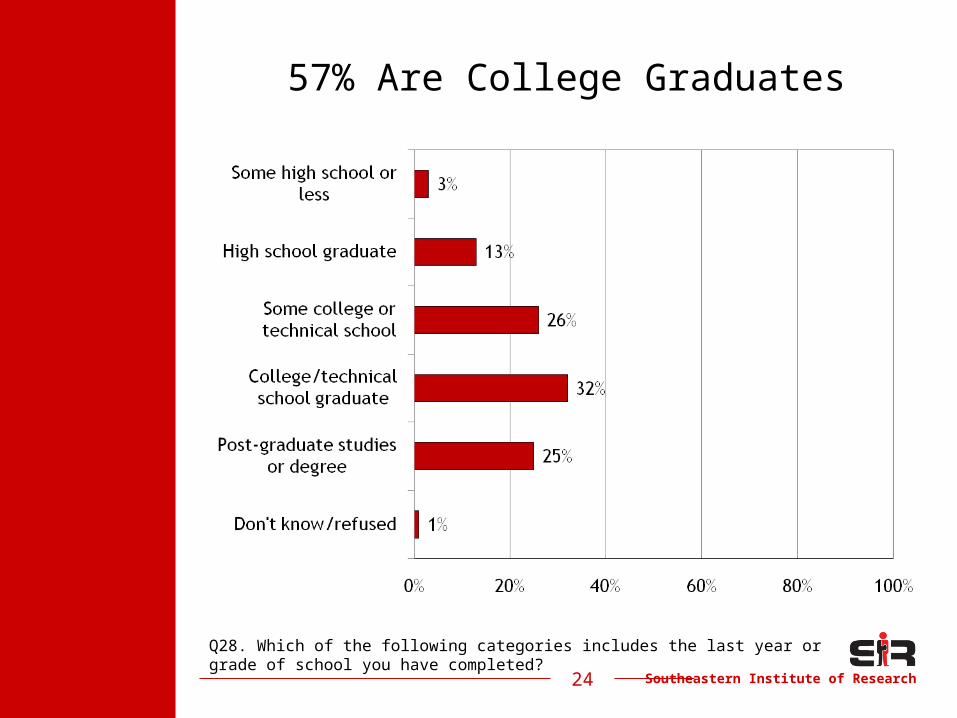
57% Are College Graduates
Q28. Which of the following categories includes the last year or grade of school you have completed?
Southeastern Institute of Research25
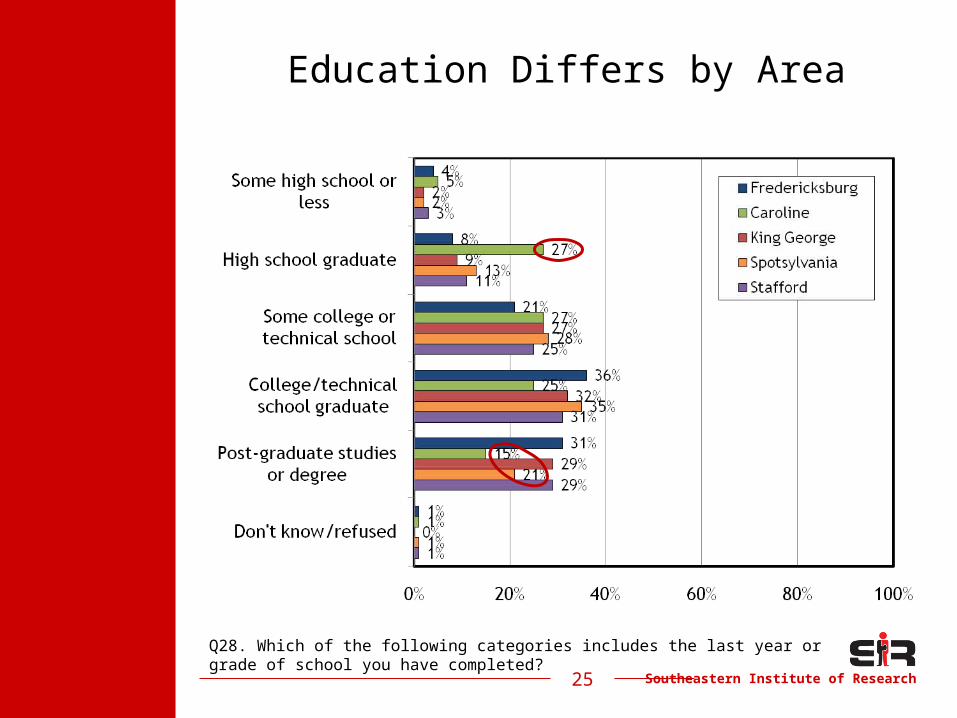
Education Differs by Area
Q28. Which of the following categories includes the last year or grade of school you have completed?
Southeastern Institute of Research26
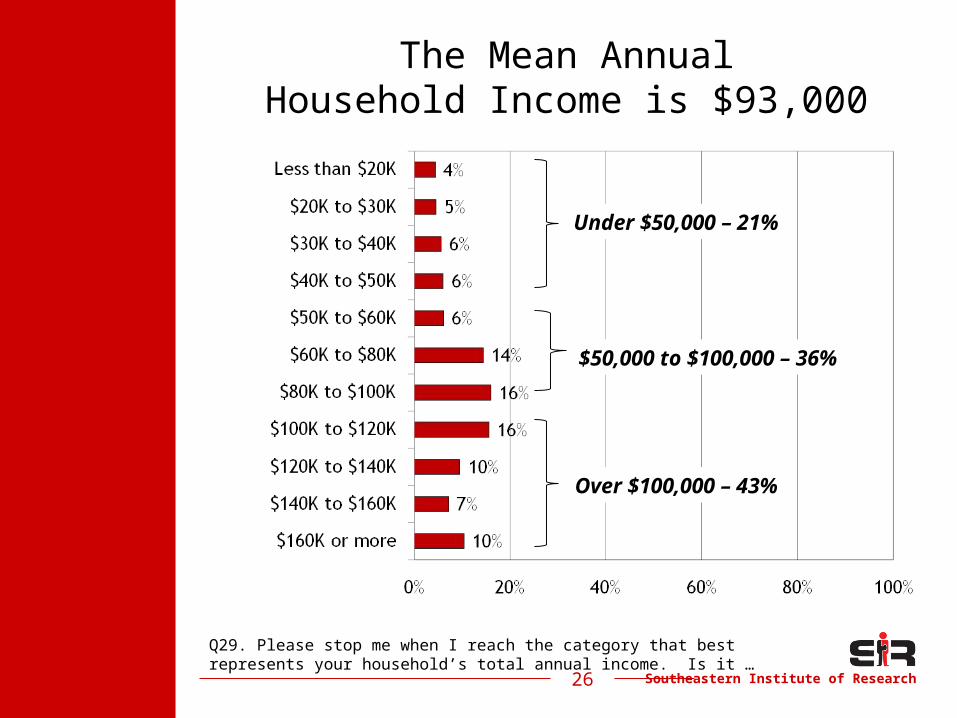
The Mean AnnualHousehold Income is $93,000
Q29. Please stop me when I reach the category that best represents your household’s total annual income. Is it …
Under $50,000 – 21%
$50,000 to $100,000 – 36%
Over $100,000 – 43%
Southeastern Institute of Research27
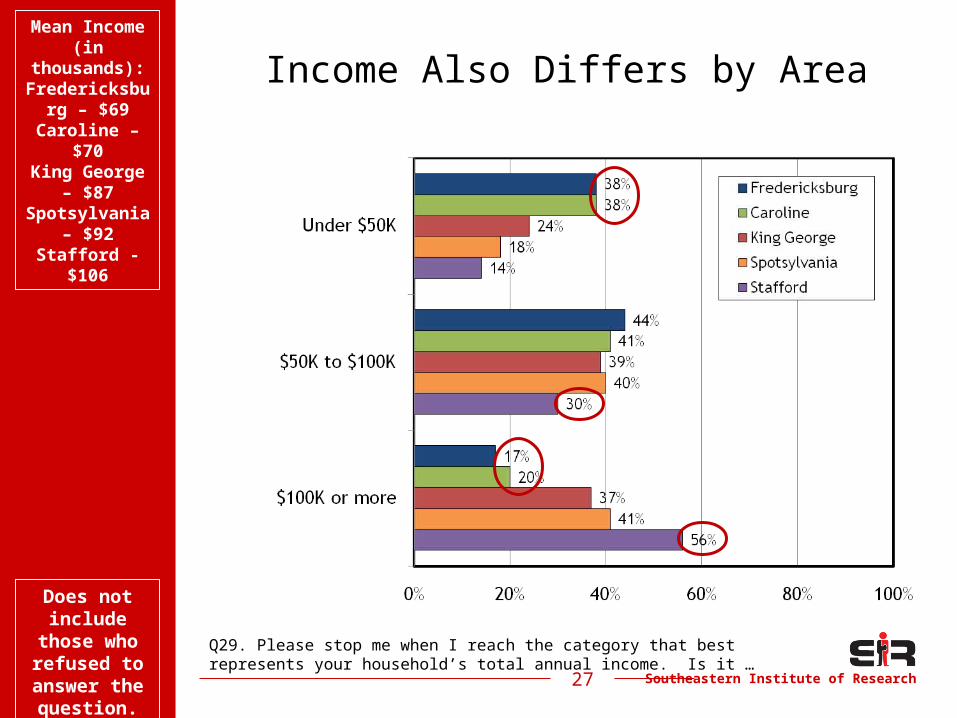
Income Also Differs by Area
Q29. Please stop me when I reach the category that best represents your household’s total annual income. Is it …
Does not include
those who refused to answer the question.
Mean Income (in
thousands):Fredericksb
urg – $69Caroline –
$70King George
– $87Spotsylvania
– $92Stafford -
$106
Southeastern Institute of Research28
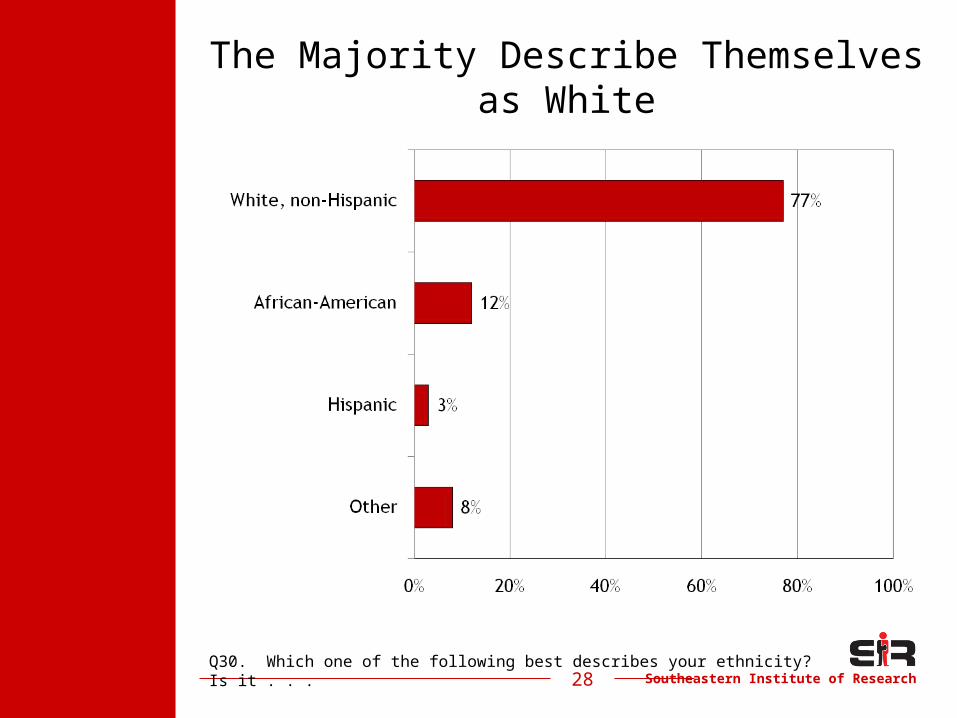
The Majority Describe Themselves as White
Q30. Which one of the following best describes your ethnicity? Is it . . .
Southeastern Institute of Research29
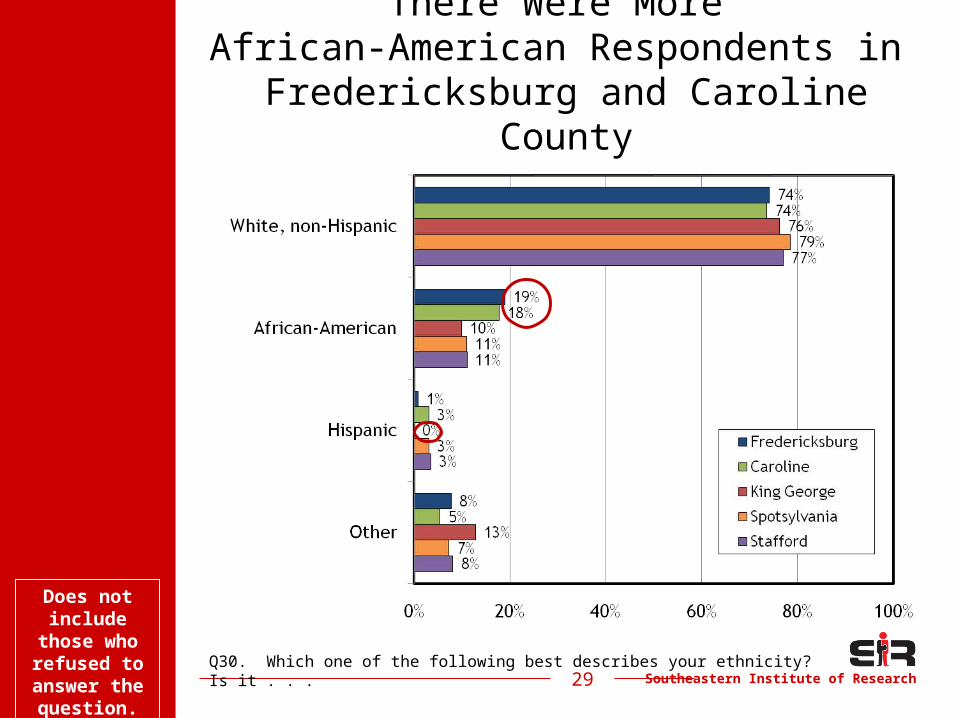
There Were More African-American Respondents in
Fredericksburg and Caroline County
Does not include
those who refused to answer the question.
Q30. Which one of the following best describes your ethnicity? Is it . . .
Southeastern Institute of Research30
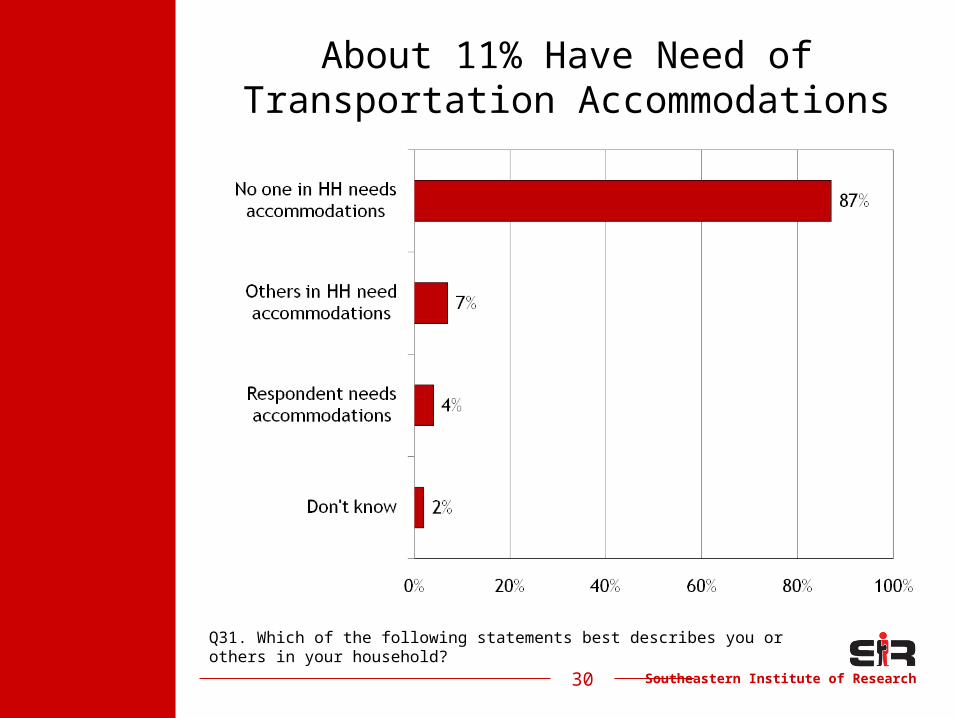
About 11% Have Need ofTransportation Accommodations
Q31. Which of the following statements best describes you or others in your household?
Southeastern Institute of Research31
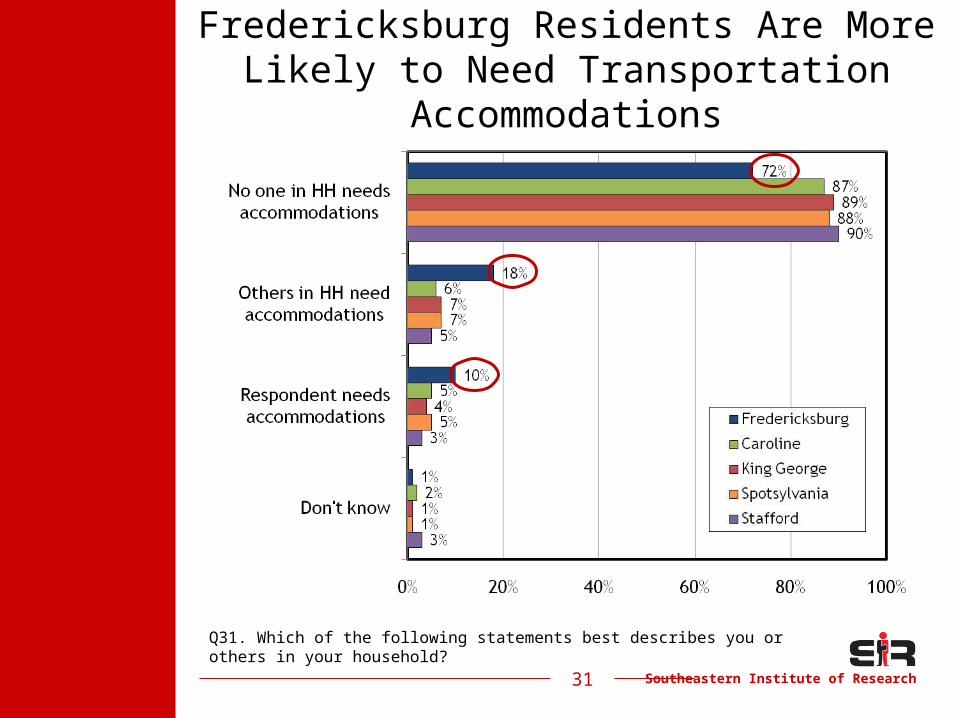
Fredericksburg Residents Are More Likely to Need Transportation
Accommodations
Q31. Which of the following statements best describes you or others in your household?
Southeastern Institute of Research32
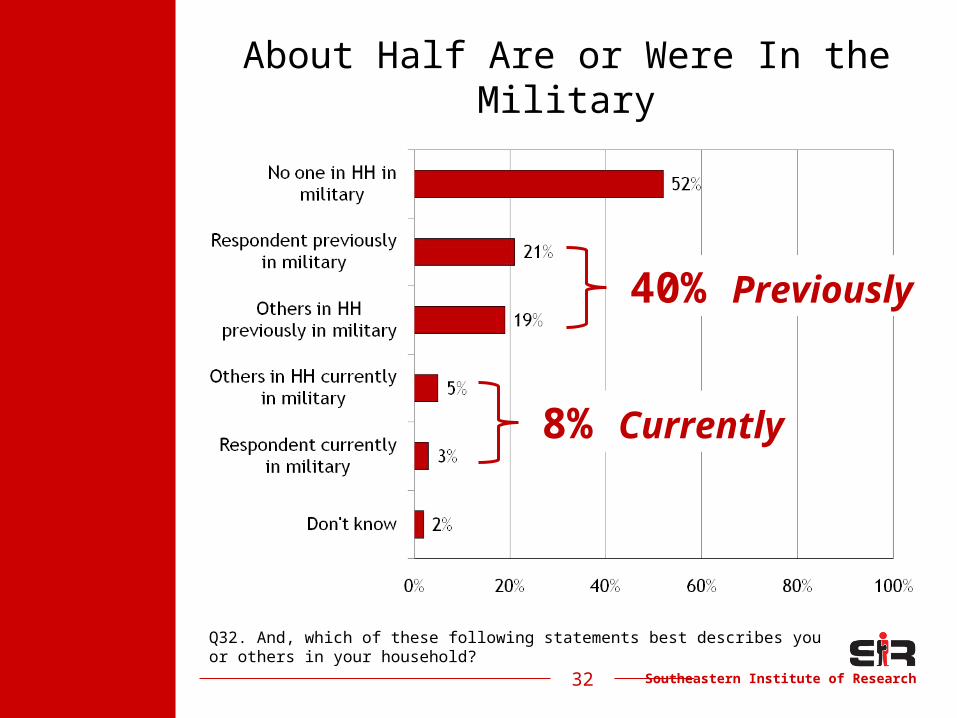
About Half Are or Were In the Military
Q32. And, which of these following statements best describes you or others in your household?
8% Currently
40% Previously
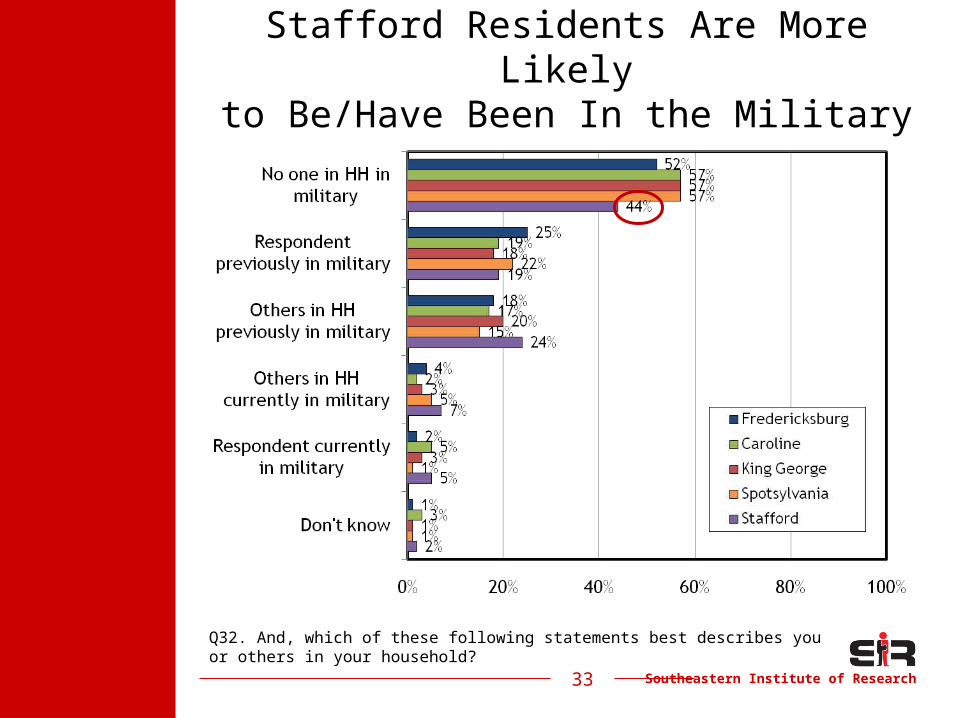
Southeastern Institute of Research33
Stafford Residents Are More Likelyto Be/Have Been In the Military
Q32. And, which of these following statements best describes you or others in your household?
Southeastern Institute of Research34
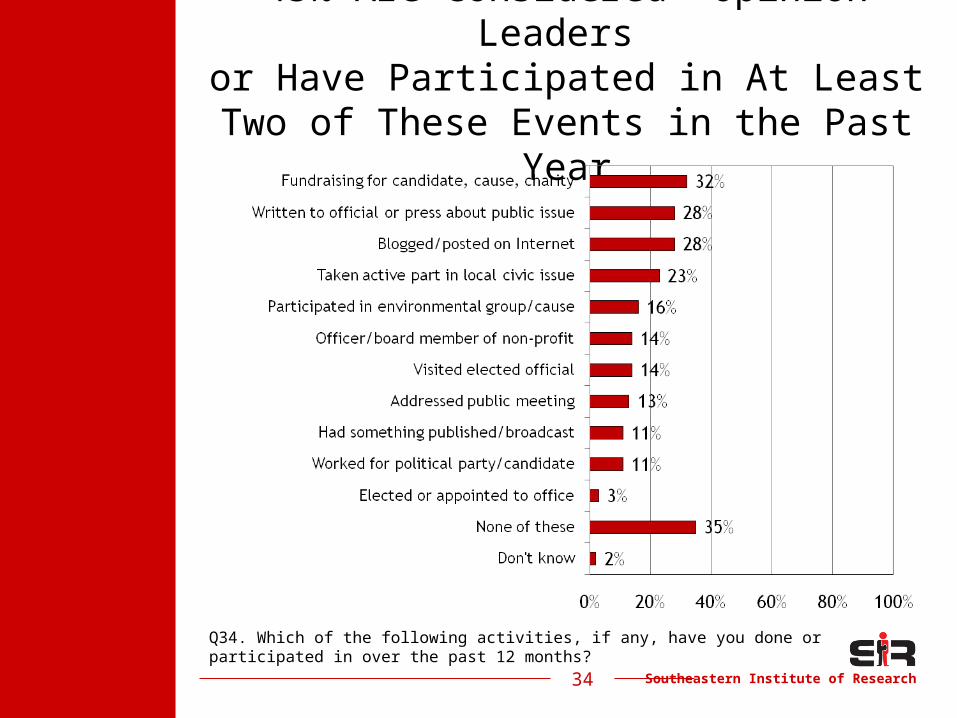
45% Are Considered “Opinion Leaders”or Have Participated in At Least
Two of These Events in the Past Year
Q34. Which of the following activities, if any, have you done or participated in over the past 12 months?
Southeastern Institute of Research35
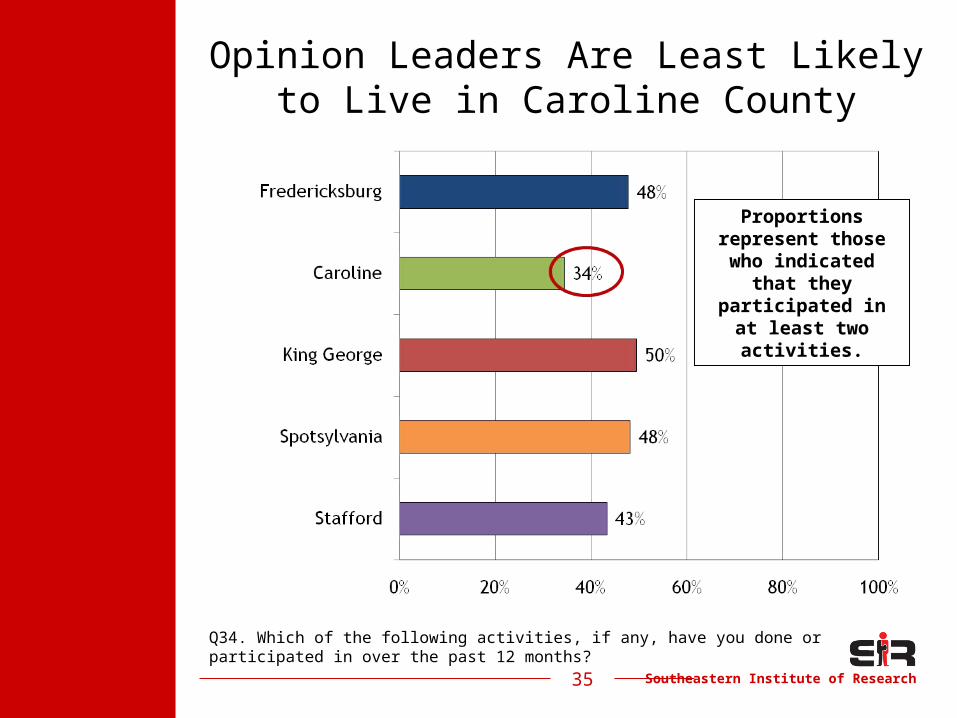
Opinion Leaders Are Least Likelyto Live in Caroline County
Q34. Which of the following activities, if any, have you done or participated in over the past 12 months?
Proportions represent those who indicated
that they participated in at
least two activities.
Southeastern Institute of Research36
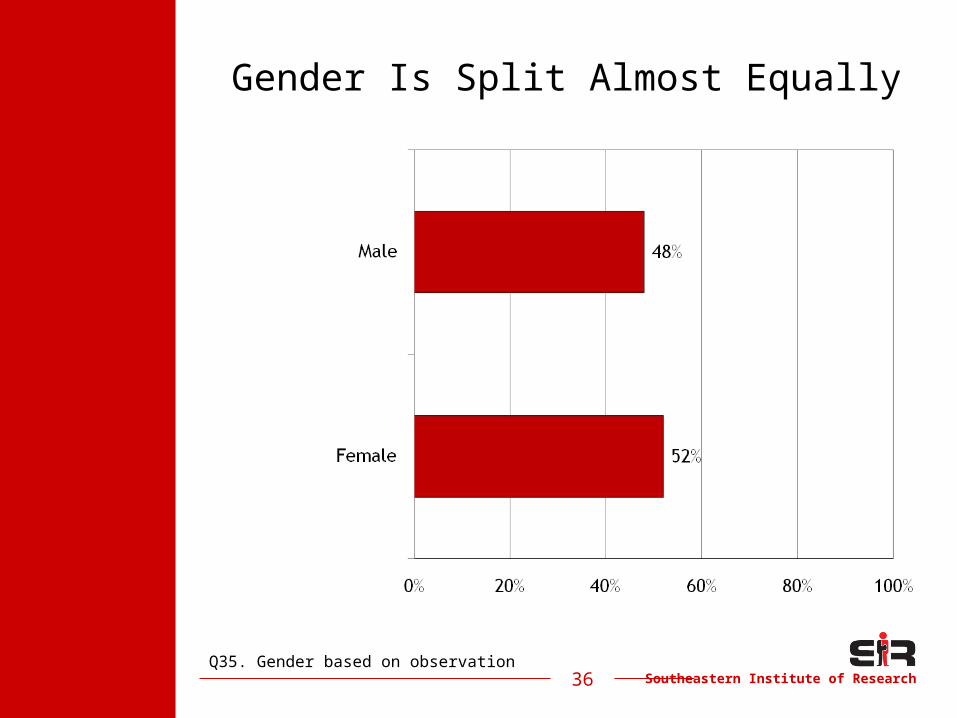
Gender Is Split Almost Equally
Q35. Gender based on observation
Southeastern Institute of Research37
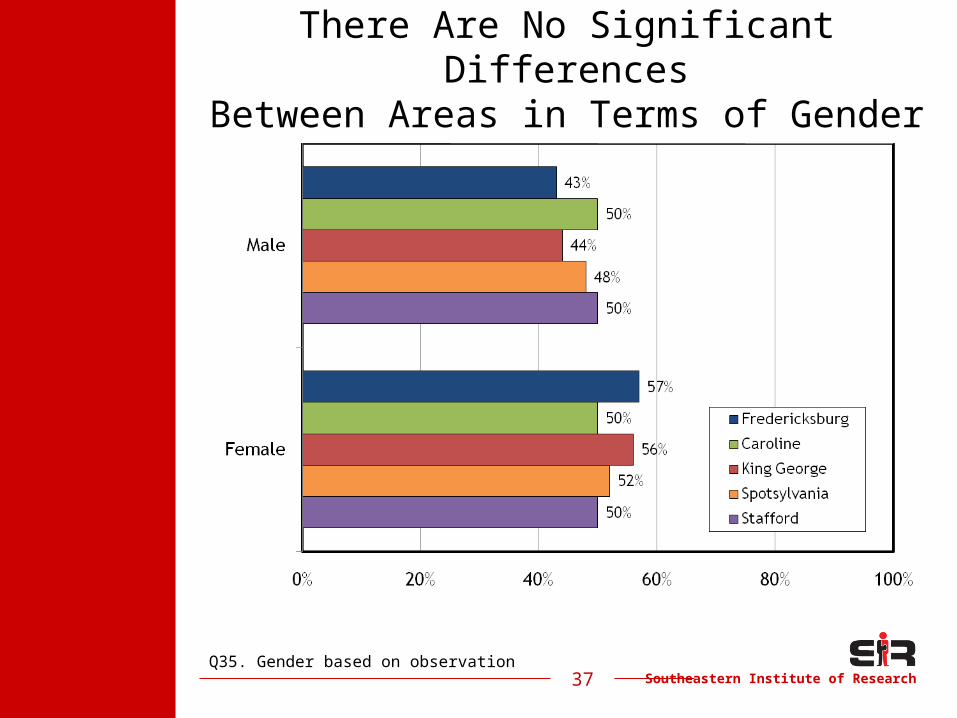
There Are No Significant DifferencesBetween Areas in Terms of Gender
Q35. Gender based on observation
Southeastern Institute of Research38
DetailedFindings
Southeastern Institute of Research39
Transportation System
Southeastern Institute of Research40
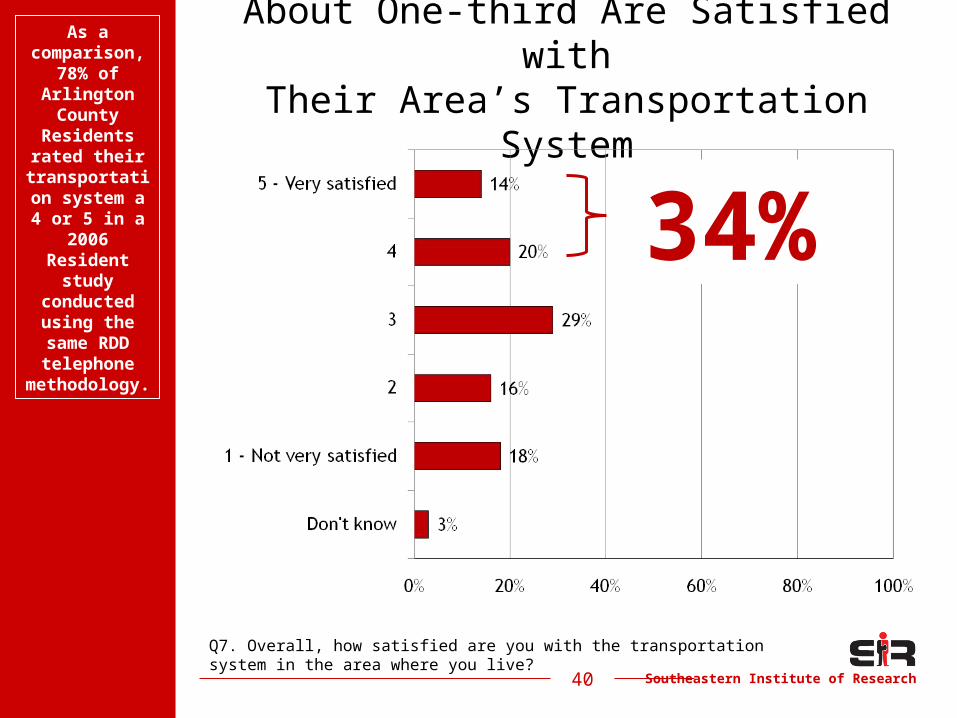
About One-third Are Satisfied withTheir Area’s Transportation System
Q7. Overall, how satisfied are you with the transportation system in the area where you live?
34%
As a comparison,
78% of Arlington County
Residents rated their
transportation system a 4 or 5 in a
2006 Resident
study conducted using the same RDD telephone
methodology.
Southeastern Institute of Research
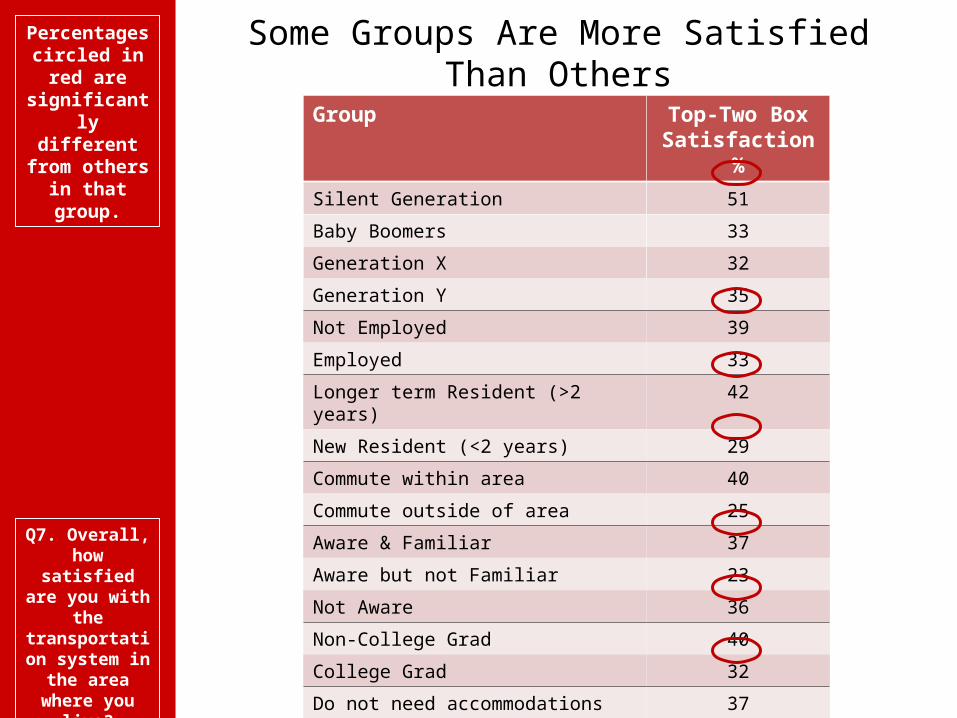
Some Groups Are More Satisfied Than Others
Group Top-Two Box Satisfaction
%
Silent Generation 51
Baby Boomers 33
Generation X 32
Generation Y 35
Not Employed 39
Employed 33
Longer term Resident (>2 years) 42
New Resident (<2 years) 29
Commute within area 40
Commute outside of area 25
Aware & Familiar 37
Aware but not Familiar 23
Not Aware 36
Non-College Grad 40
College Grad 32
Do not need accommodations 37
Need transportation accommodations
19
Percentages circled in
red are significantly different
from others in that group.
Q7. Overall, how
satisfied are you with the transportation system in
the area where you
live?
Southeastern Institute of Research42
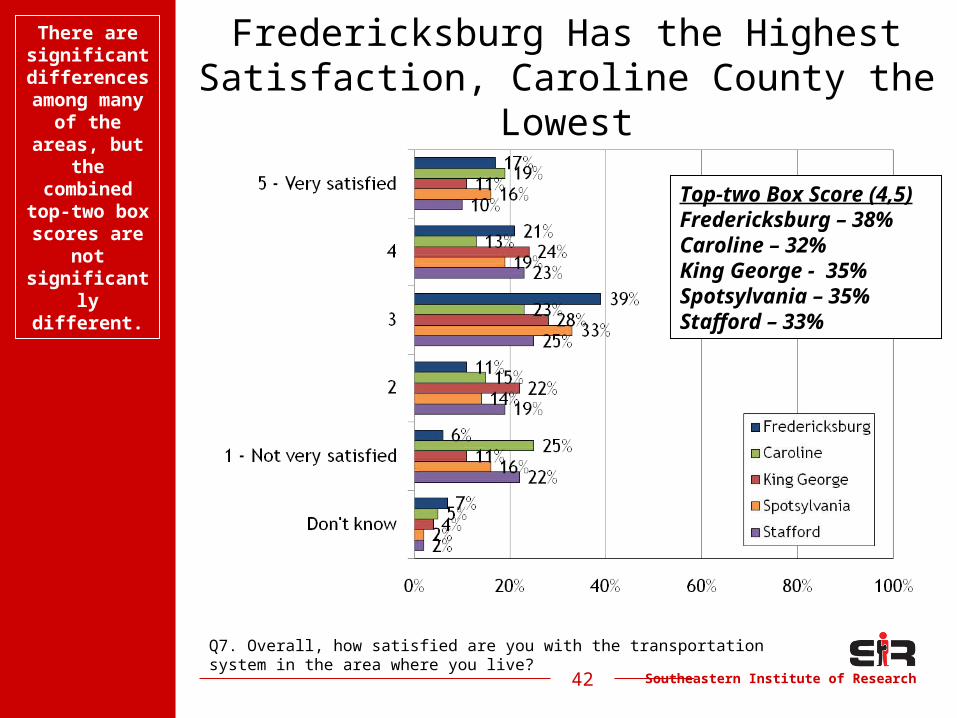
Fredericksburg Has the Highest Satisfaction, Caroline County the
Lowest
Q7. Overall, how satisfied are you with the transportation system in the area where you live?
Top-two Box Score (4,5)Fredericksburg – 38%Caroline – 32%King George - 35%Spotsylvania – 35%Stafford – 33%
There are significant differences
among many of
the areas, but the
combined top-two
box scores are not
significantly different.
Southeastern Institute of Research
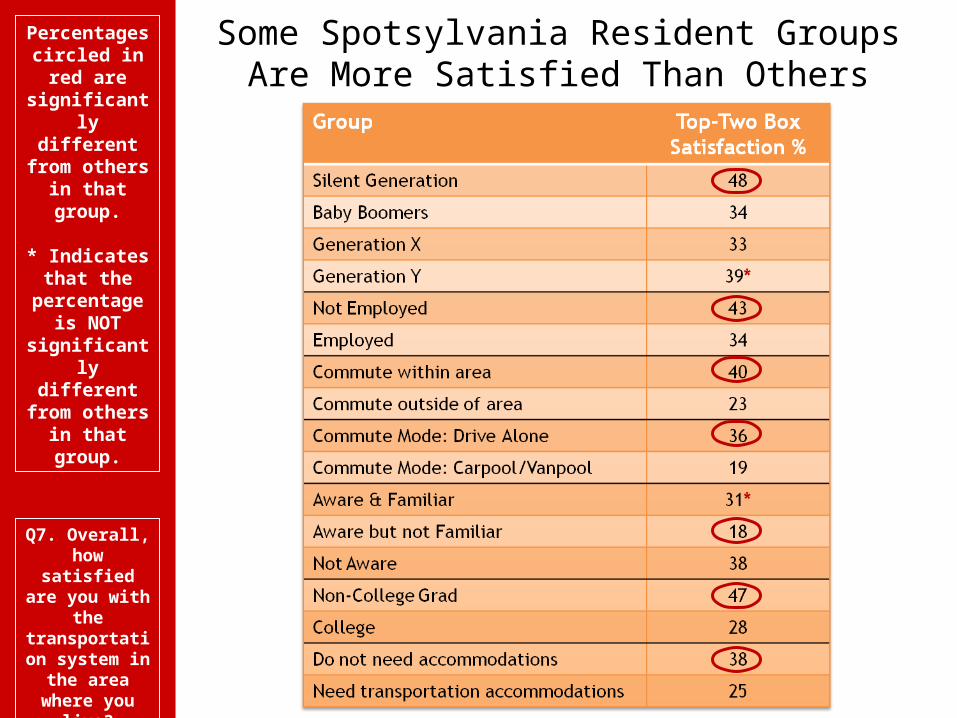
Some Spotsylvania Resident GroupsAre More Satisfied Than Others
Percentages circled in
red are significantly different
from others in that group.
* Indicates that the
percentage is NOT
significantly different
from others in that group.
Q7. Overall, how
satisfied are you with the transportation system in
the area where you
live?
Southeastern Institute of Research
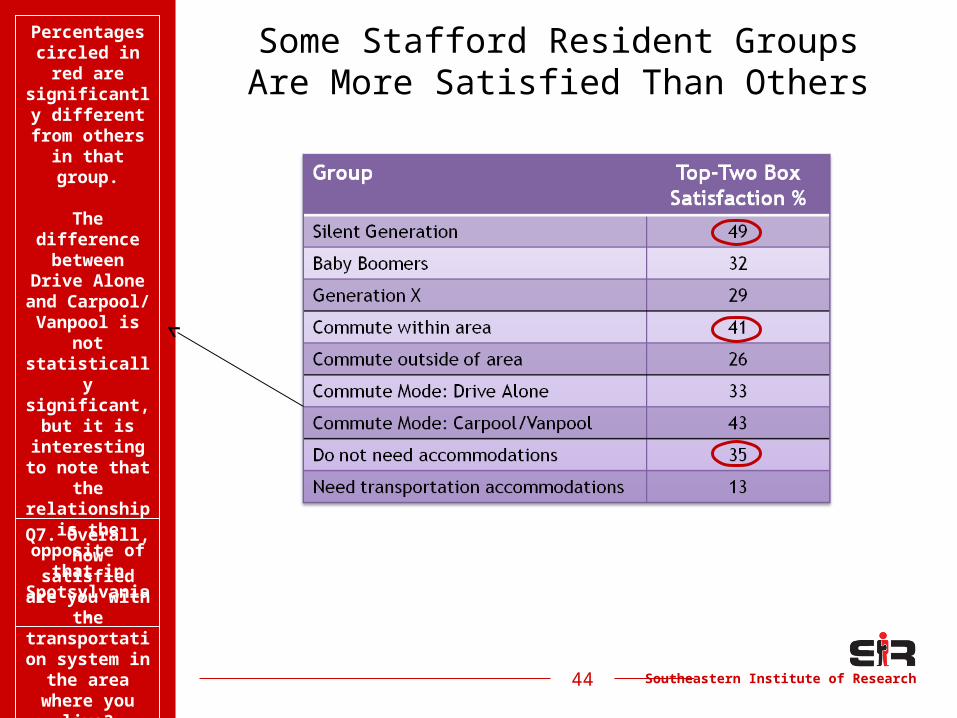
Some Stafford Resident GroupsAre More Satisfied Than Others
Percentages circled in red are
significantly different
from others in that group.
The difference between
Drive Alone and Carpool/ Vanpool is
not statistically significant,
but it is interesting to note that
the relationship
is the opposite of
that in Spotsylvania
.
Q7. Overall, how
satisfied are you with the transportation system in
the area where you
live?44
Southeastern Institute of Research
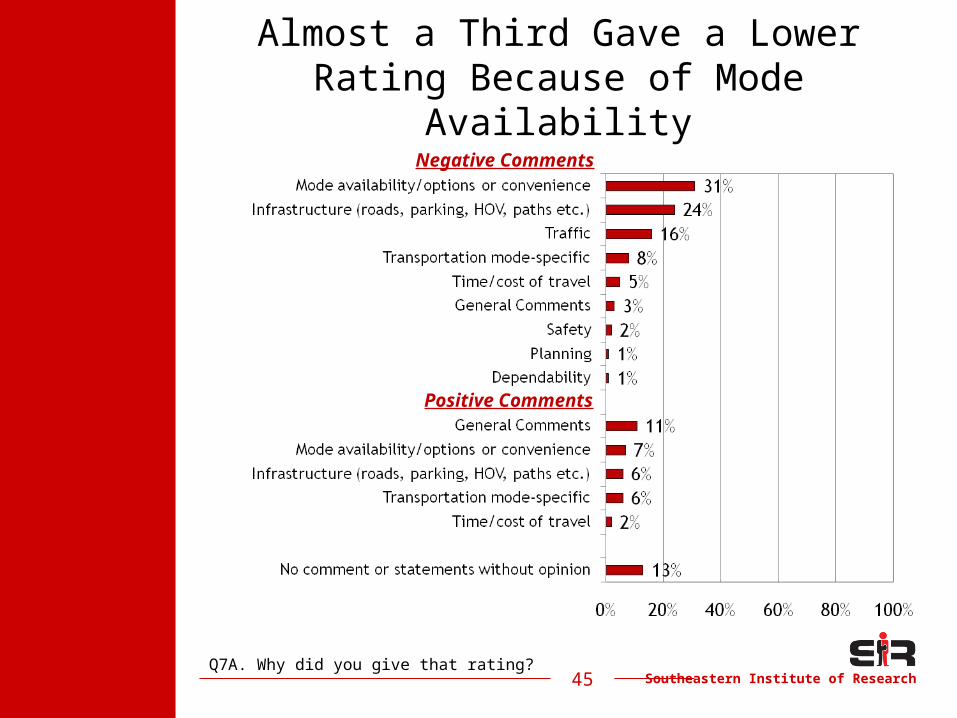
Almost a Third Gave a Lower Rating Because of Mode Availability
45Q7A. Why did you give that rating?
Negative Comments
Positive Comments

Southeastern Institute of Research46
FAMPO Area Residents Find TheseAspects of the Transportation System
to Be the Most Important
Q9. Now, that you’ve rated these features for the transportation system in the area where you live, we’d like to know how important they are to you.
TIER 1
84%
81%
79%
77%
77%
76%
IMPORTANCE
Weighted sample size varies from 1418 – 1480.
Does not include
those who said “don’t
know.”
Southeastern Institute of Research47
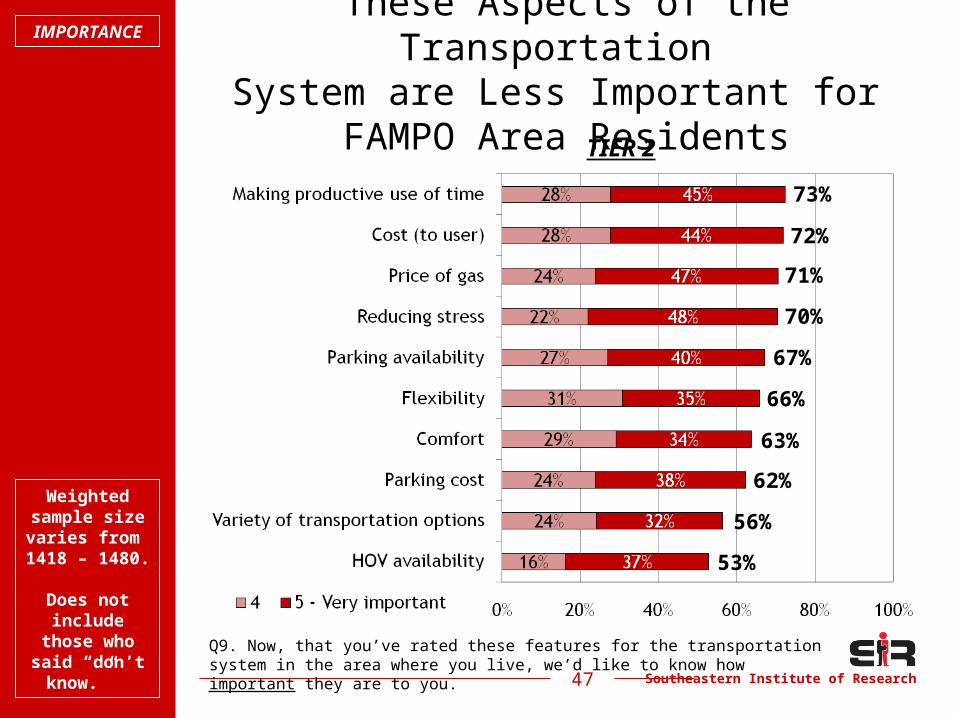
These Aspects of the Transportation System are Less Important for
FAMPO Area ResidentsTIER 2
73%
72%
71%
70%
67%
66%
62%
56%
53%
IMPORTANCE
63%
Weighted sample size varies from 1418 – 1480.
Does not include
those who said “don’t
know.”
Q9. Now, that you’ve rated these features for the transportation system in the area where you live, we’d like to know how important they are to you.
Southeastern Institute of Research48
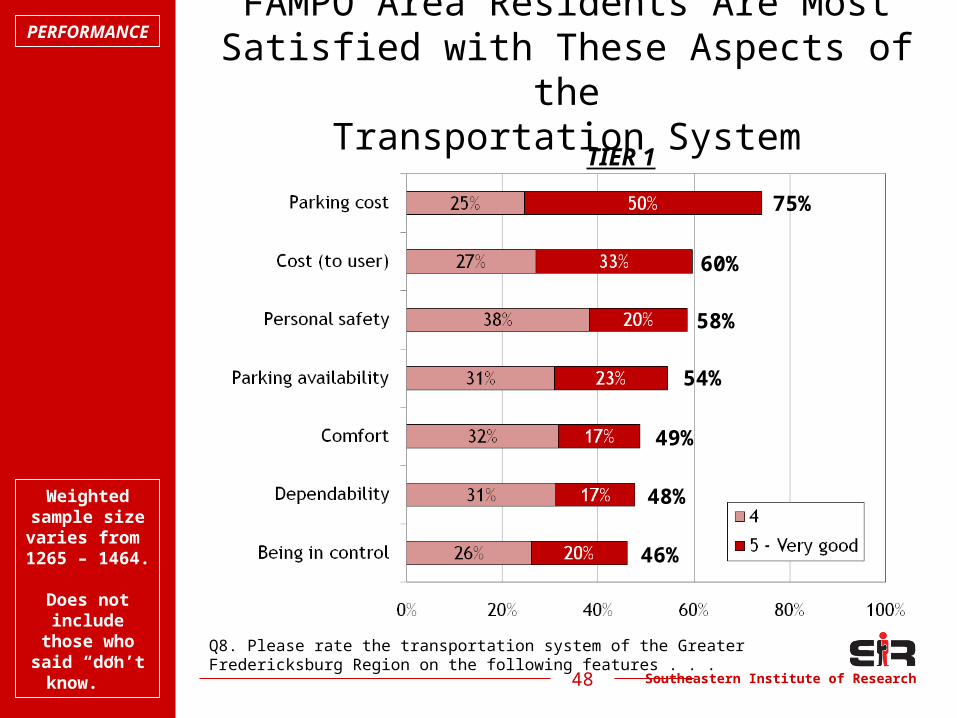
FAMPO Area Residents Are Most Satisfied with These Aspects of the
Transportation System
Q8. Please rate the transportation system of the Greater Fredericksburg Region on the following features . . .
TIER 1
75%
60%
58%
54%
49%
48%
46%
PERFORMANCE
Weighted sample size varies from 1265 – 1464.
Does not include
those who said “don’t
know.”
Southeastern Institute of Research49
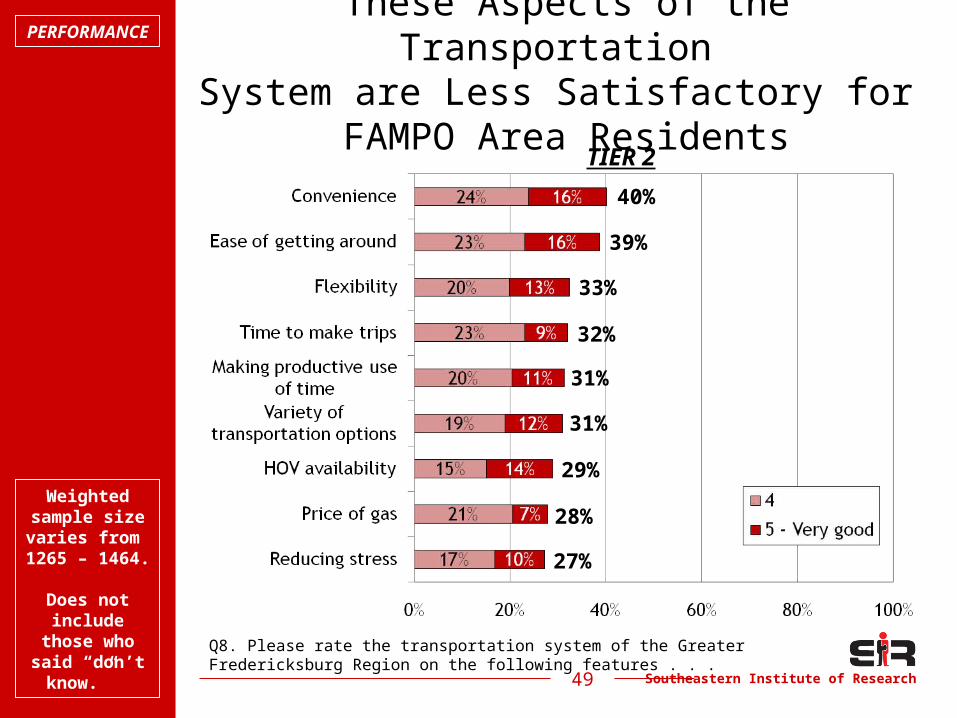
These Aspects of the Transportation System are Less Satisfactory for
FAMPO Area Residents
Q8. Please rate the transportation system of the Greater Fredericksburg Region on the following features . . .
TIER 2
40%
39%
33%
32%
31%
31%
29%
28%
27%
PERFORMANCE
Weighted sample size varies from 1265 – 1464.
Does not include
those who said “don’t
know.”
Southeastern Institute of Research50
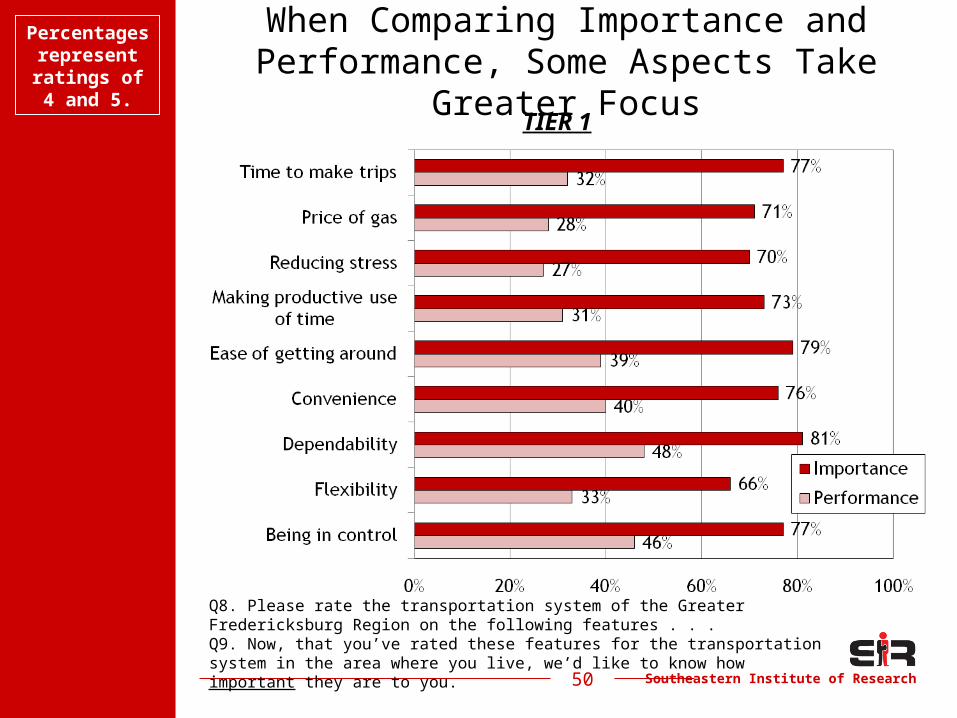
When Comparing Importance and Performance, Some Aspects Take Greater
Focus
Q8. Please rate the transportation system of the Greater Fredericksburg Region on the following features . . .Q9. Now, that you’ve rated these features for the transportation system in the area where you live, we’d like to know how important they are to you.
TIER 1
Percentages represent ratings of 4
and 5.
Southeastern Institute of Research51
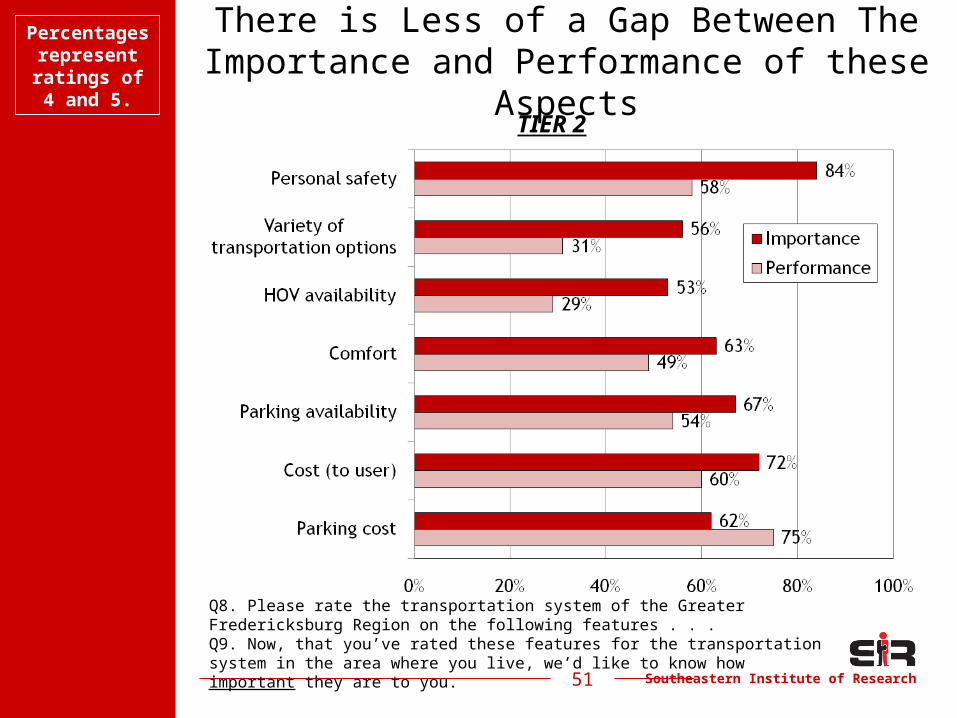
There is Less of a Gap Between The Importance and Performance of these
Aspects
Q8. Please rate the transportation system of the Greater Fredericksburg Region on the following features . . .Q9. Now, that you’ve rated these features for the transportation system in the area where you live, we’d like to know how important they are to you.
TIER 2
Percentages represent ratings of 4
and 5.
Southeastern Institute of Research52
“SIR Opportunity Index”
• This survey is based on attitudes and opinions
• Ratings and priorities are driven by perceptions, and perceptions are not always based on reality
• Strategic Issue:– How do you drive a 4 rating any higher?– Is it possible?
• One way to address this challenge:– Put opportunities into the perspective of what can
realistically be achieved
Southeastern Institute of Research53
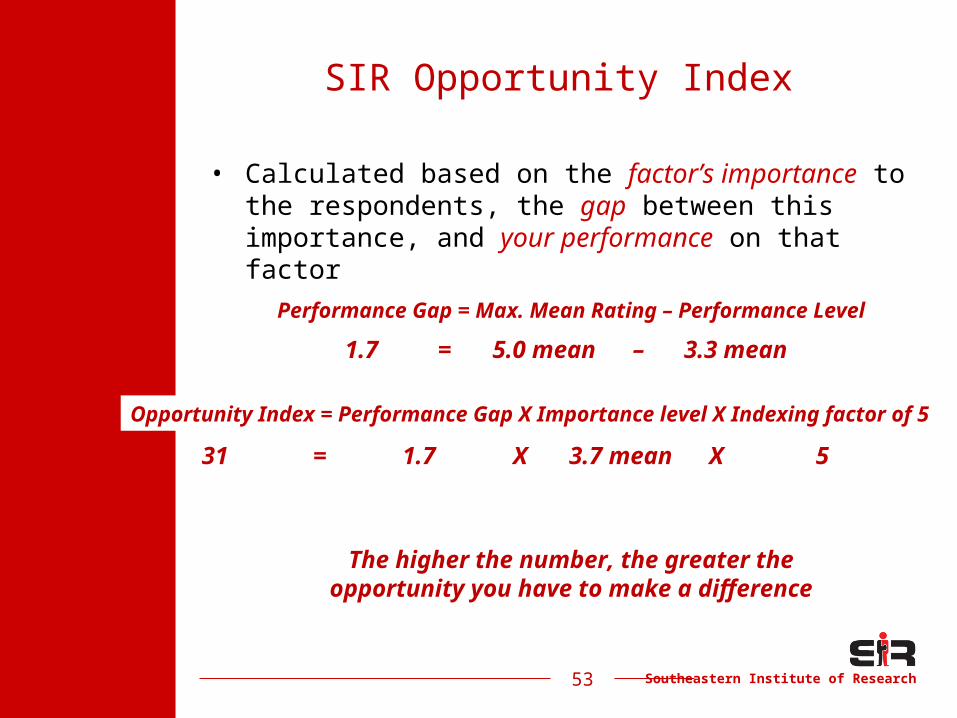
SIR Opportunity Index
• Calculated based on the factor’s importance to the respondents, the gap between this importance, and your performance on that factor
Performance Gap = Max. Mean Rating – Performance Level
3.3 mean1.7 = 5.0 mean –
Opportunity Index = Performance Gap X Importance level X Indexing factor of 5
31 = 1.7 3.7 meanX X 5
The higher the number, the greater the opportunity you have to make a
difference

Southeastern Institute of Research54
Respondents Would See the Greatest Improvement in Reduced Stress and Trip Time Adjustments
Aspect Importance Mean
Performance Mean
Opportunity Index
Reducing stress 2.7 4.0 46Time to make trips 2.8 4.1 45Making productive use of time 2.8 4.0 44Price of gas 2.8 4.0 44HOV availability 2.5 3.5 44Variety of transportation options 2.7 3.6 41Ease of getting around 3.0 4.1 41Flexibility 2.9 3.9 41Convenience 3.1 4.1 39Being in control 3.2 4.1 37Dependability 3.3 4.2 36Comfort 3.3 3.8 32Personal safety 3.6 4.4 31Parking availability 3.5 3.9 29Cost (to user) 3.7 4.0 26Parking cost 4.1 3.7 17
The higher the number, the greaterthe opportunity you have to make a difference
54
Southeastern Institute of Research55
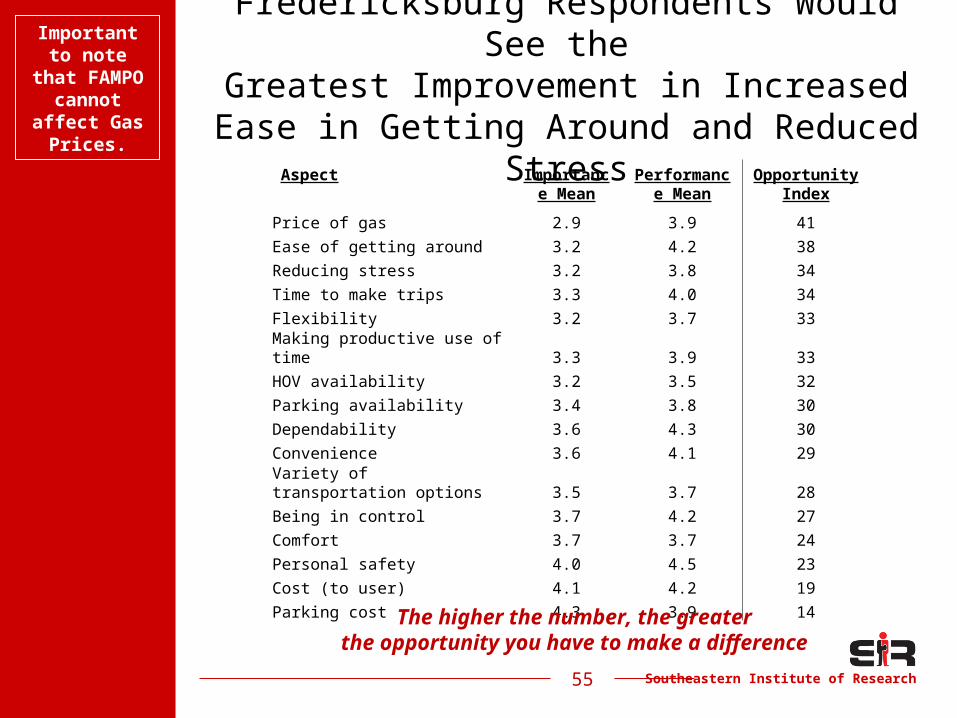
Fredericksburg Respondents Would See the
Greatest Improvement in Increased Ease in Getting Around and Reduced Stress
Aspect Importance Mean
Performance Mean
Opportunity Index
Price of gas 2.9 3.9 41Ease of getting around 3.2 4.2 38Reducing stress 3.2 3.8 34Time to make trips 3.3 4.0 34Flexibility 3.2 3.7 33Making productive use of time 3.3 3.9 33HOV availability 3.2 3.5 32Parking availability 3.4 3.8 30Dependability 3.6 4.3 30Convenience 3.6 4.1 29Variety of transportation options 3.5 3.7 28Being in control 3.7 4.2 27Comfort 3.7 3.7 24Personal safety 4.0 4.5 23Cost (to user) 4.1 4.2 19Parking cost 4.3 3.9 14
The higher the number, the greaterthe opportunity you have to make a difference
Important to note
that FAMPO cannot
affect Gas Prices.
55
Southeastern Institute of Research56
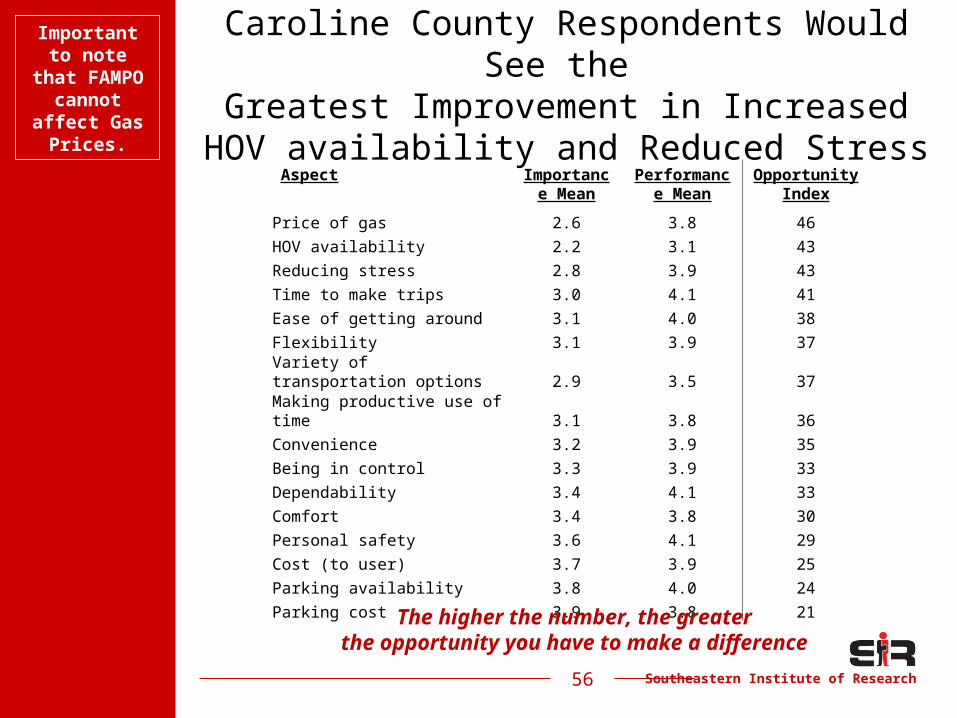
Caroline County Respondents Would See the
Greatest Improvement in Increased HOV availability and Reduced Stress
Aspect Importance Mean
Performance Mean
Opportunity Index
Price of gas 2.6 3.8 46HOV availability 2.2 3.1 43Reducing stress 2.8 3.9 43Time to make trips 3.0 4.1 41Ease of getting around 3.1 4.0 38Flexibility 3.1 3.9 37Variety of transportation options 2.9 3.5 37Making productive use of time 3.1 3.8 36Convenience 3.2 3.9 35Being in control 3.3 3.9 33Dependability 3.4 4.1 33Comfort 3.4 3.8 30Personal safety 3.6 4.1 29Cost (to user) 3.7 3.9 25Parking availability 3.8 4.0 24Parking cost 3.9 3.8 21
The higher the number, the greaterthe opportunity you have to make a difference
Important to note
that FAMPO cannot
affect Gas Prices.
56
Southeastern Institute of Research57
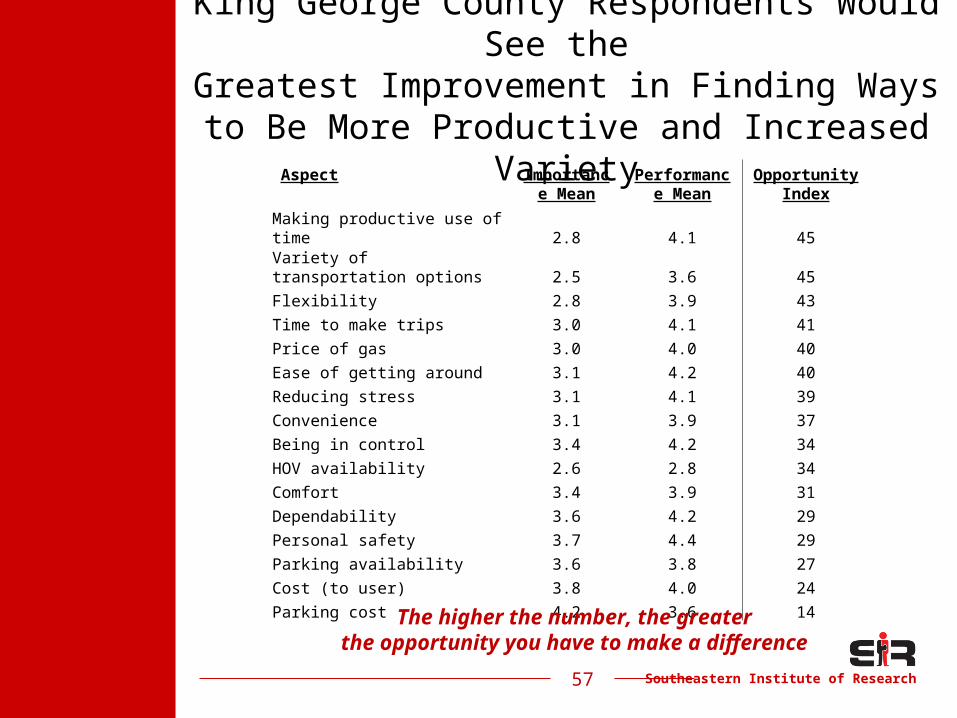
King George County Respondents Would See the
Greatest Improvement in Finding Ways to Be More Productive and Increased Variety
Aspect Importance Mean
Performance Mean
Opportunity Index
Making productive use of time 2.8 4.1 45Variety of transportation options 2.5 3.6 45Flexibility 2.8 3.9 43Time to make trips 3.0 4.1 41Price of gas 3.0 4.0 40Ease of getting around 3.1 4.2 40Reducing stress 3.1 4.1 39Convenience 3.1 3.9 37Being in control 3.4 4.2 34HOV availability 2.6 2.8 34Comfort 3.4 3.9 31Dependability 3.6 4.2 29Personal safety 3.7 4.4 29Parking availability 3.6 3.8 27Cost (to user) 3.8 4.0 24Parking cost 4.2 3.6 14
The higher the number, the greaterthe opportunity you have to make a difference
57
Southeastern Institute of Research58
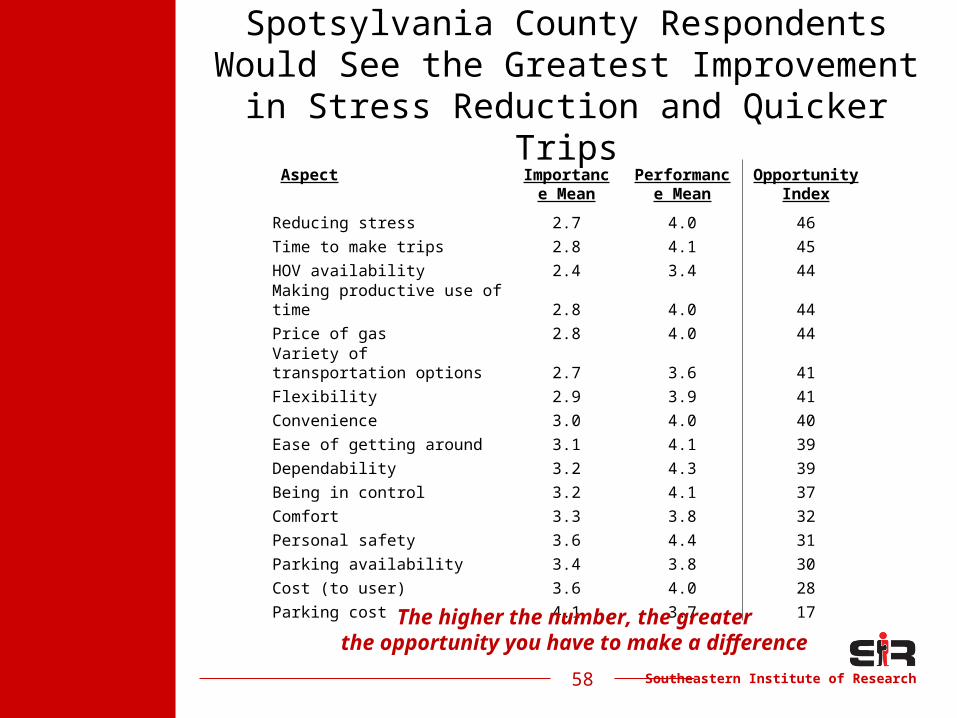
Spotsylvania County Respondents Would See the Greatest Improvement in Stress
Reduction and Quicker TripsAspect Importanc
e MeanPerformance Mean
Opportunity Index
Reducing stress 2.7 4.0 46Time to make trips 2.8 4.1 45HOV availability 2.4 3.4 44Making productive use of time 2.8 4.0 44Price of gas 2.8 4.0 44Variety of transportation options 2.7 3.6 41Flexibility 2.9 3.9 41Convenience 3.0 4.0 40Ease of getting around 3.1 4.1 39Dependability 3.2 4.3 39Being in control 3.2 4.1 37Comfort 3.3 3.8 32Personal safety 3.6 4.4 31Parking availability 3.4 3.8 30Cost (to user) 3.6 4.0 28Parking cost 4.1 3.7 17
The higher the number, the greaterthe opportunity you have to make a difference
58
Southeastern Institute of Research59
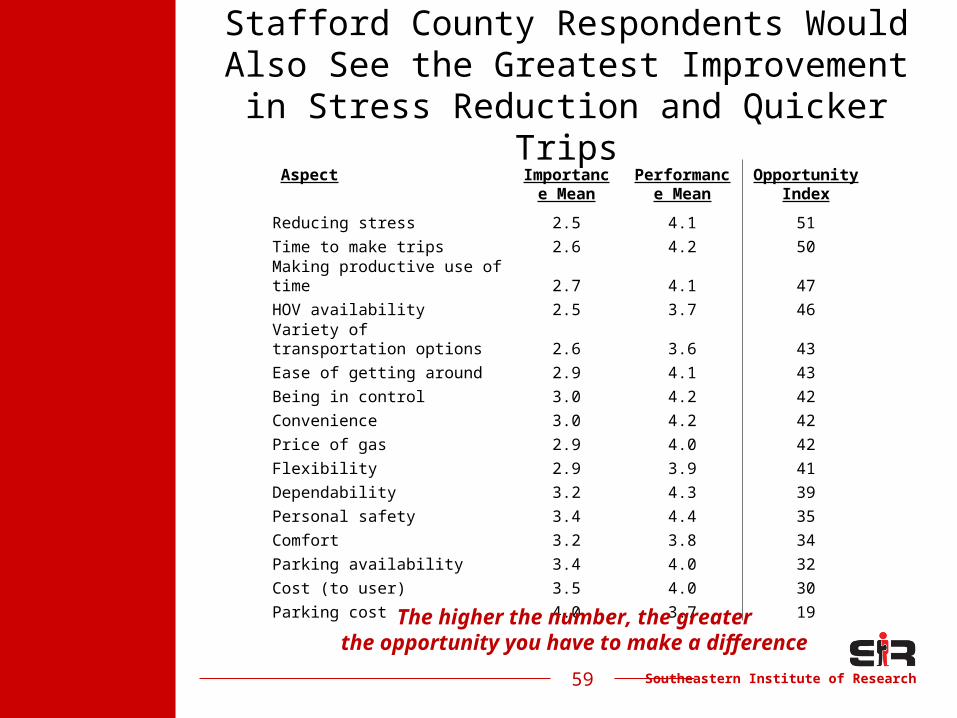
Stafford County Respondents Would Also See the Greatest Improvement in Stress
Reduction and Quicker TripsAspect Importanc
e MeanPerformance Mean
Opportunity Index
Reducing stress 2.5 4.1 51Time to make trips 2.6 4.2 50Making productive use of time 2.7 4.1 47HOV availability 2.5 3.7 46Variety of transportation options 2.6 3.6 43Ease of getting around 2.9 4.1 43Being in control 3.0 4.2 42Convenience 3.0 4.2 42Price of gas 2.9 4.0 42Flexibility 2.9 3.9 41Dependability 3.2 4.3 39Personal safety 3.4 4.4 35Comfort 3.2 3.8 34Parking availability 3.4 4.0 32Cost (to user) 3.5 4.0 30Parking cost 4.0 3.7 19
The higher the number, the greaterthe opportunity you have to make a difference
59
Southeastern Institute of Research
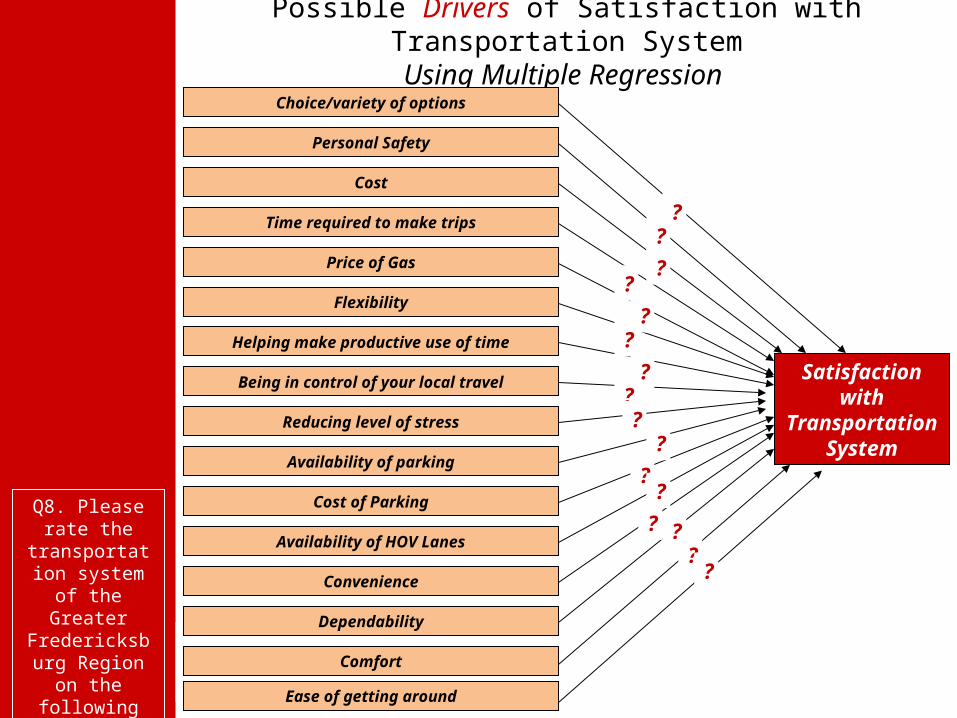
Possible Drivers of Satisfaction with Transportation System
Using Multiple Regression
Satisfaction with
Transportation System
Personal Safety
Convenience
Availability of parking
Availability of HOV Lanes
Comfort
Dependability
Reducing level of stress
Being in control of your local travel
Cost of Parking
Choice/variety of options
Cost
Time required to make trips
Price of Gas
Flexibility
Helping make productive use of time
?
??
???
?
??
? ??
?
??
Ease of getting around
?
Q8. Please rate the
transportation system of the Greater
Fredericksburg Region on the following features . . .
Southeastern Institute of Research
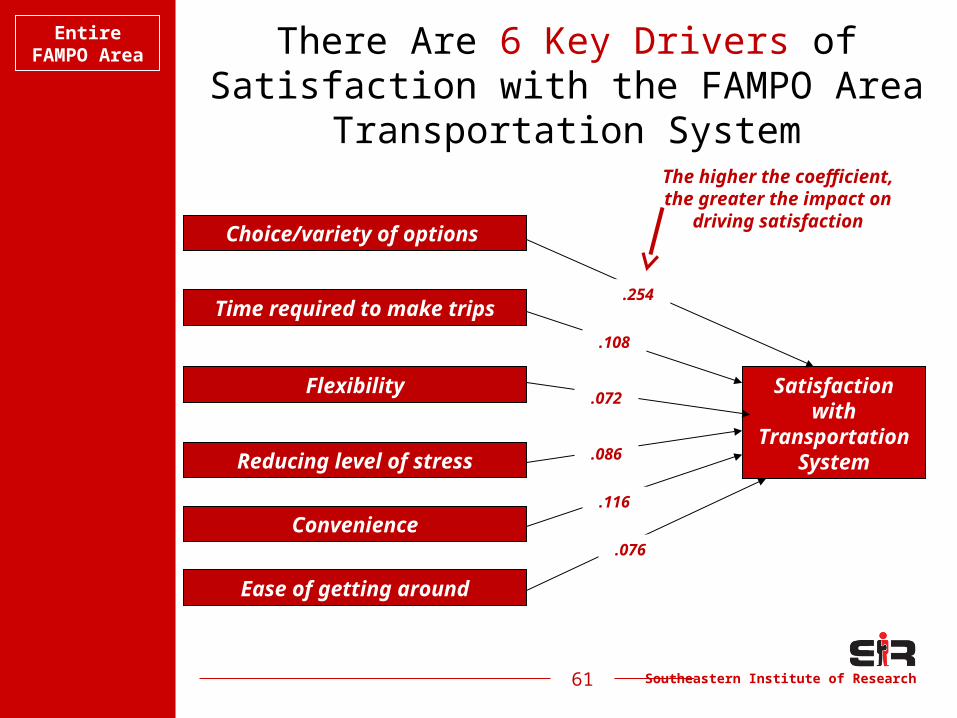
There Are 6 Key Drivers of Satisfaction with the FAMPO Area Transportation
System
Satisfaction with
Transportation System
Time required to make trips
Choice/variety of options
Flexibility
Convenience
Ease of getting around
Reducing level of stress
.076
.116
.086
.072
.108
.254
61
Entire FAMPO
Area
The higher the coefficient, the greater the impact on driving
satisfaction
Southeastern Institute of Research
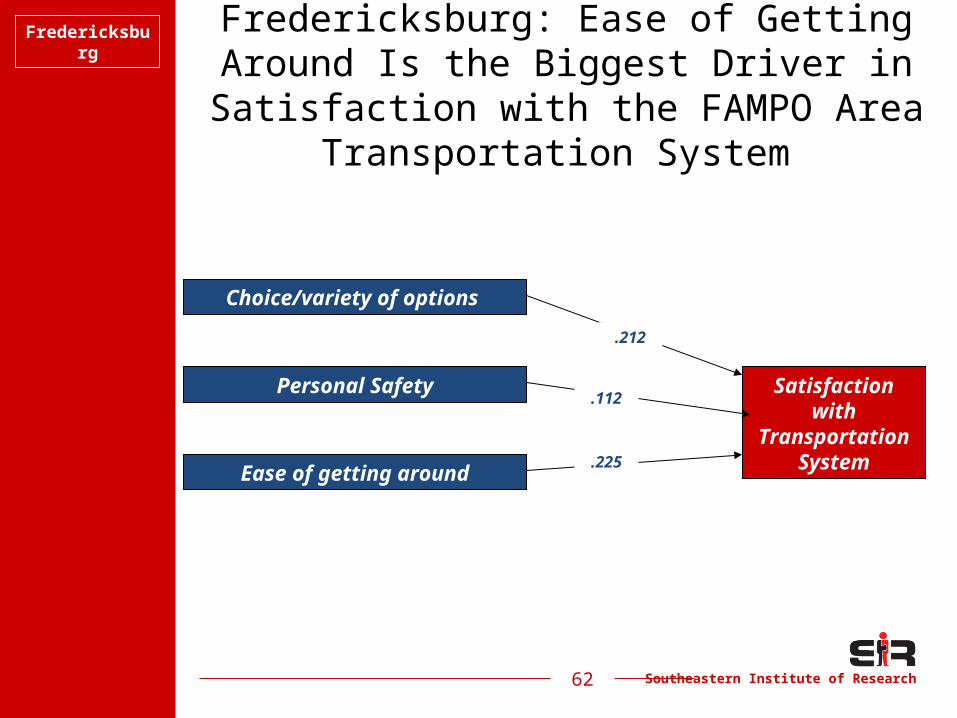
Fredericksburg: Ease of Getting Around Is the Biggest Driver in Satisfaction with the FAMPO Area Transportation
System
Satisfaction with
Transportation System
Choice/variety of options
Personal Safety
Ease of getting around.225
.112
.212
62
Fredericksburg
Southeastern Institute of Research
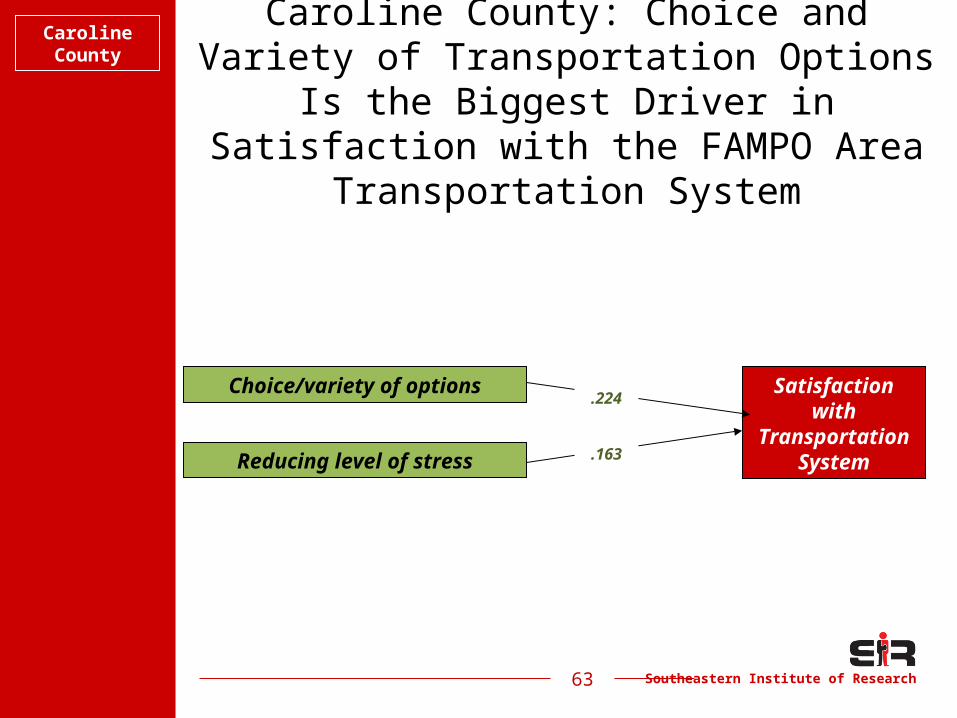
Caroline County: Choice and Variety of Transportation Options Is the Biggest Driver in Satisfaction with the FAMPO
Area Transportation System
Satisfaction with
Transportation System
Choice/variety of options
Reducing level of stress .163
.224
63
Caroline County
Southeastern Institute of Research
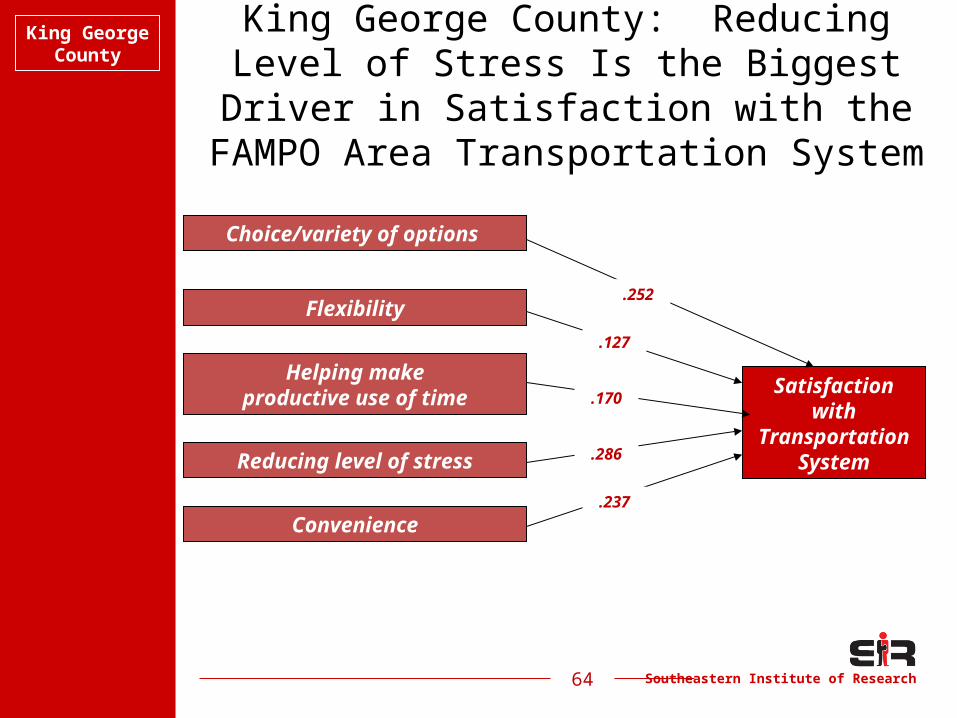
King George County: Reducing Level of Stress Is the Biggest Driver in
Satisfaction with the FAMPO Area Transportation System
Satisfaction with
Transportation System
Flexibility
Choice/variety of options
Helping makeproductive use of time
Convenience
Reducing level of stress
.237
.286
.170
.127
.252
64
King George County
Southeastern Institute of Research
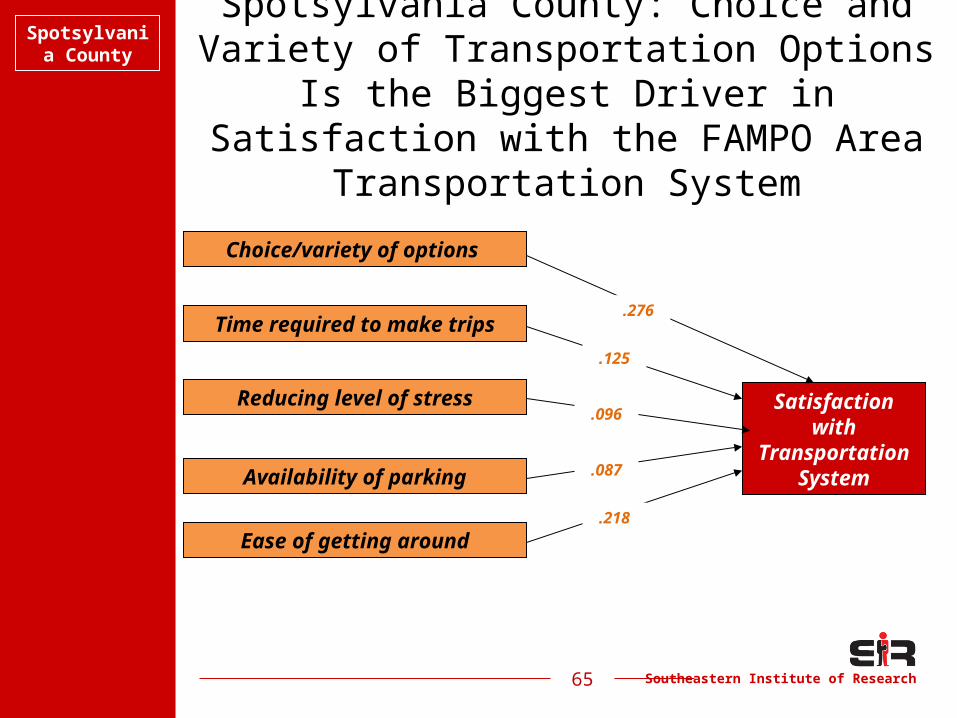
Spotsylvania County: Choice and Variety of Transportation Options Is the Biggest Driver in Satisfaction with the
FAMPO Area Transportation System
Satisfaction with
Transportation System
Time required to make trips
Choice/variety of options
Reducing level of stress
Ease of getting around
Availability of parking
.218
.087
.096
.125
.276
65
Spotsylvania County
Southeastern Institute of Research
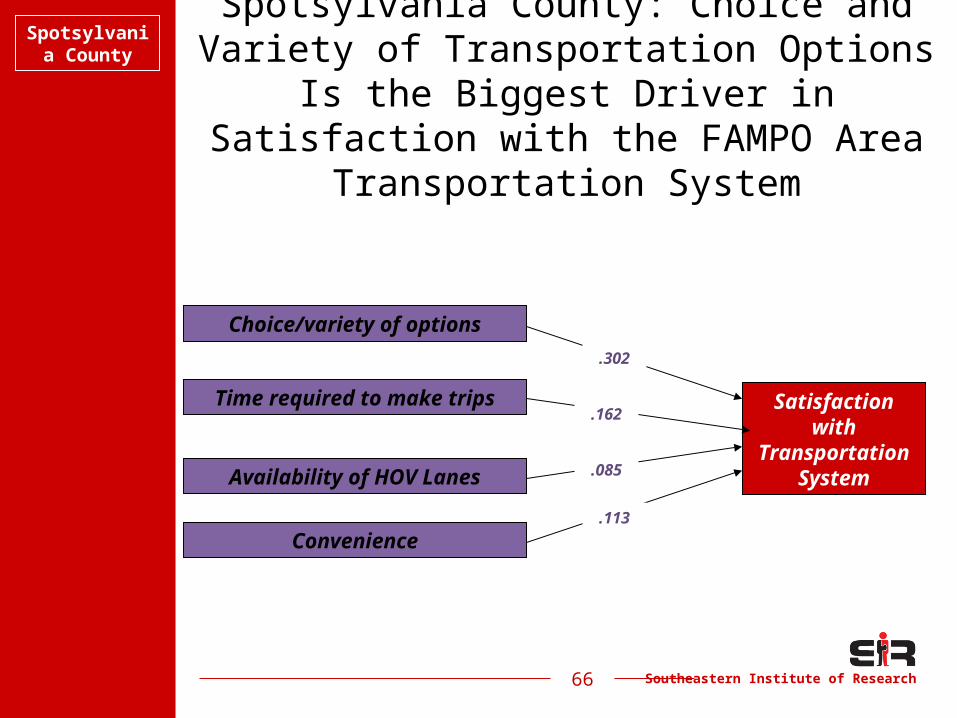
Spotsylvania County: Choice and Variety of Transportation Options Is the Biggest Driver in Satisfaction with the
FAMPO Area Transportation System
Satisfaction with
Transportation System
Choice/variety of options
Time required to make trips
Convenience
Availability of HOV Lanes
.113
.085
.162
.302
66
Spotsylvania County
Southeastern Institute of Research67
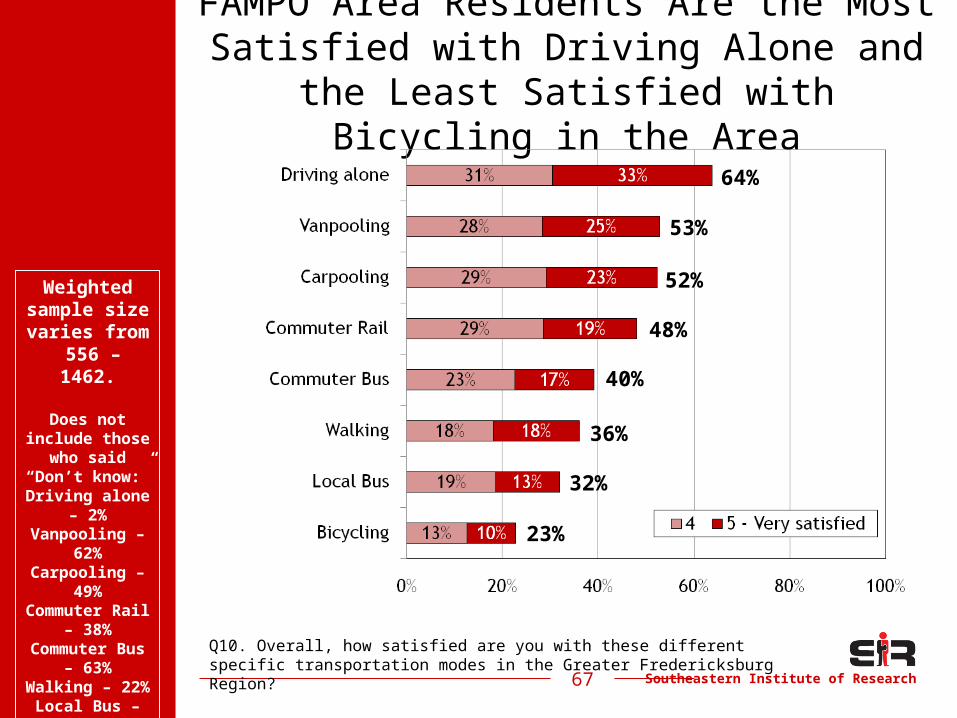
FAMPO Area Residents Are the Most Satisfied with Driving Alone and the Least Satisfied with Bicycling in the
Area64%
53%
52%
48%
40%
36%
32%
Weighted sample size varies from
556 – 1462.
Does not include those
who said “Don’t know:”
Driving alone – 2%
Vanpooling – 62%
Carpooling – 49%
Commuter Rail – 38%Commuter Bus – 63%Walking –
22%Local Bus –
52%Bicycling –
48%
Q10. Overall, how satisfied are you with these different specific transportation modes in the Greater Fredericksburg Region?
23%
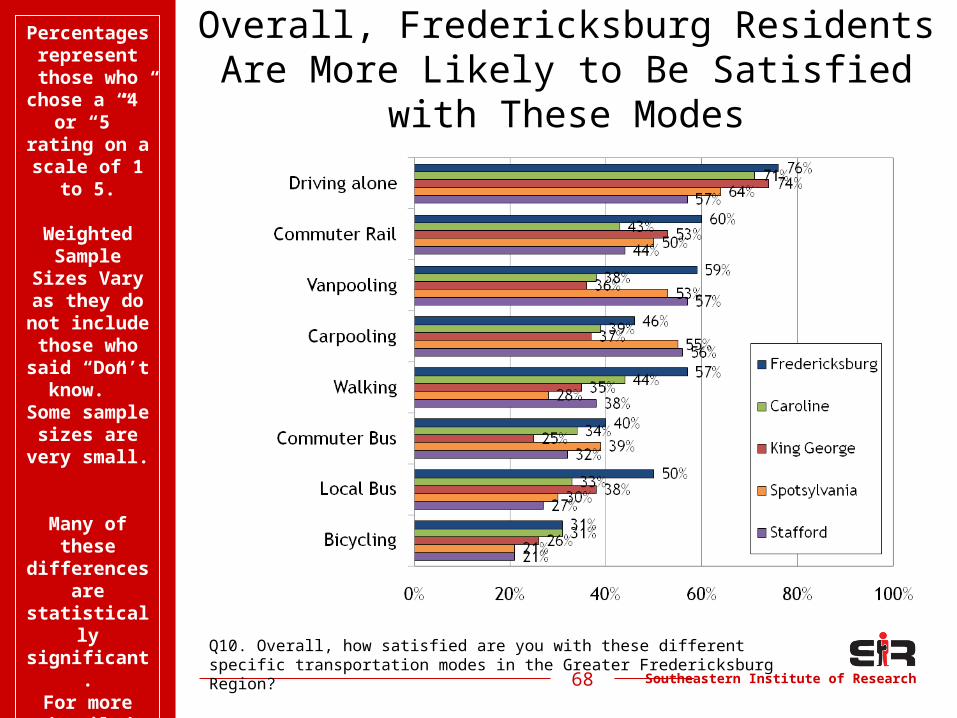
Southeastern Institute of Research68
Overall, Fredericksburg Residents Are More Likely to Be Satisfied with These
Modes
Q10. Overall, how satisfied are you with these different specific transportation modes in the Greater Fredericksburg Region?
Percentages represent those who
chose a “4” or “5”
rating on a scale of 1
to 5.
Weighted Sample
Sizes Vary as they do not include those who said “Don’t
know.” Some
sample sizes are
very small.
Many of these
differences are
statistically significant.For more detailed
information, see the appendix.
Southeastern Institute of Research
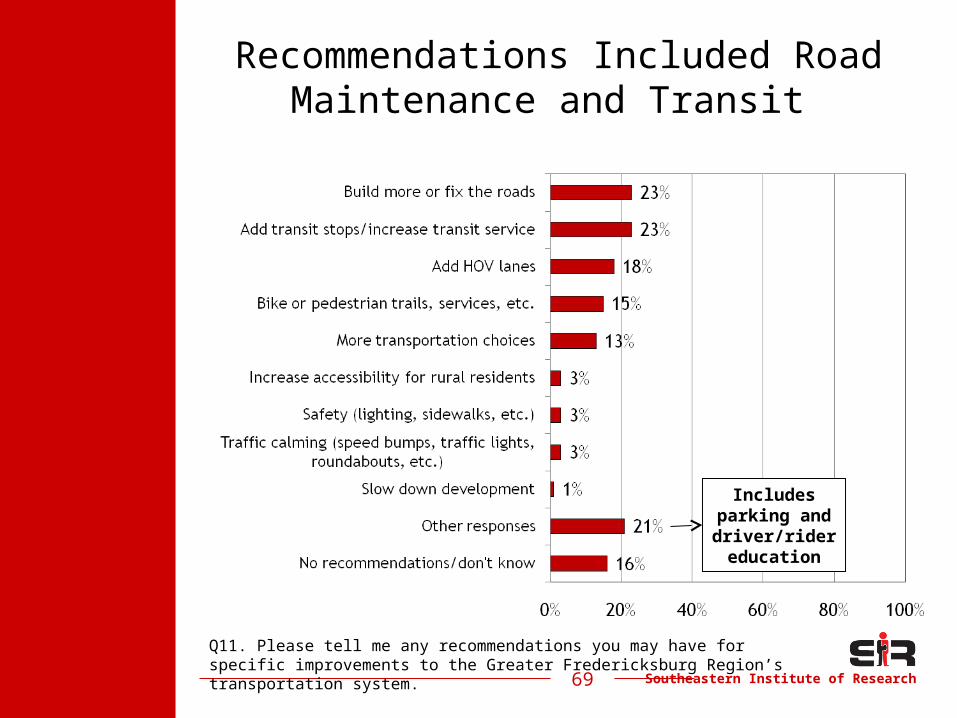
Recommendations Included Road Maintenance and Transit
69
Q11. Please tell me any recommendations you may have for specific improvements to the Greater Fredericksburg Region’s transportation system.
Includes parking and driver/rider education
Southeastern Institute of Research
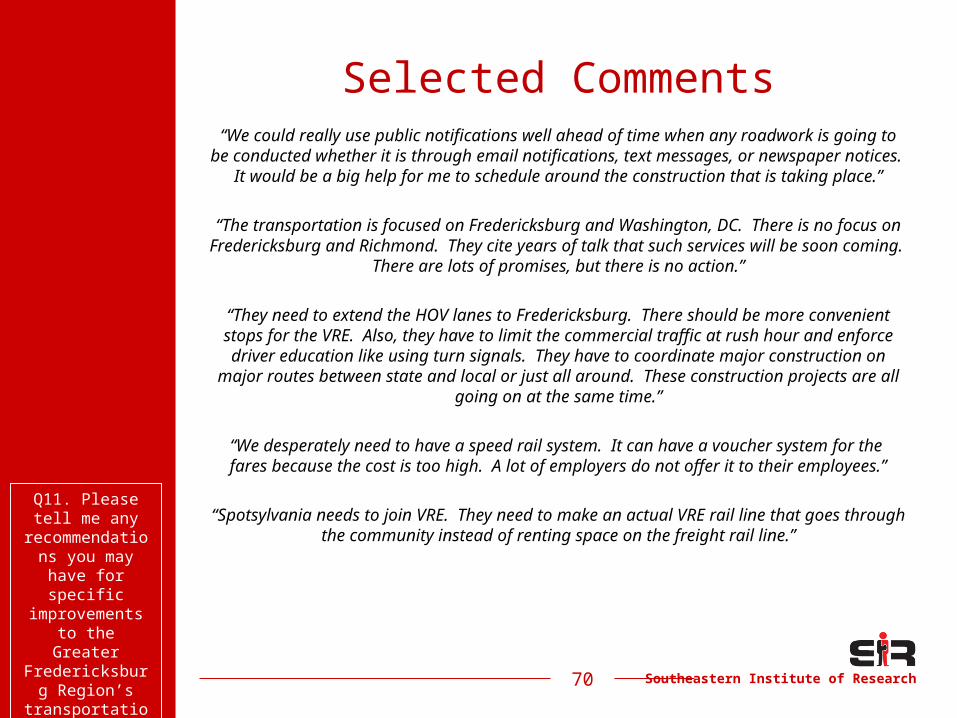
Selected Comments“We could really use public notifications well ahead of time when any roadwork is going to be conducted whether it is through email notifications, text messages, or
newspaper notices. It would be a big help for me to schedule around the construction that is taking place.”
“The transportation is focused on Fredericksburg and Washington, DC. There is no focus on Fredericksburg and Richmond. They cite years of talk that such services
will be soon coming. There are lots of promises, but there is no action.”
“They need to extend the HOV lanes to Fredericksburg. There should be more convenient stops for the VRE. Also, they have to limit the commercial traffic at rush hour and enforce driver education like using turn signals. They have to coordinate
major construction on major routes between state and local or just all around. These construction projects are all going on at the same time.”
“We desperately need to have a speed rail system. It can have a voucher system for the fares because the cost is too high. A lot of employers do not offer it to their
employees.”
“Spotsylvania needs to join VRE. They need to make an actual VRE rail line that goes through the community instead of renting space on the freight rail line.”
70
Q11. Please tell me any
recommendations you may
have for specific improvements to the Greater Fredericksburg
Region’s transportation
system.
Southeastern Institute of Research71
Long RangeTransportation Plan
Southeastern Institute of Research
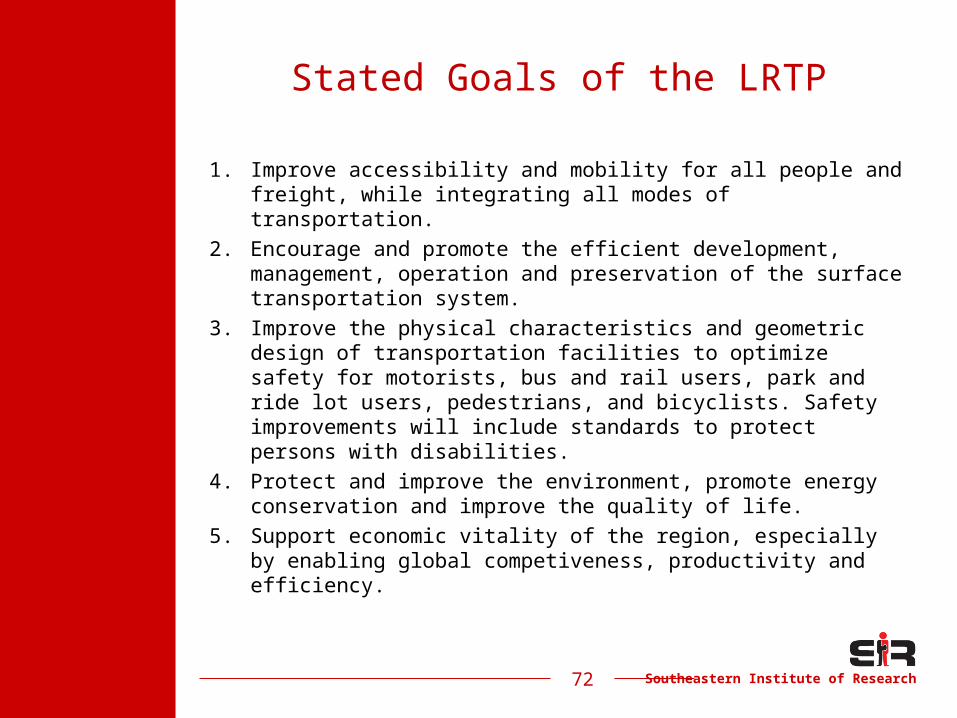
Stated Goals of the LRTP
1. Improve accessibility and mobility for all people and freight, while integrating all modes of transportation.
2. Encourage and promote the efficient development, management, operation and preservation of the surface transportation system.
3. Improve the physical characteristics and geometric design of transportation facilities to optimize safety for motorists, bus and rail users, park and ride lot users, pedestrians, and bicyclists. Safety improvements will include standards to protect persons with disabilities.
4. Protect and improve the environment, promote energy conservation and improve the quality of life.
5. Support economic vitality of the region, especially by enabling global competiveness, productivity and efficiency.
72
Southeastern Institute of Research
Asked of All Respondents, Regardless of Familiarity with the LRTP:
The 2035 Long Range Transportation Plan has five primary goals. As I read each goal to you, please tell me how
confident you are that each goal will be accomplished.
Please use a scale of 1-5 for your
answer, where “1” means “not very confident the goal will be accomplished” and “5” means “very confident the goal
will be accomplished.”
73
Southeastern Institute of Research74
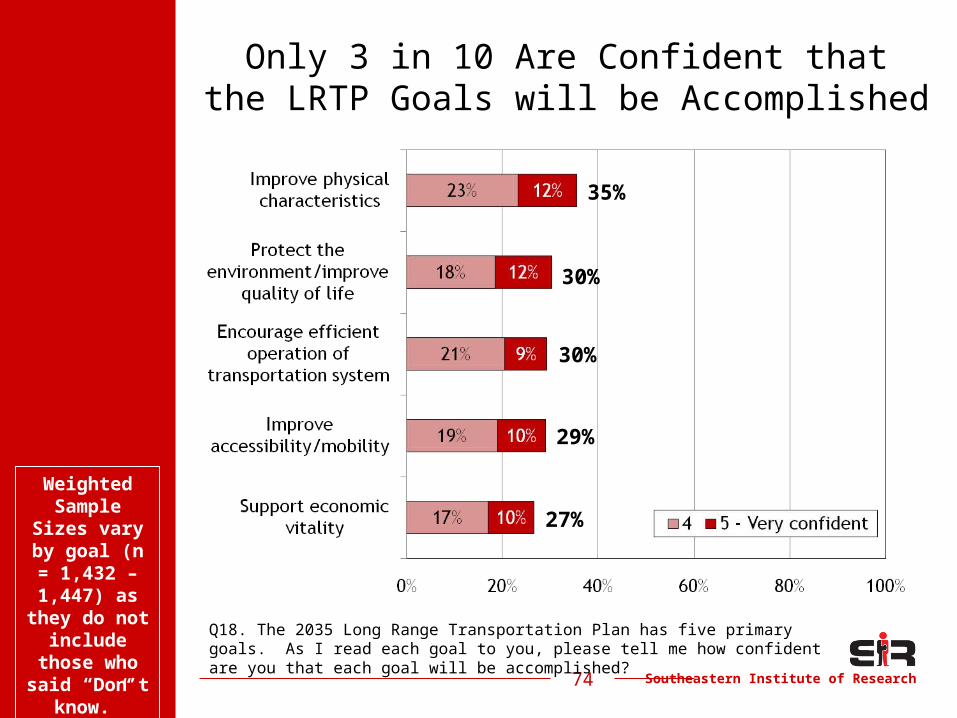
Only 3 in 10 Are Confident thatthe LRTP Goals will be Accomplished
Q18. The 2035 Long Range Transportation Plan has five primary goals. As I read each goal to you, please tell me how confident are you that each goal will be accomplished?
Weighted Sample
Sizes vary by goal (n = 1,432 – 1,447) as
they do not include
those who said “Don’t
know.”
35%
30%
30%
29%
27%
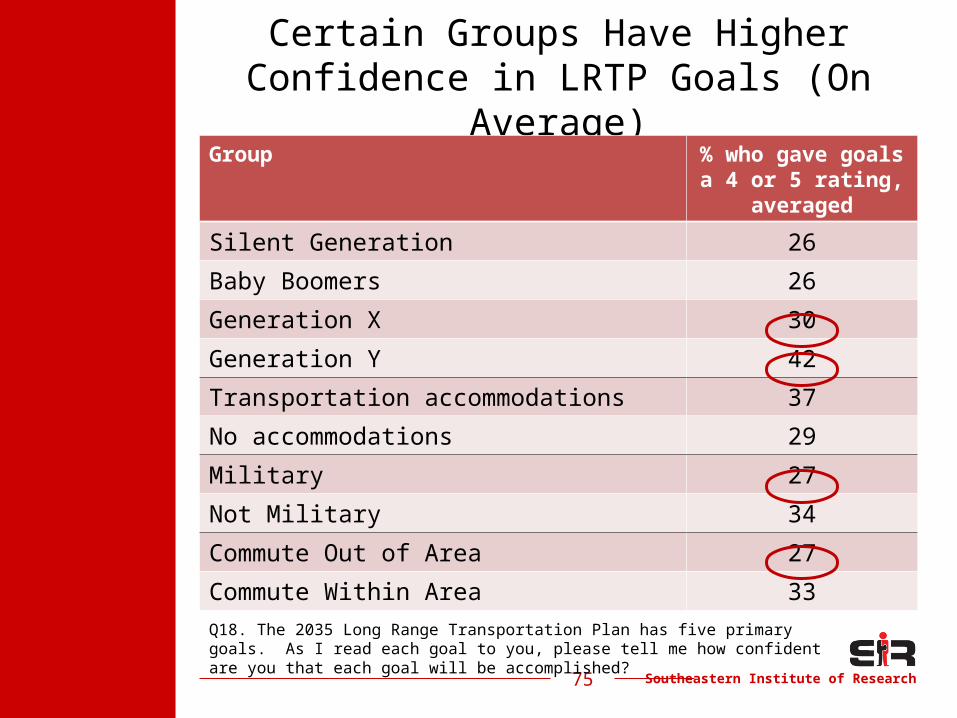
Southeastern Institute of Research75
Certain Groups Have Higher Confidence in LRTP Goals (On
Average)Group % who gave
goals a 4 or 5 rating, averaged
Silent Generation 26
Baby Boomers 26
Generation X 30
Generation Y 42
Transportation accommodations 37
No accommodations 29
Military 27
Not Military 34
Commute Out of Area 27
Commute Within Area 33
Q18. The 2035 Long Range Transportation Plan has five primary goals. As I read each goal to you, please tell me how confident are you that each goal will be accomplished?
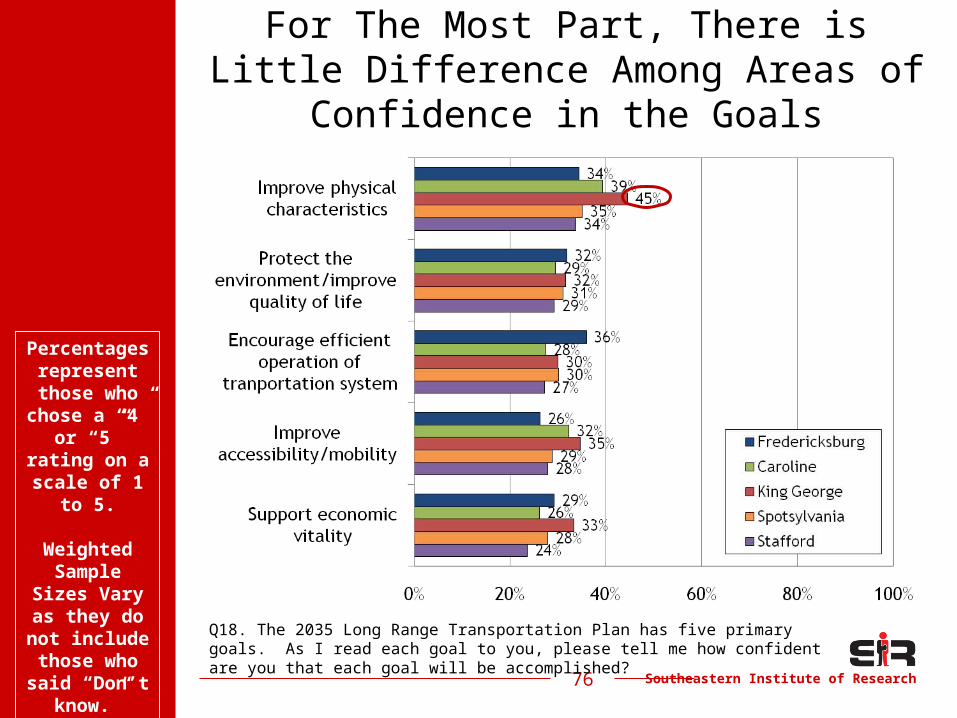
Southeastern Institute of Research76
For The Most Part, There is Little Difference Among Areas of Confidence
in the Goals
Percentages represent those who
chose a “4” or “5”
rating on a scale of 1
to 5.
Weighted Sample
Sizes Vary as they do not include those who said “Don’t
know.”
Q18. The 2035 Long Range Transportation Plan has five primary goals. As I read each goal to you, please tell me how confident are you that each goal will be accomplished?
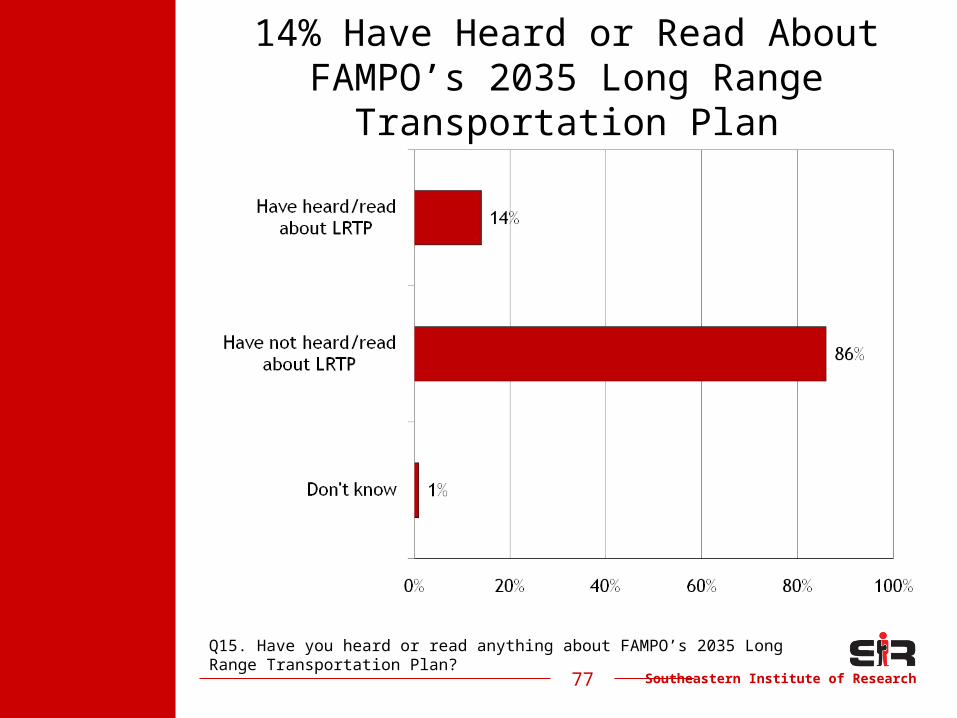
Southeastern Institute of Research77
14% Have Heard or Read About FAMPO’s 2035 Long Range
Transportation Plan
Q15. Have you heard or read anything about FAMPO’s 2035 Long Range Transportation Plan?
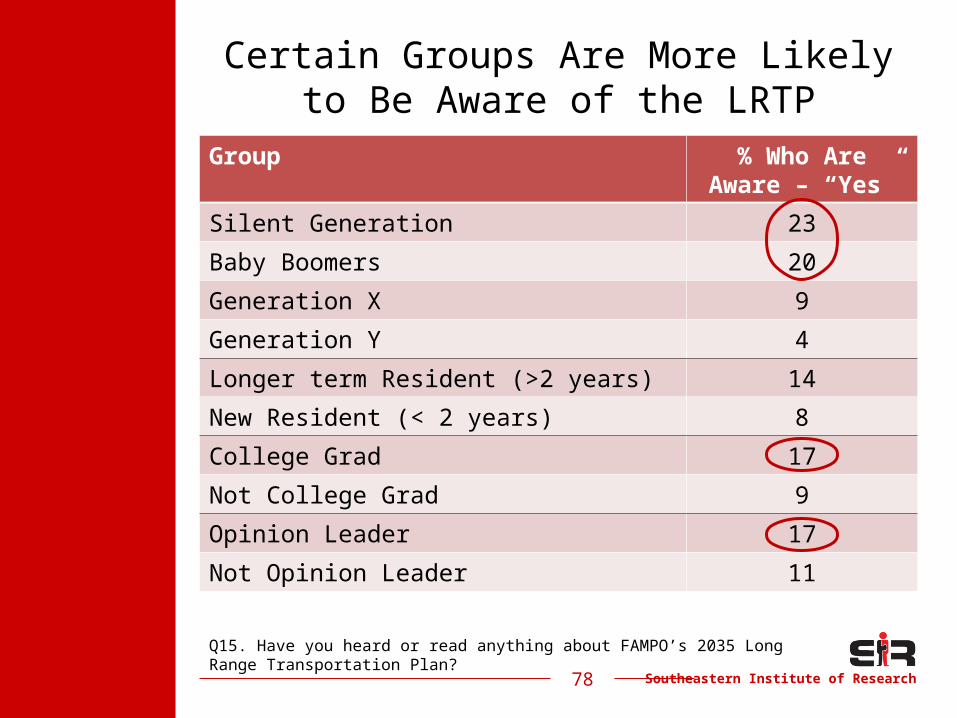
Southeastern Institute of Research
Certain Groups Are More Likelyto Be Aware of the LRTP
Group % Who Are Aware – “Yes”
Silent Generation 23
Baby Boomers 20
Generation X 9
Generation Y 4
Longer term Resident (>2 years) 14
New Resident (< 2 years) 8
College Grad 17
Not College Grad 9
Opinion Leader 17
Not Opinion Leader 11
78
Q15. Have you heard or read anything about FAMPO’s 2035 Long Range Transportation Plan?
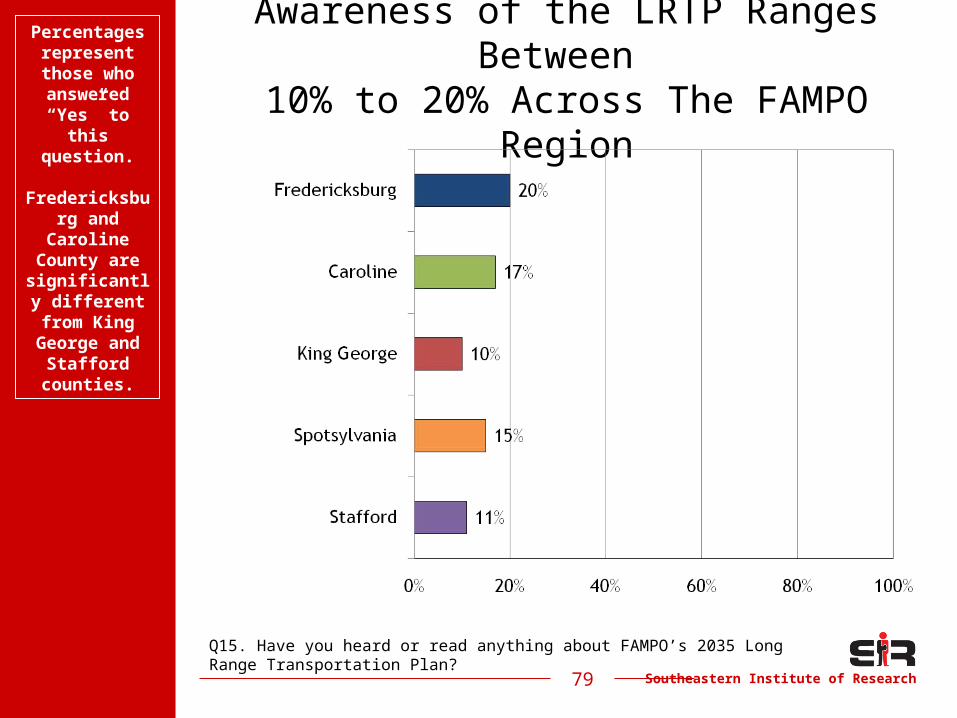
Southeastern Institute of Research79
Awareness of the LRTP Ranges Between
10% to 20% Across The FAMPO Region
Percentages represent those who answered “Yes” to
this question.
Fredericksburg and Caroline
County are significantly
different from King
George and Stafford counties.
Q15. Have you heard or read anything about FAMPO’s 2035 Long Range Transportation Plan?
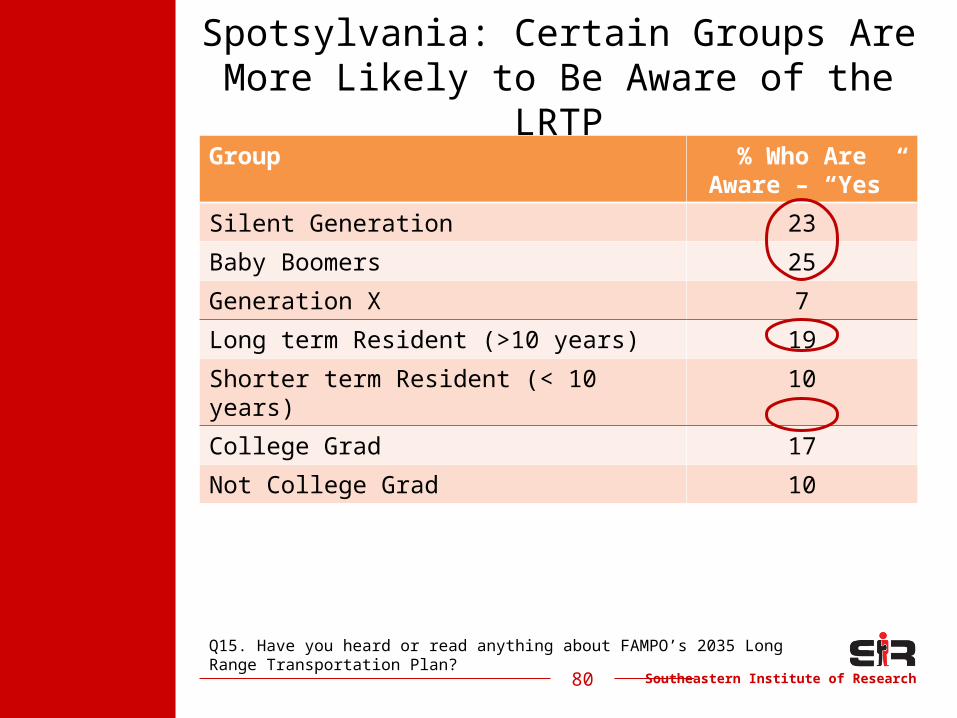
Southeastern Institute of Research
Spotsylvania: Certain Groups Are More Likely to Be Aware of the LRTP
Group % Who Are Aware – “Yes”
Silent Generation 23
Baby Boomers 25
Generation X 7
Long term Resident (>10 years) 19
Shorter term Resident (< 10 years) 10
College Grad 17
Not College Grad 10
80
Q15. Have you heard or read anything about FAMPO’s 2035 Long Range Transportation Plan?
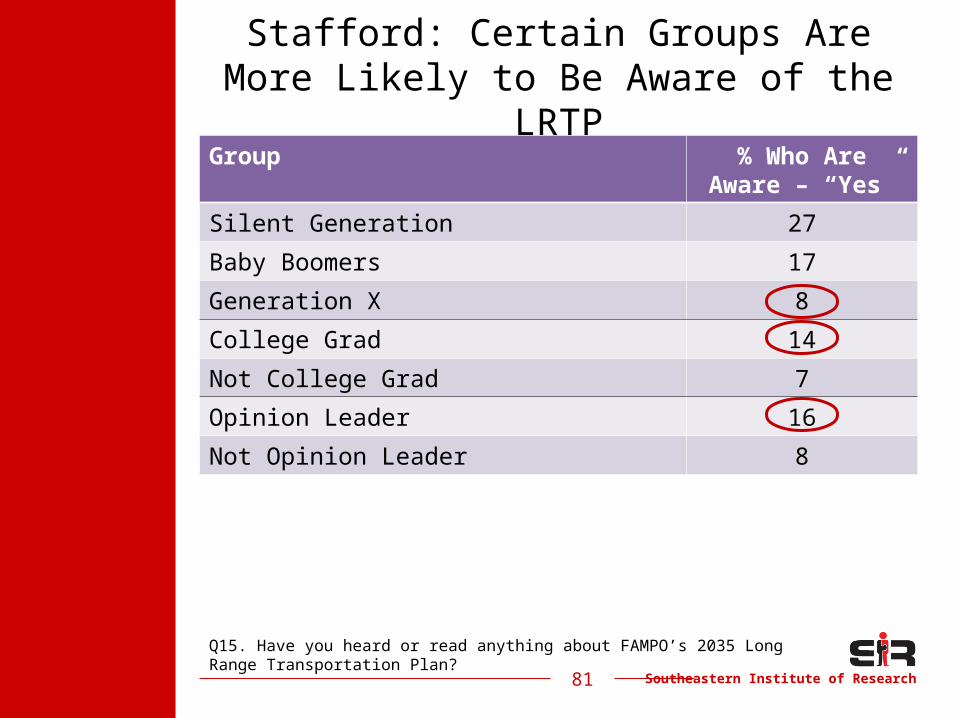
Southeastern Institute of Research
Stafford: Certain Groups Are More Likely to Be Aware of the LRTP
Group % Who Are Aware – “Yes”
Silent Generation 27
Baby Boomers 17
Generation X 8
College Grad 14
Not College Grad 7
Opinion Leader 16
Not Opinion Leader 8
81
Q15. Have you heard or read anything about FAMPO’s 2035 Long Range Transportation Plan?
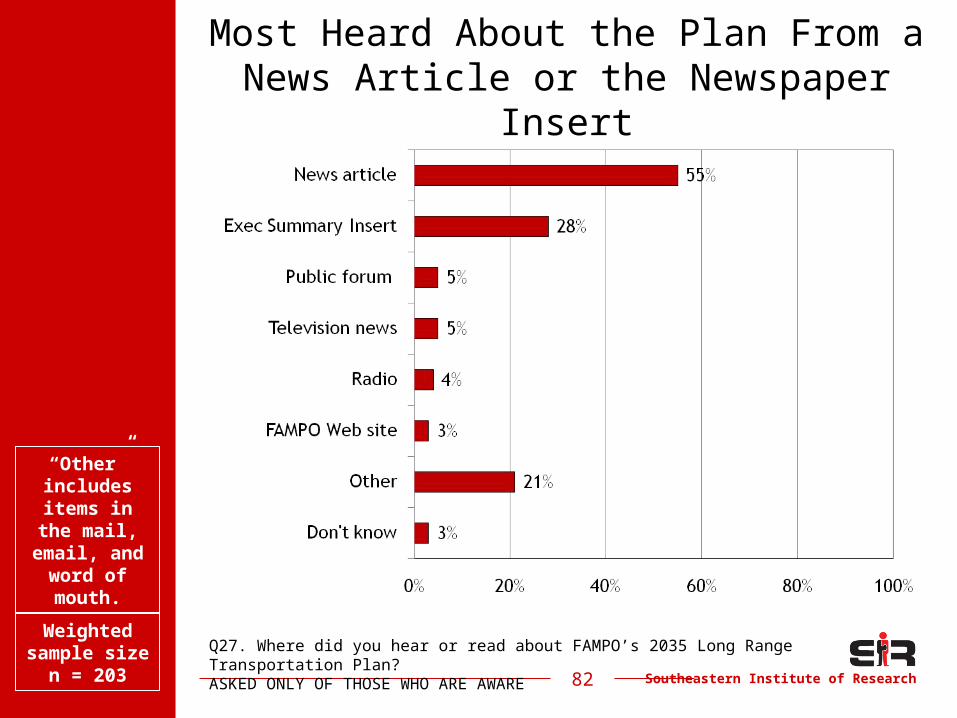
Southeastern Institute of Research82
Most Heard About the Plan From aNews Article or the Newspaper Insert
Q27. Where did you hear or read about FAMPO’s 2035 Long Range Transportation Plan?ASKED ONLY OF THOSE WHO ARE AWARE
Weighted sample size
n = 203
“Other” includes items in the mail,
email, and word of mouth.
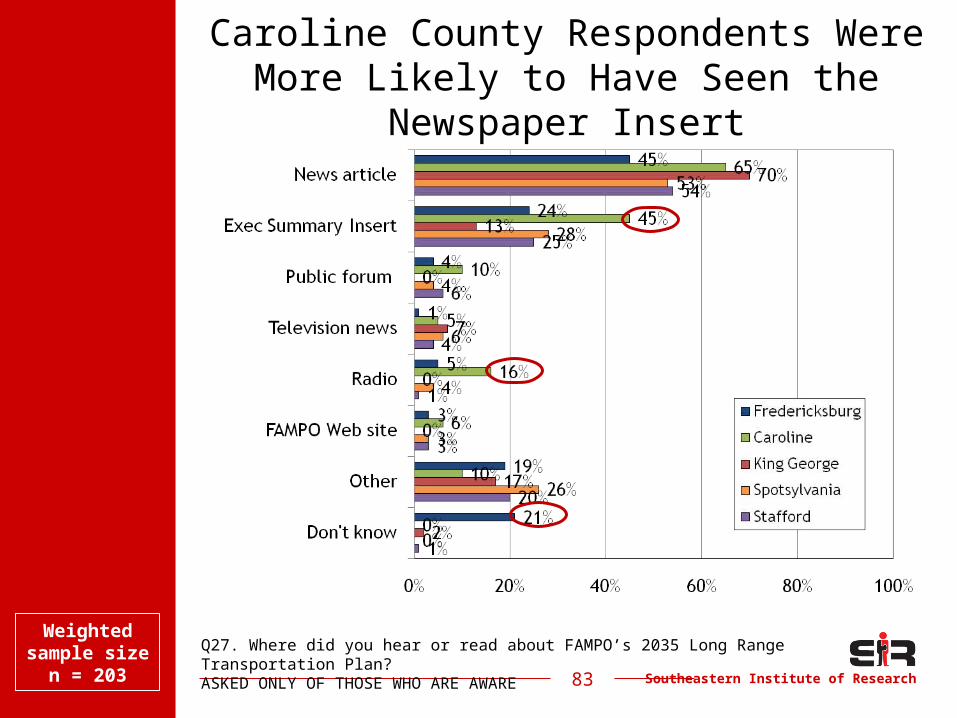
Southeastern Institute of Research83
Caroline County Respondents Were More Likely to Have Seen the
Newspaper Insert
Q27. Where did you hear or read about FAMPO’s 2035 Long Range Transportation Plan?ASKED ONLY OF THOSE WHO ARE AWARE
Weighted sample size
n = 203
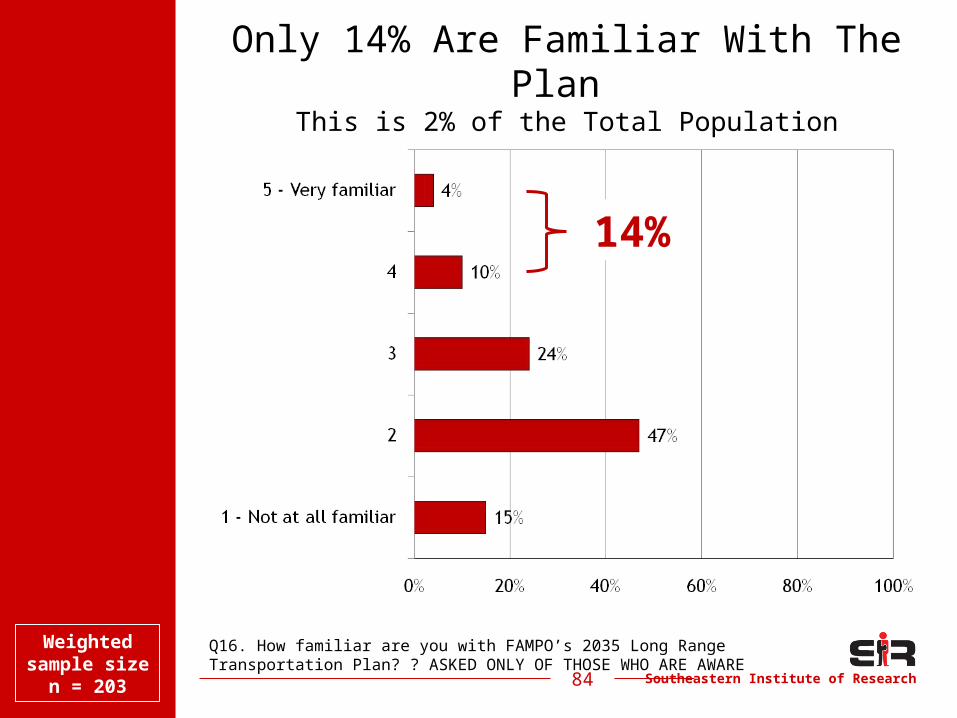
Southeastern Institute of Research84
Only 14% Are Familiar With The Plan This is 2% of the Total Population
Q16. How familiar are you with FAMPO’s 2035 Long Range Transportation Plan? ? ASKED ONLY OF THOSE WHO ARE AWARE
14%
Weighted sample size
n = 203
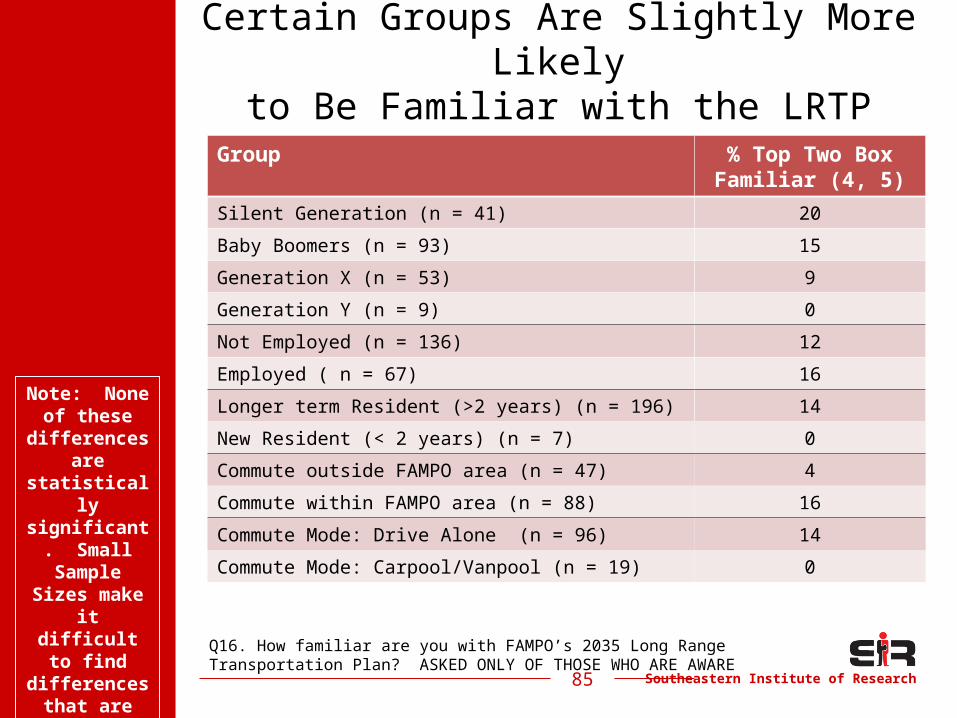
Southeastern Institute of Research
Certain Groups Are Slightly More Likely
to Be Familiar with the LRTPGroup % Top Two Box
Familiar (4, 5)
Silent Generation (n = 41) 20
Baby Boomers (n = 93) 15
Generation X (n = 53) 9
Generation Y (n = 9) 0
Not Employed (n = 136) 12
Employed ( n = 67) 16
Longer term Resident (>2 years) (n = 196) 14
New Resident (< 2 years) (n = 7) 0
Commute outside FAMPO area (n = 47) 4
Commute within FAMPO area (n = 88) 16
Commute Mode: Drive Alone (n = 96) 14
Commute Mode: Carpool/Vanpool (n = 19) 0
85
Note: None of these
differences are
statistically significant.
Small Sample
Sizes make it difficult
to find differences
that are statistically significant.
Q16. How familiar are you with FAMPO’s 2035 Long Range Transportation Plan? ASKED ONLY OF THOSE WHO ARE AWARE
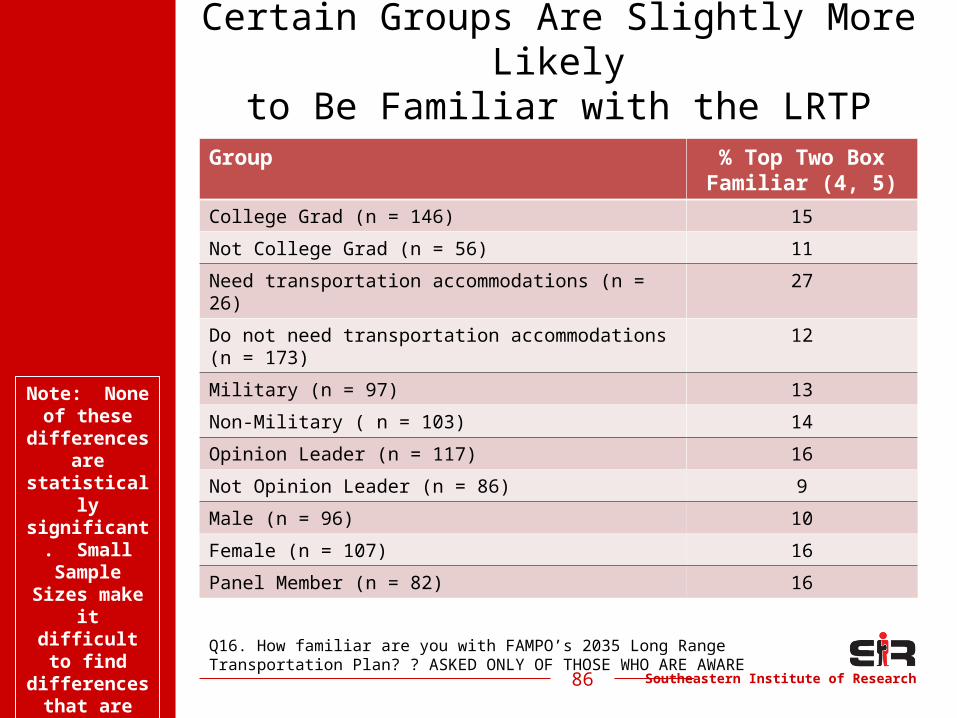
Southeastern Institute of Research
Certain Groups Are Slightly More Likely
to Be Familiar with the LRTPGroup % Top Two Box
Familiar (4, 5)
College Grad (n = 146) 15
Not College Grad (n = 56) 11
Need transportation accommodations (n = 26) 27
Do not need transportation accommodations (n = 173)
12
Military (n = 97) 13
Non-Military ( n = 103) 14
Opinion Leader (n = 117) 16
Not Opinion Leader (n = 86) 9
Male (n = 96) 10
Female (n = 107) 16
Panel Member (n = 82) 16
86
Note: None of these
differences are
statistically significant.
Small Sample
Sizes make it difficult
to find differences
that are statistically significant.
Q16. How familiar are you with FAMPO’s 2035 Long Range Transportation Plan? ? ASKED ONLY OF THOSE WHO ARE AWARE
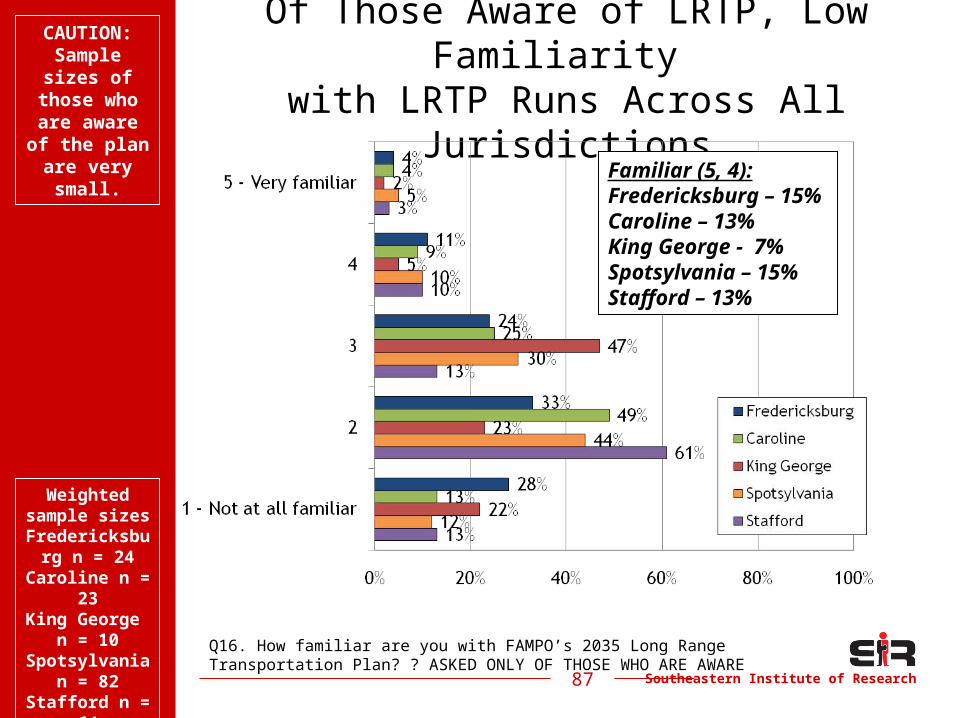
Southeastern Institute of Research87
Of Those Aware of LRTP, Low Familiarity
with LRTP Runs Across All Jurisdictions
CAUTION:Sample sizes of
those who are aware of the plan
are very small.
Weighted sample sizes Fredericksburg n = 24
Caroline n = 23
King George n = 10
Spotsylvania n = 82
Stafford n = 64
Q16. How familiar are you with FAMPO’s 2035 Long Range Transportation Plan? ? ASKED ONLY OF THOSE WHO ARE AWARE
Familiar (5, 4):Fredericksburg – 15%Caroline – 13%King George - 7%Spotsylvania – 15%Stafford – 13%
Southeastern Institute of Research88
110 Respondents Were Familiar Enough (Gave a Rating of 3, 4, or 5)
to Continue with the Survey
• The area breakdown is as follows:– 26 in Fredericksburg– 14 in Caroline County– 11 in King George County– 39 in Spotsylvania County– 20 in Stafford County
• Note: the above numbers are not weighted
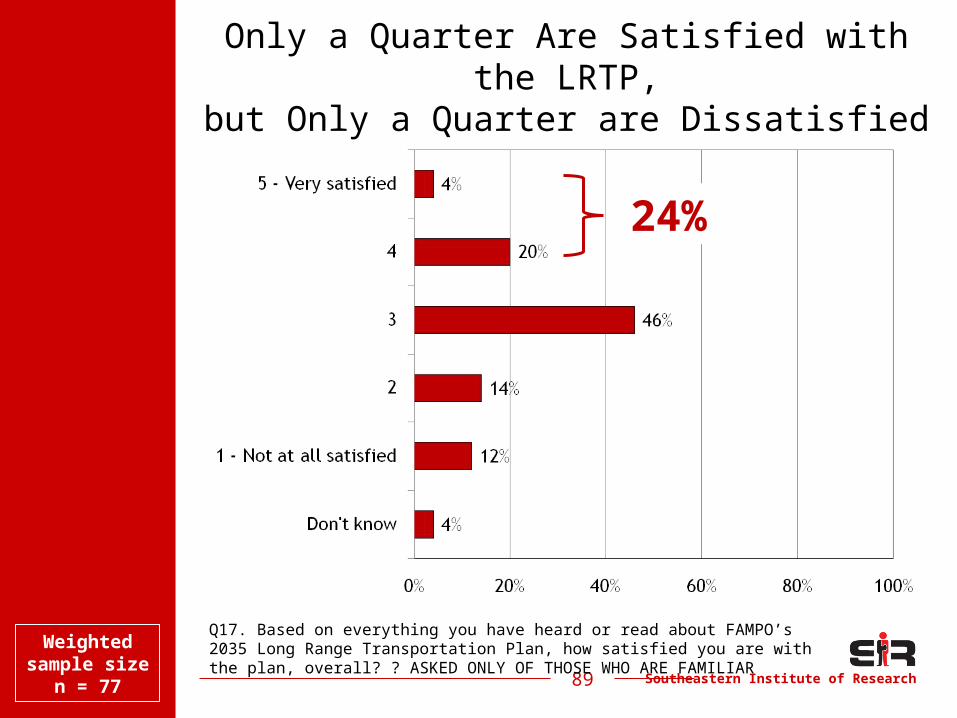
Southeastern Institute of Research89
Only a Quarter Are Satisfied with the LRTP,but Only a Quarter are Dissatisfied
Q17. Based on everything you have heard or read about FAMPO’s 2035 Long Range Transportation Plan, how satisfied you are with the plan, overall? ? ASKED ONLY OF THOSE WHO ARE FAMILIAR
24%
Weighted sample size
n = 77
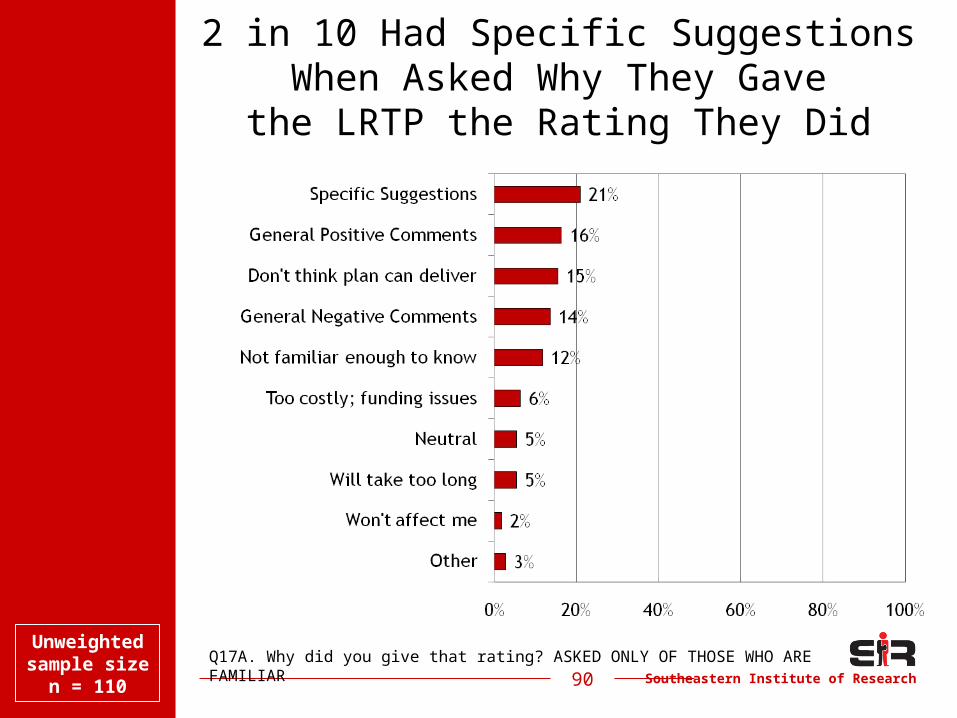
Southeastern Institute of Research
2 in 10 Had Specific SuggestionsWhen Asked Why They Gavethe LRTP the Rating They Did
90Q17A. Why did you give that rating? ASKED ONLY OF THOSE WHO ARE FAMILIAR
Unweighted sample
size n = 110
Southeastern Institute of Research91
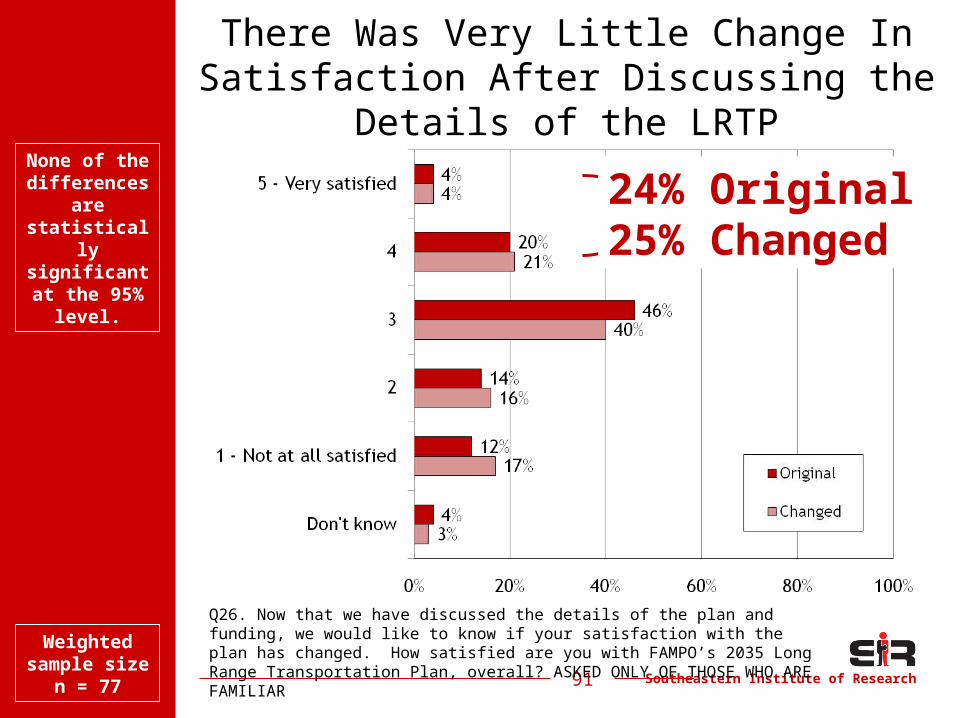
There Was Very Little Change In Satisfaction After Discussing the Details
of the LRTP
Q26. Now that we have discussed the details of the plan and funding, we would like to know if your satisfaction with the plan has changed. How satisfied are you with FAMPO’s 2035 Long Range Transportation Plan, overall? ASKED ONLY OF THOSE WHO ARE FAMILIAR
24% Original25% Changed
Weighted sample size
n = 77
None of the differences
are statistically significant at the 95%
level.
Southeastern Institute of Research92
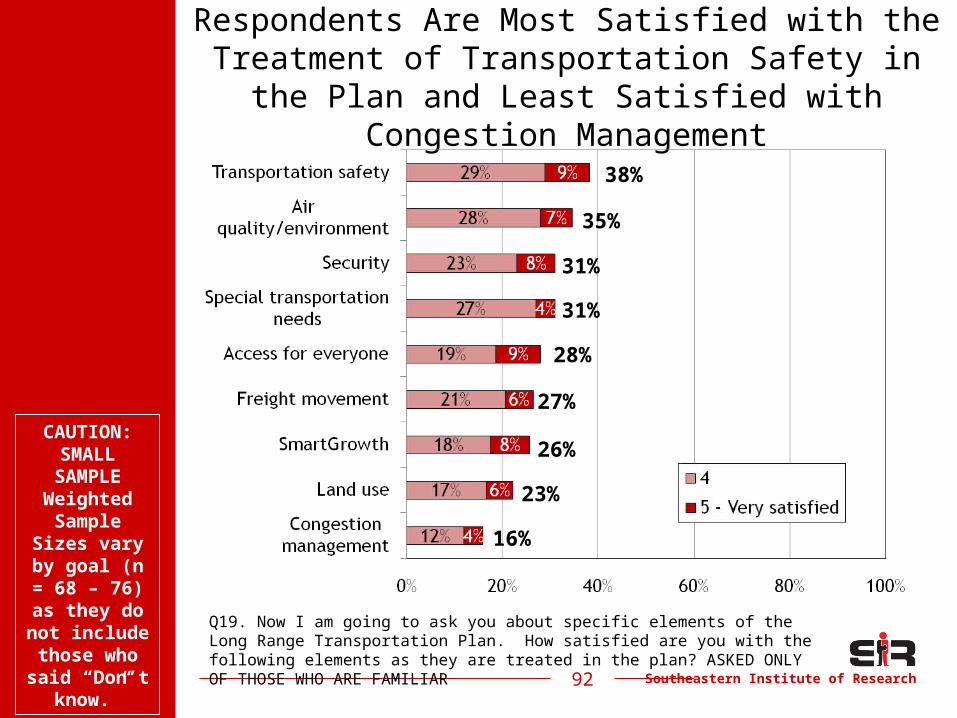
Respondents Are Most Satisfied with the Treatment of Transportation Safety in the Plan
and Least Satisfied with Congestion Management
Q19. Now I am going to ask you about specific elements of the Long Range Transportation Plan. How satisfied are you with the following elements as they are treated in the plan? ASKED ONLY OF THOSE WHO ARE FAMILIAR
CAUTION: SMALL
SAMPLEWeighted Sample
Sizes vary by goal (n = 68 – 76) as they do not include those who said “Don’t
know.”
38%
31%
28%
27%
23%
35%
31%
26%
16%
Southeastern Institute of Research93
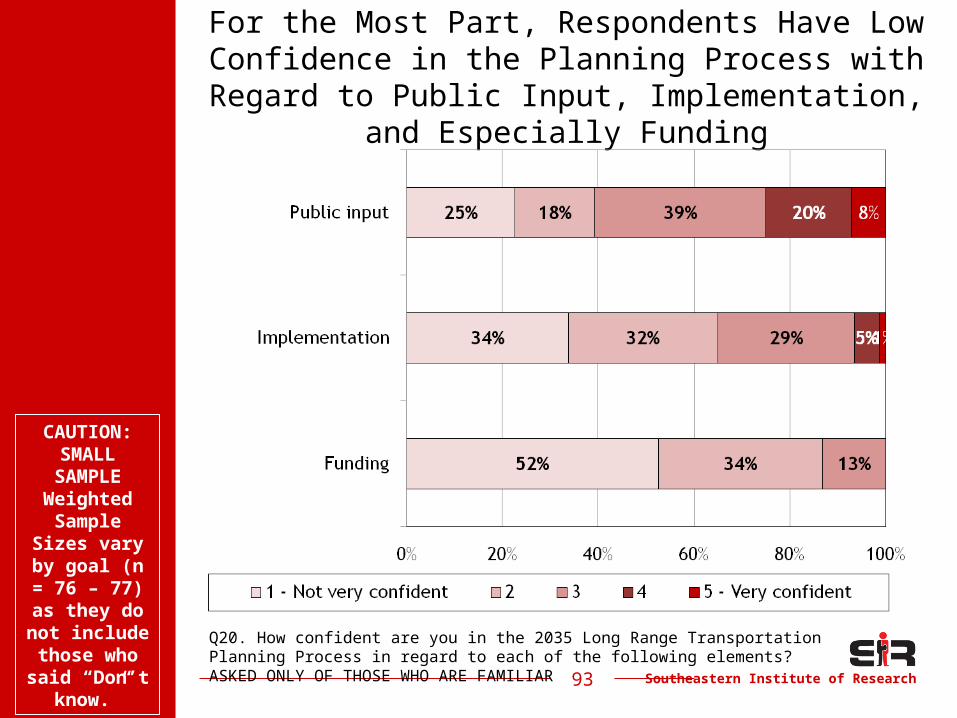
For the Most Part, Respondents Have Low Confidence in the Planning Process with Regard to Public Input, Implementation, and Especially
Funding
Q20. How confident are you in the 2035 Long Range Transportation Planning Process in regard to each of the following elements? ASKED ONLY OF THOSE WHO ARE FAMILIAR
CAUTION: SMALL
SAMPLEWeighted Sample
Sizes vary by goal (n = 76 – 77) as they do not include those who said “Don’t
know.”
Southeastern Institute of Research94
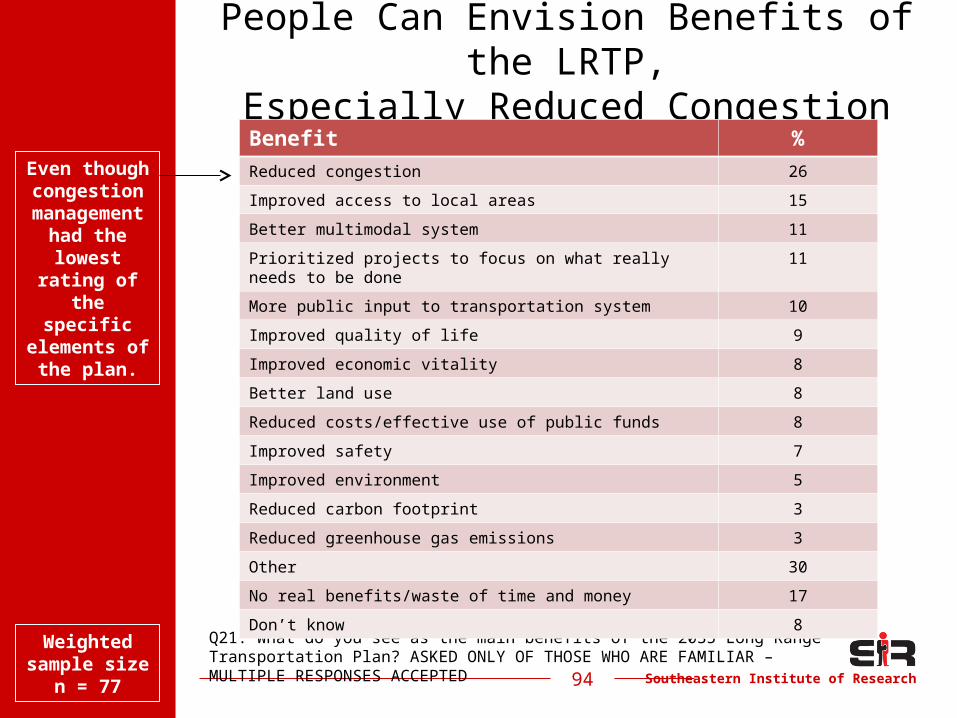
People Can Envision Benefits of the LRTP,
Especially Reduced Congestion
Q21. What do you see as the main benefits of the 2035 Long Range Transportation Plan? ASKED ONLY OF THOSE WHO ARE FAMILIAR – MULTIPLE RESPONSES ACCEPTED
Weighted sample size
n = 77
Benefit %Reduced congestion 26
Improved access to local areas 15
Better multimodal system 11
Prioritized projects to focus on what really needs to be done
11
More public input to transportation system 10
Improved quality of life 9
Improved economic vitality 8
Better land use 8
Reduced costs/effective use of public funds 8
Improved safety 7
Improved environment 5
Reduced carbon footprint 3
Reduced greenhouse gas emissions 3
Other 30
No real benefits/waste of time and money 17
Don’t know 8
Even though
congestion management had the
lowest rating of
the specific elements of
the plan.
Southeastern Institute of Research95
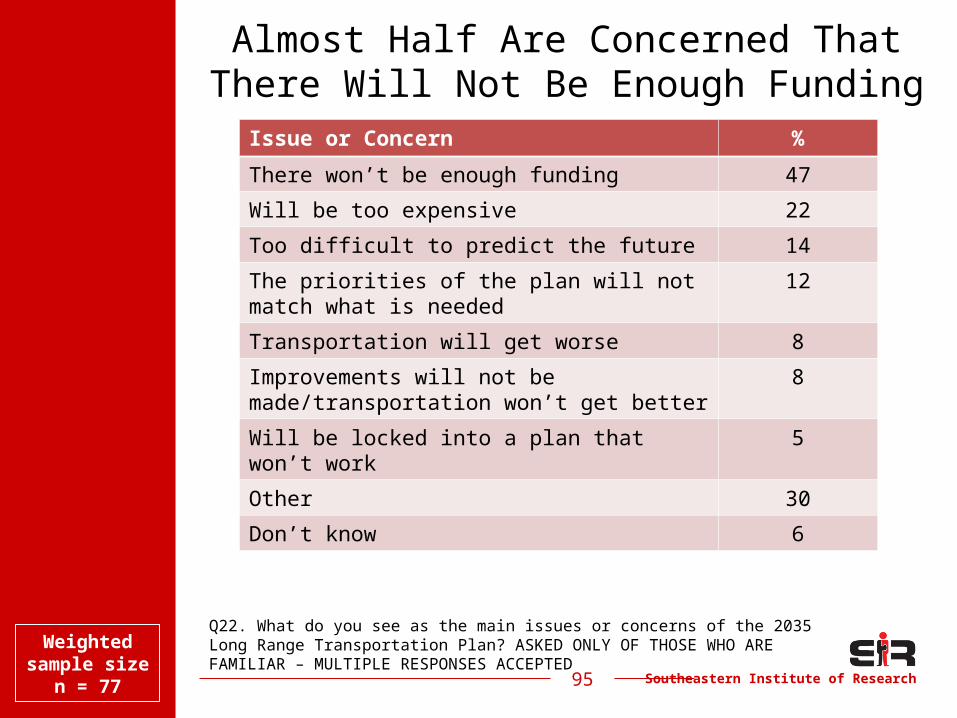
Almost Half Are Concerned ThatThere Will Not Be Enough Funding
Q22. What do you see as the main issues or concerns of the 2035 Long Range Transportation Plan? ASKED ONLY OF THOSE WHO ARE FAMILIAR – MULTIPLE RESPONSES ACCEPTED
Weighted sample size
n = 77
Issue or Concern %
There won’t be enough funding 47
Will be too expensive 22
Too difficult to predict the future 14
The priorities of the plan will not match what is needed
12
Transportation will get worse 8
Improvements will not be made/transportation won’t get better
8
Will be locked into a plan that won’t work 5
Other 30
Don’t know 6
Southeastern Institute of Research96
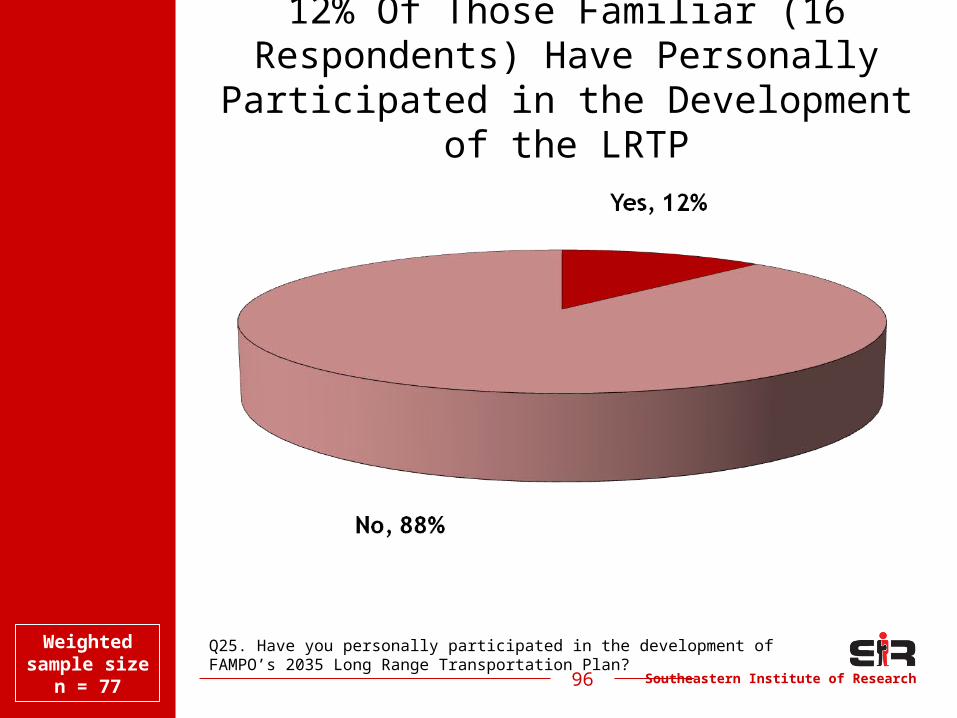
12% Of Those Familiar (16 Respondents) Have Personally
Participated in the Development of the LRTP
Q25. Have you personally participated in the development of FAMPO’s 2035 Long Range Transportation Plan?
Weighted sample size
n = 77
Southeastern Institute of Research97
Funding
Southeastern Institute of Research98
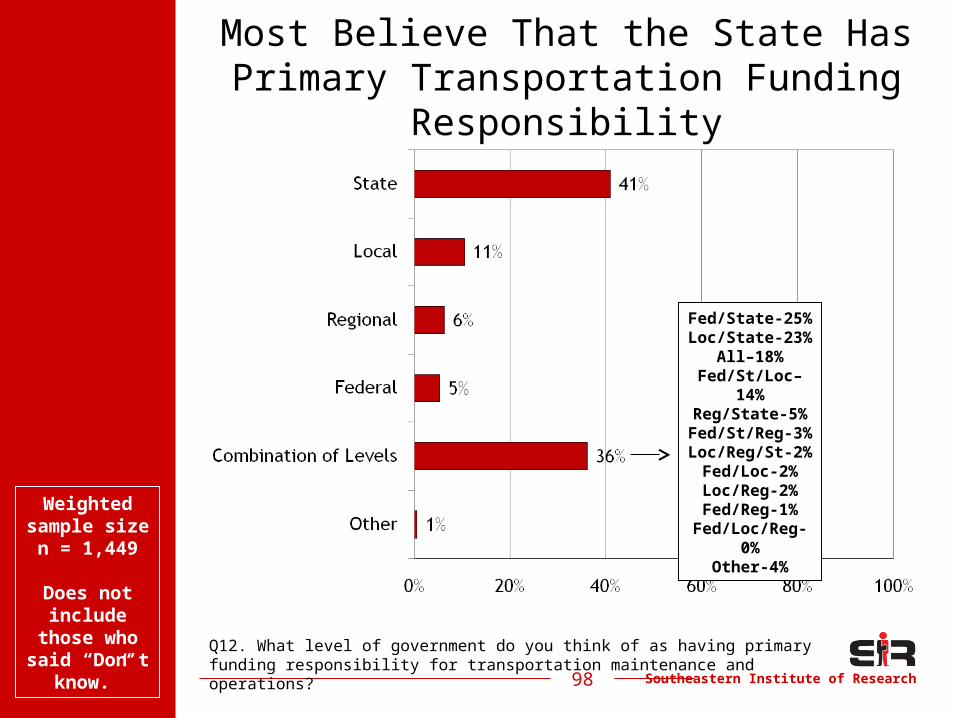
Most Believe That the State Has Primary Transportation Funding
Responsibility
Q12. What level of government do you think of as having primary funding responsibility for transportation maintenance and operations?
Weighted sample size n = 1,449
Does not include
those who said “Don’t
know.”
Fed/State-25%
Loc/State-23%
All–18%Fed/St/Loc–
14%Reg/State-5%Fed/St/Reg-
3%Loc/Reg/St-
2%Fed/Loc-2%Loc/Reg-2%Fed/Reg-1%Fed/Loc/Reg-
0%Other-4%
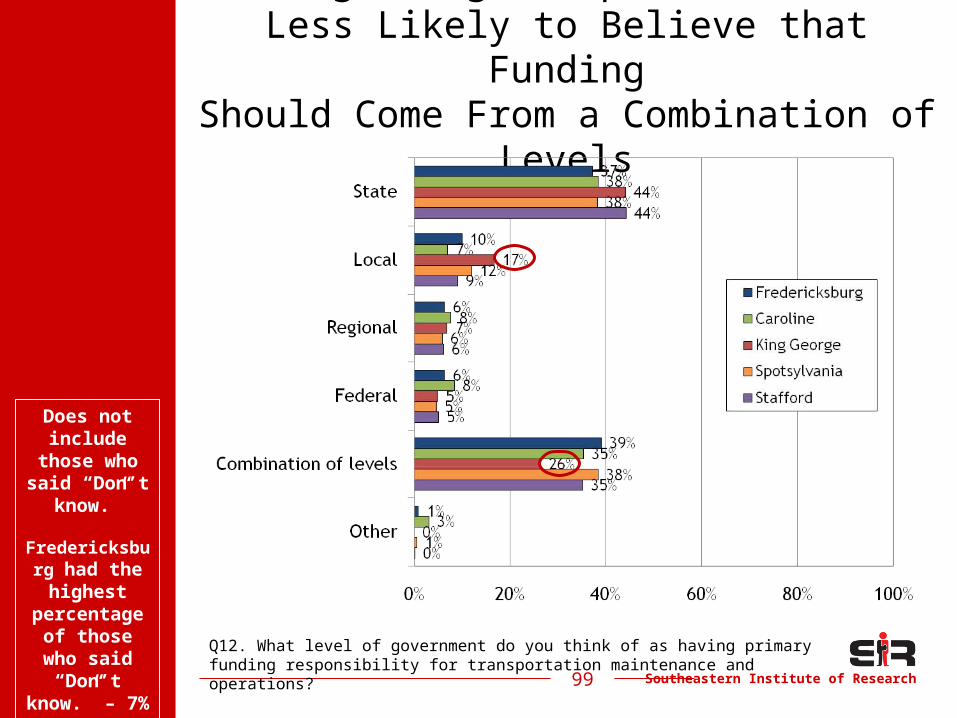
Southeastern Institute of Research99
King George Respondents AreLess Likely to Believe that Funding
Should Come From a Combination of Levels
Q12. What level of government do you think of as having primary funding responsibility for transportation maintenance and operations?
Does not include
those who said “Don’t
know.”
Fredericksburg had the
highest percentage
of those who said “Don’t
know.” – 7%
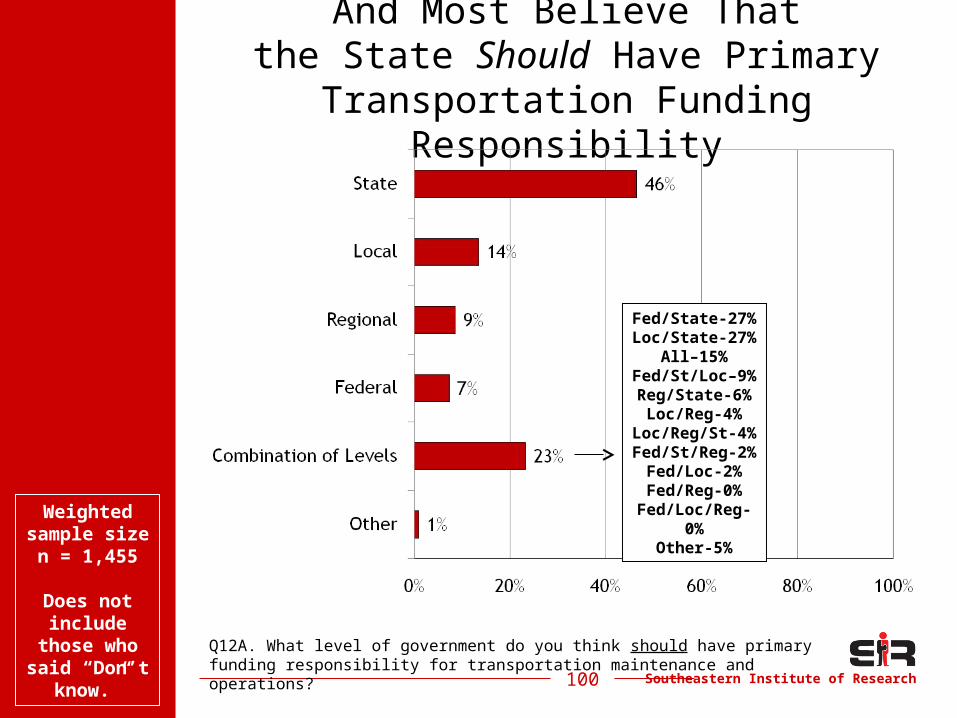
Southeastern Institute of Research100
And Most Believe Thatthe State Should Have Primary
Transportation Funding Responsibility
Weighted sample size n = 1,455
Does not include
those who said “Don’t
know.”
Q12A. What level of government do you think should have primary funding responsibility for transportation maintenance and operations?
Fed/State-27%
Loc/State-27%
All–15%Fed/St/Loc–
9%Reg/State-6%Loc/Reg-4%Loc/Reg/St-
4%Fed/St/Reg-
2%Fed/Loc-2%Fed/Reg-0%Fed/Loc/Reg-
0%Other-5%
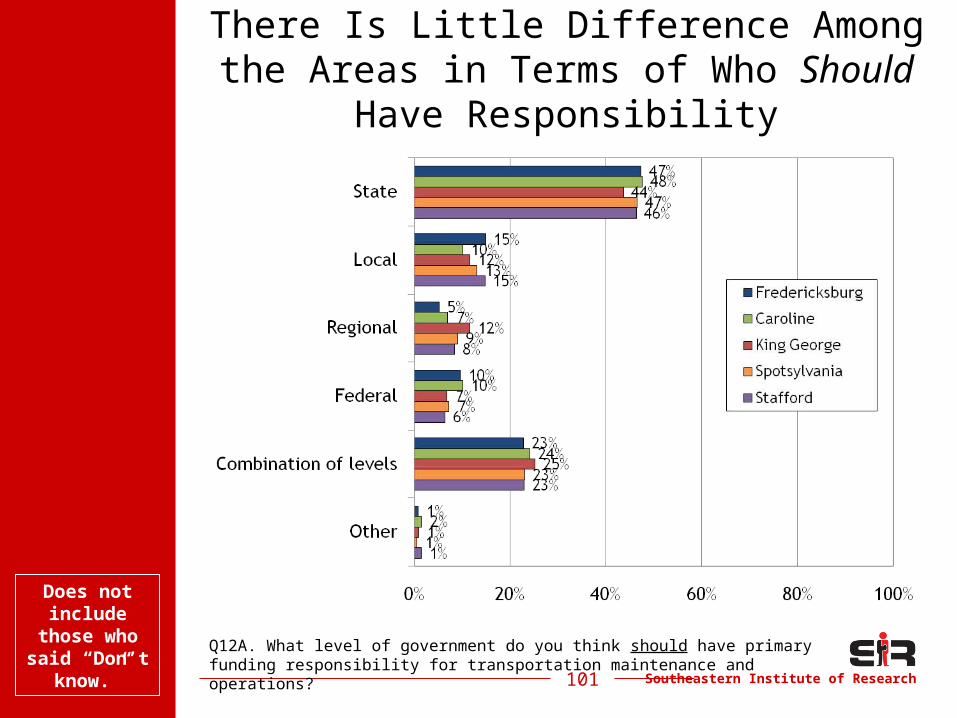
Southeastern Institute of Research101
There Is Little Difference Among the Areas in Terms of Who Should Have
Responsibility
Q12A. What level of government do you think should have primary funding responsibility for transportation maintenance and operations?
Does not include
those who said “Don’t
know.”
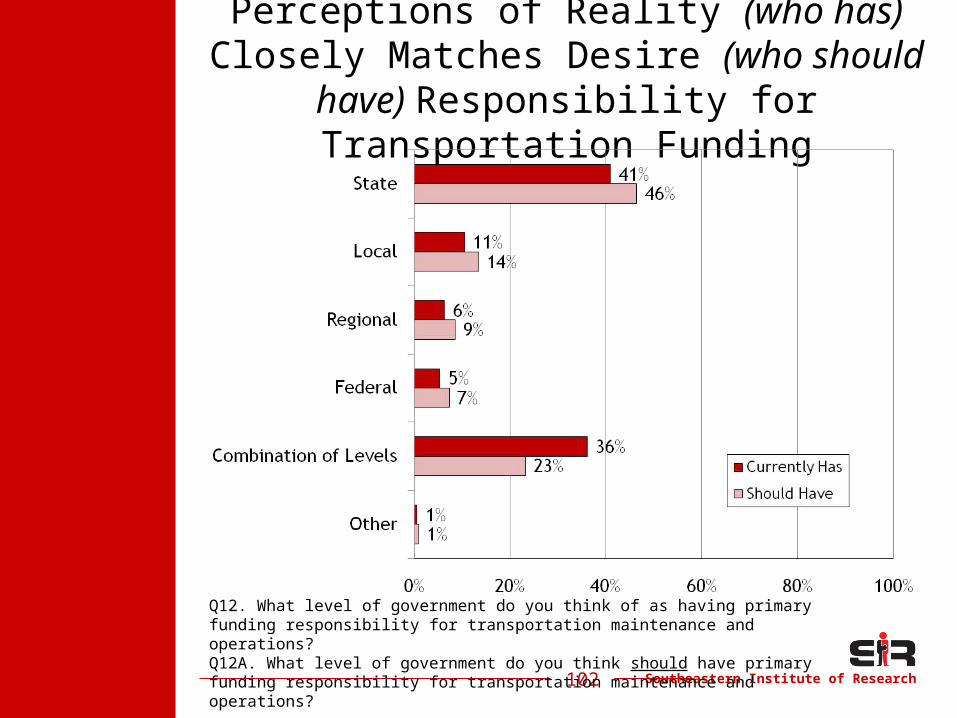
Southeastern Institute of Research102
Perceptions of Reality (who has)Closely Matches Desire (who should
have) Responsibility for Transportation Funding
Q12. What level of government do you think of as having primary funding responsibility for transportation maintenance and operations?Q12A. What level of government do you think should have primary funding responsibility for transportation maintenance and operations?
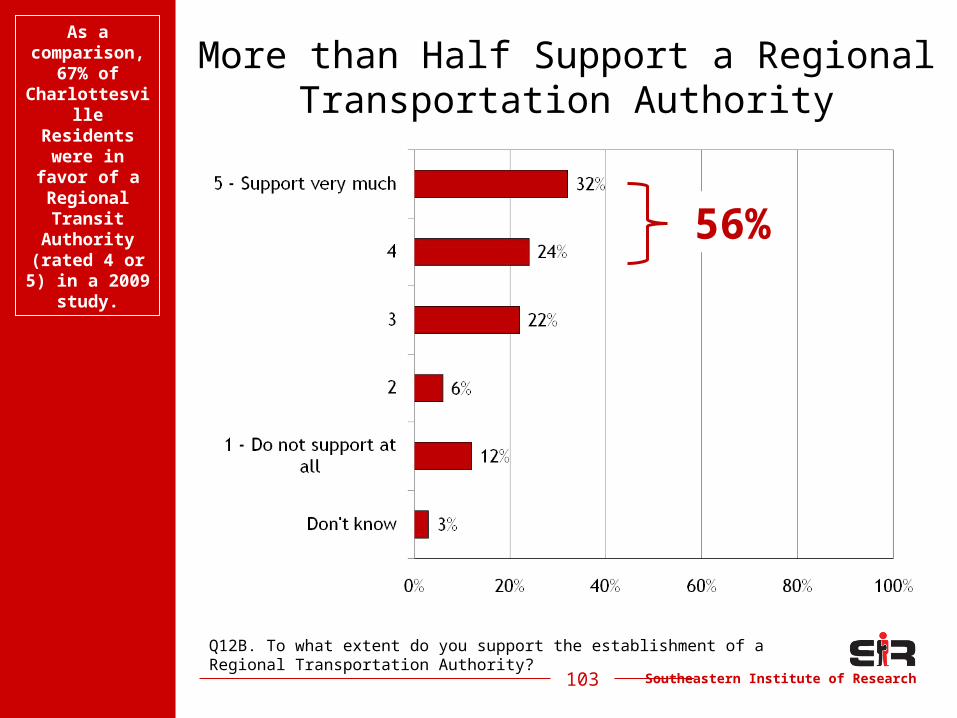
Southeastern Institute of Research103
More than Half Support a Regional Transportation Authority
Q12B. To what extent do you support the establishment of a Regional Transportation Authority?
56%
As a comparison,
67% of Charlottesville Residents
were in favor of a Regional Transit
Authority (rated 4 or 5) in a 2009
study.
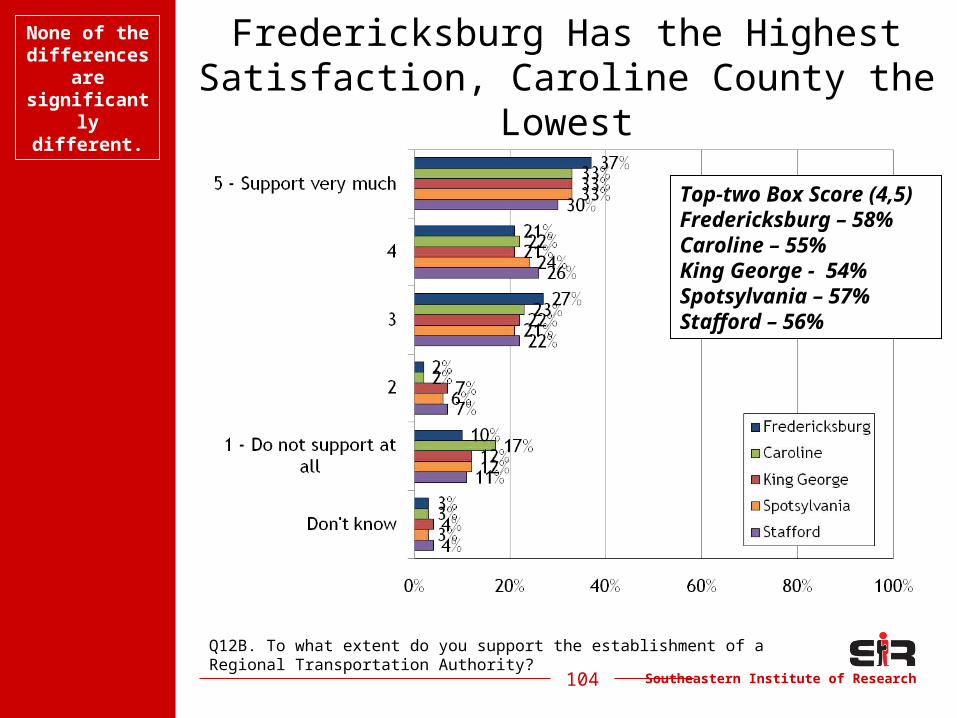
Southeastern Institute of Research104
Fredericksburg Has the Highest Satisfaction, Caroline County the
Lowest
Q12B. To what extent do you support the establishment of a Regional Transportation Authority?
Top-two Box Score (4,5)Fredericksburg – 58%Caroline – 55%King George - 54%Spotsylvania – 57%Stafford – 56%
None of the differences
are significantly different.
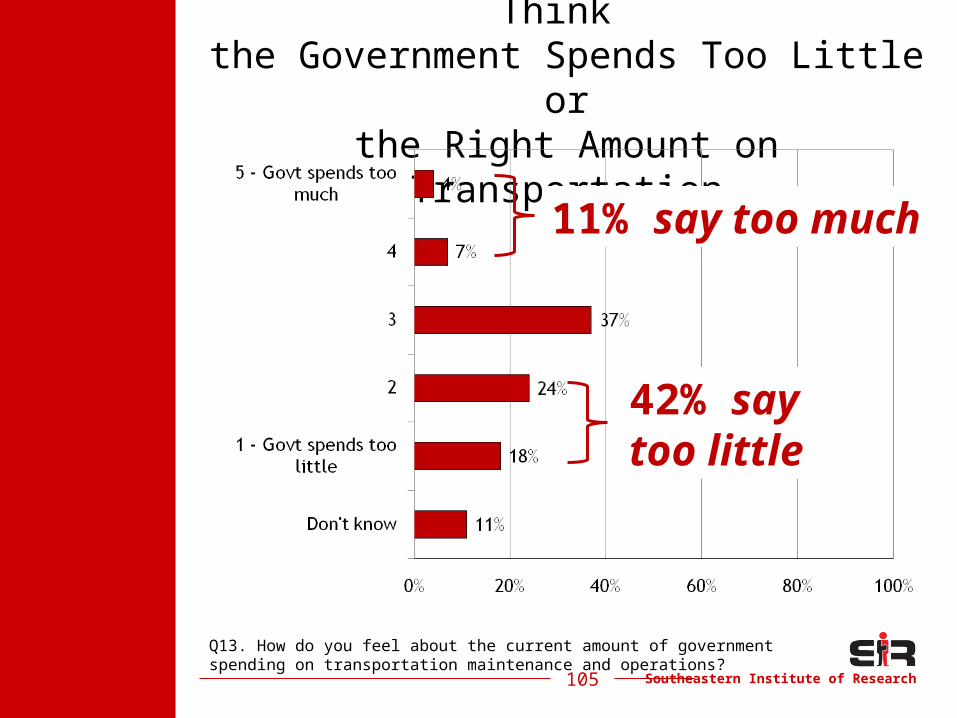
Southeastern Institute of Research105
Respondents Are More Likely to Think the Government Spends Too Little orthe Right Amount on Transportation
Q13. How do you feel about the current amount of government spending on transportation maintenance and operations?
11% say too much
42% say too little
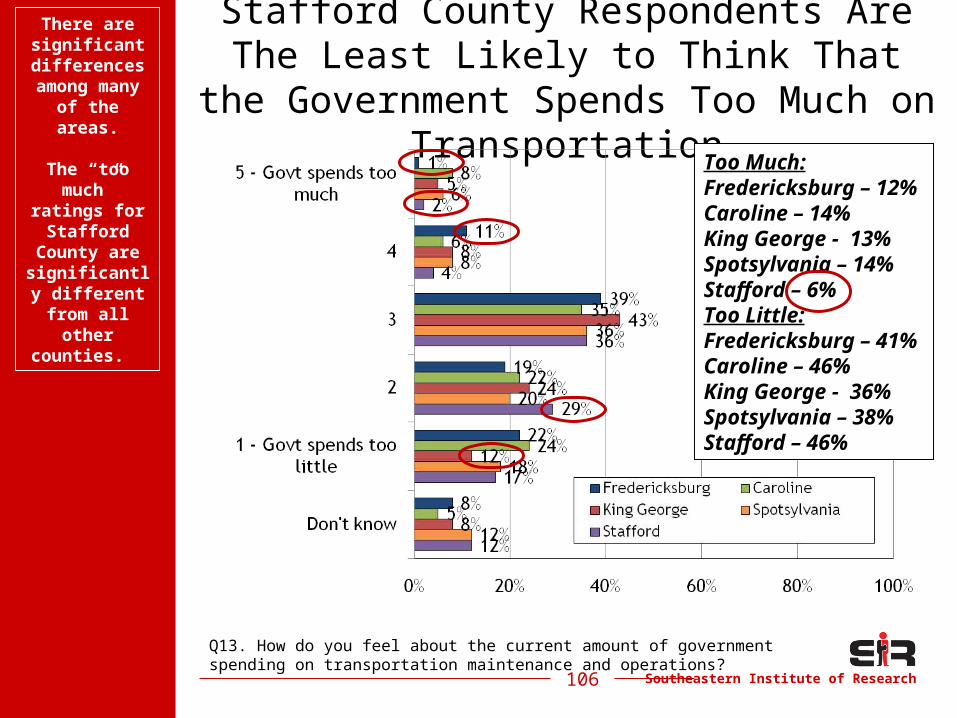
Southeastern Institute of Research106
Stafford County Respondents Are The Least Likely to Think That the
Government Spends Too Much on Transportation
Q13. How do you feel about the current amount of government spending on transportation maintenance and operations?
Too Much:Fredericksburg – 12%Caroline – 14%King George - 13%Spotsylvania – 14%Stafford – 6%Too Little:Fredericksburg – 41%Caroline – 46%King George - 36%Spotsylvania – 38%Stafford – 46%
There are significant differences
among many of the
areas.
The “too much”
ratings for Stafford
County are significantly
different from all other
counties.
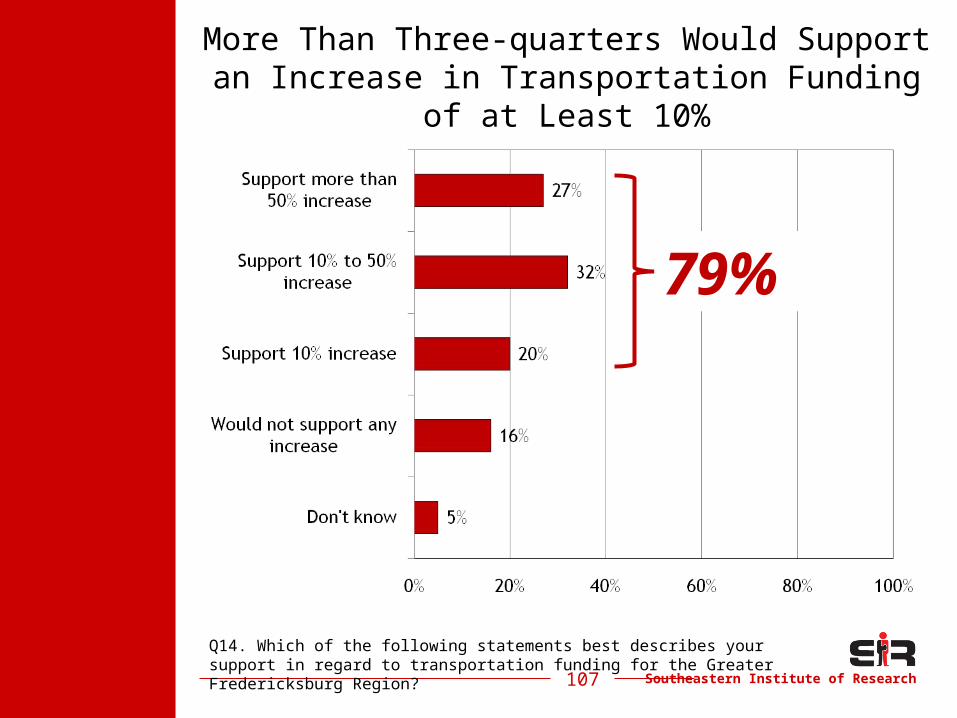
Southeastern Institute of Research107
More Than Three-quarters Would Support an Increase in Transportation Funding of at Least
10%
Q14. Which of the following statements best describes your support in regard to transportation funding for the Greater Fredericksburg Region?
79%
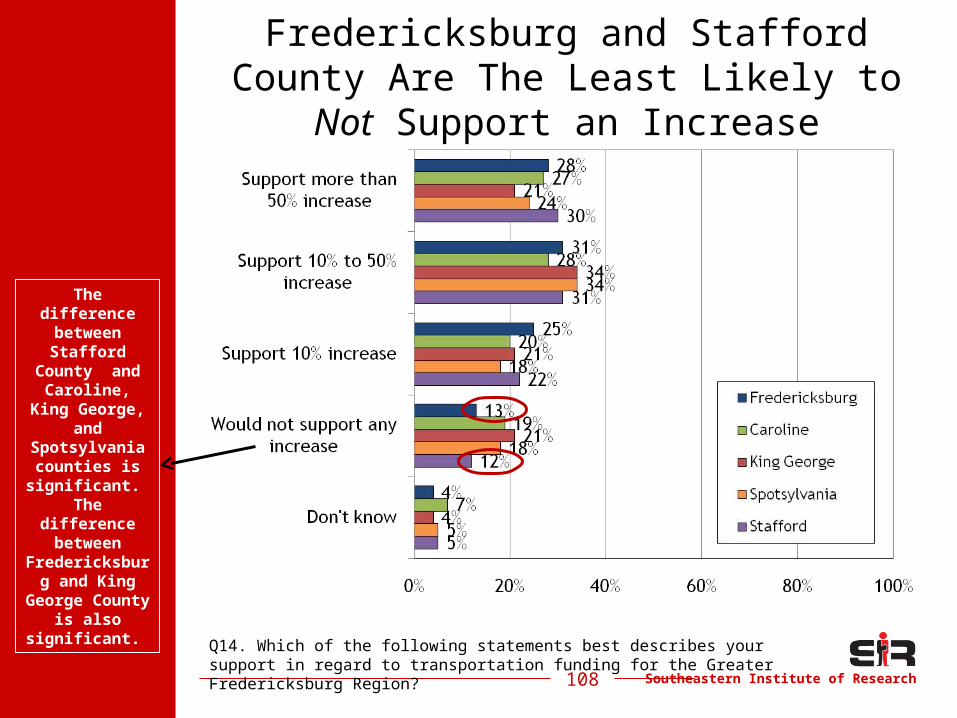
Southeastern Institute of Research108
Fredericksburg and Stafford County Are The Least Likely to Not Support an
Increase
The difference between Stafford
County and Caroline,
King George, and
Spotsylvania counties is significant.
The difference between
Fredericksburg and King
George County is
also significant.
Q14. Which of the following statements best describes your support in regard to transportation funding for the Greater Fredericksburg Region?
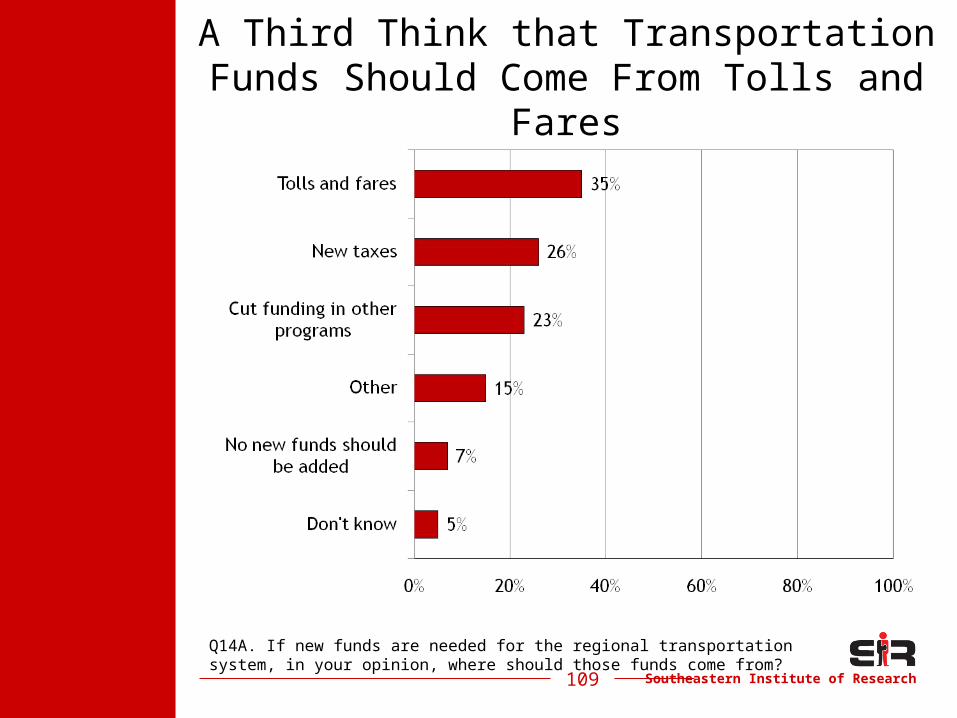
Southeastern Institute of Research109
A Third Think that Transportation Funds Should Come From Tolls and Fares
Q14A. If new funds are needed for the regional transportation system, in your opinion, where should those funds come from?
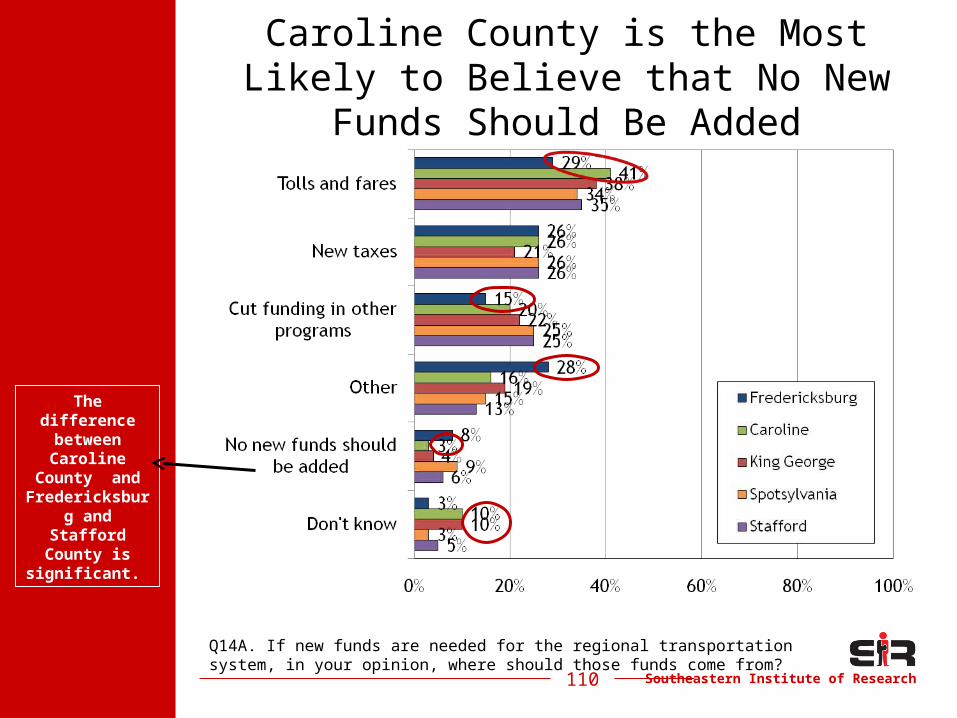
Southeastern Institute of Research110
Caroline County is the Most Likely to Believe that No New Funds Should Be
Added
Q14A. If new funds are needed for the regional transportation system, in your opinion, where should those funds come from?
The difference between Caroline
County and Fredericksbu
rg and Stafford County is
significant.
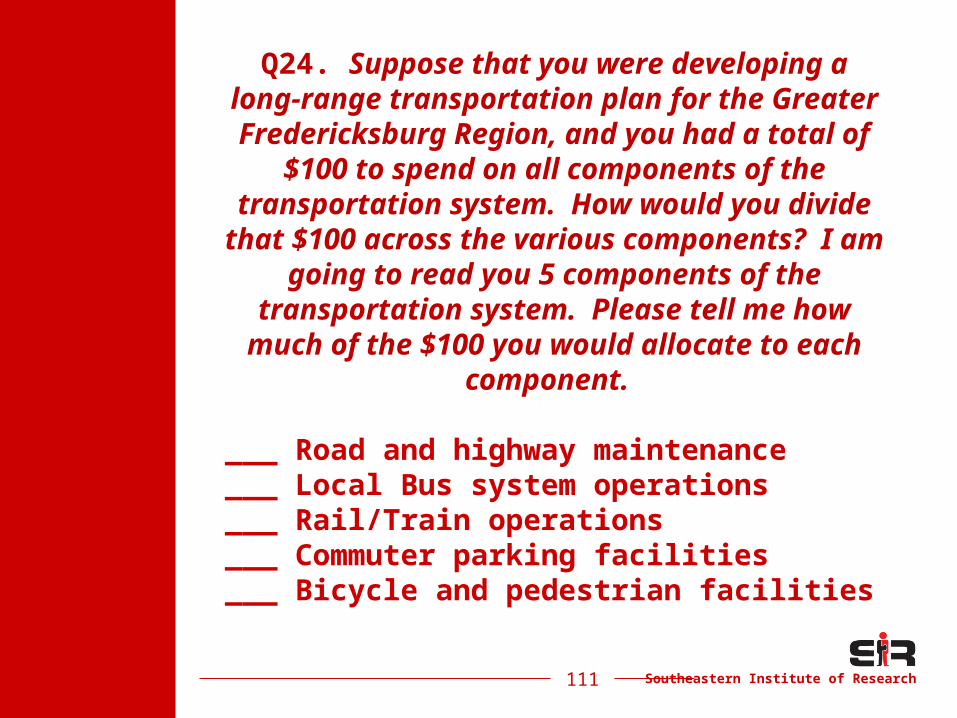
Southeastern Institute of Research111
Q24. Suppose that you were developing a long-range transportation
plan for the Greater Fredericksburg Region, and you had a total of $100 to
spend on all components of the transportation system. How would you
divide that $100 across the various components? I am going to read you 5
components of the transportation system. Please tell me how much of the $100 you would allocate to each
component.
___ Road and highway maintenance___ Local Bus system operations___ Rail/Train operations___ Commuter parking facilities___ Bicycle and pedestrian facilities
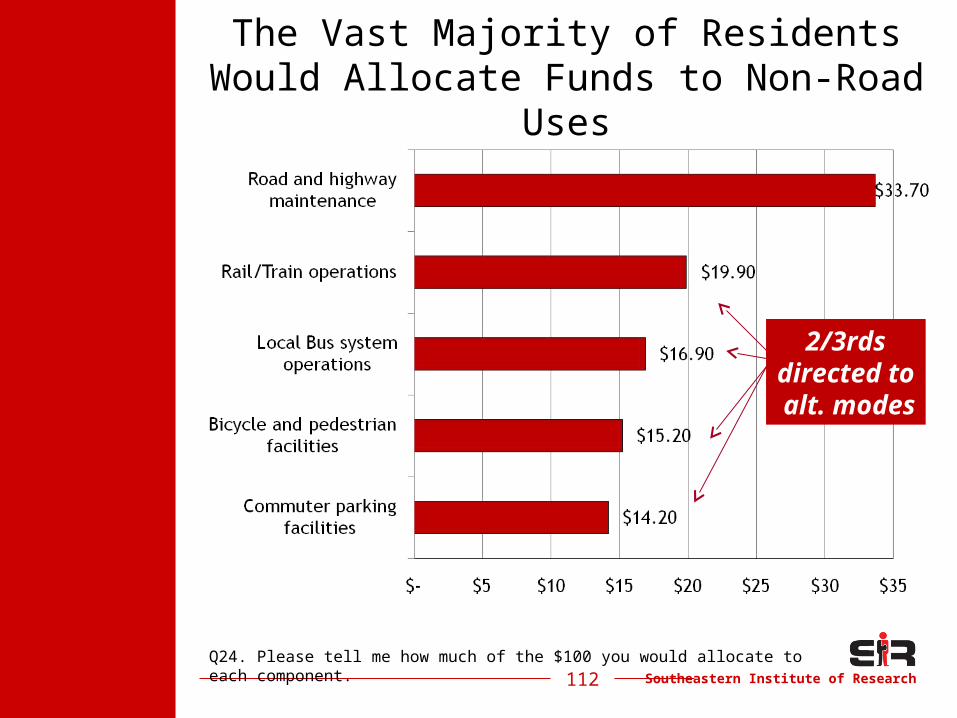
Southeastern Institute of Research112
The Vast Majority of Residents Would Allocate Funds to Non-Road Uses
Q24. Please tell me how much of the $100 you would allocate to each component.
2/3rds directed to alt. modes
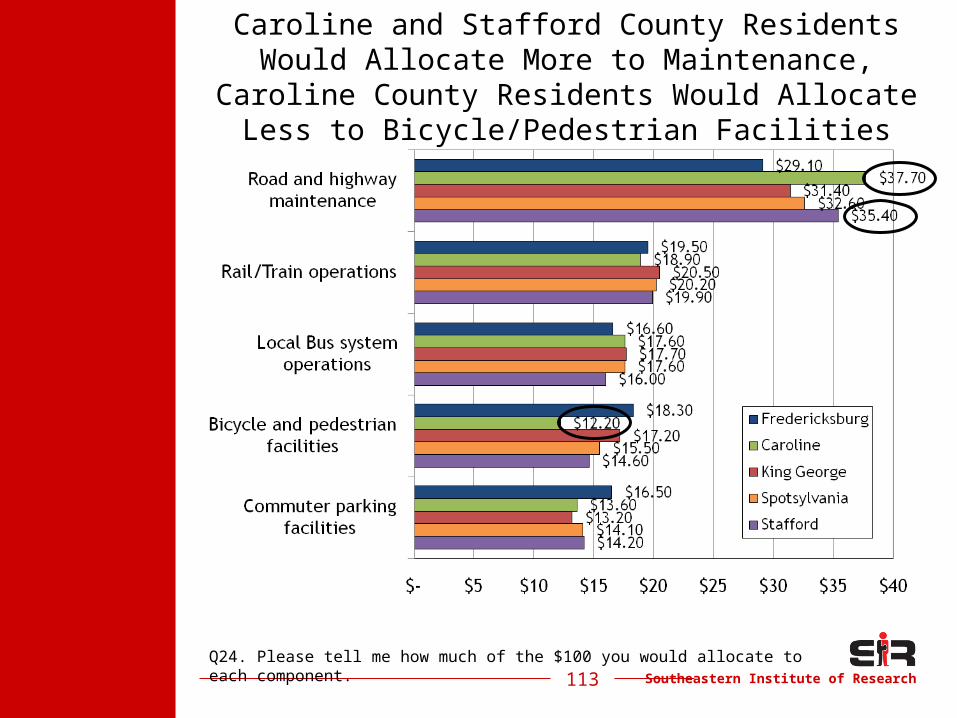
Southeastern Institute of Research113
Caroline and Stafford County Residents Would Allocate More to Maintenance, Caroline County
Residents Would Allocate Less to Bicycle/Pedestrian Facilities
Q24. Please tell me how much of the $100 you would allocate to each component.
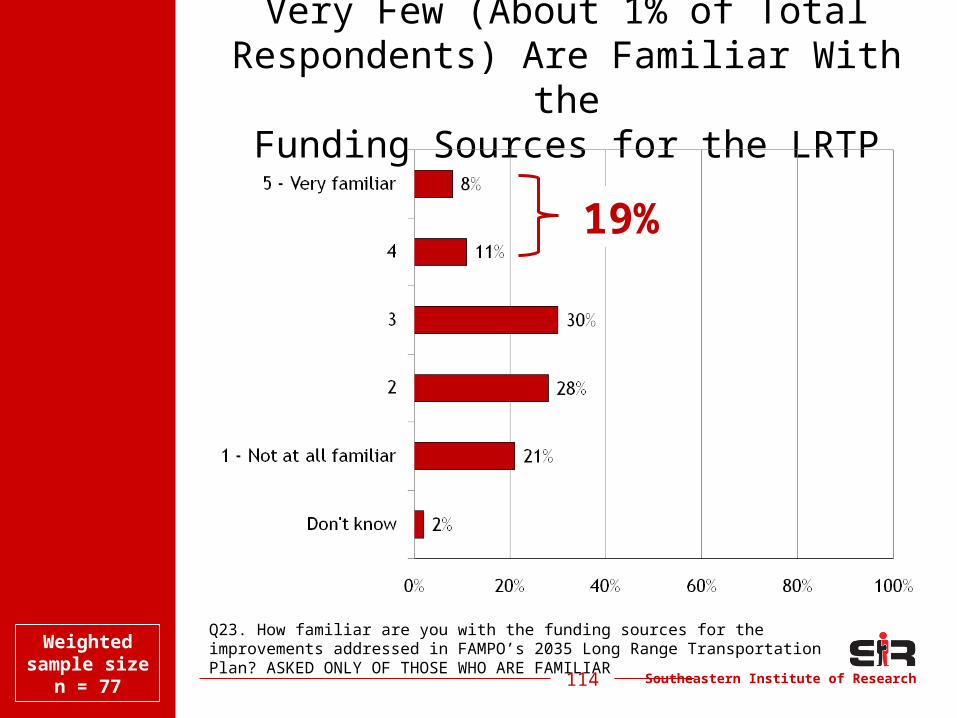
Southeastern Institute of Research114
Very Few (About 1% of Total Respondents) Are Familiar With the
Funding Sources for the LRTP
Q23. How familiar are you with the funding sources for the improvements addressed in FAMPO’s 2035 Long Range Transportation Plan? ASKED ONLY OF THOSE WHO ARE FAMILIAR
19%
Weighted sample size
n = 77
Southeastern Institute of Research115
Customer Panel
Southeastern Institute of Research116
Q36. Thank you for taking the time to share your opinions. The opinions
you shared in this survey will be very helpful to FAMPO.
From time to time we would like to test new ideas about transportation services and programs with a panel made up of people like you. Panel
members would share their opinions with us through short email surveys. We would not use your email for any
other purpose – just periodic feedback.
Would you be interested in possibly participating on such a panel?
Southeastern Institute of Research117
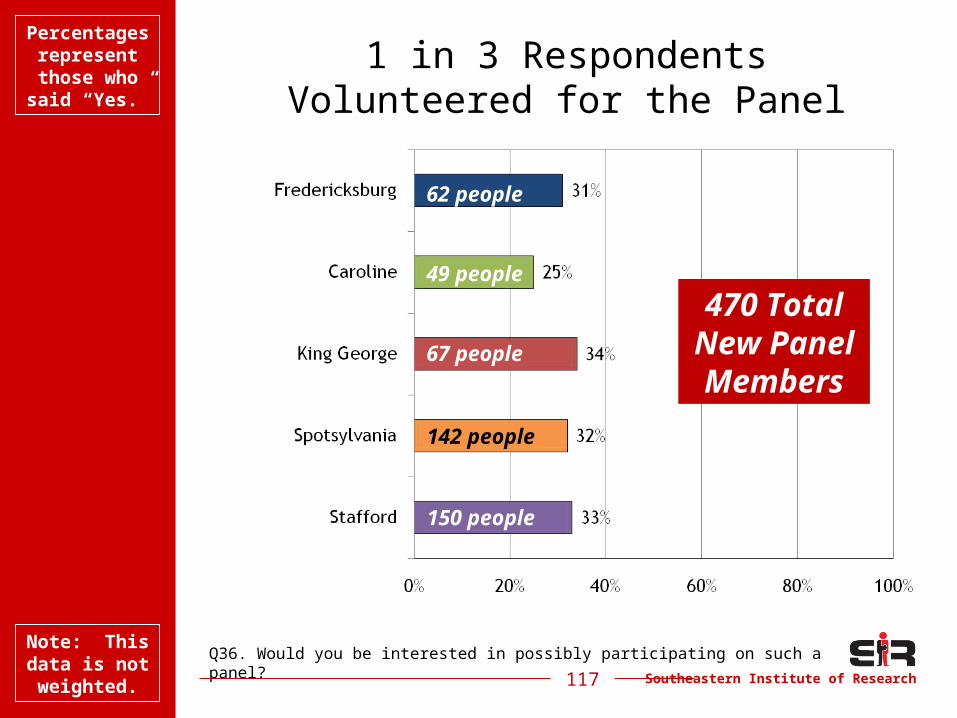
1 in 3 RespondentsVolunteered for the Panel
Q36. Would you be interested in possibly participating on such a panel?
Percentages represent those who said “Yes.”
Note: This data is not weighted.
62 people
49 people
67 people
142 people
150 people
470 Total New
Panel Members
Southeastern Institute of Research
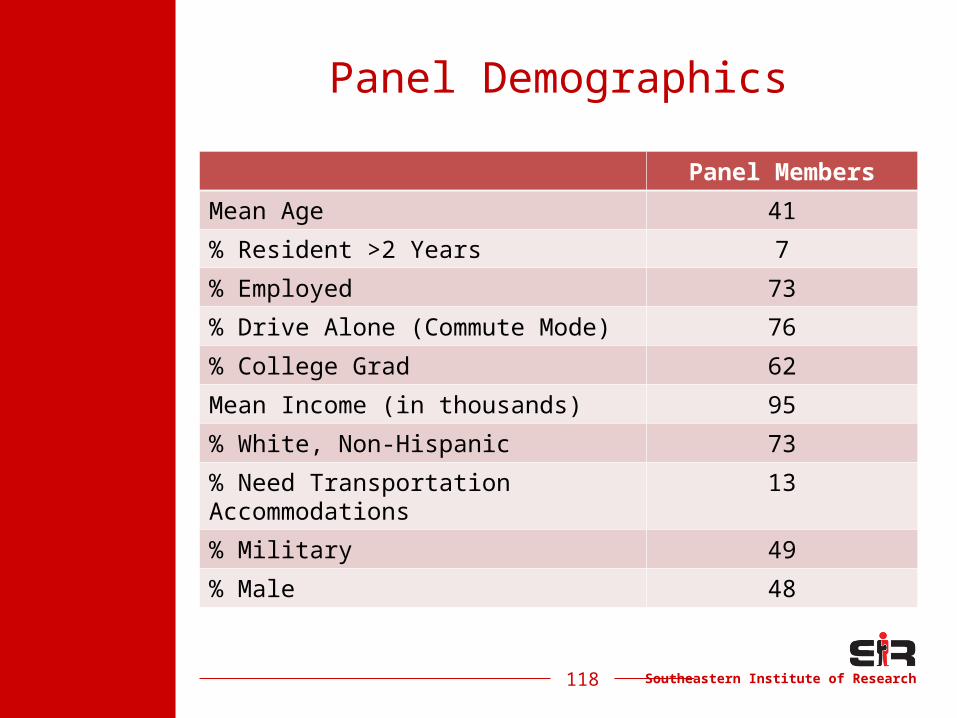
Panel Demographics
Panel Members
Mean Age 41
% Resident >2 Years 7
% Employed 73
% Drive Alone (Commute Mode) 76
% College Grad 62
Mean Income (in thousands) 95
% White, Non-Hispanic 73
% Need Transportation Accommodations
13
% Military 49
% Male 48
118
Southeastern Institute of Research119
Strategic Implications
Focus on Increasing Focus on Increasing Satisfaction with Satisfaction with Transportation Transportation
SystemSystem
Focus on Increasing Focus on Increasing Satisfaction with Satisfaction with Transportation Transportation
SystemSystem
Southeastern Institute of Research
There is Room for Improvement in Satisfaction with the Transportation
System• A third are satisfied with the Transportation
System.• Fredericksburg has the highest satisfaction;
Caroline County has the lowest.• Almost two-thirds are satisfied with Driving
Alone in the area, but less than a quarter are satisfied with Bicycle Facilities.
• Aggressively promote the current availability of choices/options as an immediate way to increase satisfaction. Look for ways to expand options.
121

Sharpen MessageSharpen Messageof LRTPof LRTP
Sharpen MessageSharpen Messageof LRTPof LRTP
Southeastern Institute of Research
There is Room For Improvement of Awareness and Familiarity of the
LRTP• Promoting anything in a cluttered
media environment is hard and expensive.
• First dig deeper into this data for communication strategy and execution insights.
• Understand further who is recalling the LRTP message and why.
123
Southeastern Institute of Research
Use the Panel to Explore Related Issues Such as Key Benefit Messaging
• Of all respondents, only about 3 in 10 were confident that the LRTP goals will be accomplished. The biggest issue for residents seems to be lack of funding for the plan.
• Explore with panel how to instill confidence that the plan can be accomplished and will reduce congestion and improve transportation in the FAMPO area.
• Examine relative appeal of the benefits of the plan for residents – congestion relief, greater access, and choice/alternatives & options.
124
Continue to Explore Continue to Explore Regional Regional
Transportation Transportation AuthorityAuthority
Continue to Explore Continue to Explore Regional Regional
Transportation Transportation AuthorityAuthority
Southeastern Institute of Research
More than Half Support the Creation of a Regional Transportation Authority
• Use these data to learn more about this topic.
• Help inform and advance the RTA discussion.
126
Southeastern Institute of Research127
For Additional Information on this Study Contact:
Christy EvankoChristy EvankoSoutheastern Institute of Research
804-358-8981

Southeastern Institute of Research128
APPENDIX
Southeastern Institute of Research129
Demographicsas Compared to
Population
Southeastern Institute of Research130
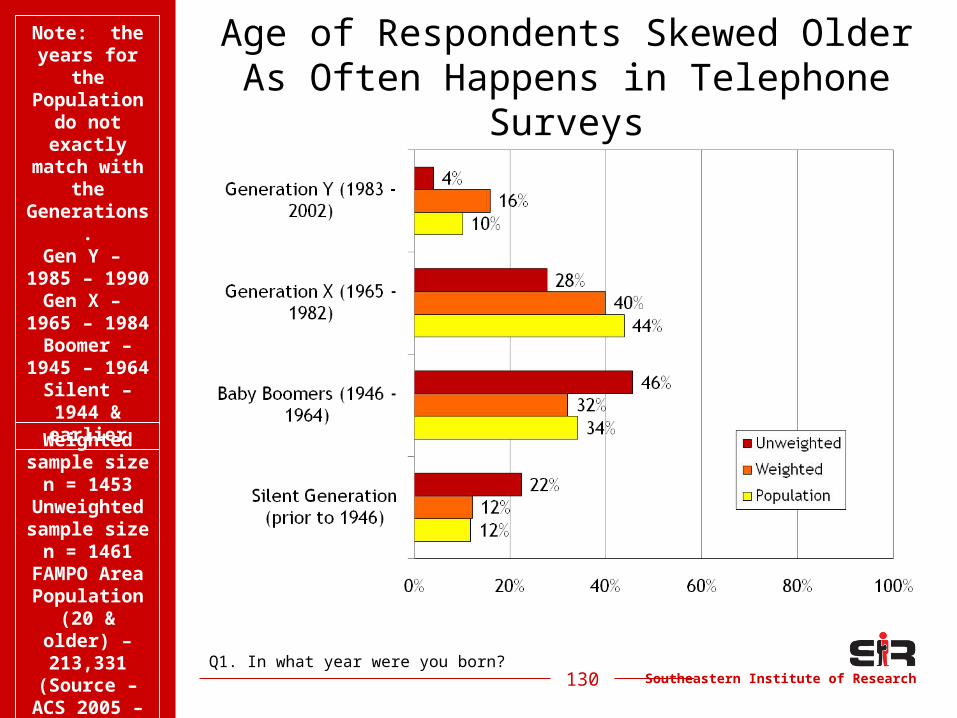
Age of Respondents Skewed OlderAs Often Happens in Telephone Surveys
Q1. In what year were you born?
Weighted sample size
n = 1453Unweighted sample
sizen = 1461FAMPO
Area Population
(20 & older) – 213,331 (Source –
ACS 2005 – 2007)
Note: the years for
the Population
do not exactly
match with the
Generations.
Gen Y – 1985 – 1990
Gen X – 1965 – 1984
Boomer – 1945 – 1964
Silent – 1944 & earlier
Southeastern Institute of Research131
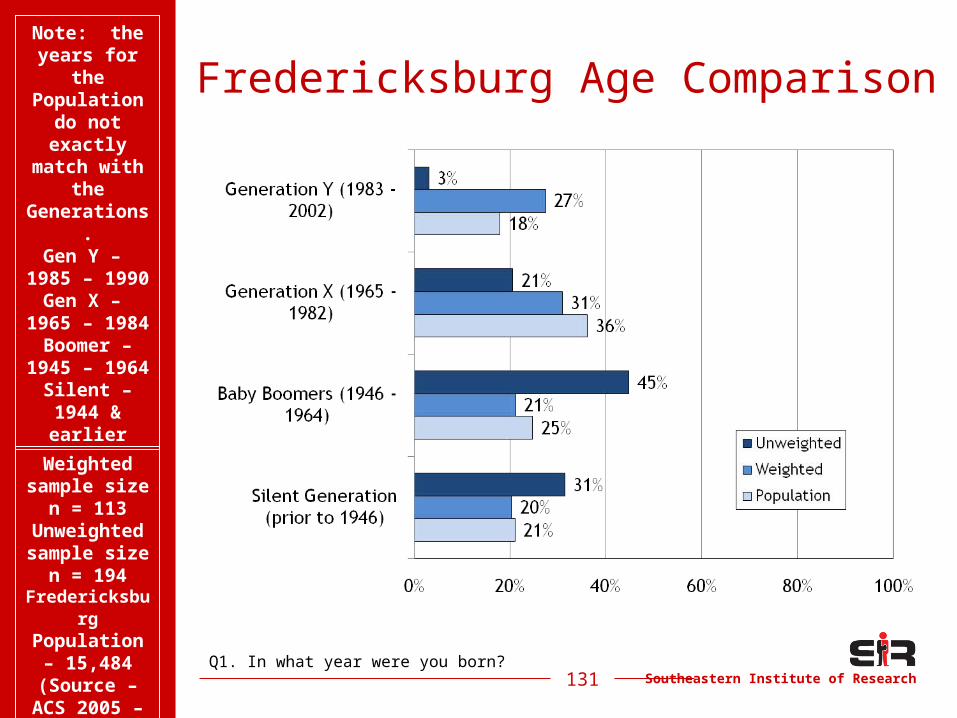
Fredericksburg Age Comparison
Q1. In what year were you born?
Weighted sample size
n = 113Unweighted sample
sizen = 194
Fredericksburg
Population – 15,484 (Source –
ACS 2005 – 2007)
Note: the years for
the Population
do not exactly
match with the
Generations.
Gen Y – 1985 – 1990
Gen X – 1965 – 1984
Boomer – 1945 – 1964
Silent – 1944 & earlier
Southeastern Institute of Research132
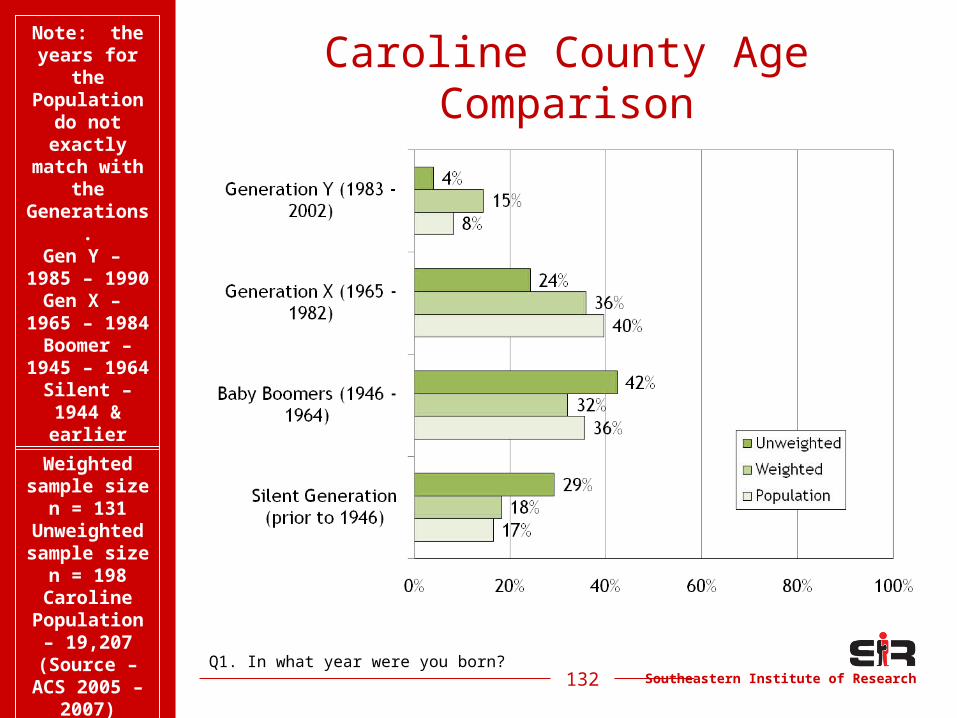
Caroline County Age Comparison
Q1. In what year were you born?
Weighted sample size
n = 131Unweighted sample
sizen = 198Caroline
Population – 19,207 (Source –
ACS 2005 – 2007)
Note: the years for
the Population
do not exactly
match with the
Generations.
Gen Y – 1985 – 1990
Gen X – 1965 – 1984
Boomer – 1945 – 1964
Silent – 1944 & earlier
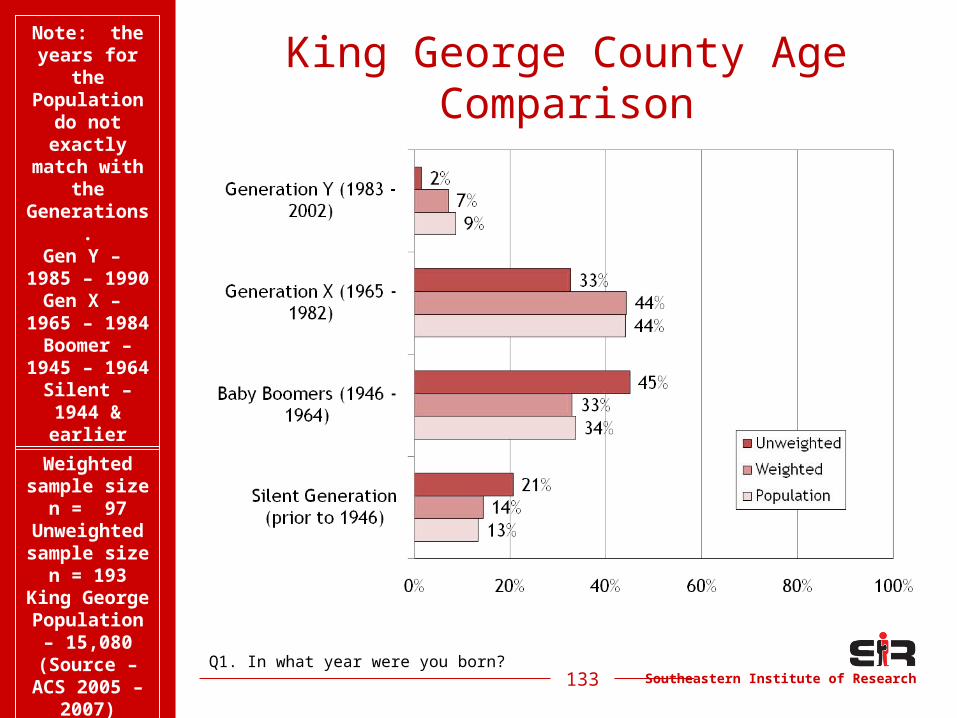
Southeastern Institute of Research133
King George County Age Comparison
Q1. In what year were you born?
Weighted sample size
n = 97Unweighted sample
sizen = 193
King George
Population – 15,080 (Source –
ACS 2005 – 2007)
Note: the years for
the Population
do not exactly
match with the
Generations.
Gen Y – 1985 – 1990
Gen X – 1965 – 1984
Boomer – 1945 – 1964
Silent – 1944 & earlier
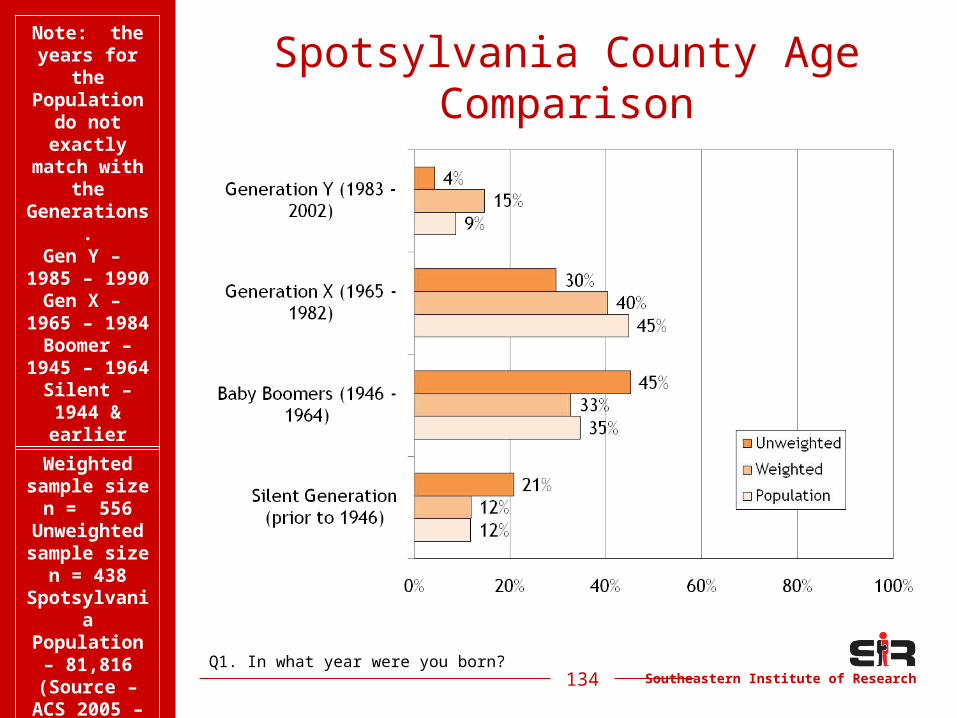
Southeastern Institute of Research134
Spotsylvania County Age Comparison
Q1. In what year were you born?
Weighted sample size
n = 556Unweighted sample
sizen = 438
Spotsylvania
Population – 81,816 (Source –
ACS 2005 – 2007)
Note: the years for
the Population
do not exactly
match with the
Generations.
Gen Y – 1985 – 1990
Gen X – 1965 – 1984
Boomer – 1945 – 1964
Silent – 1944 & earlier
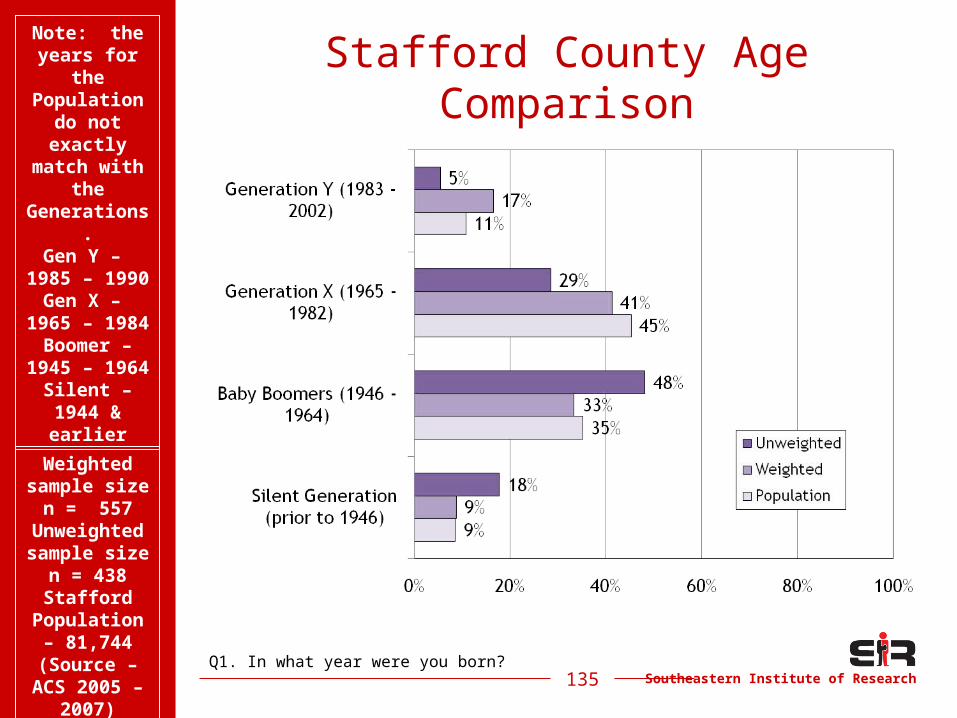
Southeastern Institute of Research135
Stafford County Age Comparison
Q1. In what year were you born?
Weighted sample size
n = 557Unweighted sample
sizen = 438Stafford
Population – 81,744 (Source –
ACS 2005 – 2007)
Note: the years for
the Population
do not exactly
match with the
Generations.
Gen Y – 1985 – 1990
Gen X – 1965 – 1984
Boomer – 1945 – 1964
Silent – 1944 & earlier
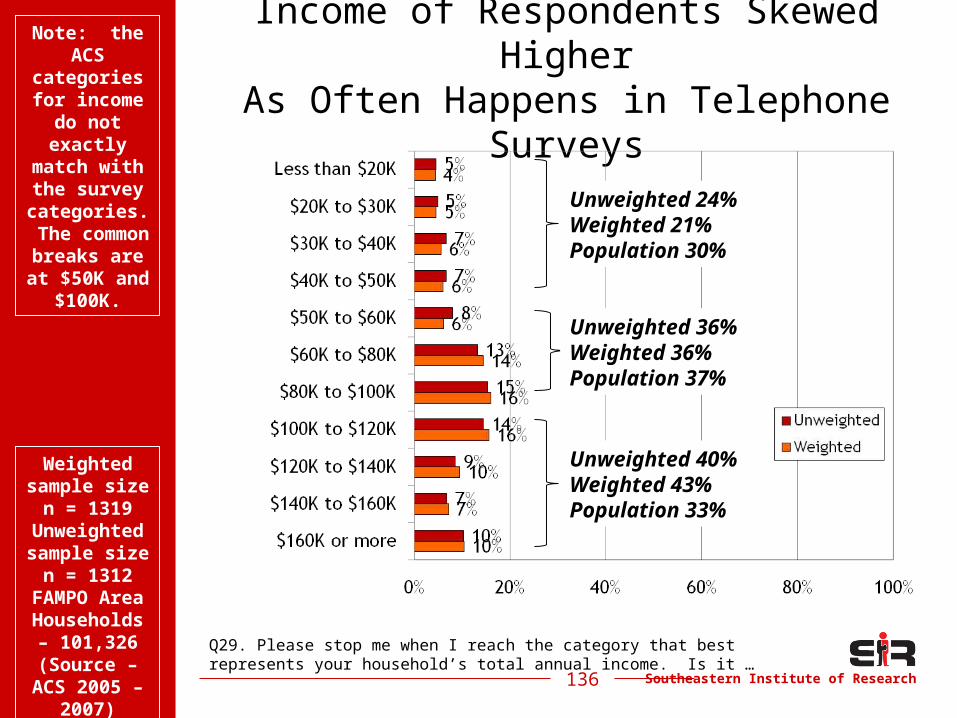
Southeastern Institute of Research136
Income of Respondents Skewed HigherAs Often Happens in Telephone Surveys
Q29. Please stop me when I reach the category that best represents your household’s total annual income. Is it …
Weighted sample size
n = 1319Unweighted sample
sizen = 1312FAMPO
Area Households – 101,326 (Source –
ACS 2005 – 2007)
Note: the ACS
categories for income
do not exactly
match with the survey categories.
The common
breaks are at $50K
and $100K.
Unweighted 24%Weighted 21%Population 30%
Unweighted 36%Weighted 36%Population 37%
Unweighted 40%Weighted 43%Population 33%
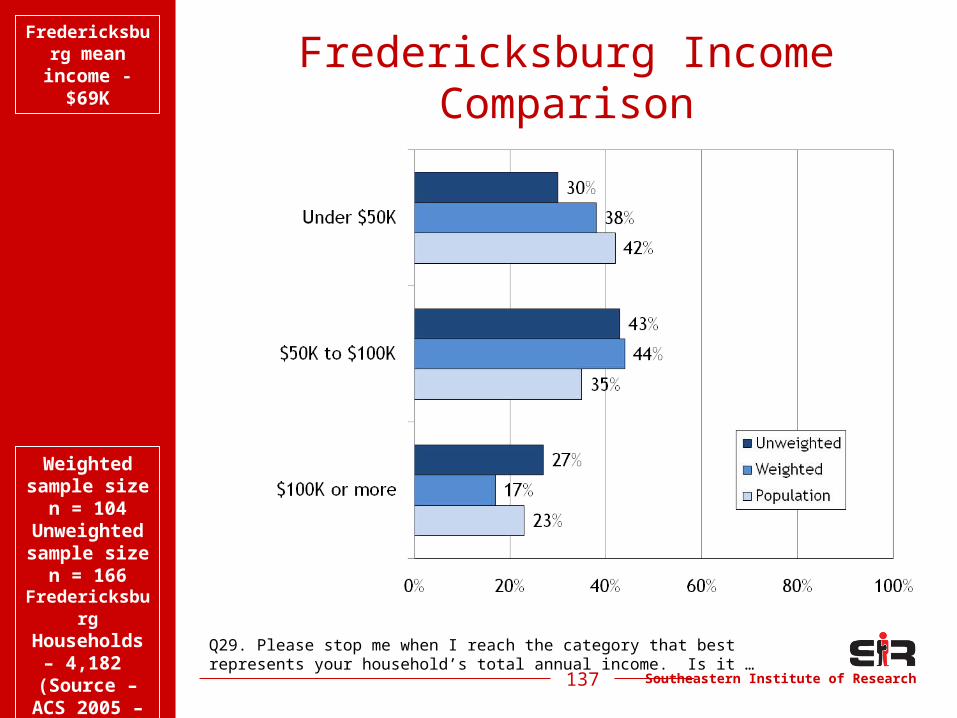
Southeastern Institute of Research137
Fredericksburg Income Comparison
Weighted sample size
n = 104Unweighted sample
sizen = 166
Fredericksburg
Households – 4,182
(Source – ACS 2005 –
2007)
Q29. Please stop me when I reach the category that best represents your household’s total annual income. Is it …
Fredericksburg mean income -
$69K
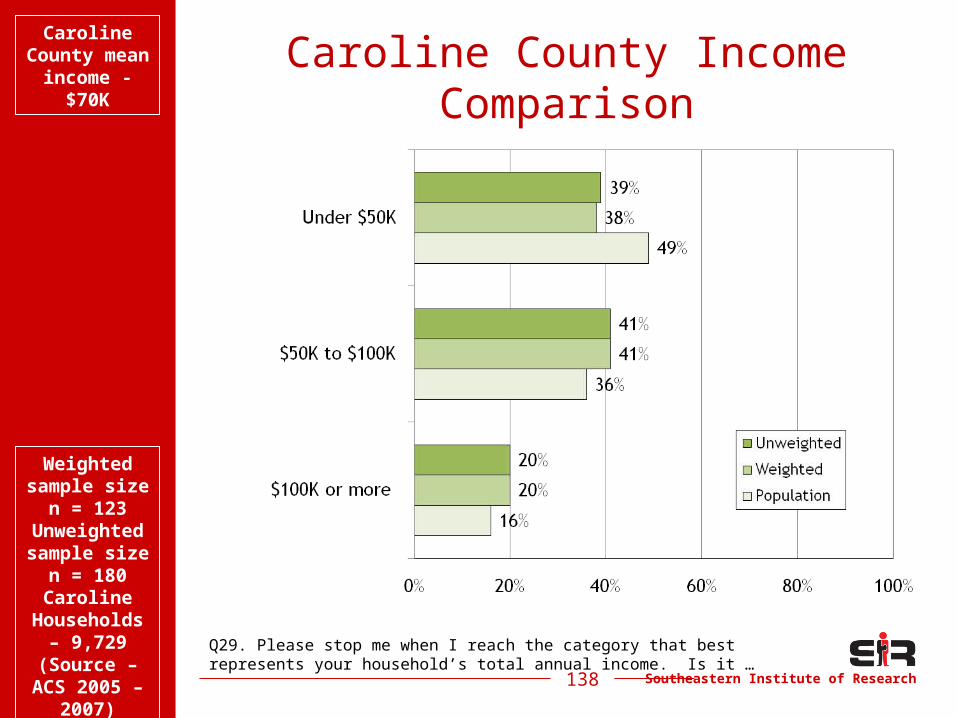
Southeastern Institute of Research138
Caroline County Income Comparison
Weighted sample size
n = 123Unweighted sample
sizen = 180Caroline
Households – 9,729
(Source – ACS 2005 –
2007)
Q29. Please stop me when I reach the category that best represents your household’s total annual income. Is it …
Caroline County mean
income - $70K
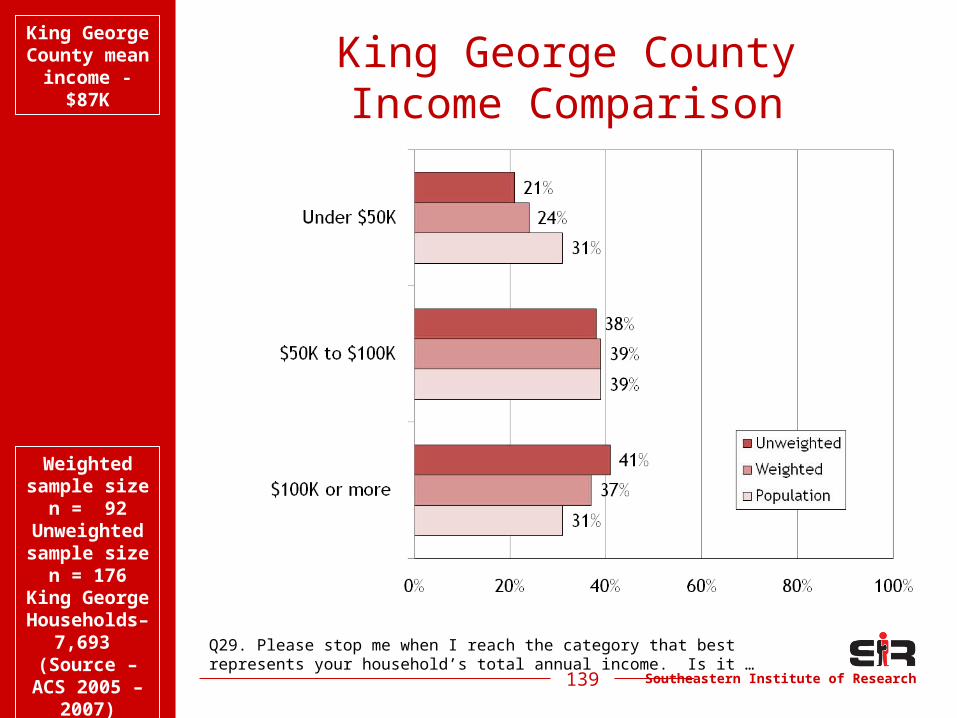
Southeastern Institute of Research139
King George CountyIncome Comparison
Weighted sample size
n = 92Unweighted sample
sizen = 176
King George
Households– 7,693
(Source – ACS 2005 –
2007)
Q29. Please stop me when I reach the category that best represents your household’s total annual income. Is it …
King George County mean
income - $87K
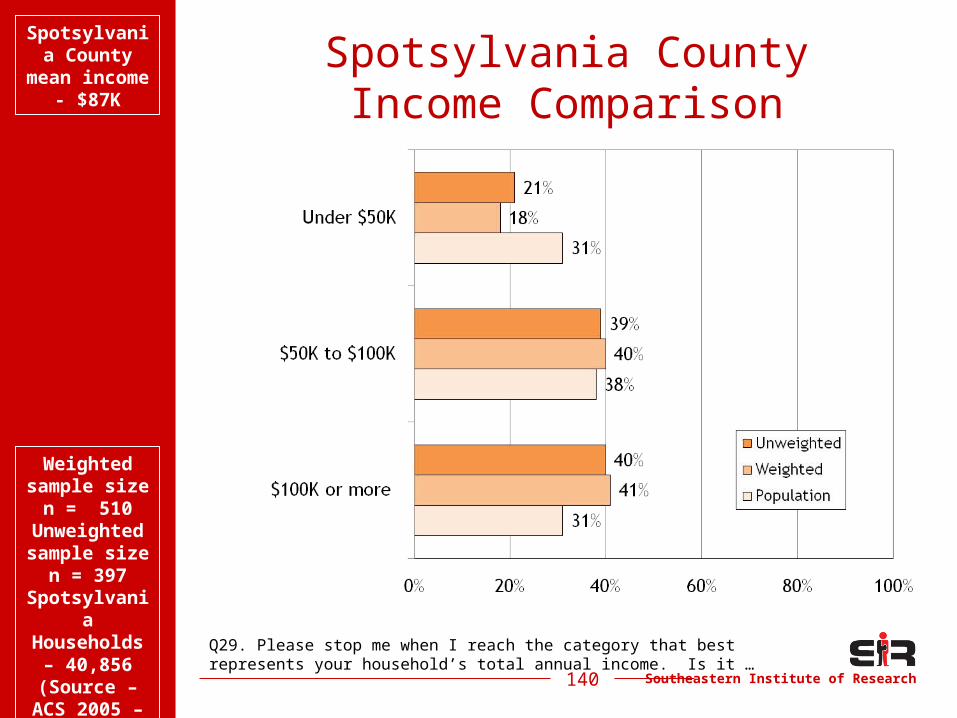
Southeastern Institute of Research140
Spotsylvania CountyIncome Comparison
Weighted sample size
n = 510Unweighted sample
sizen = 397
Spotsylvania
Households – 40,856 (Source –
ACS 2005 – 2007)
Q29. Please stop me when I reach the category that best represents your household’s total annual income. Is it …
Spotsylvania County
mean income -
$87K
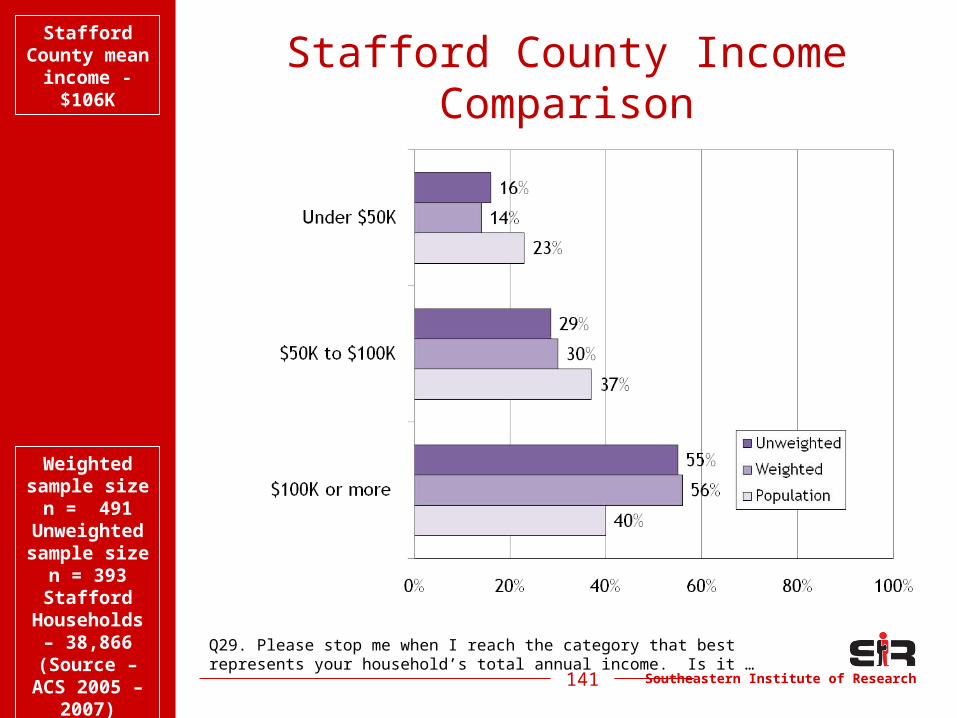
Southeastern Institute of Research141
Stafford County Income Comparison
Weighted sample size
n = 491Unweighted sample
sizen = 393Stafford
Households – 38,866 (Source –
ACS 2005 – 2007)
Q29. Please stop me when I reach the category that best represents your household’s total annual income. Is it …
Stafford County mean
income - $106K
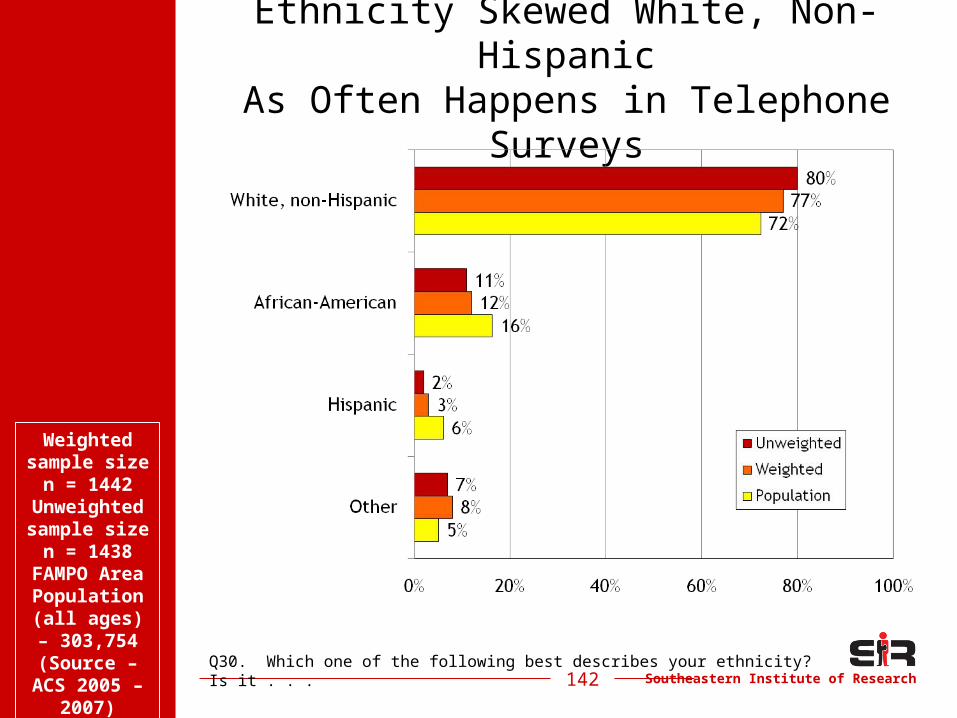
Southeastern Institute of Research142
Ethnicity Skewed White, Non-HispanicAs Often Happens in Telephone Surveys
Q30. Which one of the following best describes your ethnicity? Is it . . .
Weighted sample size
n = 1442Unweighted sample
sizen = 1438FAMPO
Area Population (all ages) –
303,754 (Source –
ACS 2005 – 2007)
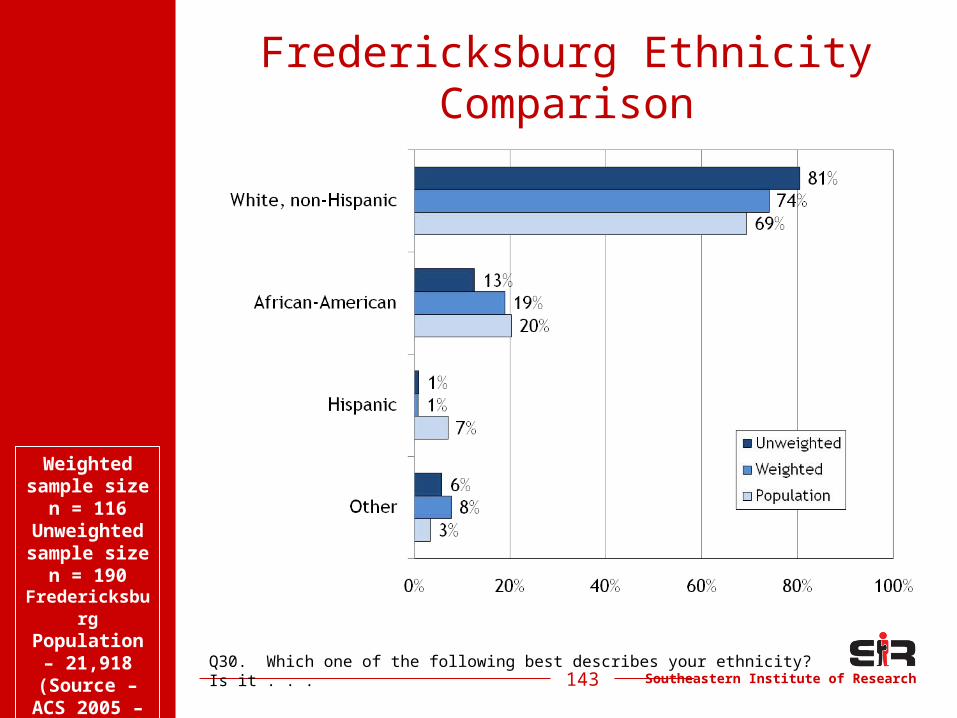
Southeastern Institute of Research143
Fredericksburg Ethnicity Comparison
Weighted sample size
n = 116Unweighted sample
sizen = 190
Fredericksburg
Population – 21,918 (Source –
ACS 2005 – 2007)
Q30. Which one of the following best describes your ethnicity? Is it . . .
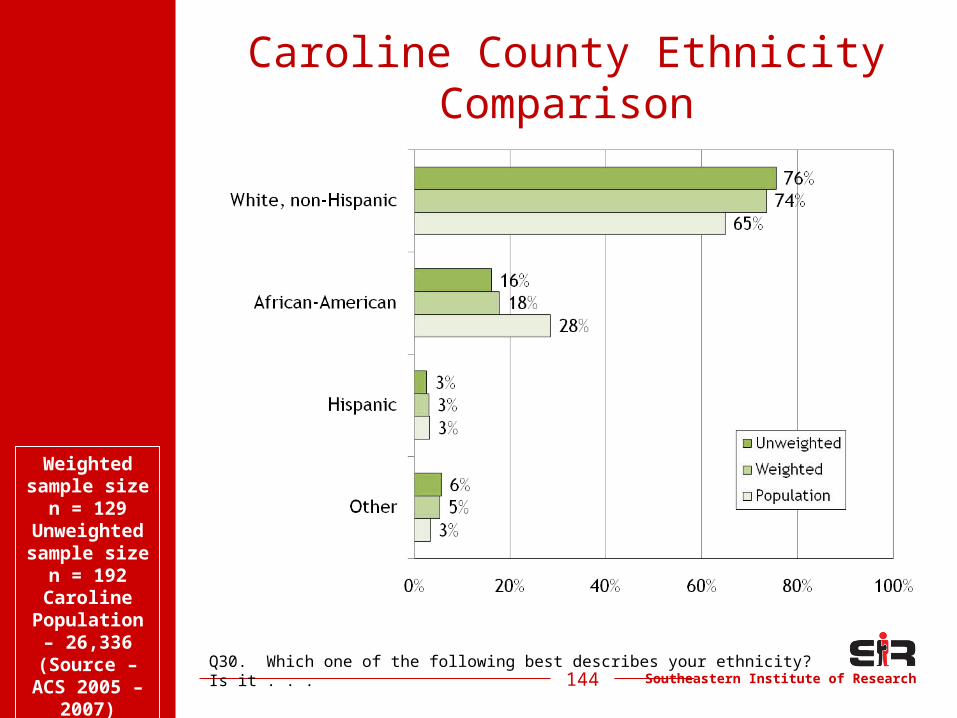
Southeastern Institute of Research144
Caroline County Ethnicity Comparison
Weighted sample size
n = 129Unweighted sample
sizen = 192Caroline
Population – 26,336 (Source –
ACS 2005 – 2007)
Q30. Which one of the following best describes your ethnicity? Is it . . .
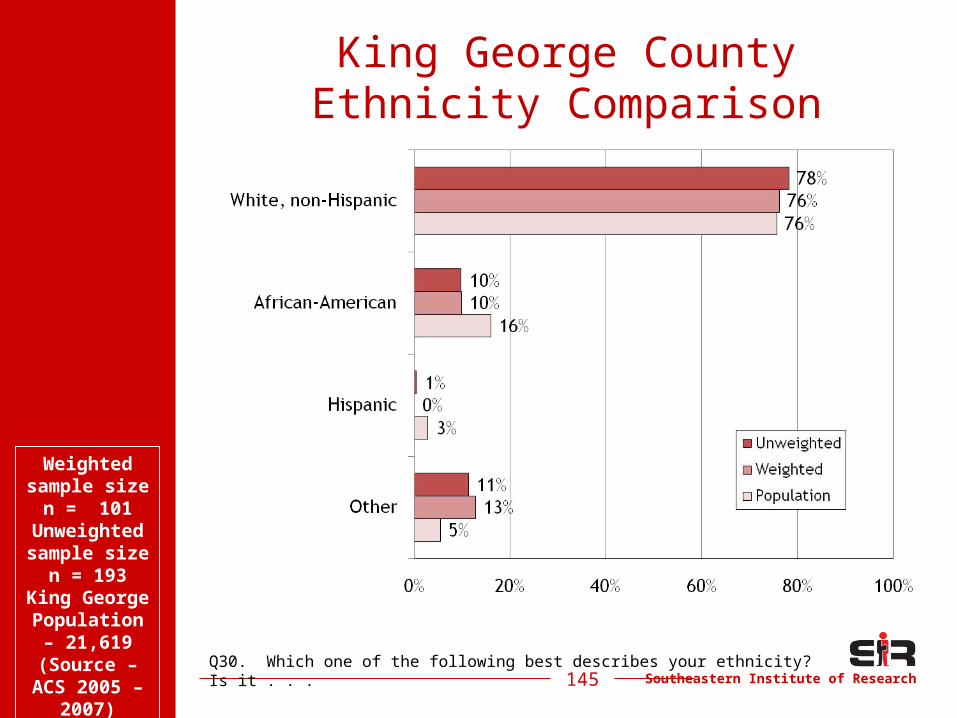
Southeastern Institute of Research145
King George CountyEthnicity Comparison
Weighted sample size
n = 101Unweighted sample
sizen = 193
King George
Population – 21,619 (Source –
ACS 2005 – 2007)
Q30. Which one of the following best describes your ethnicity? Is it . . .
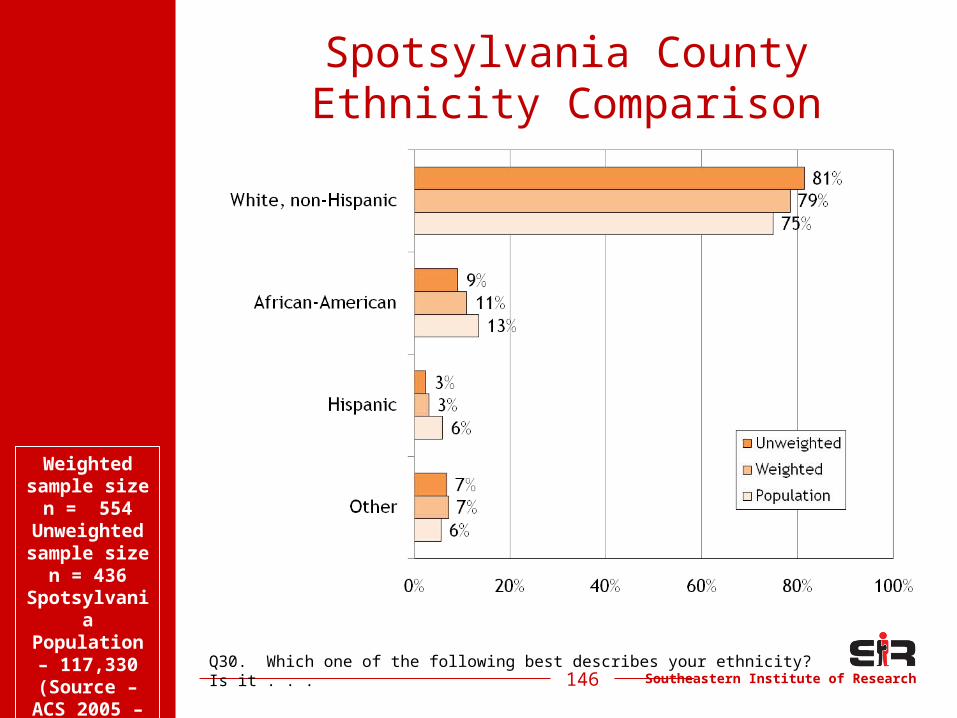
Southeastern Institute of Research146
Spotsylvania CountyEthnicity Comparison
Weighted sample size
n = 554Unweighted sample
sizen = 436
Spotsylvania
Population – 117,330 (Source –
ACS 2005 – 2007)
Q30. Which one of the following best describes your ethnicity? Is it . . .
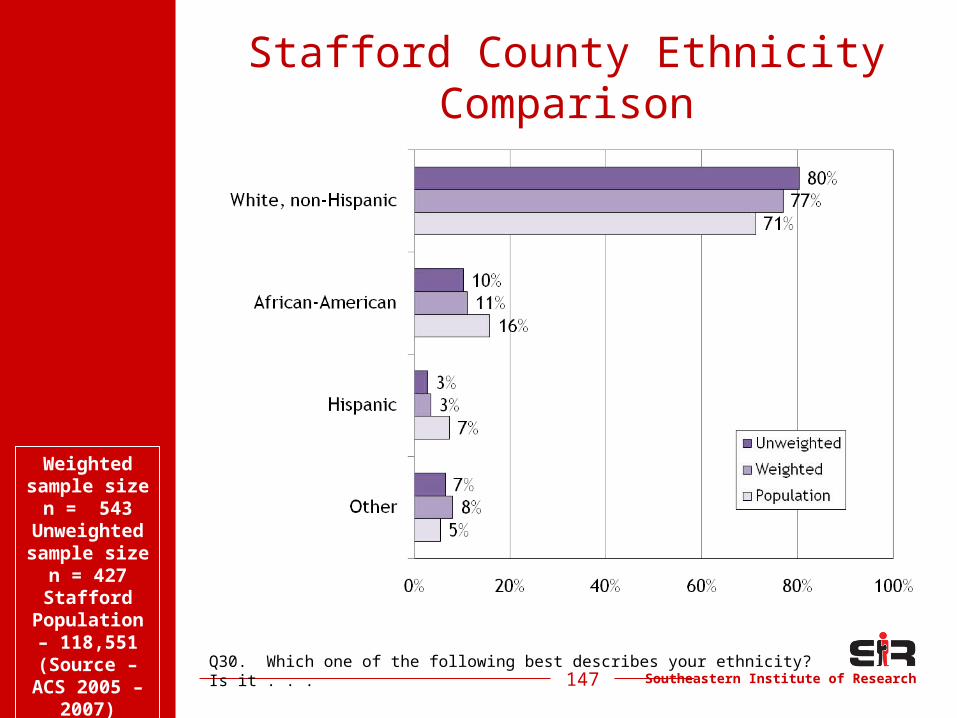
Southeastern Institute of Research147
Stafford County Ethnicity Comparison
Weighted sample size
n = 543Unweighted sample
sizen = 427Stafford
Population – 118,551 (Source –
ACS 2005 – 2007)
Q30. Which one of the following best describes your ethnicity? Is it . . .
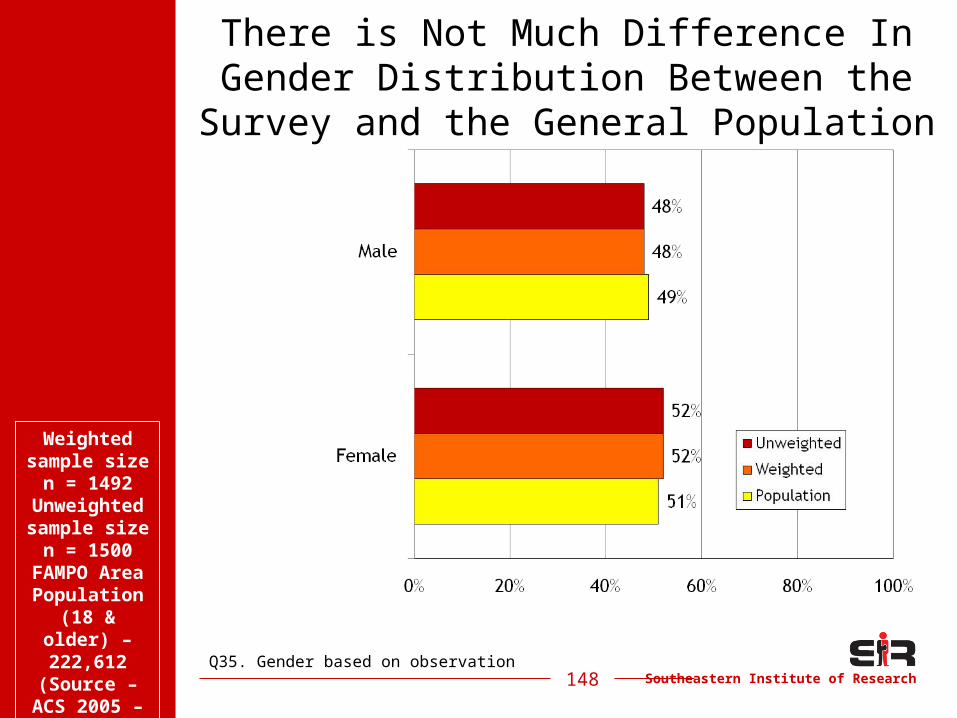
Southeastern Institute of Research148
There is Not Much Difference InGender Distribution Between the
Survey and the General Population
Q35. Gender based on observation
Weighted sample size
n = 1492Unweighted sample
sizen = 1500FAMPO
Area Population
(18 & older) – 222,612(Source –
ACS 2005 – 2007)
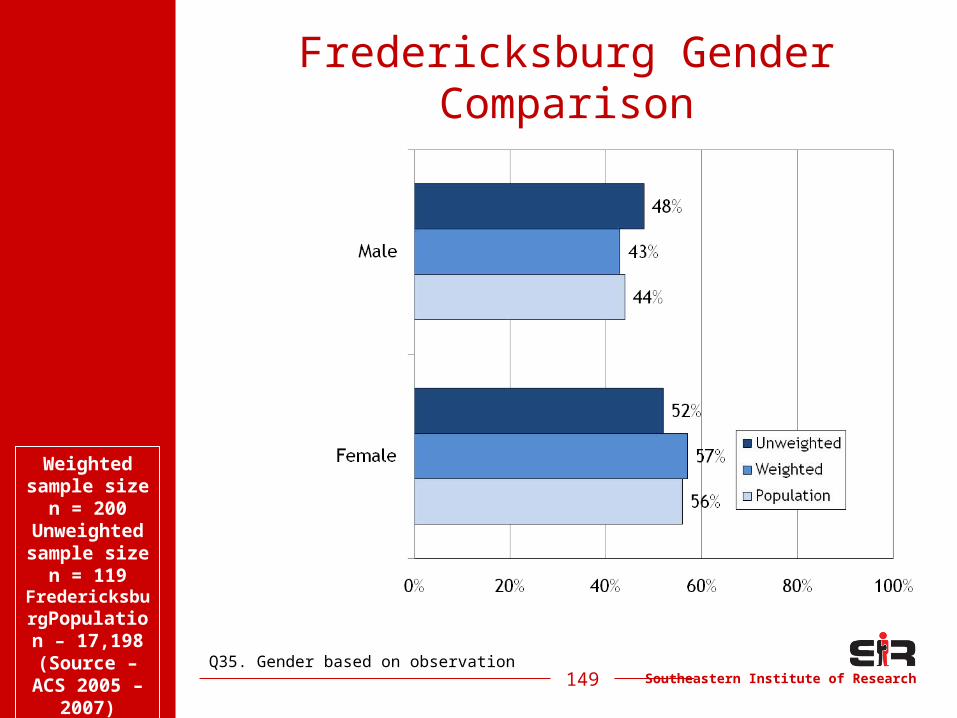
Southeastern Institute of Research149
Fredericksburg Gender Comparison
Weighted sample size
n = 200Unweighted sample
sizen = 119
FredericksburgPopulation – 17,198 (Source –
ACS 2005 – 2007)
Q35. Gender based on observation
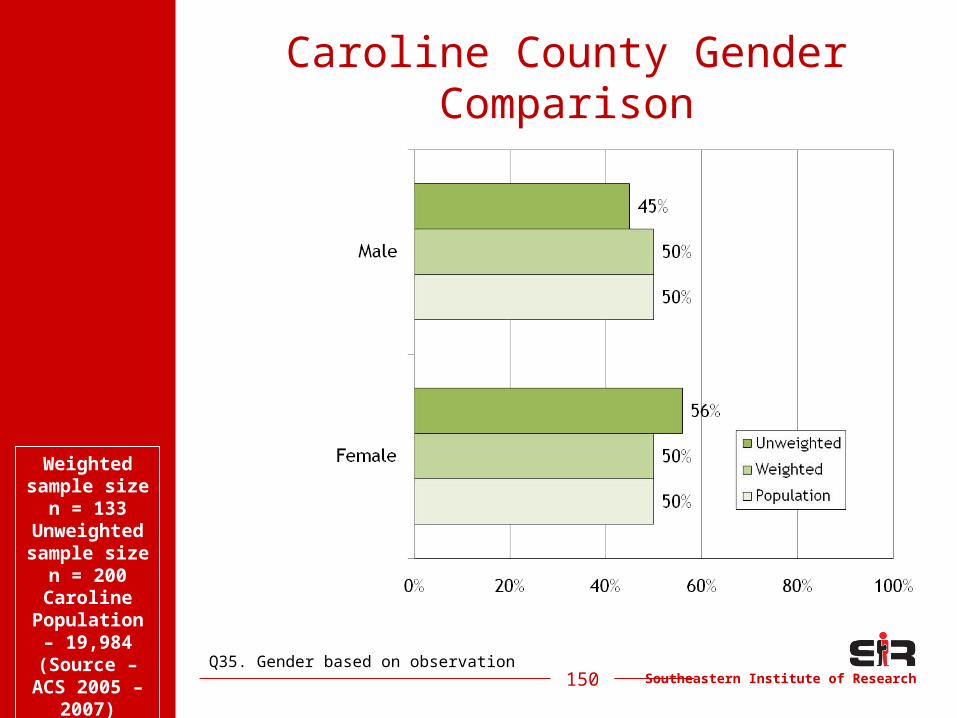
Southeastern Institute of Research150
Caroline County Gender Comparison
Weighted sample size
n = 133Unweighted sample
sizen = 200Caroline
Population – 19,984 (Source –
ACS 2005 – 2007)
Q35. Gender based on observation
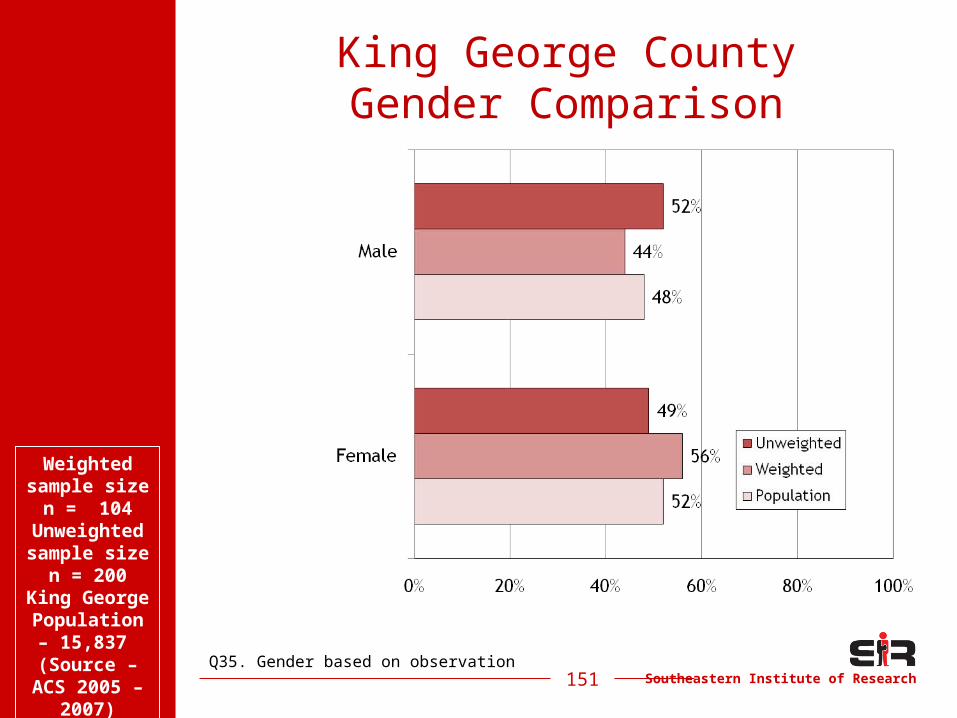
Southeastern Institute of Research151
King George CountyGender Comparison
Weighted sample size
n = 104Unweighted sample
sizen = 200
King George
Population – 15,837 (Source –
ACS 2005 – 2007)
Q35. Gender based on observation
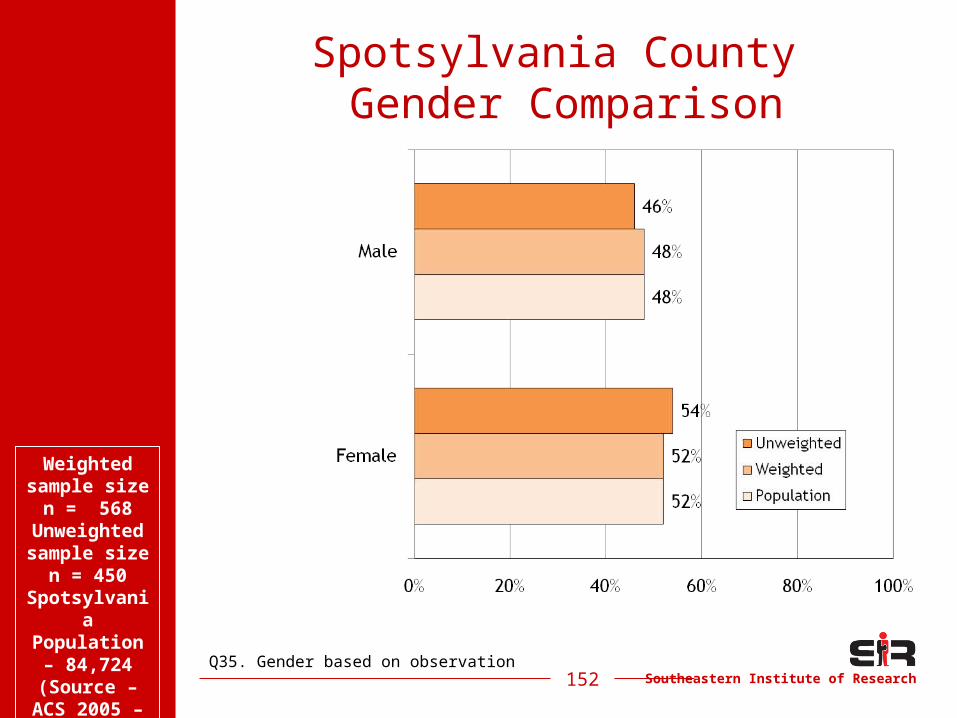
Southeastern Institute of Research152
Spotsylvania County Gender Comparison
Weighted sample size
n = 568Unweighted sample
sizen = 450
Spotsylvania
Population – 84,724 (Source –
ACS 2005 – 2007)
Q35. Gender based on observation
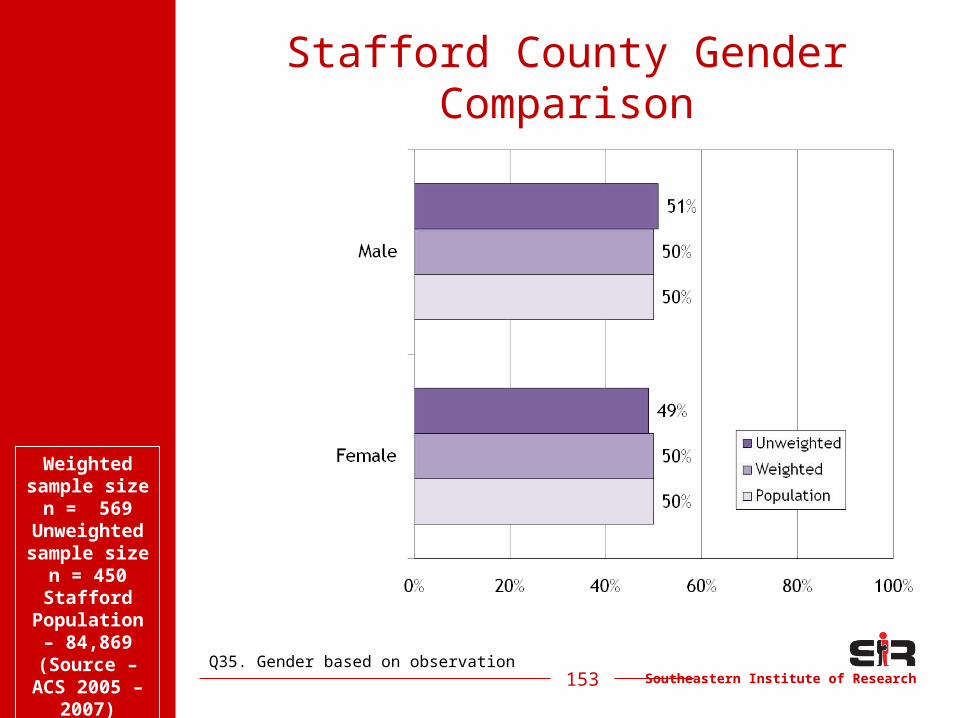
Southeastern Institute of Research153
Stafford County Gender Comparison
Weighted sample size
n = 569Unweighted sample
sizen = 450Stafford
Population – 84,869 (Source –
ACS 2005 – 2007)
Q35. Gender based on observation

Southeastern Institute of Research154
Mode SatisfactionBreakdown by Area
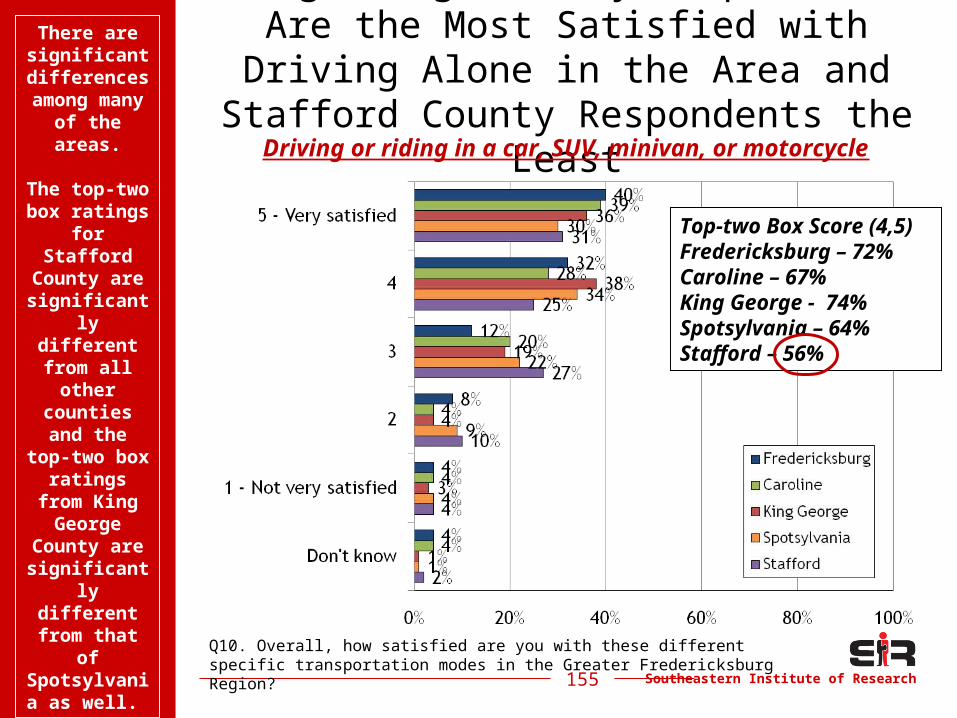
Southeastern Institute of Research155
King George County Respondents Are the Most Satisfied with Driving Alone in
the Area and Stafford County Respondents the Least
Q10. Overall, how satisfied are you with these different specific transportation modes in the Greater Fredericksburg Region?
Top-two Box Score (4,5)Fredericksburg – 72%Caroline – 67%King George - 74%Spotsylvania – 64%Stafford – 56%
There are significant differences
among many of
the areas.
The top-two box
ratings for Stafford
County are significantly different
from all other
counties and the top-two
box ratings from King
George County are significantly different from that
of Spotsylvania as well.
Driving or riding in a car, SUV, minivan, or motorcycle
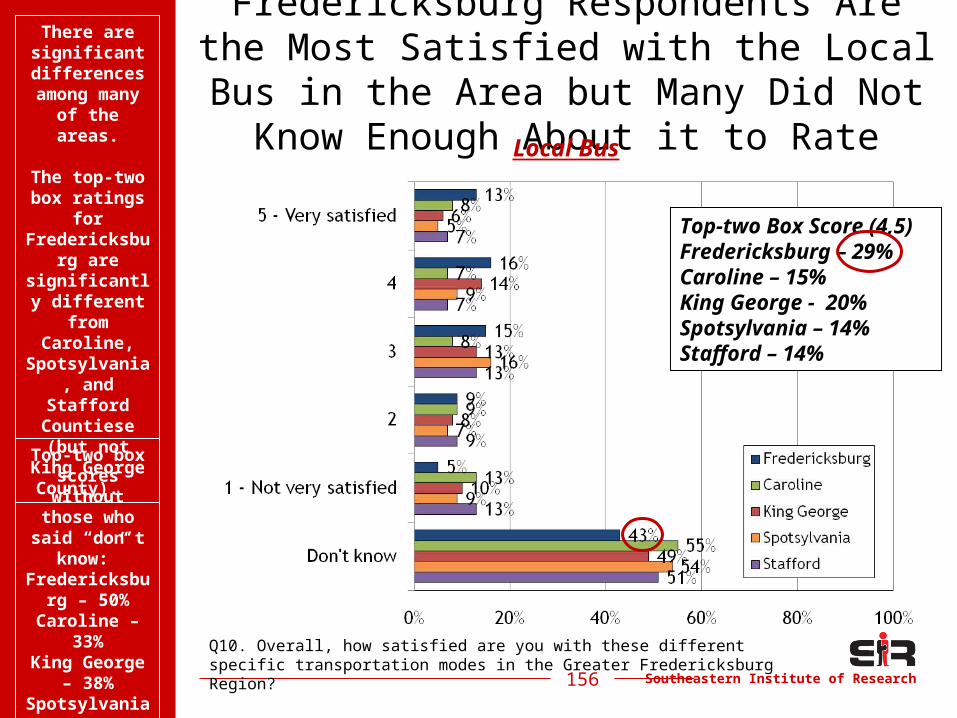
Southeastern Institute of Research156
Fredericksburg Respondents Are the Most Satisfied with the Local Bus in the Area but Many Did Not Know Enough
About it to Rate
Q10. Overall, how satisfied are you with these different specific transportation modes in the Greater Fredericksburg Region?
Top-two Box Score (4,5)Fredericksburg – 29%Caroline – 15%King George - 20%Spotsylvania – 14%Stafford – 14%
There are significant differences
among many of the
areas.
The top-two box ratings
for Fredericksb
urg are significantly
different from
Caroline, Spotsylvania
, and Stafford
Countiese (but not
King George County).
Local Bus
Top-two box scores
without those who said “don’t
know:”Fredericksburg – 50%Caroline –
33%King George
– 38%Spotsylvania
– 30%Stafford –
27%
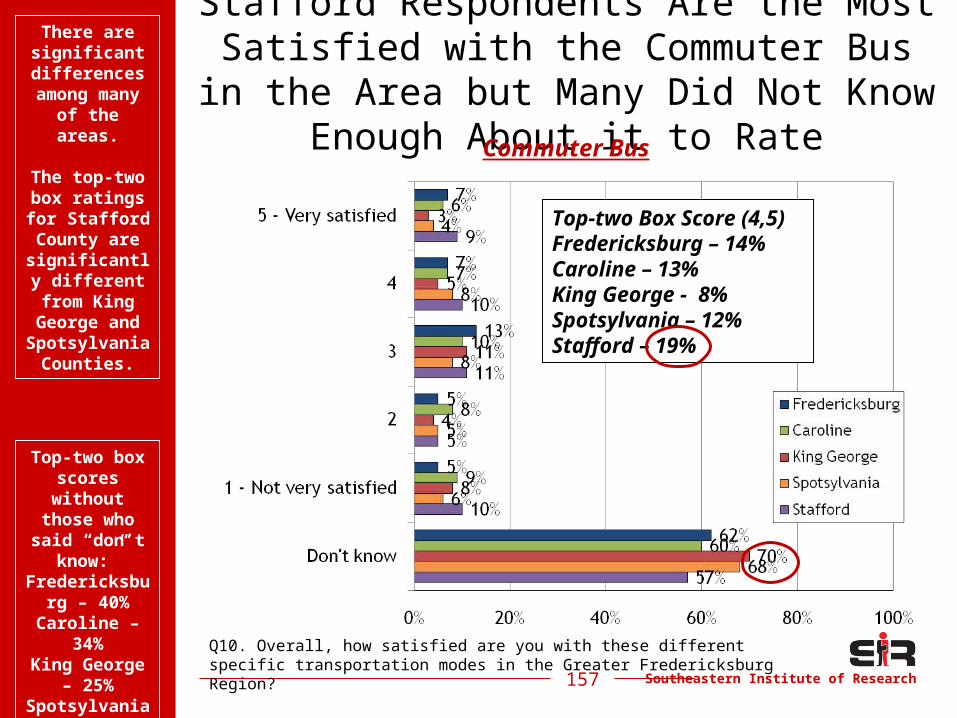
Southeastern Institute of Research157
Stafford Respondents Are the Most Satisfied with the Commuter Bus in the Area but Many Did Not Know Enough
About it to Rate
Q10. Overall, how satisfied are you with these different specific transportation modes in the Greater Fredericksburg Region?
Top-two Box Score (4,5)Fredericksburg – 14%Caroline – 13%King George - 8%Spotsylvania – 12%Stafford – 19%
There are significant differences
among many of the
areas.
The top-two box ratings for Stafford County are
significantly different from King
George and Spotsylvania
Counties.
Commuter Bus
Top-two box scores
without those who said “don’t
know:”Fredericksburg – 40%Caroline –
34%King George
– 25%Spotsylvania
– 39%Stafford –
32%
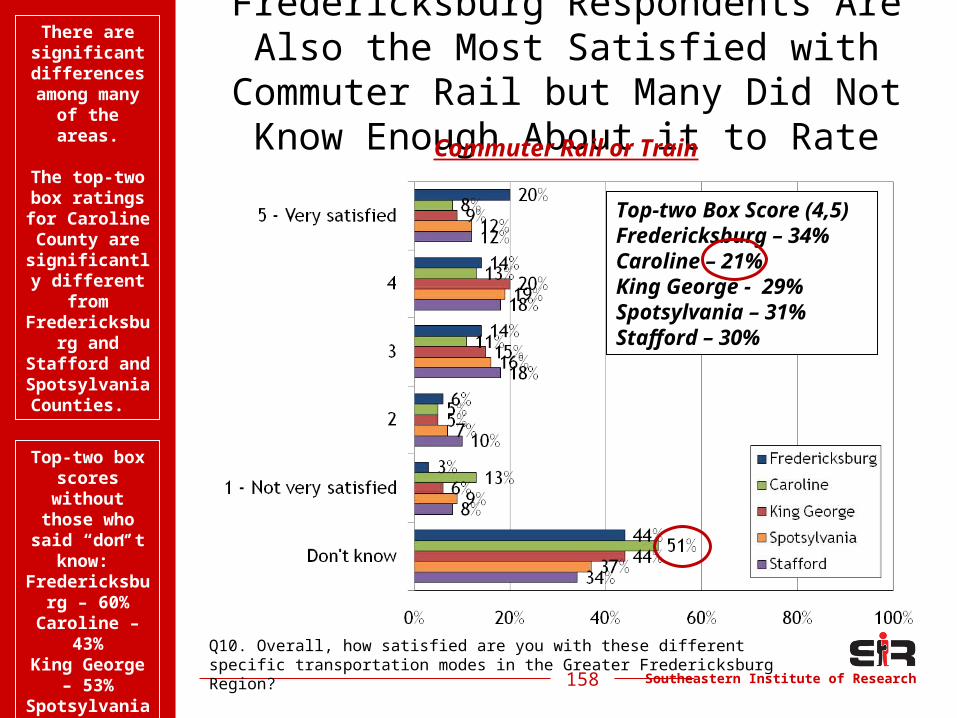
Southeastern Institute of Research158
Fredericksburg Respondents Are Also the Most Satisfied with Commuter Rail but Many Did Not Know Enough About
it to Rate
Q10. Overall, how satisfied are you with these different specific transportation modes in the Greater Fredericksburg Region?
Top-two Box Score (4,5)Fredericksburg – 34%Caroline – 21%King George - 29%Spotsylvania – 31%Stafford – 30%
There are significant differences
among many of the
areas.
The top-two box ratings for Caroline County are
significantly different
from Fredericksb
urg and Stafford and Spotsylvania Counties.
Commuter Rail or Train
Top-two box scores
without those who said “don’t
know:”Fredericksburg – 60%Caroline –
43%King George
– 53%Spotsylvania
– 50%Stafford –
44%
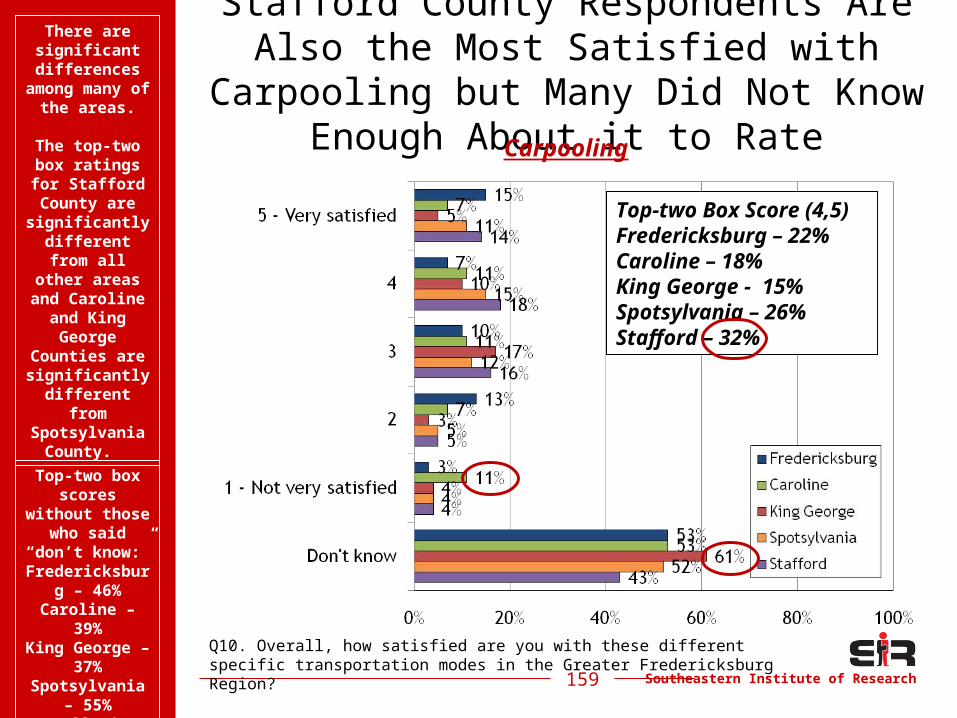
Southeastern Institute of Research159
Stafford County Respondents Are Also the Most Satisfied with Carpooling but Many Did Not Know Enough About it to
Rate
Q10. Overall, how satisfied are you with these different specific transportation modes in the Greater Fredericksburg Region?
Top-two Box Score (4,5)Fredericksburg – 22%Caroline – 18%King George - 15%Spotsylvania – 26%Stafford – 32%
There are significant differences
among many of the areas.
The top-two box ratings for Stafford County are
significantly different
from all other areas and
Caroline and King George Counties are significantly
different from
Spotsylvania County.
Carpooling
Top-two box scores without
those who said “don’t
know:”Fredericksbu
rg – 46%Caroline –
39%King George –
37%Spotsylvania
– 55%Stafford –
56%
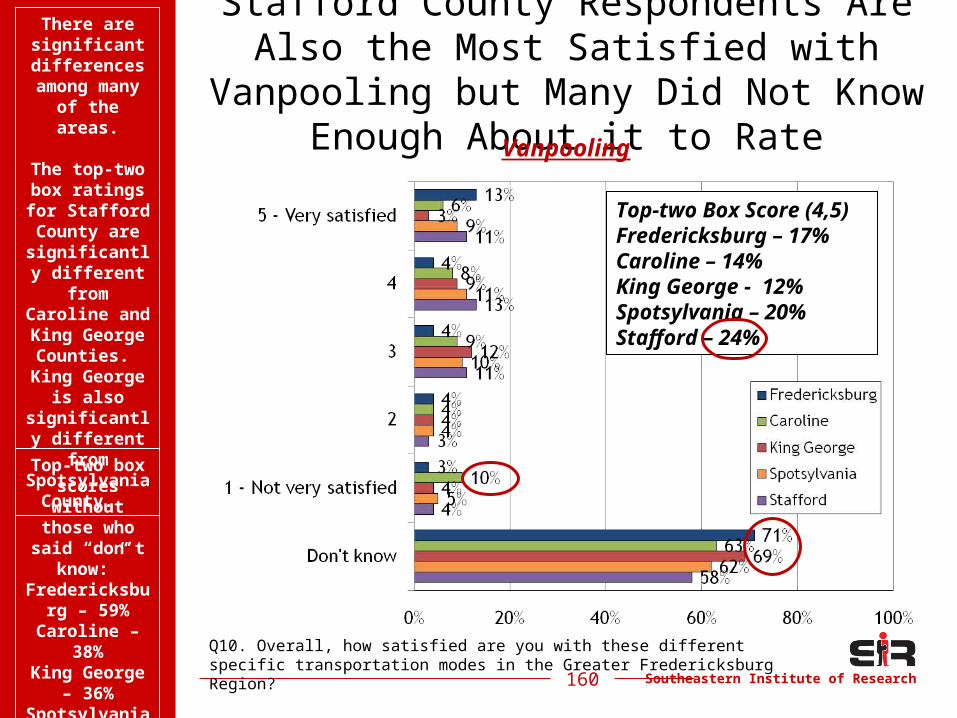
Southeastern Institute of Research160
Stafford County Respondents Are Also the Most Satisfied with Vanpooling but Many Did Not Know Enough About it to
Rate
Q10. Overall, how satisfied are you with these different specific transportation modes in the Greater Fredericksburg Region?
Top-two Box Score (4,5)Fredericksburg – 17%Caroline – 14%King George - 12%Spotsylvania – 20%Stafford – 24%
There are significant differences
among many of the
areas.
The top-two box ratings for Stafford County are
significantly different
from Caroline and King George Counties.
King George is also
significantly different
from Spotsylvania
County.
Vanpooling
Top-two box scores
without those who said “don’t
know:”Fredericksburg – 59%Caroline –
38%King George
– 36%Spotsylvania
– 53%Stafford –
57%
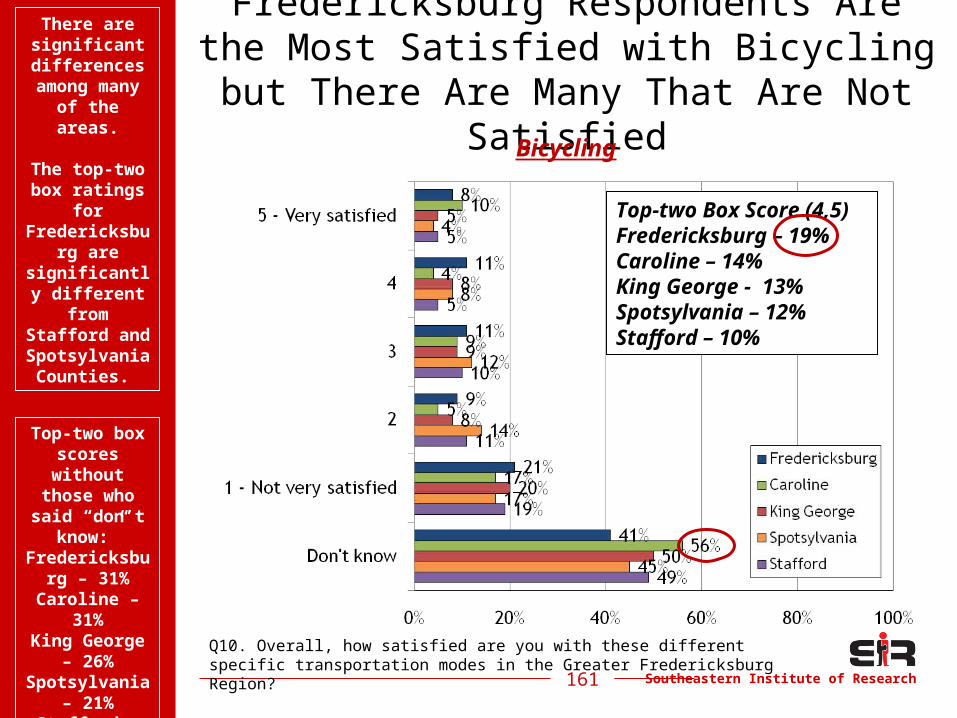
Southeastern Institute of Research161
Fredericksburg Respondents Are the Most Satisfied with Bicycling but There
Are Many That Are Not Satisfied
Q10. Overall, how satisfied are you with these different specific transportation modes in the Greater Fredericksburg Region?
Top-two Box Score (4,5)Fredericksburg – 19%Caroline – 14%King George - 13%Spotsylvania – 12%Stafford – 10%
There are significant differences
among many of the
areas.
The top-two box ratings
for Fredericksb
urg are significantly
different from
Stafford and Spotsylvania
Counties.
Bicycling
Top-two box scores
without those who said “don’t
know:”Fredericksburg – 31%Caroline –
31%King George
– 26%Spotsylvania
– 21%Stafford –
21%
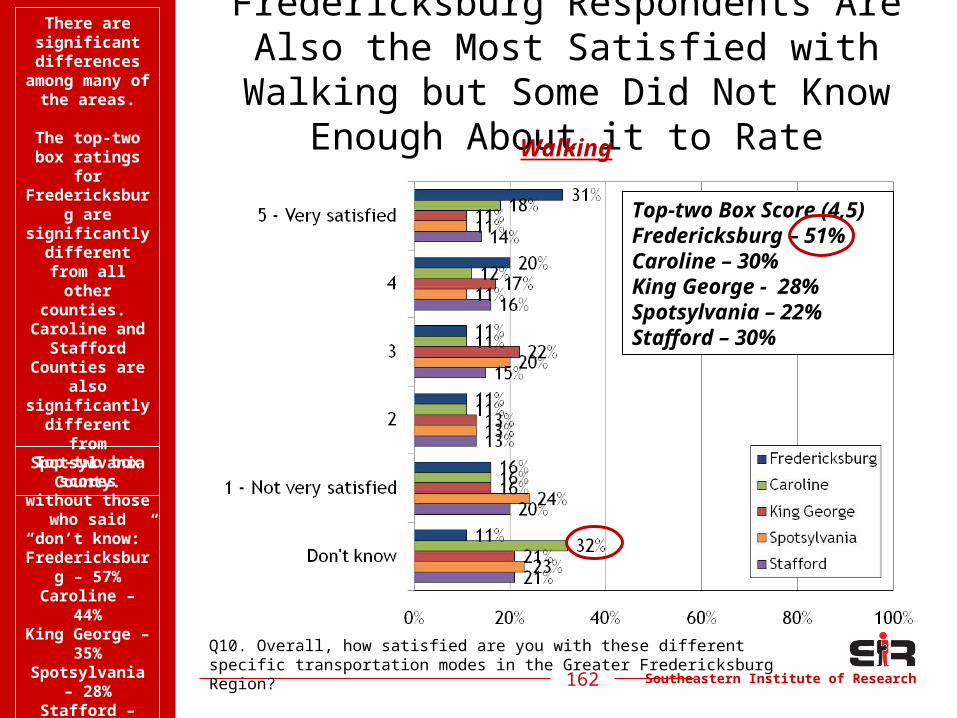
Southeastern Institute of Research162
Fredericksburg Respondents Are Also the Most Satisfied with Walking but
Some Did Not Know Enough About it to Rate
Q10. Overall, how satisfied are you with these different specific transportation modes in the Greater Fredericksburg Region?
Top-two Box Score (4,5)Fredericksburg – 51%Caroline – 30%King George - 28%Spotsylvania – 22%Stafford – 30%
There are significant differences
among many of the areas.
The top-two box ratings
for Fredericksbu
rg are significantly
different from all other
counties. Caroline and
Stafford Counties are
also significantly
different from
Spotsylvania County.
Walking
Top-two box scores without
those who said “don’t
know:”Fredericksbu
rg – 57%Caroline –
44%King George –
35%Spotsylvania
– 28%Stafford –
38%