Radar Basics and Imagery Examples - University of...
40
Satellites, Weather and Climate Module 43: Radar Basics and Imagery Examples
Transcript of Radar Basics and Imagery Examples - University of...
Satellites, Weather and Climate Module 43:
Radar Basics and Imagery Examples

RaDAR
Radio Detection And Ranging
Radar is a form of electromagnetic energy characterized by speed (C), wavelength (λ) and frequency (f)
λ = C/f
WSR-88D λ=10cm , C=3x10⁻⁸ m/s
PRF = Pulse Repetition Frequency
long distance detection requires a low PRF (allows time for the radar energy to reach target and be reflected back to the radar antenna before the next pulse). For shorter ranges, a higher PRF can be used and provides more detail. The WSR-88D has alternate PRF’s.
EM spectrum. http://www.lbl.gov
http://www.nssl.noaa.gov/about/events/40thanniversary/talks/doviak/slide7.html

Previous generation radar units required an operator to draw overlays and manually transmit data
Today’s radar is all computerized
Hurricane Carla in September 1961. The eye is visible on
the Galveston WSR 57 radar. This was the first
hurricane on radar that TV viewers had seen.
http://blogs.agu.org/wildwildscience/2009/10/11/how-to-
interpret-weather-radar-a-short-course-with-no-math/
WSR-57 Unit and operator.
http://www.medialine.com/ubb/NonCGI/ultimatebb.php?ubb=get_t
opic;f=3;t=008758;p=1/www.crh.noaa.gov
Raw data computer processed
Processed radar data displayed on PC work stations
Forecaster can display 1 large image or up to 4 smaller images per screen
This allows meteorologist to compare various radar products
HTTP://www.crh.noaa.gov
http://cdn.intechopen.com/pdfs/35106/InTech-
Doppler_radar_for_usa_weather_surveillance.pdf
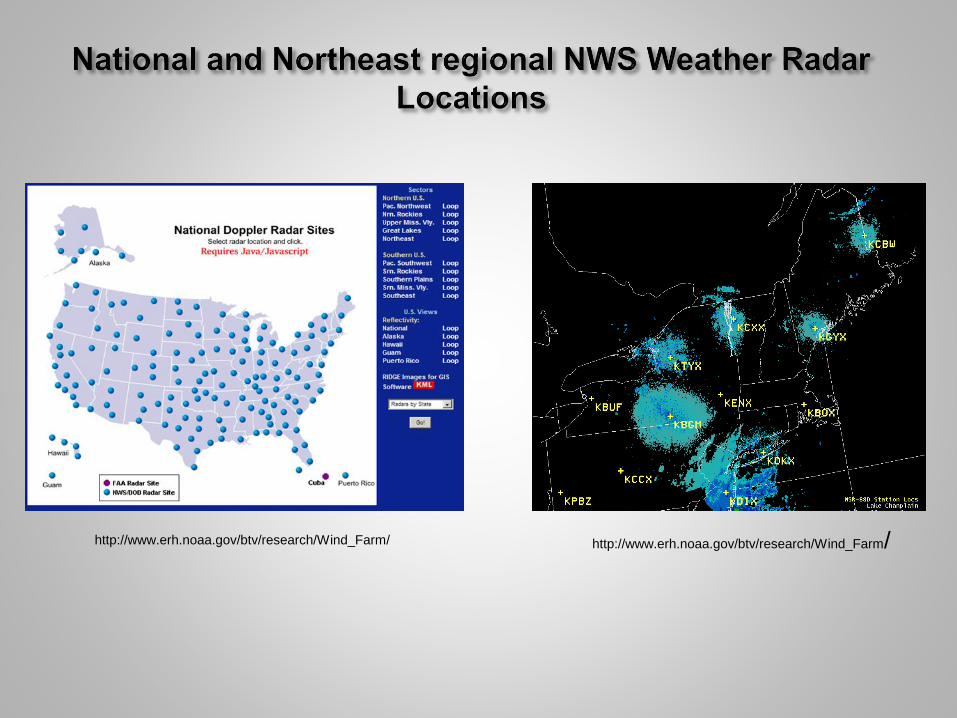
http://www.erh.noaa.gov/btv/research/Wind_Farm/http://www.erh.noaa.gov/btv/research/Wind_Farm/

Antenna rotates 360 degrees in horizontal, then raises and rotates 360 degrees through numerous vertical slices…total scan takes 4 to 8 minutes.
Very short pulses of EM energy (1.57us sec) followed by short listening period (998.43 usec). Most of the time (~99 percent) the radar is listening.
Using D = RxT, we know the following:
Speed R = C = speed of light, and
Time (T) = the time for signal to reach target and return.
Distance D = (C x T)/2 why divide by 2 ?
The direction in which the antenna is pointed determines the target’s azimuth direction
http://www.srh.noaa.gov/jetstream/doppler/how.htm
http://www.wdtb.noaa.gov/courses/dloc/topic3/lesson1/Section1/S
ection1-3.html

VCP 11 used during severe weather provides more detail and is fast.
VCP 21 is used during stratiform precipitation with less detail in vertical and is slower
Other scan strategies are also used (6 VCP’s)
Fig : VCP 11 takes 5minutes severe weather
weatherhttp://www.srh.noaa.gov/jetstream/doppler/vcp_max.htm
Fig : VCP 21 takes 6 minutes general rain
http://www.srh.noaa.gov/jetstream/doppler/vcp_max.htm

Standard refraction most common and is radar default.
Superrefraction(inversions) – The radar assumes Standard refraction
Standard or Normal refraction most frequent - beam is rising due to curvature of earth and atmosphere
Radar beam bends less (sub) than normal will overestimate tops.
Radar beam bends more than normal (super) – Inversions most frequent cause –will underestimate tops
https://www.meted.ucar.edu/radar/basic_wxradar/index.htm

The radar beam is determined by the half power points on edge of beam.
Targets separated by full beam width resolve as separate echos.
Targets separated by less than a beam width resolved as single echo.
This aspect is more of a problem at long distances as the beam spreads. As a large solid echo moves closer it may appear as 2 smaller echoes with more detailed depiction. Distant echoes are more blocky.
Example of azimuth or beam width
resolutionhttp://www.robavery.com.au/editorial/wxra
darIII/index.asp
http://www.meteor.iastate.edu/~jdduda/portfolio/How%20to
%20read%20and%20interpret%20weather%20radar.pdf

Imagery from KTYX radar (northern NY) 0.5° base reflectivity
Loop is from Aug 1, 2010 - 2:39 AM EDT to 6:16 AM EDT
Birds tend to rest overnight near bodies of water and takeoff around sunrise.
http://www.erh.noaa.gov/btv/research/Radar_Artifacts/

Pulse Repetition Frequency (PRF) is the number of energy pulses transmitted per second.
If the PRF is low (longer time between pules), detection distance is maximized.
If the PRF is high (shorter time between pules) detection distance is minimized but detail (velocity etc) is increased.
Range max = C/2PRF inversely related to PRF
V max = (PRF) * (λ)/4 is directly related to PRF [2f=prf]
WSR-88D compares transmitted wavelength with the received wavelength to calculate velocity or the shift in phase.
A positive shift (Green) implies motion toward the radar and a negative shift (Red) indicates motion away

With Dual-polarization (Dual-Pol), a horizontal and vertical pulse of energy is emitted at the same time to gather information.
This more detailed and accurate picture of what is occurring in the clouds, allows for a more comprehensive interrogation of storms.
Dual-polarization radar provides details about the size and the shape of hydrometeorologicalobjects
http://www.wdtb.noaa.gov/courses/dualpol/Outreach/non-mets-
intro/player.html

Large rain drops are oblate - horizontally orientated
Large hail tends to be spherical
Dual pulse provides information about weather type
http://www.wdtb.noaa.gov/courses/dualpol/Outreach/non-mets-
intro/player.html
Hydrometeorological type KBOX Jan 24, 2015
2133Z http://weather.cod.edu/satrad/

Once returned power is measured, Reflectivity “Z” can be estimated using Z = PrR2/C
Also Z ~ 6th power of raindrop diameter D6
Z results in large unwieldly numbers, but the log10 Z is very convenient
zRadar
reflectivity factor from
the radar equation.
(linear scale of
reflectivity)
10x = zx = log10
z
ZdBZ = 10
log10 z(decibel scale of
reflectivity)
0.001 10-3 -3 -30
0.01 10-2 -2 -20
0.1 10-1 -1 -10
1 100 0 0
10 101 1 10
100 102 2 20
1,000 103 3 30
10,000 104 4 40
100,000 105 5 50
1,000,000 106 6 60
10,000,000 107 7 70

dBZRain Rate
(in/hr)
65 16+
60 8.00
55 4.00
52 2.50
47 1.25
41 0.50
36 0.25
30 0.10
20 Trace
< 20 No rain
In precipitation mode, low dBZvalues (blue and green colors) 15-30dBZ indicate light precipitation.
As the dBZ values increase (35-55), yellow, orange, and red colors associate with moderate to heavy rain.
Values above about 45 dBZ are frequently associated with thunderstorms.
dBZ values 60 dBZ and above generally means that the sample volume contains some hail as well as heavy rain.
http://www.srh.noaa.gov/jetstream/doppler/baserefl.htm

The WSR-88D measures Doppler velocity down the radial – radial velocity.
When the radial is pointed directly into the wind we receive the true wind velocity (parallel).
When the radial is at an angle to the wind we get some percentage less than the true velocity
An isodop is a contour of constant Doppler velocity. At the zero isodop the wind is zero because the wind is perpendicular to the radial
Otherwise, through trigonometry we know it will be somewhat less depending upon the angle and ZERO when perpendicular (90 deg)
True velocity is measured when the radial
(antenna) is pointed into environmental wind
Radial

Cool colors (blue, green) are toward the radar
Hot colors (red, yellow) are away from the radar.
The grey/white line is the zero Doppler velocity or zero isodop(perpendicular to wind)
To calculate wind direction draw a line from radar site to a point (such as a range marker) on the zero isodop.
The wind direction is perpendicular to the line you drew…and the velocity is the maximum velocity anywhere at that point distance around radar display.

Pick a point of interest, and again draw a line from radar site to the zero isodop at the same distance as the point of interest.
Wind direction is perpendicular to this line
Wind speed is the maximum value on the display at that distance range

Class exercise:
What is the Doppler derived wind direction and velocityat Portland?
a) Northwest at 0-10 kt
b) West at 10-20 kt
c) Southwest at 10-20 kt
d) Northeast at 50-60 kt
e) Southeast at 0-10 kt
https://www.meted.ucar.edu/radar/basic_wxradar/index.htm

A well-defined couplet is clearly evident north-northwest of the radar - thunderstorm.
In this case, there is no zero isodopbetween the two maxima, which is often the case with thunderstorm or tornado (gate to gate) environments.
Drawing on the radial from the radar site to the echo, we note that maximum inbound velocities (GREEN) are found to left while maximum outbound velocities (RED) are to the right.
The circulation may be rotational as in this case, or could be divergent/convergent depending upon orientation to radial.
https://www.meted.ucar.edu/radar/basic_wxradar/index.htm


Remote observing by satellite (top) and radar (bottom) allow tracking of hazardous weather in data spare areas.
Equipment operates 24/7 (we hope!!!)
These remote sensing tools allow the meteorologist to fill in gaps between surface observations
Fig 1: IR Satellite 0245z Jul 4. 2014
http://www.ssd.noaa.gov/GOES/EAST/NOAA.gov
Fig 2: KMHX Radar Base Ref 0.5 deg
http://weather.cod.edu/satrad/

Radar reflectivity helped forecasters point the landfall point near the NC-SC border with observed 75 mph wind in rain bands.
WSR-88D radar imagery from
Wilmington, North Carolina estimated 3 hour precipitation of 3-6 inches (greatest observed 5.05 inches) between 10AM and 1 PM EDT
These images also assist emergency managers in evacuation and sheltering planning
Radar estimated precipitation 14
Aug 2004 1000-1300 EDT
KLTX Wilmington NC 14 Aug 2004
1601Z (12 noon EDT) REF 0.5 deg
http://www.erh.noaa.gov/ilm/archive/08-14-04/index.shtml


The dry slot around the hook is a Boundary Weak Echo Region or BWER – Upward motion so strong rain is held aloft thus echo free
Very tight dBZ gradient (green-yellow-tan-red-dark red)
Horizontal (top) and Vertical (bottom)
schematic of BWER and radar display
http://www.nws.noaa.gov/mdl/pubs/Documents/Papers/StumpfFSI2005.pdf

Convection extended northwest-southeast through Nation’s Capital region into Chesapeake Bay
Major metropolitan area and busy maritime interests
Radar helps delinate the areas of greatest threat thus the meteorologist can fine tune the forecast
Fig 3: VIS Satellite 2345z May 5, 2014
http://www.ssd.noaa.gov/GOES/EAST/NOAA.gov
Fig 5: KLWX Radar Base Ref 0.5 deg
2345z May 5, 2014
http://weather.cod.edu/satrad/
Fig 4: NOAA Surface Analysis 00z May 6, 2014.
http://www.hpc.ncep.noaa.gov/

Backdoor cold front resulted in northwest-southeast boundary for thunderstorms to traverse. Weak upper level jet streak over area.
Northern cloudy area cool as opposed to cloud free areas southwest (insolation)
Moderately unstable airmasssouthwest of the front (thunderstorms in Pa)
Afternoon thunderstorms formed in northern NY and moved into Vermont along boundary
Fig 6: NOAA Surface Analysis 18z May 27, 2014.
http://www.hpc.ncep.noaa.gov
Fig 7: VIS Satellite 1915z May 27, 2014
http://www.ssd.noaa.gov/GOES/EAST/NOAA.gov

Fig 5: KCXX Radar Storm Rel Motion 0.5 deg 1955z
May 27, 2014
KCXX Radar Base Ref 0.5 deg 1955z May 27, 2014
Fig 5: KCXX Radar Echo Tops 1951z May 27, 2014
ET 40-45K ft
Afternoon of May 27, 2014 Photo Green Mountain Power
Outflow cloud
boundary
Core of
heavy rain
and hail

Same storm 2 minutes apart as viewed by Burlington (top) and Albany NY (Bottom) radar
Note echoes along frontal boundary to northwest across Adirondacks into St Lawrence Valley of NY
Both storms Exhibit high dBZ (65-70) indicating Very heavy rain and hail. Golf ball size hail (1.75 in diam) fell.
KENX Radar REF 0.5 Deg 2050Z May 27, 2014
KCXX Radar REF 0.5 Deg 2048Z May 27, 2014

KCXX Radar loop May 27, 2014 from1924Z -2104Z
Thunderstorms on warm side of front Temperature differential of 25-30 degrees
Supercell thunderstorm followed frontal boundary
Fig 5: KCXX Radar Based one hour precipitation 2129z May 27,
2014 http://weather.cod.edu/satrad
http://www.weather.gov/media/btv/events/2014-05-
27/Isolated_Supercell.pdf

KCXX Burlington VT Radar Ref 4.0°elev – high scanning angle.
Base reflectivity showing a well-defined hail spike near Brookfield, VT on 16 July 2009 at 2250 UTC.
http://www.meteor.iastate.edu/~jdduda/portfolio/How
%20to%20read%20and%20interpret%20weather%2
0radar.pdf
KCXX 4.0° Base reflectivity 16 July 2009 at 2250Z
http://www.erh.noaa.gov/btv/research/Radar_Artifacts/

Weak or dry notches on back edgeindicate descending air
Leading edge BOWs forward as downburst winds push forward causing straight line wind damage
Tight reflectivity gradient leading edge
NOAA NWS WSR-88D KRMX ref 0.5 deg 0906Z Jul 15, 1995
http://cstar.cestm.albany.edu:7773/research/dereclho.html
NOAA NWS WSR-88D KRMX base vel 0.5 deg 0906Z Jul 15,
1995 http://cstar.cestm.albany.edu:7773/research/derecho.html

Thunderstorm complex along Canadian-USA border with mini bows embedded
Note Fine line associated with thunderstorm outflow extreme northern Champlan Valley with wind gusts 35-52 kts
Jul 19 2013 KCXX REF 2120Z
http://weather.cod.edu/satrad/
NOAA Vis Satellite Jul 19, 2013 2145Z
http://www.ssd.noaa.gov/GOES/EAST/NOAA.gov
Photo: Outflow cloud line Jul 19 2013
720PM So. Burlington VT - Hogan


Low pressure south of New England resembles Comma shape with dry slot
Bright melting band over Cape Cod and eastern MA
Snow band from coastal NH into northern MA
Otherwise, no tight gradients and fuzzy edges typical of snowKBOX Jan 24 1605Z 0.5 Deg Radar Reflec
http://weather.cod.edu/satrad/
NOAA Surface Analysis 18z Jan 24, 2015.
http://www.hpc.ncep.noaa.gov/KBOX Jan 24 1605Z 0.5 Deg Radar base vel
http://weather.cod.edu/satrad/
L

Northern edge of snow (blue) in NH and Me appears fuzzy typical of snow, with cold dry air to north.
Reflectivity Gradients are NOT tight.
Snow bands setting up southern Me into northern Ma
Bright band south coastal New England north to Boston

Low level winds shifting into a cold northeast flow
Just above the surface warmer air with southeast flow
Bright band (Reflec) confirmed melting aloft with rain in Boston area south
KBOX Jan 24 1605Z 0.5 Deg Radar base vel
http://weather.cod.edu/satrad/
KBOX Jan 24 1605Z VAD Wind Profile low level
northeast ... Above southeast
http://weather.cod.edu/satrad/

Top image – Beam blockage where data blocked in lower scans by Green Mountains and Adirondacks
Radar beam does shoot down Winooski and Lamoille river valleys
Bottom Image - Wind Turbine Clutter created by rotating turbine blades impact Reflectivity and Velocity data and result in false alerts
http://www.erh.noaa.gov/btv/research/Radar_Artifacts/
http://www.erh.noaa.gov/btv/research/Wind_Farm/

NOAA NWS KCXX radar REF 1.5 deg
Mar 15, 2015 1651z
NOAA NWS KENX radar REF 0.05 deg
Mar 15, 2015 1648z
NOAA NWS KCXX radar REF 0.05 deg
Mar 15, 2015 1636z
NOAA NWS KGYX radar REF 0.05 deg
Mar 15, 2015 1643z