Quarterly Financial Highlights 2Q 2017 - BNY Mellon · are contained in the Corporation’s reports...
24
BNY Mellon Second Quarter 2017 Financial Highlights July 20, 2017
Transcript of Quarterly Financial Highlights 2Q 2017 - BNY Mellon · are contained in the Corporation’s reports...

BNY Mellon
Second Quarter 2017Financial Highlights
July 20, 2017

2 Second Quarter 2017 – Financial Highlights
Cautionary StatementA number of statements in the accompanying slides and the responses to your questions are “forward-looking statements.” Words such as“estimate”, “forecast”, “project”, “anticipate”, “target”, “expect”, “intend”, “continue”, “seek”, “believe”, “plan”, “goal”, “could”, “should”, “may”,“will”, “strategy”, “opportunities”, “trends” and words of similar meaning signify forward-looking statements. These statements relate to, amongother things, The Bank of New York Mellon Corporation’s (the “Corporation”) expectations regarding: capital plans, strategic priorities, financialgoals, client experience, driving revenue growth, the business improvement process, estimated capital ratios and expectations regarding thoseratios, preliminary business metrics; and statements regarding the Corporation's aspirations, as well as the Corporation’s overall plans,strategies, goals, objectives, expectations, estimates, intentions, targets, opportunities and initiatives. These forward-looking statements arebased on assumptions that involve risks and uncertainties and that are subject to change based on various important factors (some of whichare beyond the Corporation’s control).
Actual results may differ materially from those expressed or implied as a result of the factors described under “Forward Looking Statements”and “Risk Factors” in the Corporation’s Annual Report on Form 10-K for the year ended December 31, 2016 (the “2016 Annual Report”) andQuarterly Report on Form 10-Q for the quarter ended March 31, 2017 (the “1Q17 Form 10-Q”), and in other filings of the Corporation with theSecurities and Exchange Commission (the “SEC”), including the Corporation’s Earnings Release for the quarter ended June 30, 2017, includedas an exhibit to our Current Report on Form 8-K filed on July 20, 2017 (the “Earnings Release”). Such forward-looking statements speak onlyas of July 20, 2017, and the Corporation undertakes no obligation to update any forward-looking statement to reflect events or circumstancesafter that date or to reflect the occurrence of unanticipated events.
Non-GAAP Measures: In this presentation we may discuss some non-GAAP measures in detailing the Corporation’s performance, whichexclude certain items or otherwise include components that differ from GAAP. We believe these measures are useful to the investmentcommunity in analyzing the financial results and trends of ongoing operations. We believe they facilitate comparisons with prior periods andreflect the principal basis on which our management monitors financial performance. Additional disclosures relating to non-GAAP measuresare contained in the Corporation’s reports filed with the SEC, including the 2016 Annual Report, the 1Q17 Form 10-Q and the Earnings Release,available at www.bnymellon.com/investorrelations.

3 Second Quarter 2017 – Financial Highlights
Summary Financial Results for Second Quarter 2017 - GAAP Growth vs.
$ in millions, except per share data 2Q17 1Q17 2Q16 1Q17 2Q16
Revenue $ 3,956 $ 3,843 $ 3,776 3% 5%
Expenses $ 2,655 $ 2,642 $ 2,620 —% 1%
Operating leverage1 +245 bps +343 bps
Income before income taxes $ 1,308 $ 1,206 $ 1,165 8% 12%
Pre-tax operating margin 33% 31% 31%
EPS $ 0.88 $ 0.83 $ 0.75 6% 17%
Return on common equity2 10.4% 10.2% 9.3% +16 bps +110 bps
1 Operating leverage is the rate of increase in total revenue less the rate of increase in total noninterest expense. The year-over-year operating leverage was based on an increase in total revenue of 477 basis points, andan increase in total noninterest expense, of 134 basis points. The sequential operating leverage was based on an increase in total revenue of 294 basis points, and an increase in total noninterest expense, of 49 basispoints.2 Annualized.Note: Provision for credit losses was a credit of $7 million in 2Q17 versus a provision credit of $5 million in 1Q17 and a provision credit of $9 million in 2Q16.bps - basis points
4 Second Quarter 2017 – Financial Highlights
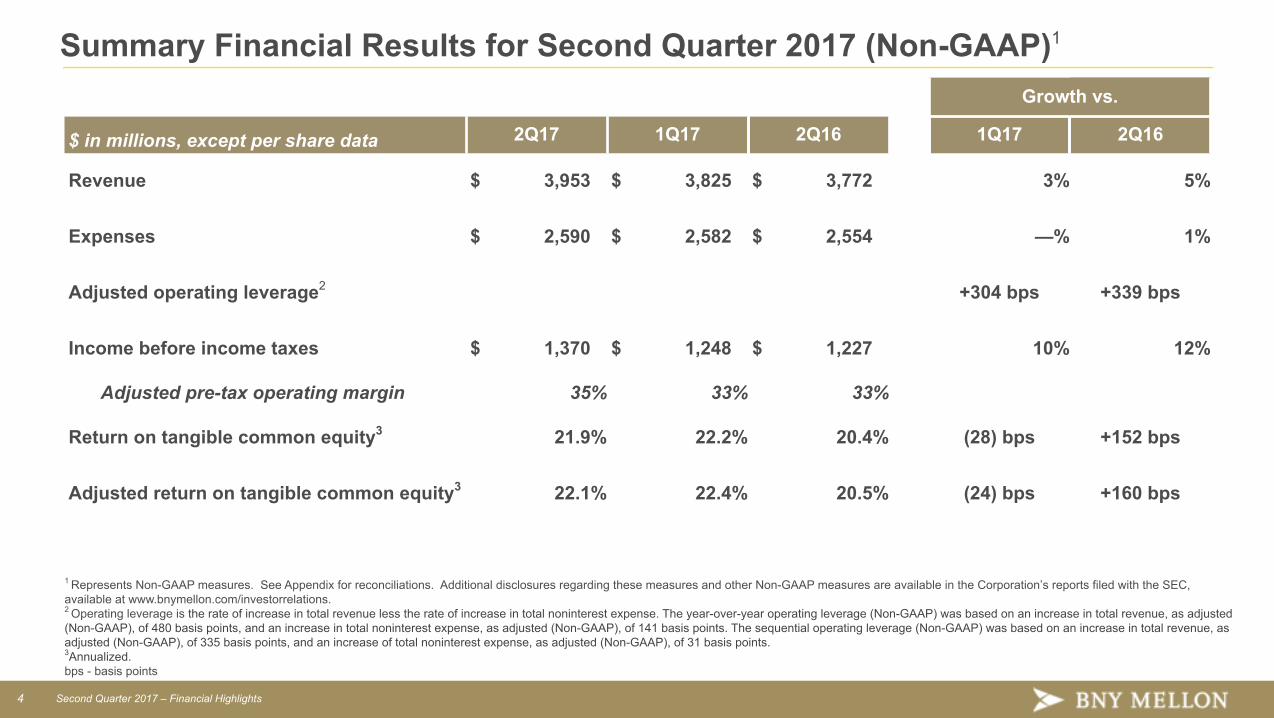
Summary Financial Results for Second Quarter 2017 (Non-GAAP)1
Growth vs.
$ in millions, except per share data 2Q17 1Q17 2Q16 1Q17 2Q16
Revenue $ 3,953 $ 3,825 $ 3,772 3% 5%
Expenses $ 2,590 $ 2,582 $ 2,554 —% 1%
Adjusted operating leverage2 +304 bps +339 bps
Income before income taxes $ 1,370 $ 1,248 $ 1,227 10% 12%
Adjusted pre-tax operating margin 35% 33% 33%
Return on tangible common equity3 21.9% 22.2% 20.4% (28) bps +152 bps
Adjusted return on tangible common equity3 22.1% 22.4% 20.5% (24) bps +160 bps
1 Represents Non-GAAP measures. See Appendix for reconciliations. Additional disclosures regarding these measures and other Non-GAAP measures are available in the Corporation’s reports filed with the SEC,available at www.bnymellon.com/investorrelations. 2 Operating leverage is the rate of increase in total revenue less the rate of increase in total noninterest expense. The year-over-year operating leverage (Non-GAAP) was based on an increase in total revenue, as adjusted(Non-GAAP), of 480 basis points, and an increase in total noninterest expense, as adjusted (Non-GAAP), of 141 basis points. The sequential operating leverage (Non-GAAP) was based on an increase in total revenue, asadjusted (Non-GAAP), of 335 basis points, and an increase of total noninterest expense, as adjusted (Non-GAAP), of 31 basis points.3Annualized.bps - basis points

5 Second Quarter 2017 – Financial Highlights
Second Quarter Financial Highlights (comparisons are 2Q17 versus 2Q16)
Fee Revenue • Investment services fees increased +4%• Investment management and performance fees
increased +6% Net Interest Revenue
• Primarily driven by higher interest rates• NIM +17 bps to 114 bps
Positive Operating Leverage• Pretax operating margin increased to +33%• Adjusted Pretax operating margin increased to
+35%1
Adjusted Return on Tangible Common Equity (“ROTCE”)• Adjusted ROTCE improved to +22.1%1
1 Represents a Non-GAAP measure. See Appendix for reconciliations. Additional disclosures regarding these measures and other Non-GAAP measures are available in the Corporation’s reports filed with the SEC,available at www.bnymellon.com/investorrelations. 2 Includes the repurchase of $500 million of common stock contingent on the prior issuance of $500 million of noncumulative perpetual preferred stock.
+5%
+8%
+343bps
+160bps1
Earnings Per Share
2Q16 2Q17
$ 0.75
$0.88+17%
Executing on capital plan and returning value tocommon shareholders
• Returned nearly $700 million toshareholders through share repurchasesand dividends
• Return on common equity of 10%;adjusted return on tangible common equityof 22%1
• SLR - transitional of 6.2%; SLR - fullyphased-in of 6.0%1
Noninterest Expense• Primarily driven by regulatory, legal and
software expense
+1%
Strong Capital Position and Return to Shareholders
� In 2Q17, we returned over $700 million to shareholders through share repurchases and dividends� The Federal Reserve did not object to our 2017 capital plan within the annual Comprehensive Capital Analysis and Review (“CCAR”)� Board approved quarterly common stock dividend increase of 26% to $0.24 per share and the repurchase of up to $3.1 billion of common stock over the nextfour quarters2

6 Second Quarter 2017 – Financial Highlights
Second Quarter 2017 Key Performance Drivers (comparisons are 2Q17 versus 2Q16) • Earnings per common share of $0.88, +17%, driven by strength in investment services fees, net interest revenue, investment management and
performance fees and continued execution of our business improvement process • Investment management and performance fees +6% due to higher market values, money market fees, and performance fees offset by the
unfavorable impact of a stronger U.S. dollar (principally versus the British pound). On a constant currency basis, investment management andperformance fees increased +9% (Non-GAAP)1
• Record Assets under Management of $1.8 trillion, +6% • Investment services fees +4% reflecting growth in clearing services fees, net new business, including collateral management solutions, and
higher equity market values, offset by the unfavorable impact of a stronger U.S. dollar• Record Assets under Custody and/or Administration of $31.1 trillion, +5%
• Net interest revenue (“NIR”) and net interest margin (“NIM”) growth primarily reflect higher interest rates• NIR (FTE) up +7%; NIM (FTE) up +18 bps to 116 bps1
• Trading and market-driven revenue• Foreign Exchange (9)% primarily reflects lower volatility, offset by higher volumes• Securities Lending (8)% due to decreased equity spreads
• Investment and Other income increased $48 million primarily driven by lease-related gains• Noninterest expense +1%, reflecting higher professional, legal, and other purchased services (related to regulatory and compliance costs,
including the 2017 resolution plan), software and litigation expenses, offset by the favorable impact of a stronger U.S. dollar and lower netoccupancy expense
• Business improvement process driving efficiencies • Enhancing the client experience through continued investments in growth initiatives including the roll out of our NEXEN digital platform• Improving efficiencies through initiatives by refining our location strategy and optimizing our physical footprint
• Effective tax rate of 25.4% 1 Represents a Non-GAAP measure. See page 10 for NIR (FTE) and NIM (FTE) reconciliation and Appendix for all other reconciliations. Additional disclosures regarding these measures and other Non-GAAP measuresare available in the Corporation’s reports filed with the SEC, available at www.bnymellon.com/investorrelations. FTE - fully taxable equivalent
7 Second Quarter 2017 – Financial Highlights
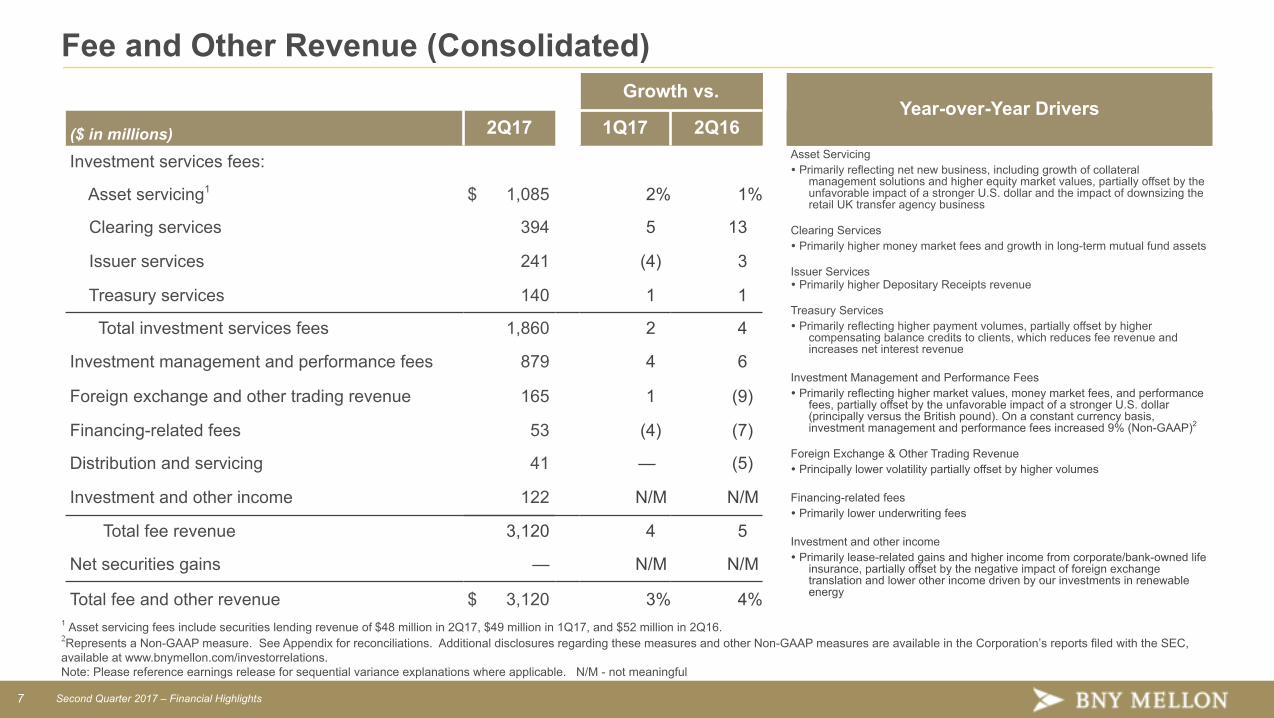
Fee and Other Revenue (Consolidated)Growth vs.
Year-over-Year Drivers($ in millions) 2Q17 1Q17 2Q16
Investment services fees: Asset Servicing� Primarily reflecting net new business, including growth of collateral
management solutions and higher equity market values, partially offset by theunfavorable impact of a stronger U.S. dollar and the impact of downsizing theretail UK transfer agency business
Clearing Services� Primarily higher money market fees and growth in long-term mutual fund assets
Issuer Services� Primarily higher Depositary Receipts revenue
Treasury Services� Primarily reflecting higher payment volumes, partially offset by higher
compensating balance credits to clients, which reduces fee revenue andincreases net interest revenue
Investment Management and Performance Fees� Primarily reflecting higher market values, money market fees, and performance
fees, partially offset by the unfavorable impact of a stronger U.S. dollar(principally versus the British pound). On a constant currency basis,investment management and performance fees increased 9% (Non-GAAP)2
Foreign Exchange & Other Trading Revenue� Principally lower volatility partially offset by higher volumes
Financing-related fees� Primarily lower underwriting fees
Investment and other income� Primarily lease-related gains and higher income from corporate/bank-owned life
insurance, partially offset by the negative impact of foreign exchangetranslation and lower other income driven by our investments in renewableenergy
Asset servicing1 $ 1,085 2% 1%
Clearing services 394 5 13
Issuer services 241 (4) 3
Treasury services 140 1 1
Total investment services fees 1,860 2 4
Investment management and performance fees 879 4 6
Foreign exchange and other trading revenue 165 1 (9)
Financing-related fees 53 (4) (7)
Distribution and servicing 41 — (5)
Investment and other income 122 N/M N/M
Total fee revenue 3,120 4 5
Net securities gains — N/M N/M
Total fee and other revenue $ 3,120 3% 4%1 Asset servicing fees include securities lending revenue of $48 million in 2Q17, $49 million in 1Q17, and $52 million in 2Q16.2Represents a Non-GAAP measure. See Appendix for reconciliations. Additional disclosures regarding these measures and other Non-GAAP measures are available in the Corporation’s reports filed with the SEC,available at www.bnymellon.com/investorrelations. Note: Please reference earnings release for sequential variance explanations where applicable. N/M - not meaningful
8 Second Quarter 2017 – Financial Highlights
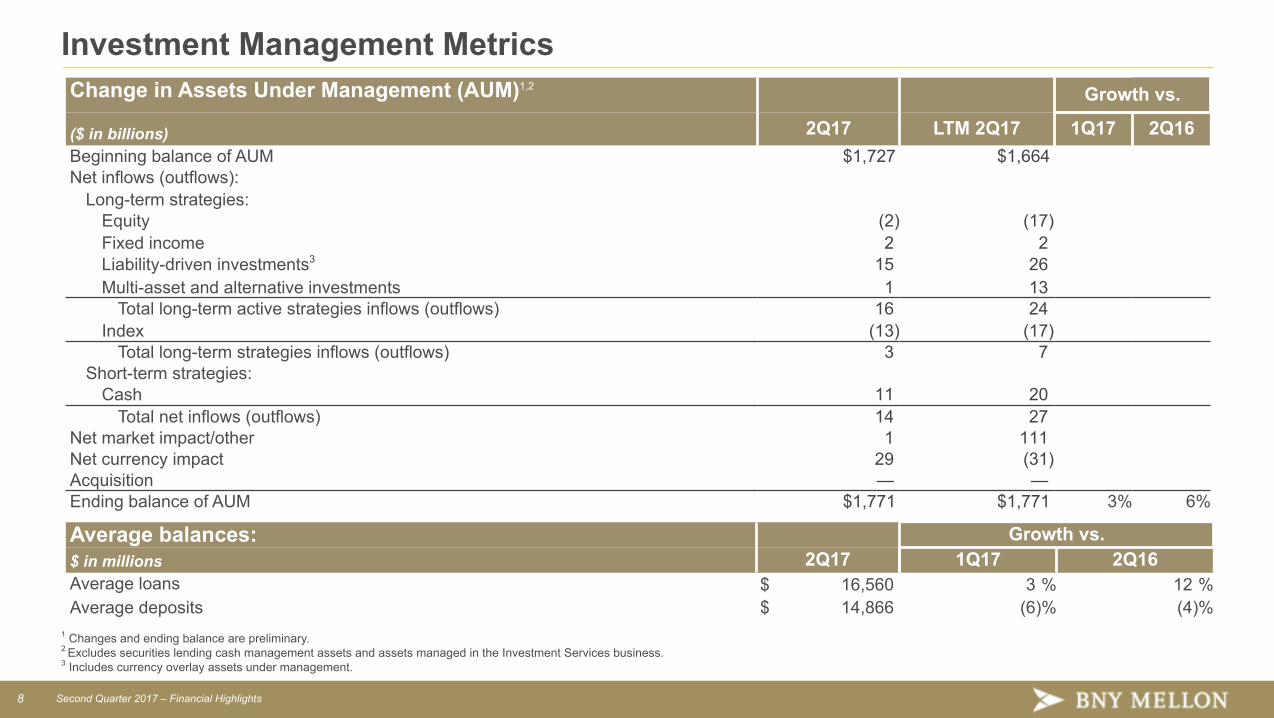
Investment Management Metrics Change in Assets Under Management (AUM)1,2 Growth vs.
($ in billions) 2Q17 LTM 2Q17 1Q17 2Q16Beginning balance of AUM $1,727 $1,664Net inflows (outflows):
Long-term strategies:Equity (2) (17)Fixed income 2 2Liability-driven investments3 15 26Multi-asset and alternative investments 1 13
Total long-term active strategies inflows (outflows) 16 24Index (13) (17)
Total long-term strategies inflows (outflows) 3 7Short-term strategies:
Cash 11 20Total net inflows (outflows) 14 27
Net market impact/other 1 111Net currency impact 29 (31)Acquisition — —Ending balance of AUM $1,771 $1,771 3% 6%
Average balances: Growth vs.$ in millions 2Q17 1Q17 2Q16Average loans $ 16,560 3 % 12 %Average deposits $ 14,866 (6)% (4)%
1 Changes and ending balance are preliminary.2 Excludes securities lending cash management assets and assets managed in the Investment Services business.3 Includes currency overlay assets under management.

9 Second Quarter 2017 – Financial Highlights
Investment Services Metrics Growth vs.
2Q17 1Q17 2Q16
Assets under custody and/or administration at period end (trillions)1,2 $ 31.1 2 % 5 %
Estimated new business wins (AUC/A) (billions)1 $ 152
Market value of securities on loan at period end (billions)3 $ 336 7 % 21 %
Average loans (millions) $ 40,931 (4)% (7)%Average deposits (millions) $ 200,417 1 % (10)%
Broker-DealerAverage tri-party repo balances (billions) $ 2,498 5 % 19 %
Clearing ServicesAverage active clearing accounts (U.S. platform) (thousands) 6,159 2 % 4 %Average long-term mutual fund assets (U.S. platform) (millions) $ 480,532 4 % 11 %
Depositary ReceiptsNumber of sponsored programs 1,025 (2)% (8)%
1 Preliminary.2 Includes the AUC/A of CIBC Mellon Global Securities Services Company (“CIBC Mellon”), a joint venture with the Canadian Imperial Bank of Commerce, of $1.2 trillion at June 30, 2017, $1.2 trillion at March31, 2017, and $1.1 trillion at June 30, 2016.3 Represents the total amount of securities on loan in our agency securities lending program managed by the Investment Services business. Excludes securities for which BNY Mellon acts as agent on behalf ofCIBC Mellon clients, which totaled $66 billion at June 30, 2017, $65 billion at March 31, 2017 and $56 billion at June 30, 2016.
10 Second Quarter 2017 – Financial Highlights
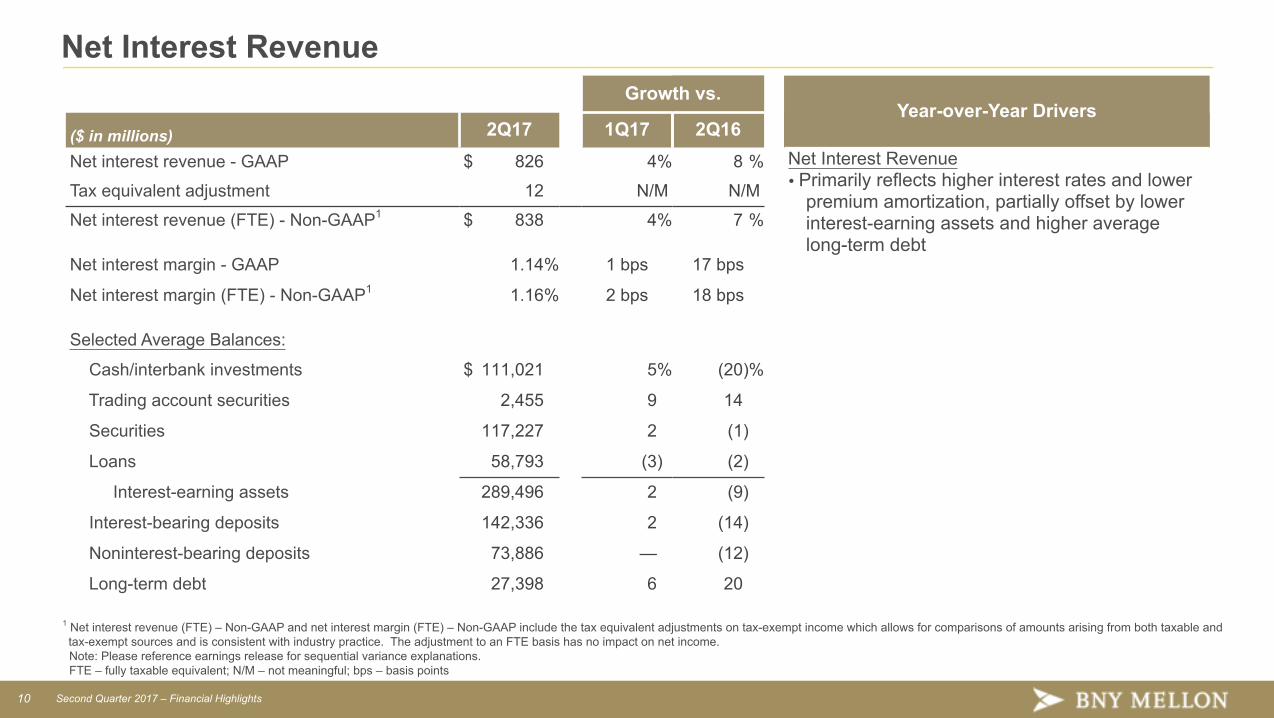
Net Interest Revenue Growth vs.
Year-over-Year Drivers($ in millions) 2Q17 1Q17 2Q16Net interest revenue - GAAP $ 826 4% 8 % Net Interest Revenue
� Primarily reflects higher interest rates and lowerpremium amortization, partially offset by lowerinterest-earning assets and higher averagelong-term debt
Tax equivalent adjustment 12 N/M N/M
Net interest revenue (FTE) - Non-GAAP1 $ 838 4% 7 %
Net interest margin - GAAP 1.14% 1 bps 17 bps
Net interest margin (FTE) - Non-GAAP1 1.16% 2 bps 18 bps
Selected Average Balances:
Cash/interbank investments $ 111,021 5% (20)%
Trading account securities 2,455 9 14
Securities 117,227 2 (1)
Loans 58,793 (3) (2)
Interest-earning assets 289,496 2 (9)
Interest-bearing deposits 142,336 2 (14)
Noninterest-bearing deposits 73,886 — (12)
Long-term debt 27,398 6 20
1 Net interest revenue (FTE) – Non-GAAP and net interest margin (FTE) – Non-GAAP include the tax equivalent adjustments on tax-exempt income which allows for comparisons of amounts arising from both taxable andtax-exempt sources and is consistent with industry practice. The adjustment to an FTE basis has no impact on net income.
Note: Please reference earnings release for sequential variance explanations. FTE – fully taxable equivalent; N/M – not meaningful; bps – basis points
11 Second Quarter 2017 – Financial Highlights
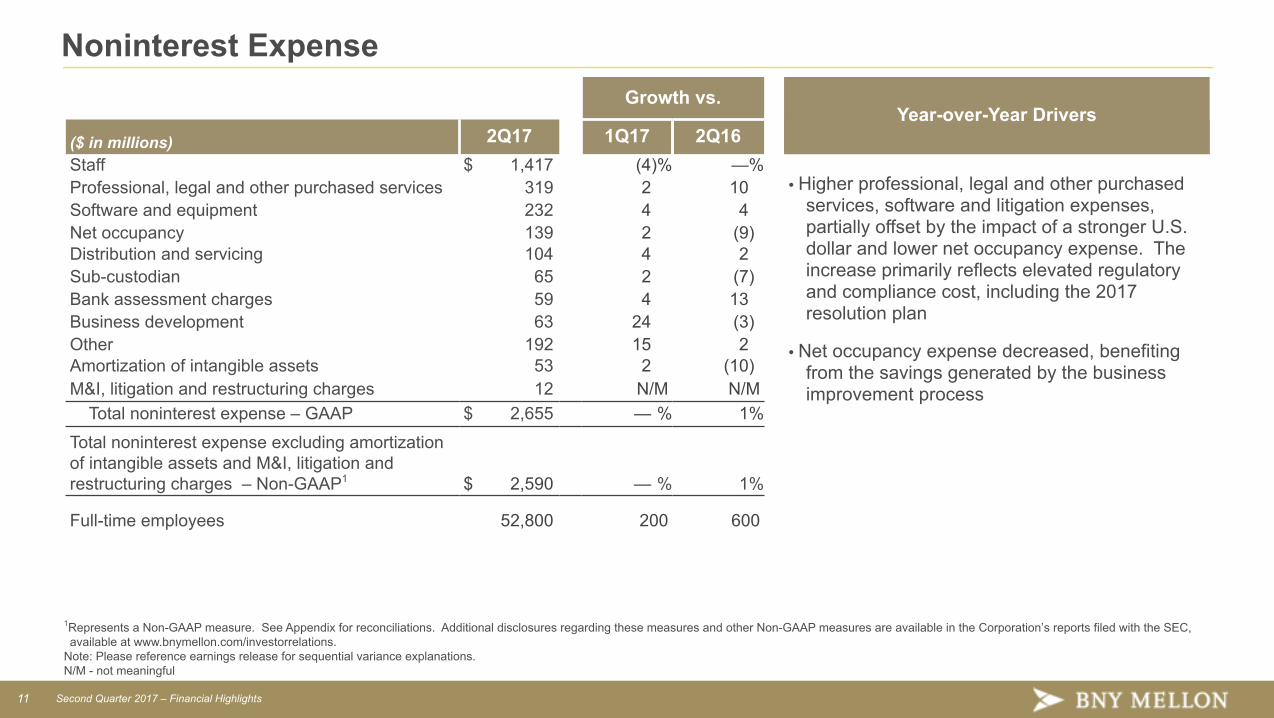
Noninterest Expense Growth vs.
Year-over-Year Drivers($ in millions) 2Q17 1Q17 2Q16Staff $ 1,417 (4)% —%
� Higher professional, legal and other purchasedservices, software and litigation expenses,partially offset by the impact of a stronger U.S.dollar and lower net occupancy expense. Theincrease primarily reflects elevated regulatoryand compliance cost, including the 2017resolution plan
� Net occupancy expense decreased, benefitingfrom the savings generated by the businessimprovement process
Professional, legal and other purchased services 319 2 10Software and equipment 232 4 4Net occupancy 139 2 (9)Distribution and servicing 104 4 2Sub-custodian 65 2 (7)Bank assessment charges 59 4 13Business development 63 24 (3)Other 192 15 2Amortization of intangible assets 53 2 (10)M&I, litigation and restructuring charges 12 N/M N/M Total noninterest expense – GAAP $ 2,655 — % 1%
Total noninterest expense excluding amortizationof intangible assets and M&I, litigation andrestructuring charges – Non-GAAP1 $ 2,590 — % 1%
Full-time employees 52,800 200 600
1Represents a Non-GAAP measure. See Appendix for reconciliations. Additional disclosures regarding these measures and other Non-GAAP measures are available in the Corporation’s reports filed with the SEC,available at www.bnymellon.com/investorrelations.
Note: Please reference earnings release for sequential variance explanations.N/M - not meaningful
12 Second Quarter 2017 – Financial Highlights
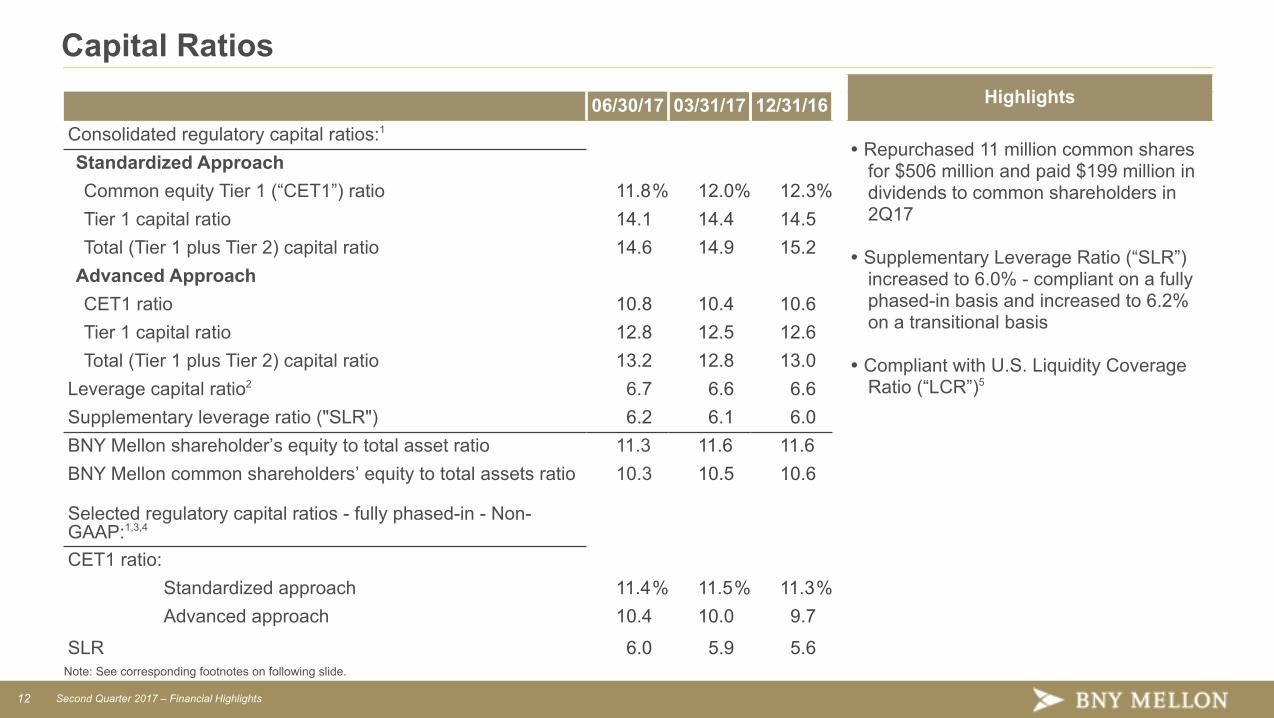
Capital Ratios Highlights06/30/17 03/31/17 12/31/16
Consolidated regulatory capital ratios:1
� Repurchased 11 million common sharesfor $506 million and paid $199 million individends to common shareholders in2Q17
� Supplementary Leverage Ratio (“SLR”)increased to 6.0% - compliant on a fullyphased-in basis and increased to 6.2%on a transitional basis
� Compliant with U.S. Liquidity CoverageRatio (“LCR”)5
Standardized ApproachCommon equity Tier 1 (“CET1”) ratio 11.8% 12.0% 12.3%Tier 1 capital ratio 14.1 14.4 14.5Total (Tier 1 plus Tier 2) capital ratio 14.6 14.9 15.2
Advanced ApproachCET1 ratio 10.8 10.4 10.6Tier 1 capital ratio 12.8 12.5 12.6Total (Tier 1 plus Tier 2) capital ratio 13.2 12.8 13.0
Leverage capital ratio2 6.7 6.6 6.6Supplementary leverage ratio ("SLR") 6.2 6.1 6.0BNY Mellon shareholder’s equity to total asset ratio 11.3 11.6 11.6BNY Mellon common shareholders’ equity to total assets ratio 10.3 10.5 10.6
Selected regulatory capital ratios - fully phased-in - Non-GAAP:1,3,4
CET1 ratio:Standardized approach 11.4% 11.5% 11.3%Advanced approach 10.4 10.0 9.7
SLR 6.0 5.9 5.6Note: See corresponding footnotes on following slide.
13 Second Quarter 2017 – Financial Highlights
Capital Ratio Footnotes1 June 30, 2017 regulatory capital ratios are preliminary. See the “Capital Ratios” section in the earnings release foradditional detail. For our CET1, Tier 1 capital and Total capital ratios, our effective capital ratios under the U.S. capitalrules are the lower of the ratios as calculated under the Standardized and Advanced Approaches.2 The leverage capital ratio is based on Tier 1 capital, as phased-in and quarterly average total assets. 3 Please reference slide 22 & 23. See the “Capital Ratios” section in the earnings release for additional detail.4 Estimated.5 The U.S. LCR rules became fully phased-in on Jan. 1, 2017 and require BNY Mellon to meet an LCR of 100%. On aconsolidated basis, our average LCR was 116% for 2Q17. High-quality liquid assets (“HQLA”) before haircuts and trappedliquidity totaled $174 billion at June 30, 2017 and averaged $166 billion for 2Q17.

Appendix
15 Second Quarter 2017 – Financial Highlights
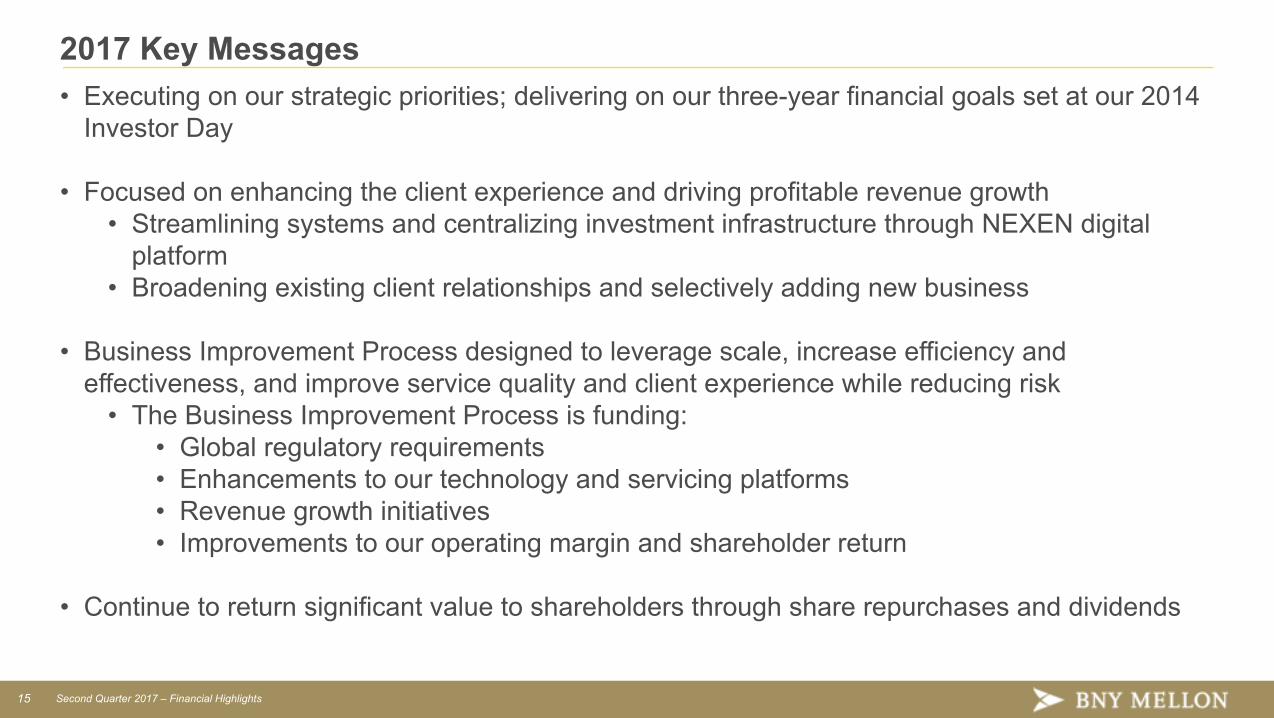
2017 Key Messages• Executing on our strategic priorities; delivering on our three-year financial goals set at our 2014
Investor Day
• Focused on enhancing the client experience and driving profitable revenue growth• Streamlining systems and centralizing investment infrastructure through NEXEN digital
platform • Broadening existing client relationships and selectively adding new business
• Business Improvement Process designed to leverage scale, increase efficiency andeffectiveness, and improve service quality and client experience while reducing risk
• The Business Improvement Process is funding:• Global regulatory requirements • Enhancements to our technology and servicing platforms• Revenue growth initiatives• Improvements to our operating margin and shareholder return
• Continue to return significant value to shareholders through share repurchases and dividends

16 Second Quarter 2017 – Financial Highlights
Strategic PrioritiesStrategic Priorities to Drive Growth
Driving Profitable Revenue Growth and Enhancing the Client Experience
• Leveraging our scale and expertise to create increased value for clients and shareholders through all environments• In IM, strong revenue growth vs. 2Q16:
• Improved performance across the enterprise, strength of our diversified business in a rising global market, and focuson high-value active solutions to meet growing client demand
• Record Assets under management of $1.8T, supported by higher market values and strong asset inflows1
• Cash business, in contrast to industry trend of outflows in 2Q17, contributed significantly to $11B of cash inflows1
• Continued solid investment performance against the backdrop of a relatively strong quarter for global markets • 72% and 84% of our long-term active strategies above their 3 and 5-year benchmarks• Strong wealth management performance, reflecting record revenue, pretax income, client assets and loan volume
• In IS, solid revenue growth vs. 2Q16 while enhancing the client experience:• Revenue reflecting growth in collateral management solutions, higher money market fees and higher equity market
values, partially offset by the unfavorable impact of a stronger U.S. dollar•Record AUC/A of $31.1T and estimated new business wins of $152B1
•Continued strong clearing services performance • Money market fee waiver recovery and growth in mutual fund balances• Benefiting from investments in cutting-edge collateral management and U.S. government securities clearing
capabilities and in technology to increase capacity and enhance services
Executing on our Business Improvement Process
• Funding regulatory change, process maturity, strategic technology and growth investments• Improving margins in our businesses• Reducing structural costs
Being a Strong, Safe, Trusted Counterparty
• Results of the 2017 CCAR stress tests demonstrate the resiliency of our capital position• Strengthened our key regulatory capital ratios • Estimated SLR of 6.0% (fully phased-in)• Strong capital and liquidity positions• Simplified our legal entity structure in Europe and across the globe, eliminating a number of entities• Established a separate legal entity for the operations aspects of our U.S. government securities clearing and tri-party
repo business
Generating Excess Capital and Deploying Capital Effectively
• Executing on capital plan and returning value to shareholders• Over $700MM returned to shareholders in 2Q17; repurchased 11MM shares for $506MM and paid $199MM in dividends to common shareholders
• Board approved the repurchase of up to $3.1B of common stock, including the repurchase of $500MM of commonstock contingent on a preferred stock issuance, over the next four quarters
Attracting, Developing, and Retaining Top Talent
• Executive appointments in 2Q17 demonstrated our ongoing focus on tapping into great talent and fresh perspectives inthe marketplace while providing growth opportunities for top contributors from within our ranks
• Charles Scharf (CEO); Bridget Engle (CIO); Michelle Neal (promoted to EC); Frank La Salla (CEO of CorporateTrust); Chandresh Iyer (CEO of AIS & Structured Products); and Rohan Singh (APAC Head of Asset Servicing)
1 Preliminary.
17 Second Quarter 2017 – Financial Highlights
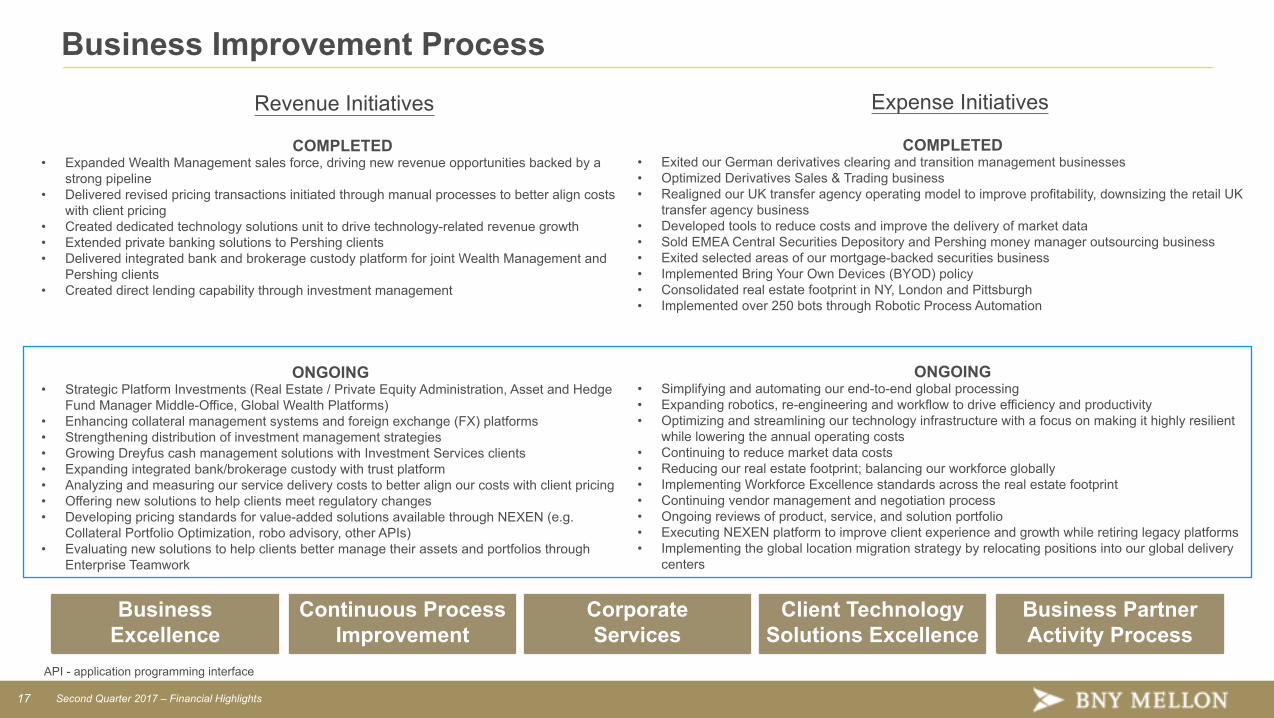
Business Improvement Process
COMPLETED• Expanded Wealth Management sales force, driving new revenue opportunities backed by a
strong pipeline• Delivered revised pricing transactions initiated through manual processes to better align costs
with client pricing• Created dedicated technology solutions unit to drive technology-related revenue growth• Extended private banking solutions to Pershing clients• Delivered integrated bank and brokerage custody platform for joint Wealth Management and
Pershing clients• Created direct lending capability through investment management
ONGOING• Strategic Platform Investments (Real Estate / Private Equity Administration, Asset and Hedge
Fund Manager Middle-Office, Global Wealth Platforms)• Enhancing collateral management systems and foreign exchange (FX) platforms• Strengthening distribution of investment management strategies• Growing Dreyfus cash management solutions with Investment Services clients• Expanding integrated bank/brokerage custody with trust platform• Analyzing and measuring our service delivery costs to better align our costs with client pricing• Offering new solutions to help clients meet regulatory changes• Developing pricing standards for value-added solutions available through NEXEN (e.g.
Collateral Portfolio Optimization, robo advisory, other APIs)• Evaluating new solutions to help clients better manage their assets and portfolios through
Enterprise Teamwork
COMPLETED• Exited our German derivatives clearing and transition management businesses• Optimized Derivatives Sales & Trading business• Realigned our UK transfer agency operating model to improve profitability, downsizing the retail UK
transfer agency business• Developed tools to reduce costs and improve the delivery of market data• Sold EMEA Central Securities Depository and Pershing money manager outsourcing business• Exited selected areas of our mortgage-backed securities business• Implemented Bring Your Own Devices (BYOD) policy• Consolidated real estate footprint in NY, London and Pittsburgh• Implemented over 250 bots through Robotic Process Automation
ONGOING• Simplifying and automating our end-to-end global processing• Expanding robotics, re-engineering and workflow to drive efficiency and productivity• Optimizing and streamlining our technology infrastructure with a focus on making it highly resilient
while lowering the annual operating costs• Continuing to reduce market data costs• Reducing our real estate footprint; balancing our workforce globally • Implementing Workforce Excellence standards across the real estate footprint• Continuing vendor management and negotiation process• Ongoing reviews of product, service, and solution portfolio• Executing NEXEN platform to improve client experience and growth while retiring legacy platforms• Implementing the global location migration strategy by relocating positions into our global delivery
centers
Business Excellence
Continuous ProcessImprovement
Corporate Services
Client TechnologySolutions Excellence
Business PartnerActivity Process
Revenue Initiatives Expense Initiatives
API - application programming interface
18 Second Quarter 2017 – Financial Highlights
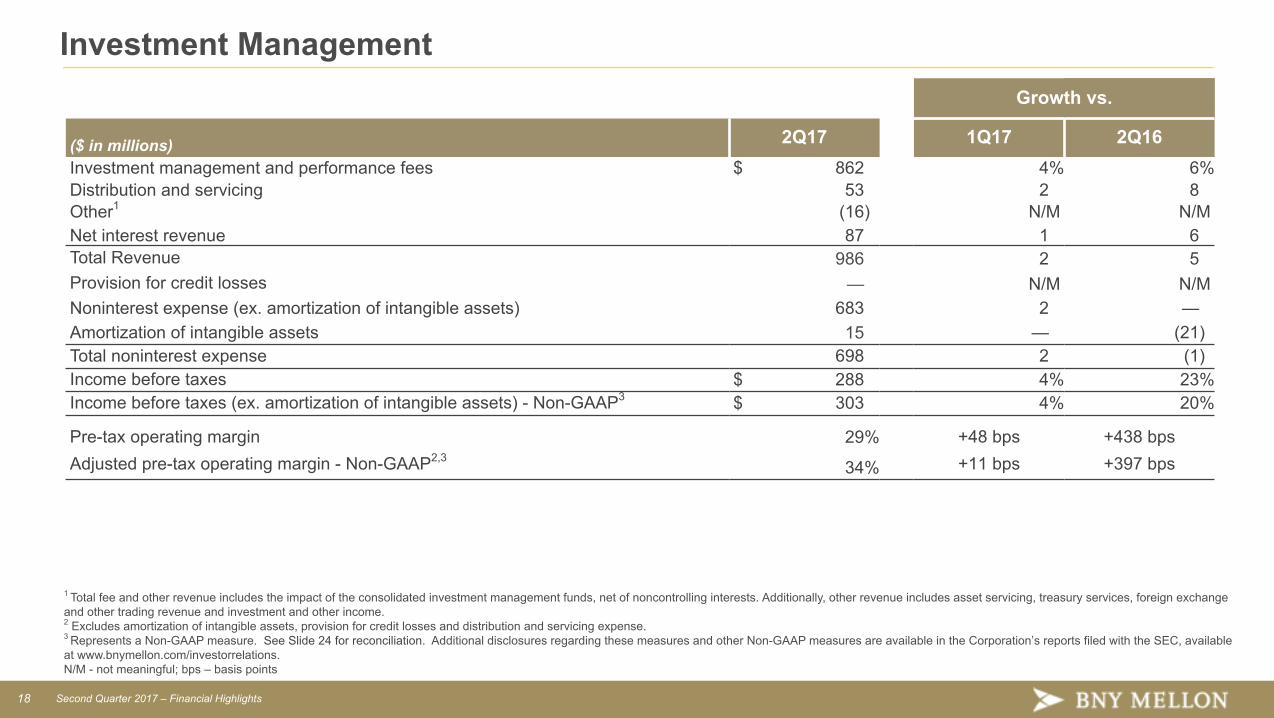
Investment Management
.Growth vs.
($ in millions) 2Q17 1Q17 2Q16Investment management and performance fees $ 862 4% 6%Distribution and servicing 53 2 8Other1 (16) N/M N/MNet interest revenue 87 1 6Total Revenue 986 2 5Provision for credit losses — N/M N/MNoninterest expense (ex. amortization of intangible assets) 683 2 —Amortization of intangible assets 15 — (21)Total noninterest expense 698 2 (1)Income before taxes $ 288 4% 23%Income before taxes (ex. amortization of intangible assets) - Non-GAAP3 $ 303 4% 20%
Pre-tax operating margin 29% +48 bps +438 bpsAdjusted pre-tax operating margin - Non-GAAP2,3
34% +11 bps +397 bps
1 Total fee and other revenue includes the impact of the consolidated investment management funds, net of noncontrolling interests. Additionally, other revenue includes asset servicing, treasury services, foreign exchangeand other trading revenue and investment and other income.2 Excludes amortization of intangible assets, provision for credit losses and distribution and servicing expense.3 Represents a Non-GAAP measure. See Slide 24 for reconciliation. Additional disclosures regarding these measures and other Non-GAAP measures are available in the Corporation’s reports filed with the SEC, availableat www.bnymellon.com/investorrelations. N/M - not meaningful; bps – basis points
19 Second Quarter 2017 – Financial Highlights
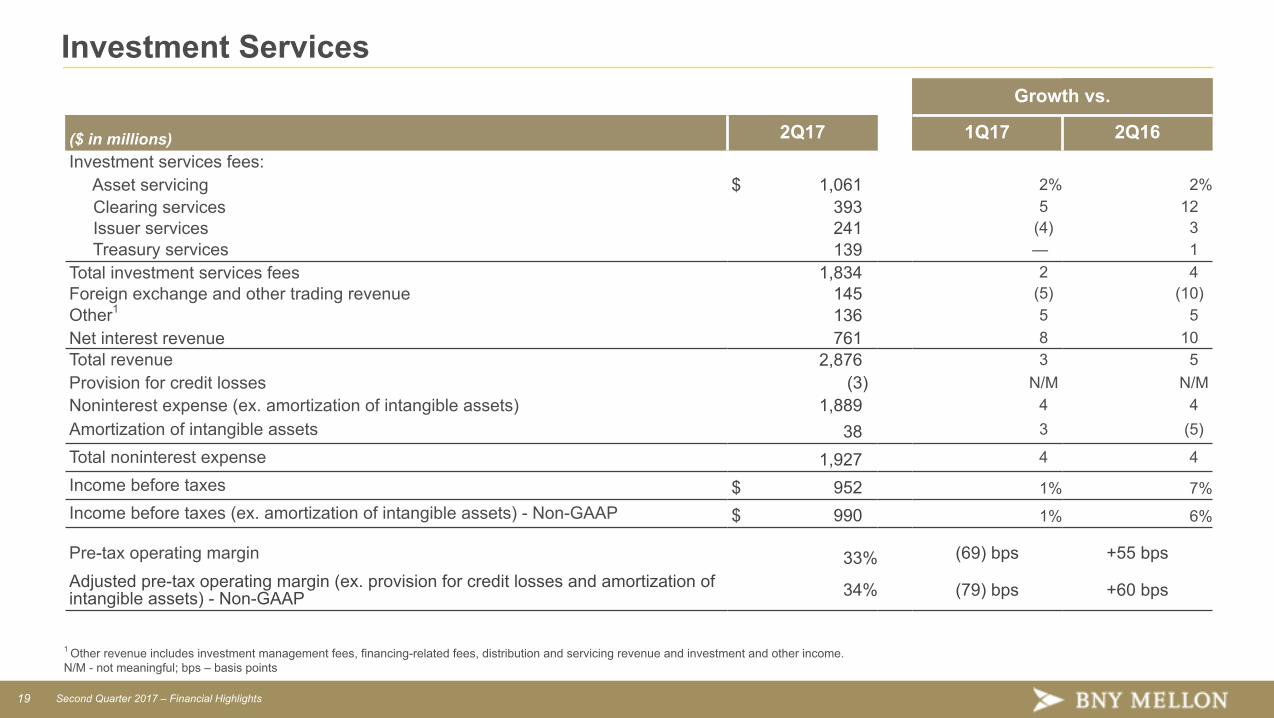
Investment Services Growth vs.
($ in millions) 2Q17 1Q17 2Q16Investment services fees: Asset servicing $ 1,061 2% 2% Clearing services 393 5 12 Issuer services 241 (4) 3 Treasury services 139 — 1Total investment services fees 1,834 2 4Foreign exchange and other trading revenue 145 (5) (10)Other1 136 5 5Net interest revenue 761 8 10Total revenue 2,876 3 5Provision for credit losses (3) N/M N/MNoninterest expense (ex. amortization of intangible assets) 1,889 4 4Amortization of intangible assets 38 3 (5)
Total noninterest expense 1,927 4 4
Income before taxes $ 952 1% 7%Income before taxes (ex. amortization of intangible assets) - Non-GAAP $ 990 1% 6%
Pre-tax operating margin 33% (69) bps +55 bpsAdjusted pre-tax operating margin (ex. provision for credit losses and amortization ofintangible assets) - Non-GAAP 34% (79) bps +60 bps
1 Other revenue includes investment management fees, financing-related fees, distribution and servicing revenue and investment and other income.N/M - not meaningful; bps – basis points
20 Second Quarter 2017 – Financial Highlights
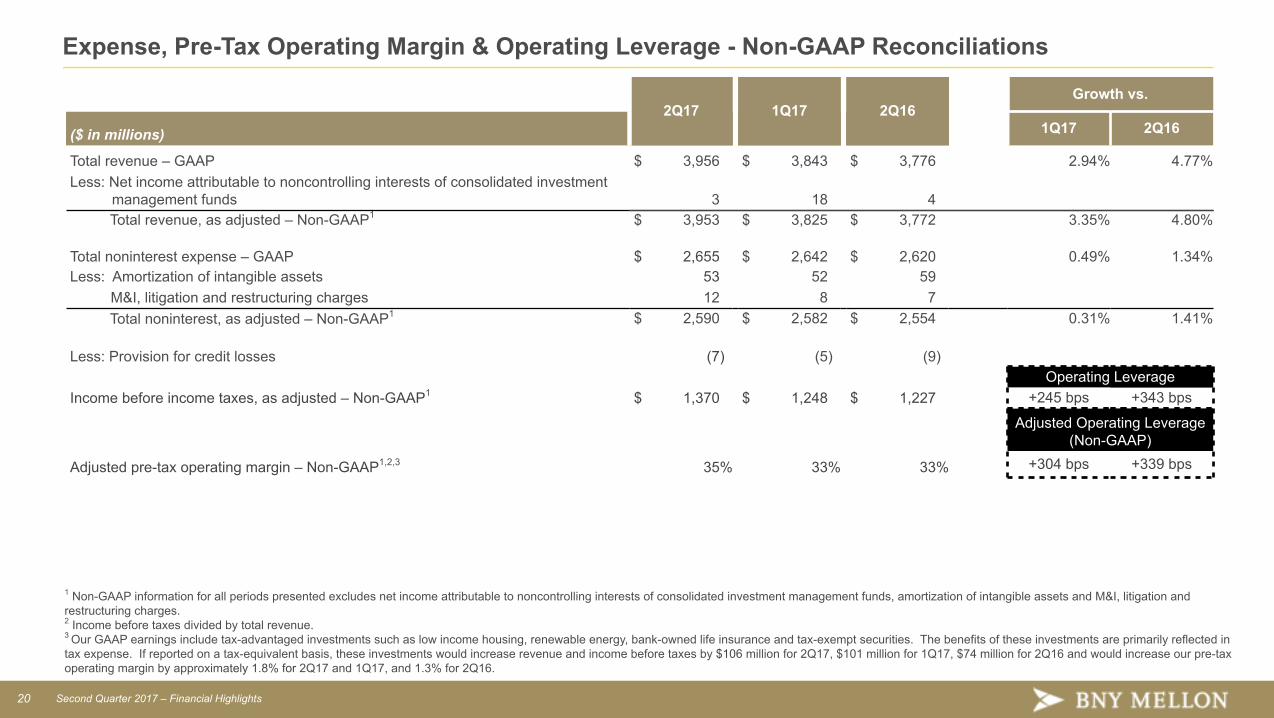
Expense, Pre-Tax Operating Margin & Operating Leverage - Non-GAAP Reconciliations
2Q17 1Q17 2Q16Growth vs.
($ in millions) 1Q17 2Q16
Total revenue – GAAP $ 3,956 $ 3,843 $ 3,776 2.94% 4.77%Less: Net income attributable to noncontrolling interests of consolidated investment
management funds 3 18 4Total revenue, as adjusted – Non-GAAP1 $ 3,953 $ 3,825 $ 3,772 3.35% 4.80%
Total noninterest expense – GAAP $ 2,655 $ 2,642 $ 2,620 0.49% 1.34%Less: Amortization of intangible assets 53 52 59 M&I, litigation and restructuring charges 12 8 7
Total noninterest, as adjusted – Non-GAAP1 $ 2,590 $ 2,582 $ 2,554 0.31% 1.41%
Less: Provision for credit losses (7) (5) (9)Operating Leverage
Income before income taxes, as adjusted – Non-GAAP1 $ 1,370 $ 1,248 $ 1,227 +245 bps +343 bps
Adjusted Operating Leverage (Non-GAAP)
Adjusted pre-tax operating margin – Non-GAAP1,2,3 35% 33% 33% +304 bps +339 bps
1 Non-GAAP information for all periods presented excludes net income attributable to noncontrolling interests of consolidated investment management funds, amortization of intangible assets and M&I, litigation andrestructuring charges. 2 Income before taxes divided by total revenue.3 Our GAAP earnings include tax-advantaged investments such as low income housing, renewable energy, bank-owned life insurance and tax-exempt securities. The benefits of these investments are primarily reflected intax expense. If reported on a tax-equivalent basis, these investments would increase revenue and income before taxes by $106 million for 2Q17, $101 million for 1Q17, $74 million for 2Q16 and would increase our pre-taxoperating margin by approximately 1.8% for 2Q17 and 1Q17, and 1.3% for 2Q16.
21 Second Quarter 2017 – Financial Highlights
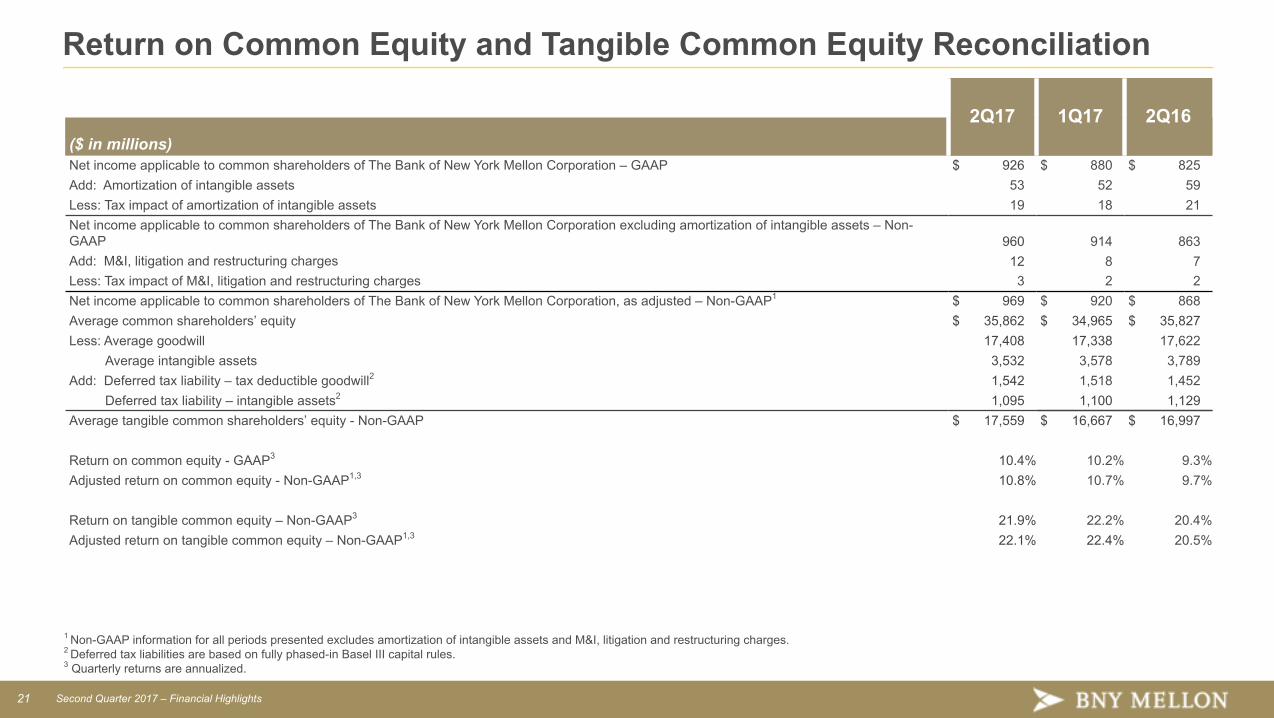
Return on Common Equity and Tangible Common Equity Reconciliation
2Q17 1Q17 2Q16($ in millions)Net income applicable to common shareholders of The Bank of New York Mellon Corporation – GAAP $ 926 $ 880 $ 825Add: Amortization of intangible assets 53 52 59Less: Tax impact of amortization of intangible assets 19 18 21Net income applicable to common shareholders of The Bank of New York Mellon Corporation excluding amortization of intangible assets – Non-GAAP 960 914 863Add: M&I, litigation and restructuring charges 12 8 7Less: Tax impact of M&I, litigation and restructuring charges 3 2 2Net income applicable to common shareholders of The Bank of New York Mellon Corporation, as adjusted – Non-GAAP1 $ 969 $ 920 $ 868Average common shareholders’ equity $ 35,862 $ 34,965 $ 35,827Less: Average goodwill 17,408 17,338 17,622
Average intangible assets 3,532 3,578 3,789Add: Deferred tax liability – tax deductible goodwill2 1,542 1,518 1,452
Deferred tax liability – intangible assets2 1,095 1,100 1,129Average tangible common shareholders’ equity - Non-GAAP $ 17,559 $ 16,667 $ 16,997
Return on common equity - GAAP3 10.4% 10.2% 9.3%Adjusted return on common equity - Non-GAAP1,3 10.8% 10.7% 9.7%
Return on tangible common equity – Non-GAAP3 21.9% 22.2% 20.4%Adjusted return on tangible common equity – Non-GAAP1,3 22.1% 22.4% 20.5%
1 Non-GAAP information for all periods presented excludes amortization of intangible assets and M&I, litigation and restructuring charges. 2 Deferred tax liabilities are based on fully phased-in Basel III capital rules.3 Quarterly returns are annualized.
22 Second Quarter 2017 – Financial Highlights
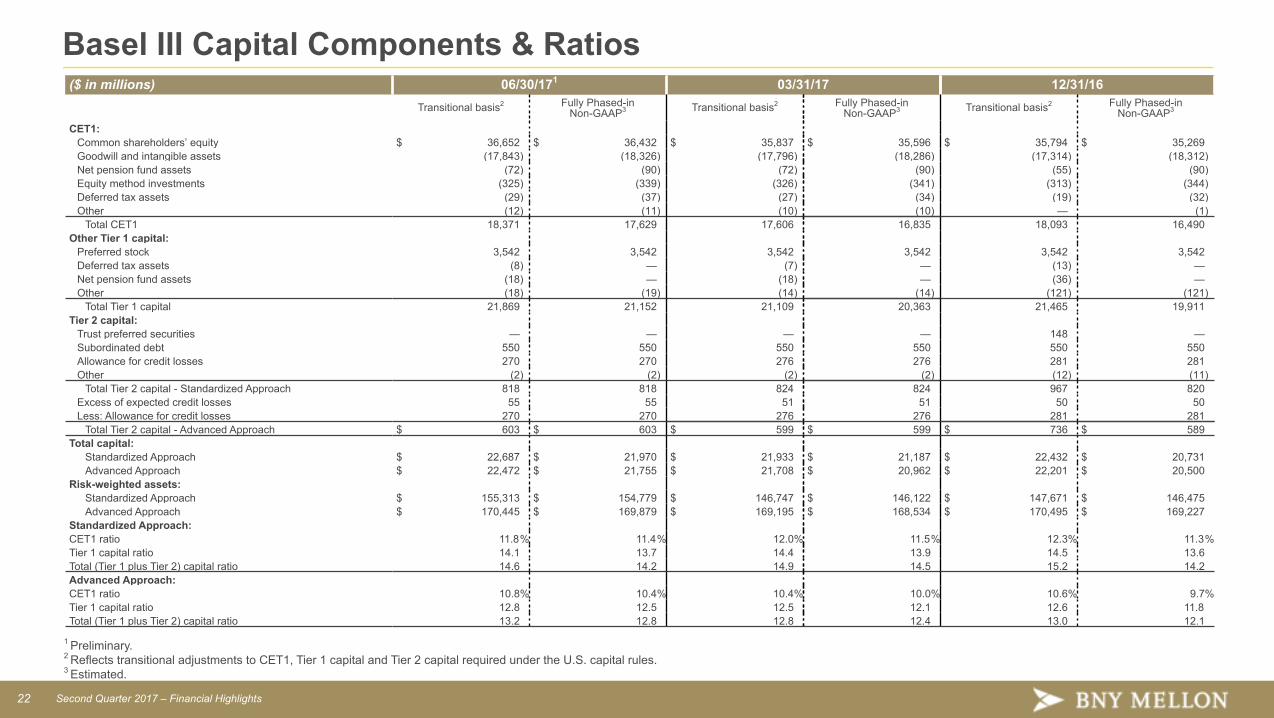
Basel III Capital Components & Ratios
1 Preliminary.2 Reflects transitional adjustments to CET1, Tier 1 capital and Tier 2 capital required under the U.S. capital rules. 3 Estimated.
($ in millions) 06/30/171 03/31/17 12/31/16Transitional basis2 Fully Phased-in
Non-GAAP3 Transitional basis2 Fully Phased-inNon-GAAP3 Transitional basis2 Fully Phased-in
Non-GAAP3
CET1:Common shareholders’ equity $ 36,652 $ 36,432 $ 35,837 $ 35,596 $ 35,794 $ 35,269Goodwill and intangible assets (17,843) (18,326) (17,796) (18,286) (17,314) (18,312)Net pension fund assets (72) (90) (72) (90) (55) (90)Equity method investments (325) (339) (326) (341) (313) (344)Deferred tax assets (29) (37) (27) (34) (19) (32)Other (12) (11) (10) (10) — (1)
Total CET1 18,371 17,629 17,606 16,835 18,093 16,490Other Tier 1 capital:
Preferred stock 3,542 3,542 3,542 3,542 3,542 3,542Deferred tax assets (8) — (7) — (13) —Net pension fund assets (18) — (18) — (36) —Other (18) (19) (14) (14) (121) (121)
Total Tier 1 capital 21,869 21,152 21,109 20,363 21,465 19,911Tier 2 capital:
Trust preferred securities — — — — 148 —Subordinated debt 550 550 550 550 550 550Allowance for credit losses 270 270 276 276 281 281Other (2) (2) (2) (2) (12) (11)
Total Tier 2 capital - Standardized Approach 818 818 824 824 967 820Excess of expected credit losses 55 55 51 51 50 50Less: Allowance for credit losses 270 270 276 276 281 281
Total Tier 2 capital - Advanced Approach $ 603 $ 603 $ 599 $ 599 $ 736 $ 589Total capital:
Standardized Approach $ 22,687 $ 21,970 $ 21,933 $ 21,187 $ 22,432 $ 20,731Advanced Approach $ 22,472 $ 21,755 $ 21,708 $ 20,962 $ 22,201 $ 20,500
Risk-weighted assets:Standardized Approach $ 155,313 $ 154,779 $ 146,747 $ 146,122 $ 147,671 $ 146,475Advanced Approach $ 170,445 $ 169,879 $ 169,195 $ 168,534 $ 170,495 $ 169,227
Standardized Approach:CET1 ratio 11.8% 11.4% 12.0% 11.5% 12.3% 11.3%Tier 1 capital ratio 14.1 13.7 14.4 13.9 14.5 13.6Total (Tier 1 plus Tier 2) capital ratio 14.6 14.2 14.9 14.5 15.2 14.2Advanced Approach:CET1 ratio 10.8% 10.4% 10.4% 10.0% 10.6% 9.7%Tier 1 capital ratio 12.8 12.5 12.5 12.1 12.6 11.8Total (Tier 1 plus Tier 2) capital ratio 13.2 12.8 12.8 12.4 13.0 12.1
23 Second Quarter 2017 – Financial Highlights
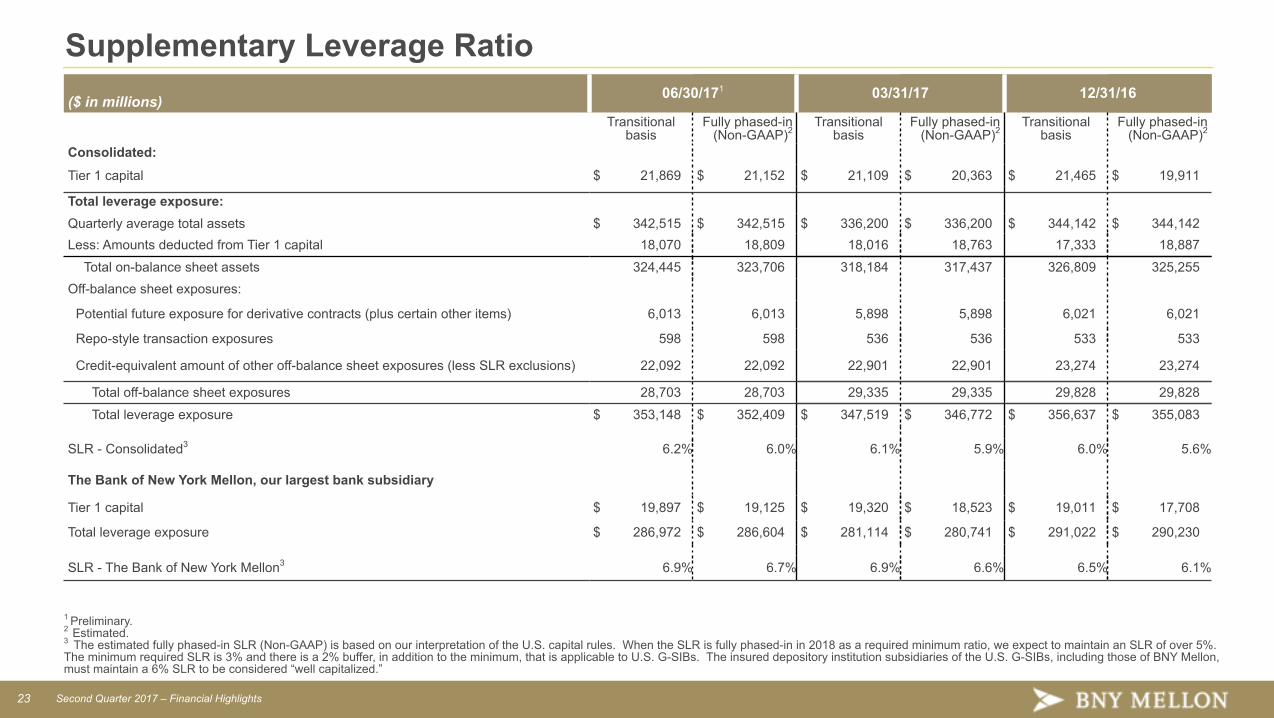
Supplementary Leverage Ratio($ in millions) 06/30/171 03/31/17 12/31/16
Transitionalbasis
Fully phased-in(Non-GAAP)2
Transitionalbasis
Fully phased-in(Non-GAAP)2
Transitionalbasis
Fully phased-in(Non-GAAP)2
Consolidated:
Tier 1 capital $ 21,869 $ 21,152 $ 21,109 $ 20,363 $ 21,465 $ 19,911
Total leverage exposure:Quarterly average total assets $ 342,515 $ 342,515 $ 336,200 $ 336,200 $ 344,142 $ 344,142Less: Amounts deducted from Tier 1 capital 18,070 18,809 18,016 18,763 17,333 18,887
Total on-balance sheet assets 324,445 323,706 318,184 317,437 326,809 325,255Off-balance sheet exposures:
Potential future exposure for derivative contracts (plus certain other items) 6,013 6,013 5,898 5,898 6,021 6,021
Repo-style transaction exposures 598 598 536 536 533 533
Credit-equivalent amount of other off-balance sheet exposures (less SLR exclusions) 22,092 22,092 22,901 22,901 23,274 23,274
Total off-balance sheet exposures 28,703 28,703 29,335 29,335 29,828 29,828
Total leverage exposure $ 353,148 $ 352,409 $ 347,519 $ 346,772 $ 356,637 $ 355,083
SLR - Consolidated3 6.2% 6.0% 6.1% 5.9% 6.0% 5.6%
The Bank of New York Mellon, our largest bank subsidiary
Tier 1 capital $ 19,897 $ 19,125 $ 19,320 $ 18,523 $ 19,011 $ 17,708
Total leverage exposure $ 286,972 $ 286,604 $ 281,114 $ 280,741 $ 291,022 $ 290,230
SLR - The Bank of New York Mellon3 6.9% 6.7% 6.9% 6.6% 6.5% 6.1%
1 Preliminary.2 Estimated.3 The estimated fully phased-in SLR (Non-GAAP) is based on our interpretation of the U.S. capital rules. When the SLR is fully phased-in in 2018 as a required minimum ratio, we expect to maintain an SLR of over 5%.The minimum required SLR is 3% and there is a 2% buffer, in addition to the minimum, that is applicable to U.S. G-SIBs. The insured depository institution subsidiaries of the U.S. G-SIBs, including those of BNY Mellon,must maintain a 6% SLR to be considered “well capitalized.”

24 Second Quarter 2017 – Financial Highlights
Investment Management Pre-Tax Operating Margin - Non-GAAP ReconciliationPre-tax operating margin 2Q17 1Q17 2Q16($ in millions)Income before income taxes – GAAP $ 288 $ 277 $ 234Add: Amortization of intangible assets 15 15 19 Provision for credit losses — 3 1Adjusted income before income taxes excluding amortization of intangible assets and provision for credit losses – Non-GAAP $ 303 $ 295 $ 254
Total revenue – GAAP $ 986 $ 963 $ 938Less: Distribution and servicing expense 104 101 102Adjusted total revenue net of distribution and servicing expense - Non-GAAP $ 882 $ 862 $ 836
Pre-tax operating margin - GAAP1 29% 29% 25%Adjusted pre-tax operating margin, excluding amortization of intangible assets, provision for credit losses and distribution andservicing expense – Non-GAAP1 34% 34% 30%
1 Income before taxes divided by total revenue.
Investment Management and Performance Fees - Non-GAAP ReconciliationGrowth vs.
($ in millions) 2Q17 2Q16 2Q16Investment management and performance fees - GAAP $ 879 $ 830 6%Impact of changes in foreign currency exchange rates — (26)Investment management and performance fees, as adjusted - Non-GAAP $ 879 $ 804 9%