Quantifying Stripe Rust Reaction in Wheat Using Remote Sensing Based Hand-held NDVI Sensor
28
Quantifying stripe rust reaction in wheat using remote sensing based hand held NDVI sensor Apoorva Arora Directorate of Wheat Research, Karnal
-
Upload
borlaug-global-rust-initiative -
Category
Education
-
view
694 -
download
2
description
Apoorva Arora
Transcript of Quantifying Stripe Rust Reaction in Wheat Using Remote Sensing Based Hand-held NDVI Sensor
Quantifying stripe rust reaction in wheat using remote sensing based
hand held NDVI sensor
Apoorva Arora Directorate of Wheat Research, Karnal
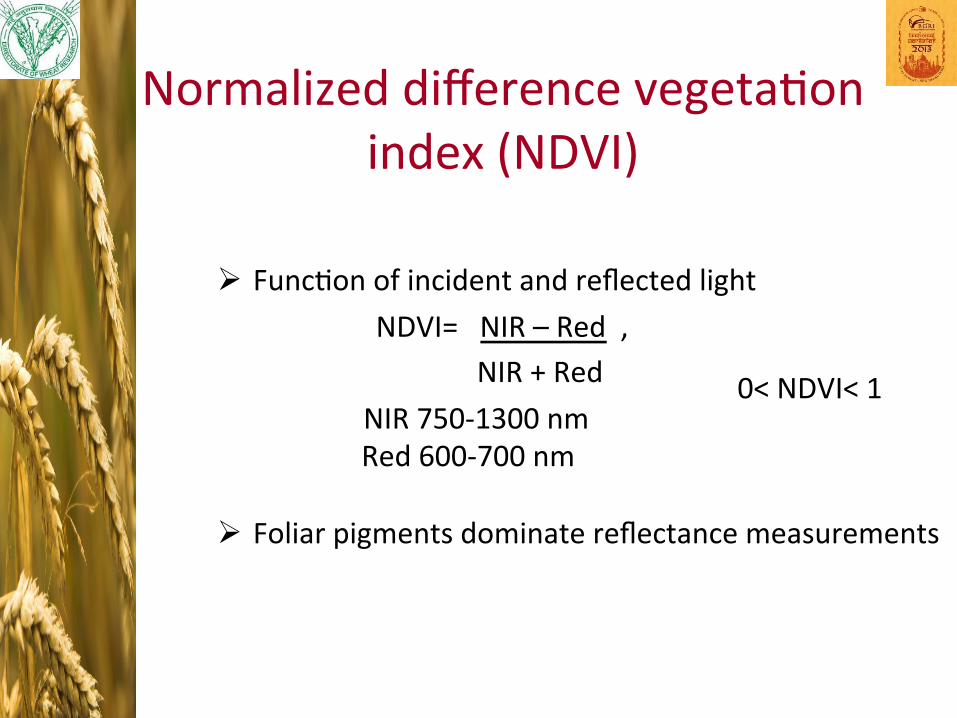
Normalized difference vegeta2on index (NDVI)
Ø Func2on of incident and reflected light NDVI= NIR – Red , NIR + Red NIR 750-‐1300 nm
Red 600-‐700 nm Ø Foliar pigments dominate reflectance measurements
0< NDVI< 1
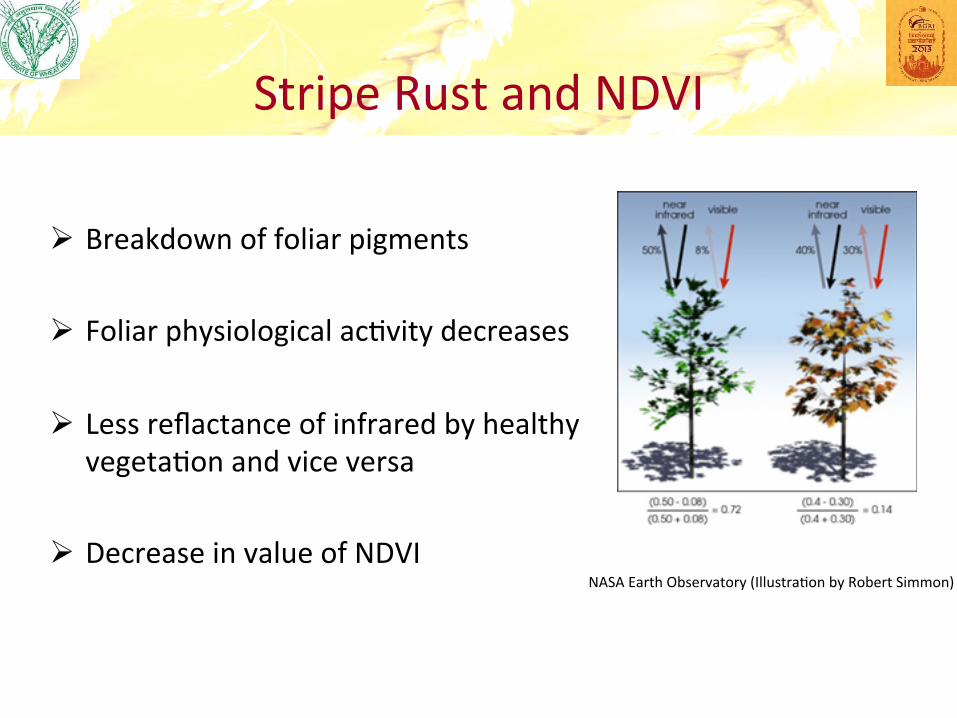
Stripe Rust and NDVI
Ø Breakdown of foliar pigments
Ø Foliar physiological ac2vity decreases
Ø Less reflactance of infrared by healthy vegeta2on and vice versa
Ø Decrease in value of NDVI
NASA Earth Observatory (Illustra2on by Robert Simmon)

Why NDVI
Ø Most sensors provide measurements in NIR & Red por2on of spectrum
Ø Addi2ve gene governed rust resistance geZng more a[en2on than ever before
Ø Minor varia2ons can be captured by quan2ta2ve varia2on
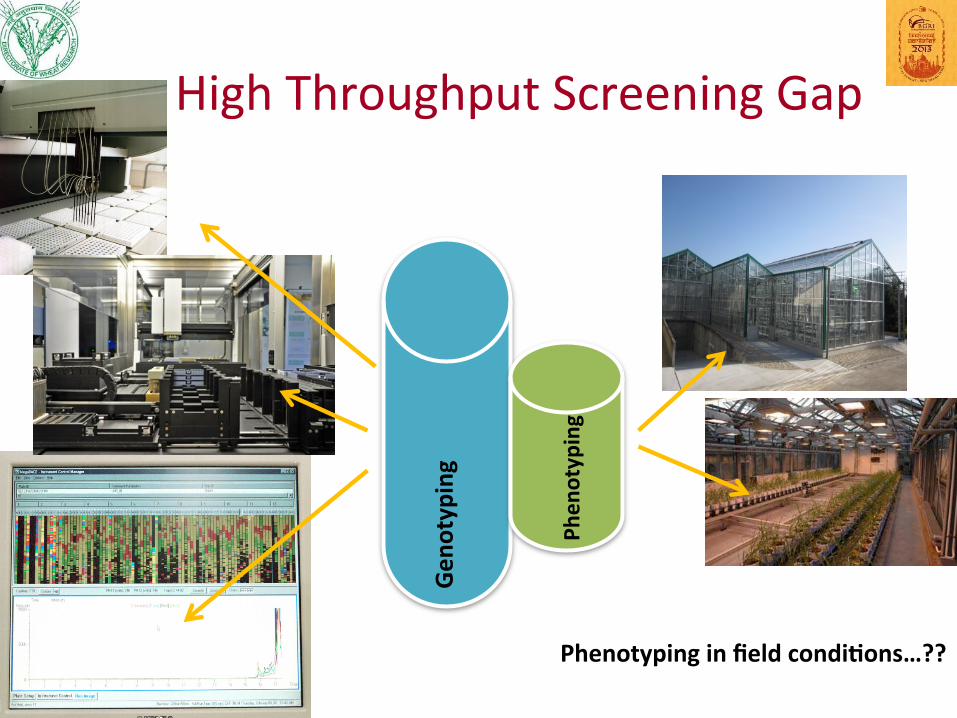
High Throughput Screening Gap
Phen
otyping
Gen
otyping
Phenotyping in field condi1ons…??
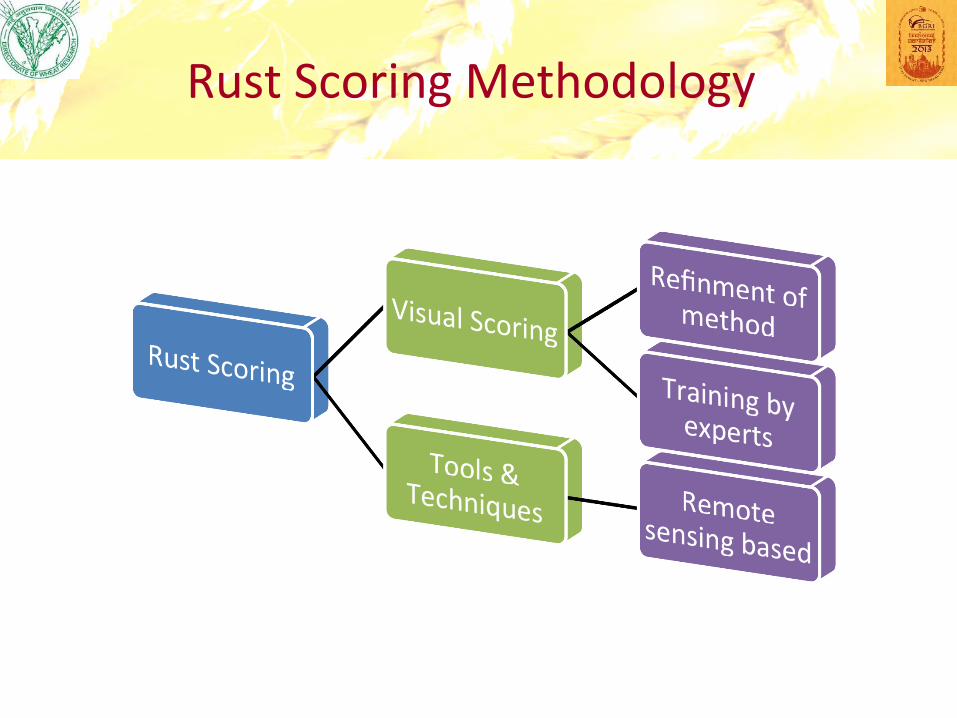
Rust Scoring Methodology
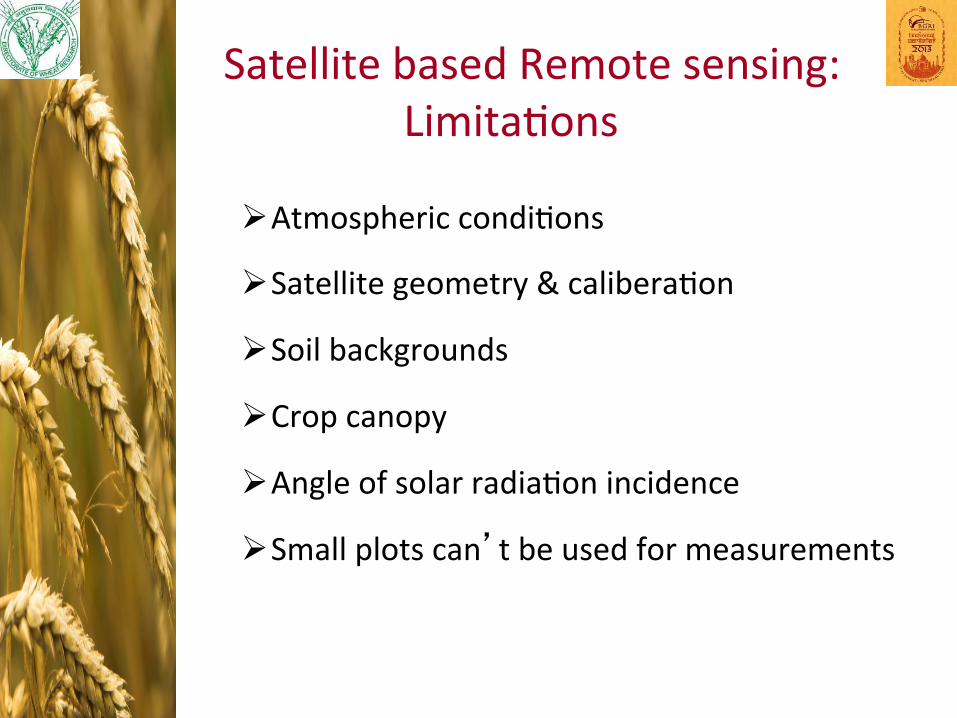
Satellite based Remote sensing: Limita2ons
Ø Atmospheric condi2ons
Ø Satellite geometry & calibera2on
Ø Soil backgrounds
Ø Crop canopy
Ø Angle of solar radia2on incidence
Ø Small plots can’t be used for measurements
Objec2ve
.
Quantifying stripe rust reaction in wheat using remote sensing based
hand held NDVI sensor
Research Methodology
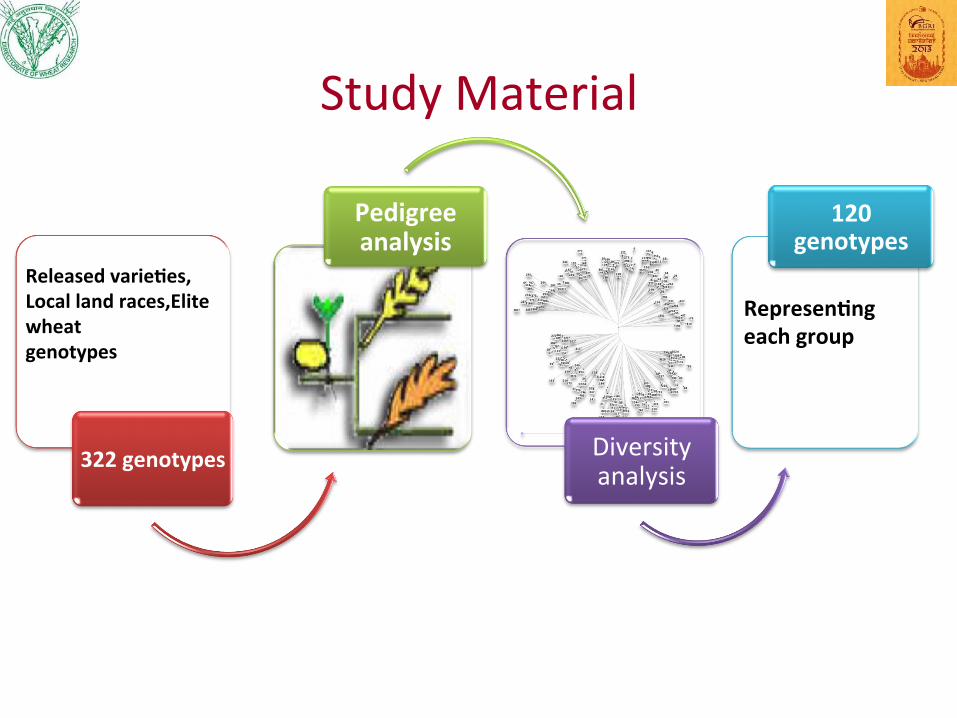
Study Material
322 genotypes
Pedigree analysis
Diversity analysis
120 genotypes
Released varie1es, Local land races,Elite wheat genotypes
Represen1ng each group
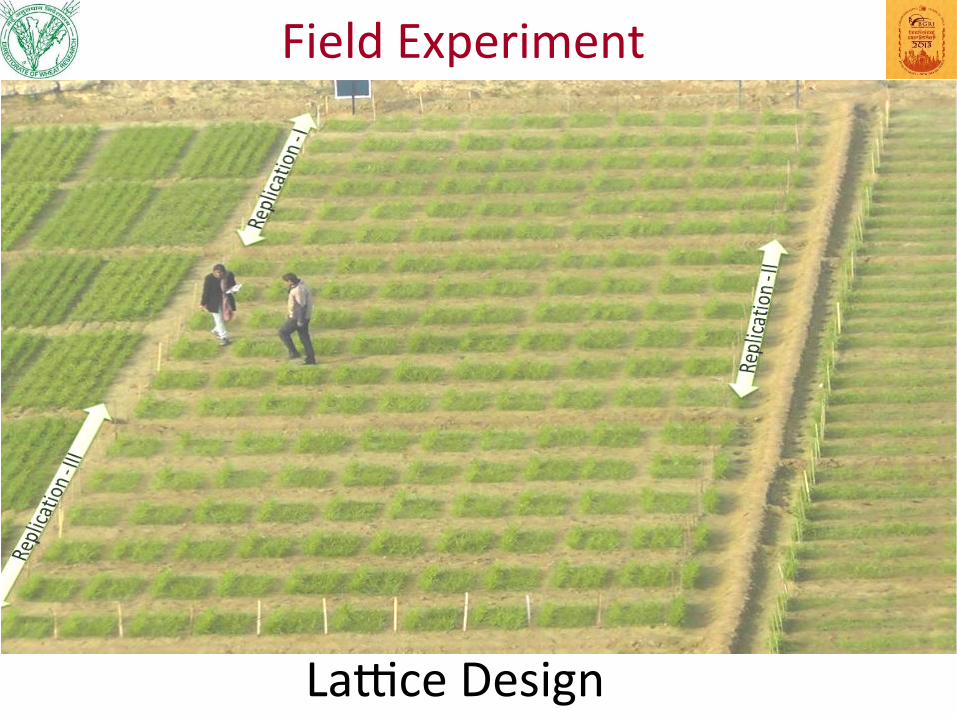
Field Experiment
LaZce Design
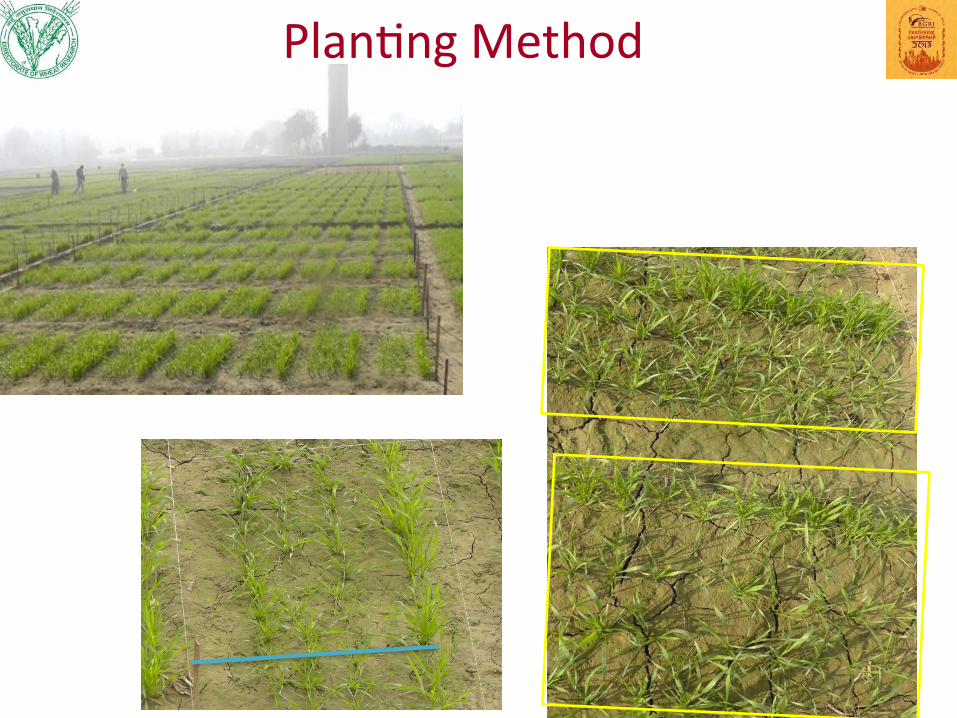
Plan2ng Method
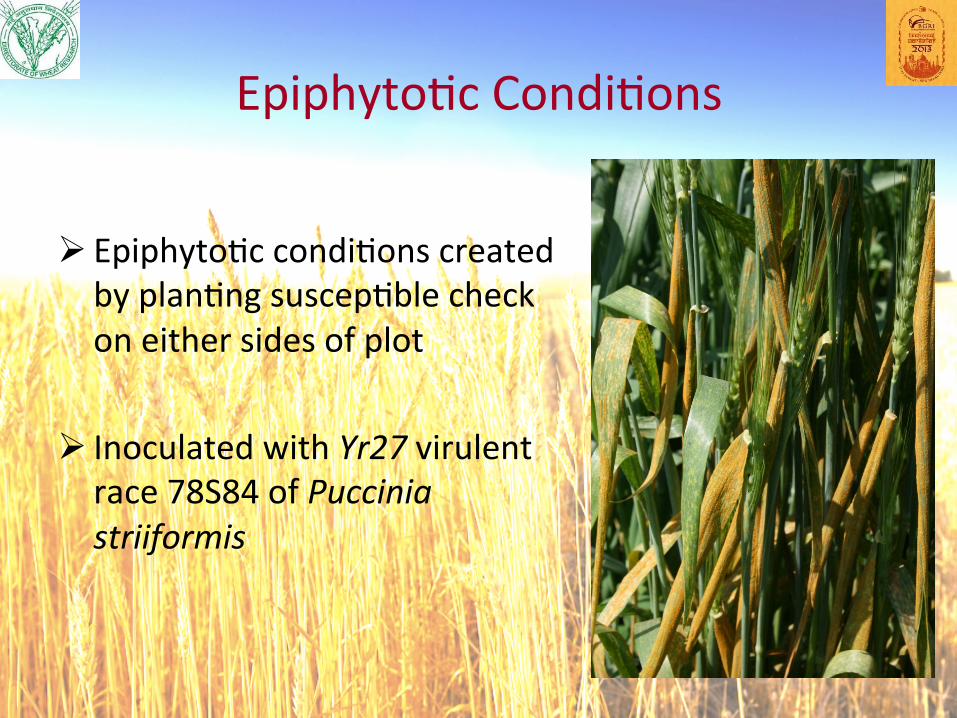
Epiphyto2c Condi2ons
Ø Epiphyto2c condi2ons created by plan2ng suscep2ble check on either sides of plot
Ø Inoculated with Yr27 virulent race 78S84 of Puccinia striiformis
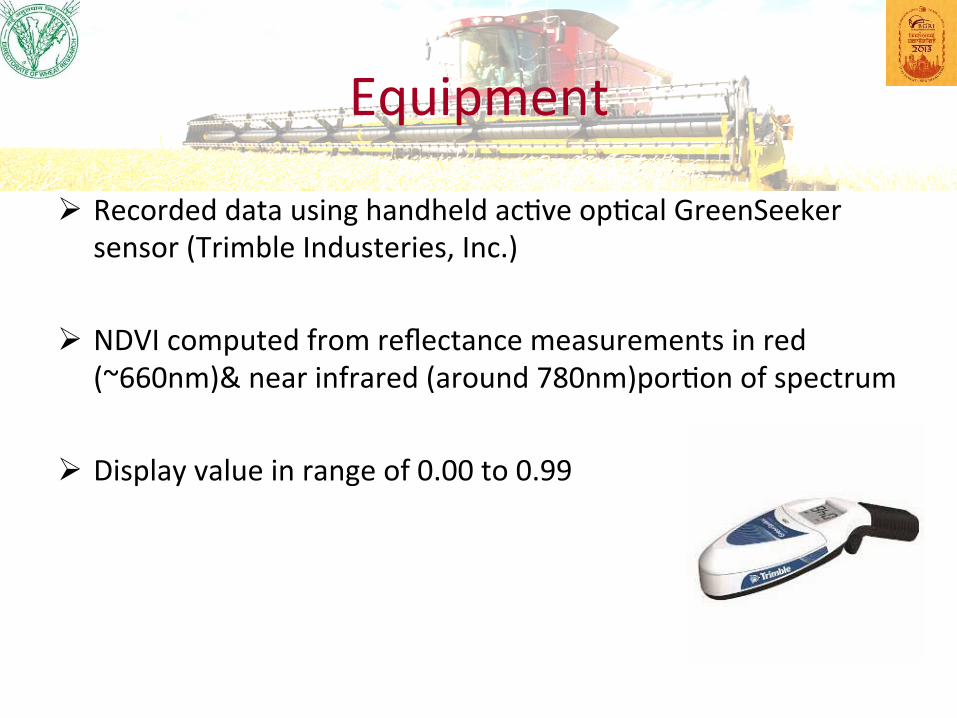
Equipment
Ø Recorded data using handheld ac2ve op2cal GreenSeeker
sensor (Trimble Industeries, Inc.) Ø NDVI computed from reflectance measurements in red
(~660nm)& near infrared (around 780nm)por2on of spectrum Ø Display value in range of 0.00 to 0.99
RESULTS
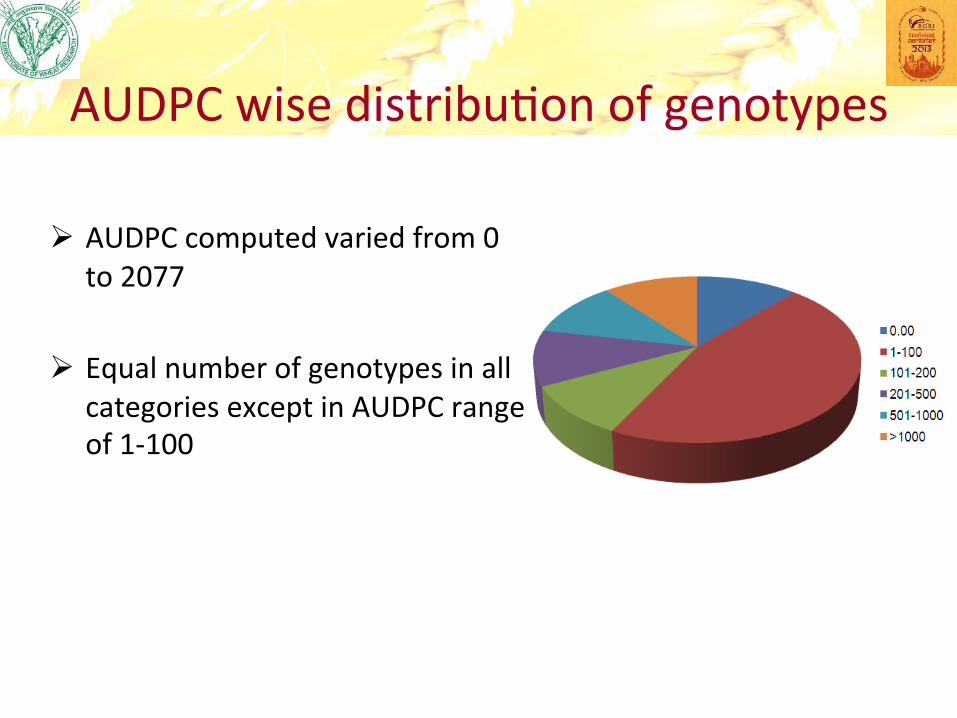
AUDPC wise distribu2on of genotypes
Ø AUDPC computed varied from 0 to 2077
Ø Equal number of genotypes in all categories except in AUDPC range of 1-‐100
NDVI
Ø Recorded when crop showed symptoms of maximum infec2on
Ø Value of NDVI varied from 0.46 to 0.69 Ø Mean values across different AUDPC range: 0.58 to 0.69
Ø Value reduced with increase in incidence of disease
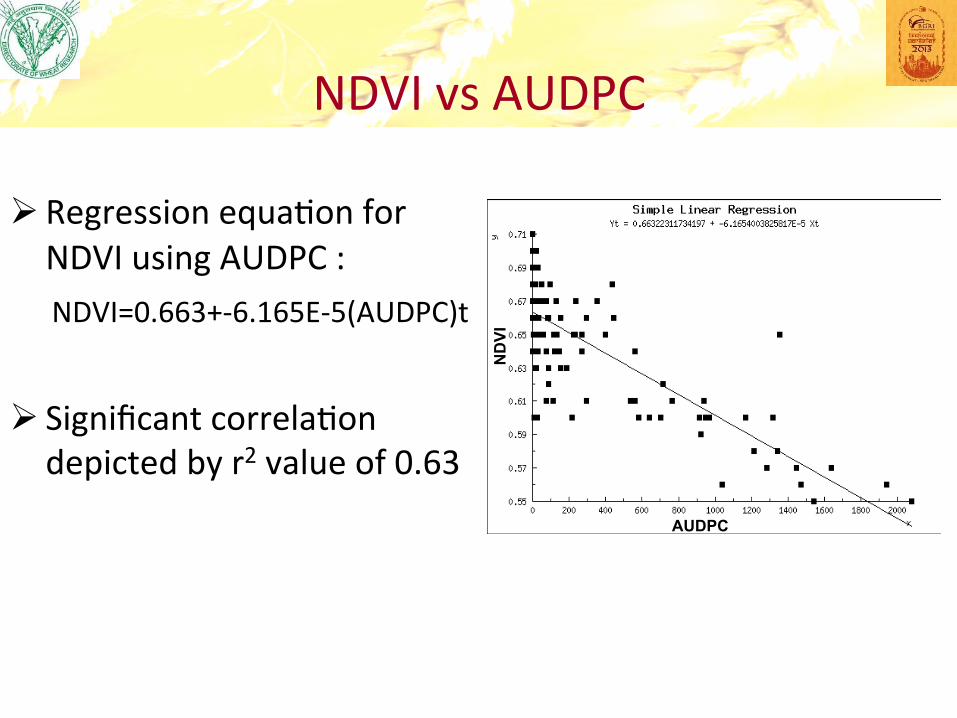
NDVI vs AUDPC
Ø Regression equa2on for NDVI using AUDPC :
NDVI=0.663+-‐6.165E-‐5(AUDPC)t Ø Significant correla2on depicted by r2 value of 0.63
ND
VI
AUDPC
Effect of Spot Blotch
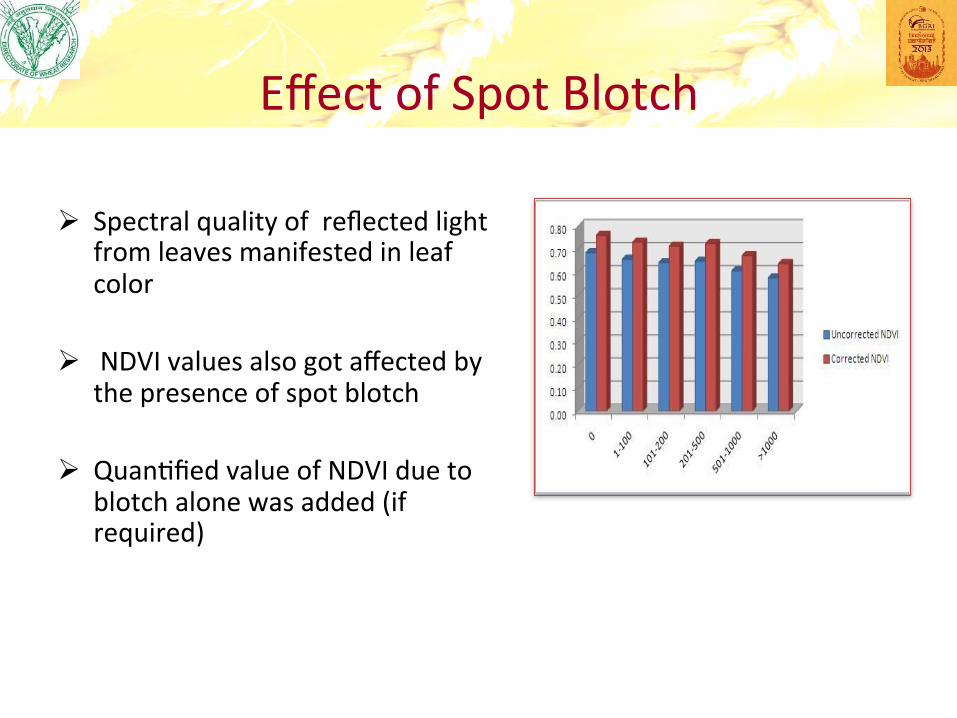
Ø Spectral quality of reflected light from leaves manifested in leaf color
Ø NDVI values also got affected by
the presence of spot blotch
Ø Quan2fied value of NDVI due to blotch alone was added (if required)
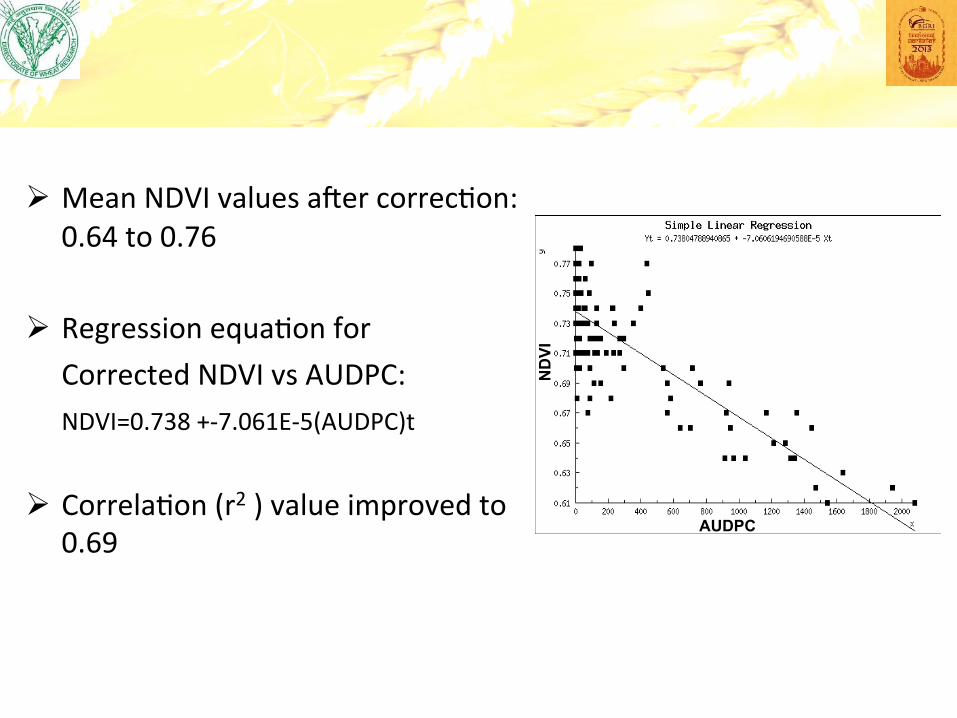
Ø Mean NDVI values amer correc2on: 0.64 to 0.76
Ø Regression equa2on for Corrected NDVI vs AUDPC: NDVI=0.738 +-‐7.061E-‐5(AUDPC)t
Ø Correla2on (r2 ) value improved to 0.69
ND
VI
AUDPC
Plant physiological factors AUDPC
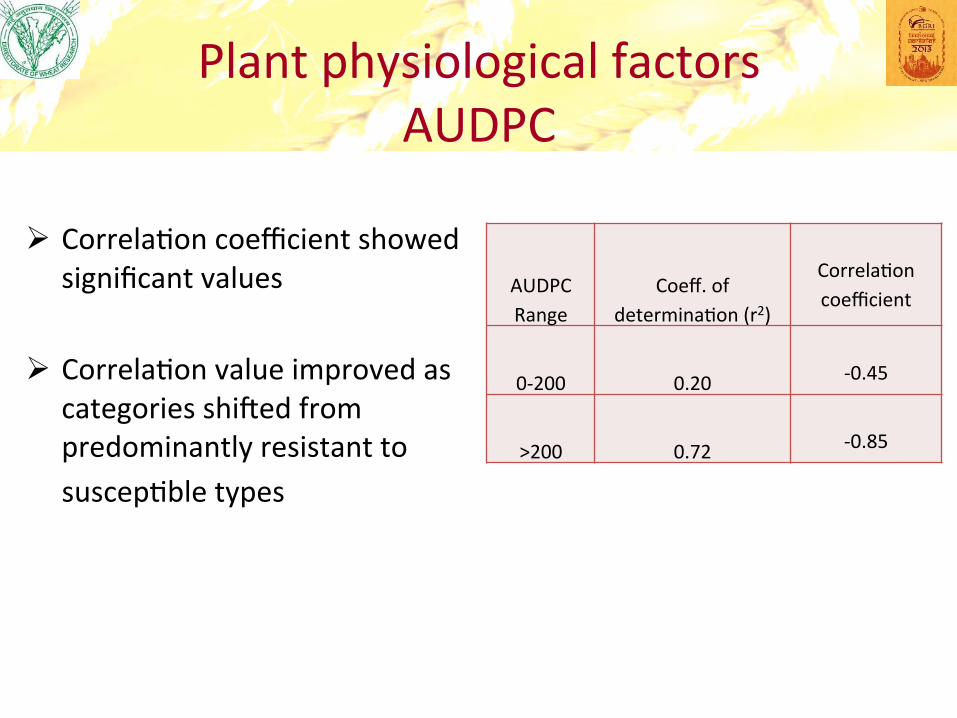
Ø Correla2on coefficient showed
significant values
Ø Correla2on value improved as categories shimed from predominantly resistant to
suscep2ble types
AUDPC Range
Coeff. of determina2on (r2)
Correla2on coefficient
0-‐200 0.20
-‐0.45
>200 0.72
-‐0.85
Plant Height
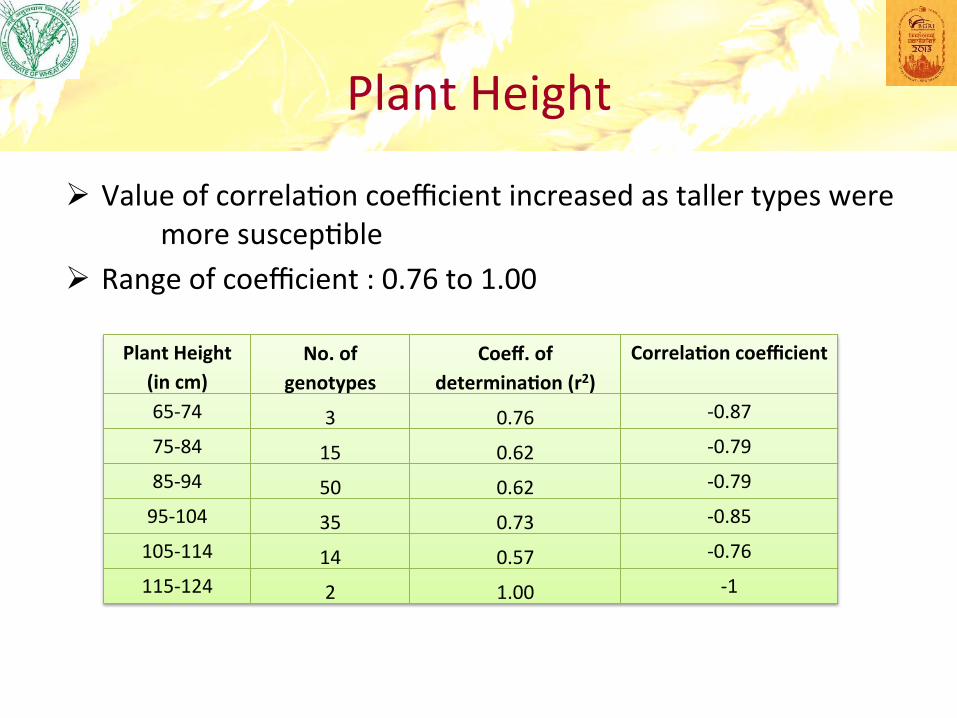
Plant Height (in cm)
No. of genotypes
Coeff. of determina1on (r2)
Correla1on coefficient
65-‐74 3 0.76 -‐0.87
75-‐84 15 0.62 -‐0.79
85-‐94 50 0.62 -‐0.79
95-‐104 35 0.73 -‐0.85
105-‐114 14 0.57 -‐0.76
115-‐124 2 1.00 -‐1
Ø Value of correla2on coefficient increased as taller types were more suscep2ble
Ø Range of coefficient : 0.76 to 1.00
Ø Similar value of correla2on coefficient obtained
Ø No significant difference between categories was no2ced
Waxiness and Early Growth Habit
Conclusion
Ø With increasing a[en2on towards quan2ta2ve rust resistance studies, innova2ve tools & techniques are needed
Ø NDVI sensor technique provides mean value of several images captured from the plot as against single frame observa2on by human eye
Ø High correla2on value indicates suitability of the instrument as an useful tool for accurate rust data recording
Ø Accuracy of this method improves when catagoriza2on of
genotypes accrued to predominance of susep2bility
Inspiration behind work…
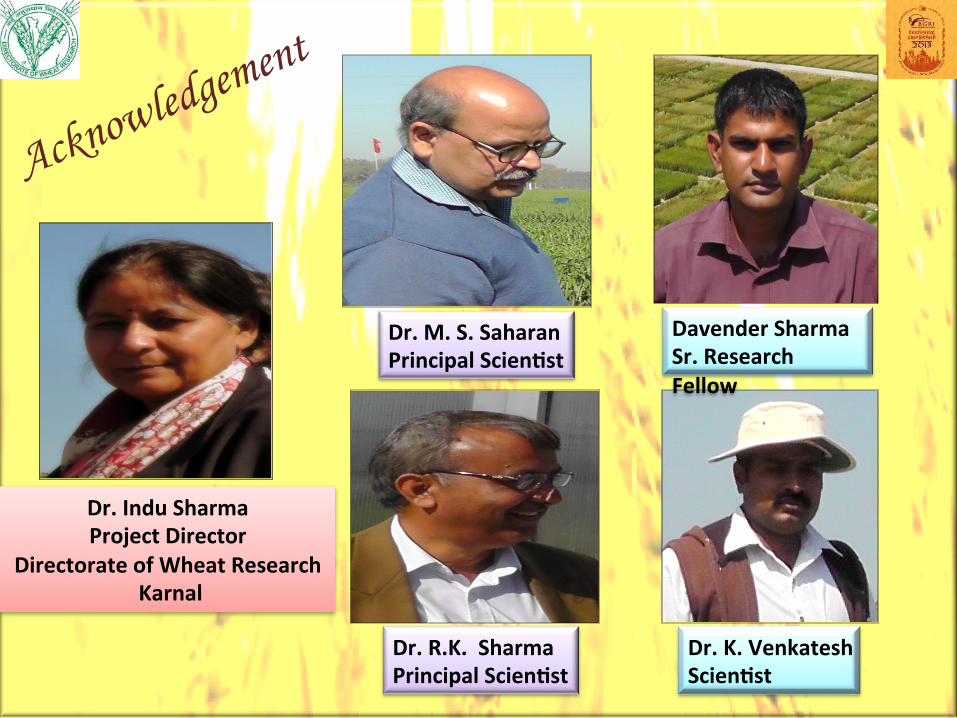
Dr. Indu Sharma Project Director
Directorate of Wheat Research Karnal
Dr. M. S. Saharan Principal Scien1st
Dr. R.K. Sharma Principal Scien1st
Dr. K. Venkatesh Scien1st
Davender Sharma Sr. Research Fellow
Thank You