Quantifying and Achieving Shopper Marketing ROI -...
34
Quantifying and Achieving Shopper Marketing ROI - Case Studies Speakers Mike Pommer, VP Analytics, Genpact, Inc. Eric Nordquist, VP Analytics, Genpact, Inc. In this session, learn how other manufacturers have approached measuring the impact of Shopper Marketing programs, and incorporated the findings to improve utilization of spending
Transcript of Quantifying and Achieving Shopper Marketing ROI -...
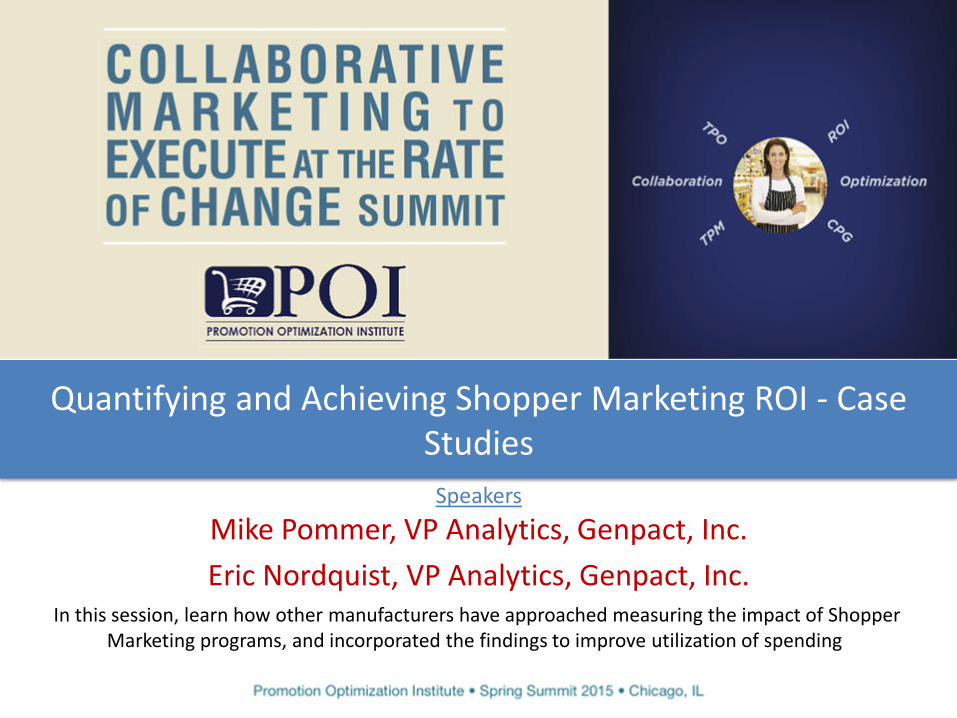
Quantifying and Achieving Shopper Marketing ROI - Case
Studies Speakers
Mike Pommer, VP Analytics, Genpact, Inc.
Eric Nordquist, VP Analytics, Genpact, Inc. In this session, learn how other manufacturers have approached measuring the impact of Shopper
Marketing programs, and incorporated the findings to improve utilization of spending
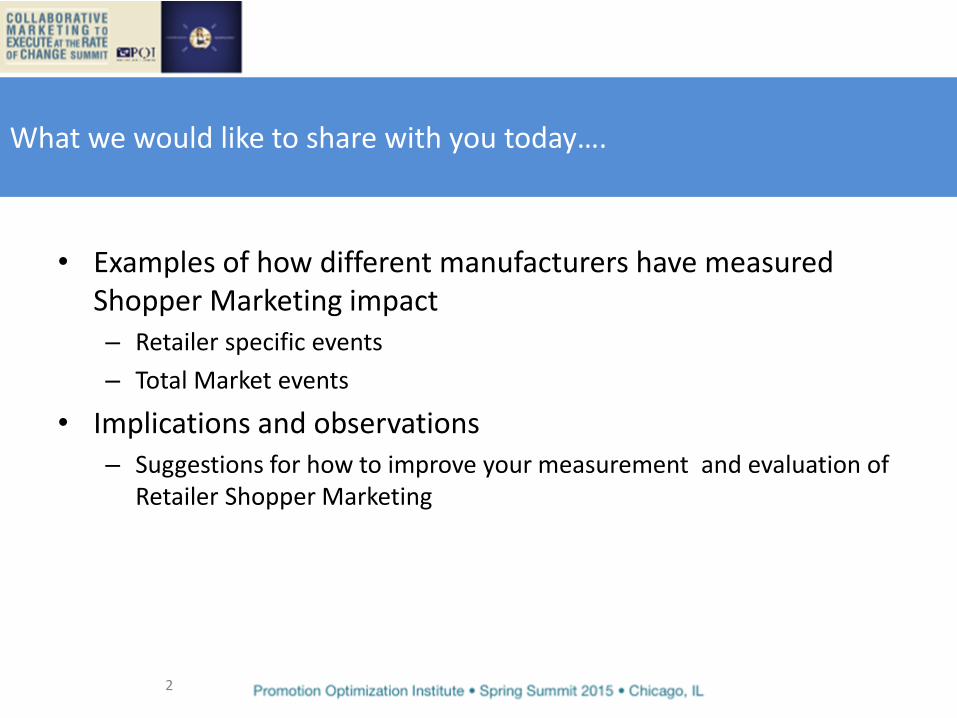
What we would like to share with you today….
• Examples of how different manufacturers have measured Shopper Marketing impact – Retailer specific events
– Total Market events
• Implications and observations – Suggestions for how to improve your measurement and evaluation of
Retailer Shopper Marketing
2
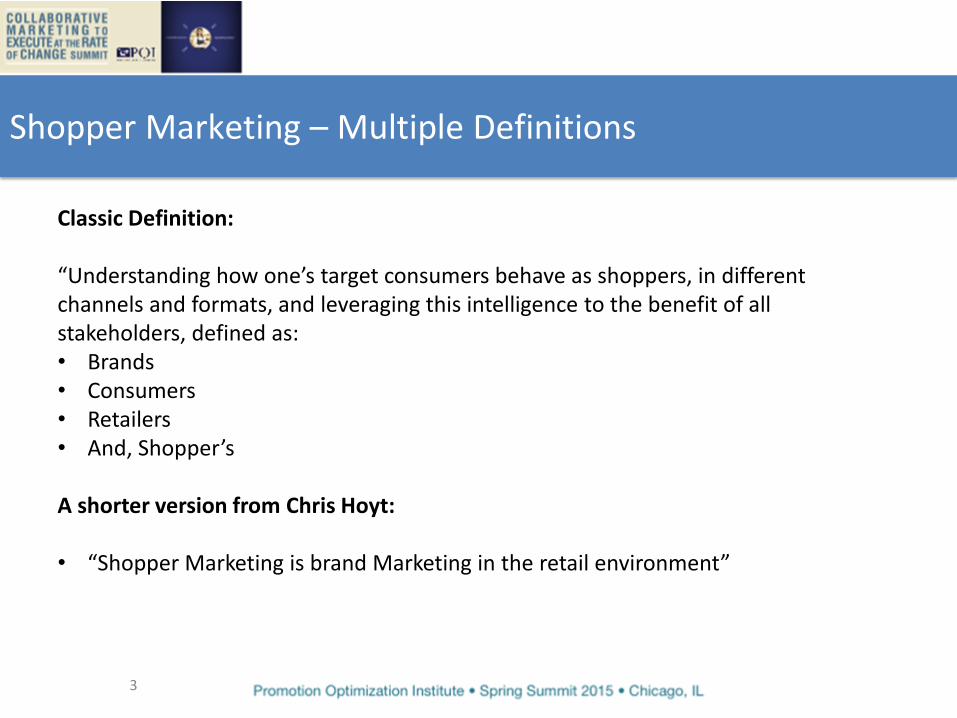
Shopper Marketing – Multiple Definitions
3
Classic Definition: “Understanding how one’s target consumers behave as shoppers, in different channels and formats, and leveraging this intelligence to the benefit of all stakeholders, defined as: • Brands • Consumers • Retailers • And, Shopper’s
A shorter version from Chris Hoyt: • “Shopper Marketing is brand Marketing in the retail environment”
Shopper Marketing – Trade Promotion Overlaps
4
Shopper Marketing Execution differs across the “marketing mix” Four P’s translation: • Product: Size, shape, color, material, package, package messages and graphics
• Price: Discounts, bundled offers, price communications, coupons
• Place: Store concept, lighting, shelves, and placement of special presentations
• Promotion: On-pack promotions, store promotions, special presentations, in-
store media (TV, shelf signage, cart signage, floor signage, etc.)
For today, we are focusing on price and promotion Shopper Marketing strategies/tactics.
Shopper Marketing Growth
5
• Growing part of manufacturer spending directed at building business with retail partners
• Recent study quoted by Supermarket News suggests that reported Shopper Marketing investment has doubled from 2012 – 2014 • Reported overall annual investment of $34 Billion in the US.
• With this level of spending, more importance to answer management
questions for: • Volume impact • Return on investment – payback versus alternatives

Case Studies and Examples
6
• Retailer Specific Shopper Marketing Programs
• Total Market Shopper Marketing Programs
6
Typically combined with “classic” trade promotion tactics
• Shorter term cycle (sell in to execution)
• Large number of events and tactics – Multi Buys
– Consumer coupons (digital, “classic” distribution)
– FSP tie – in’s
– In-store merchandising
– Demo’s
– Seasonal sponsorships
• Manufacturer Objectives – Volume lift
– Generate increased “shopper” occasions
– Meet manufacturer financial goals
Retailer Specific Shopper Marketing Promotions
7
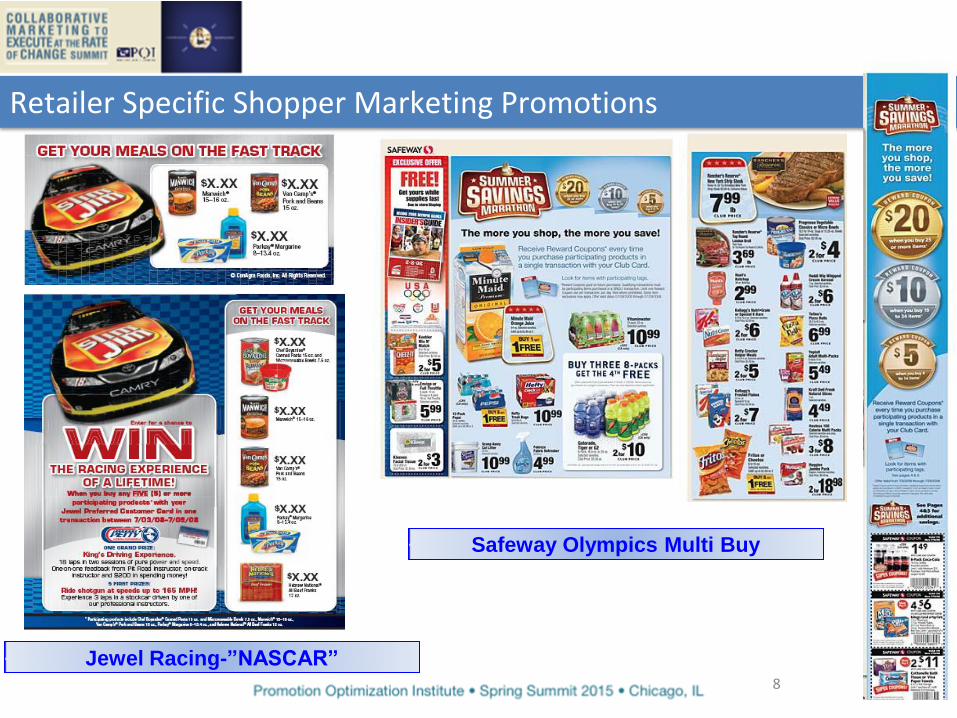
Retailer Shopper Marketing Promotions
Safeway Olympics Multi Buy
Jewel Racing-”NASCAR” 8
Retailer Specific Shopper Marketing Promotions
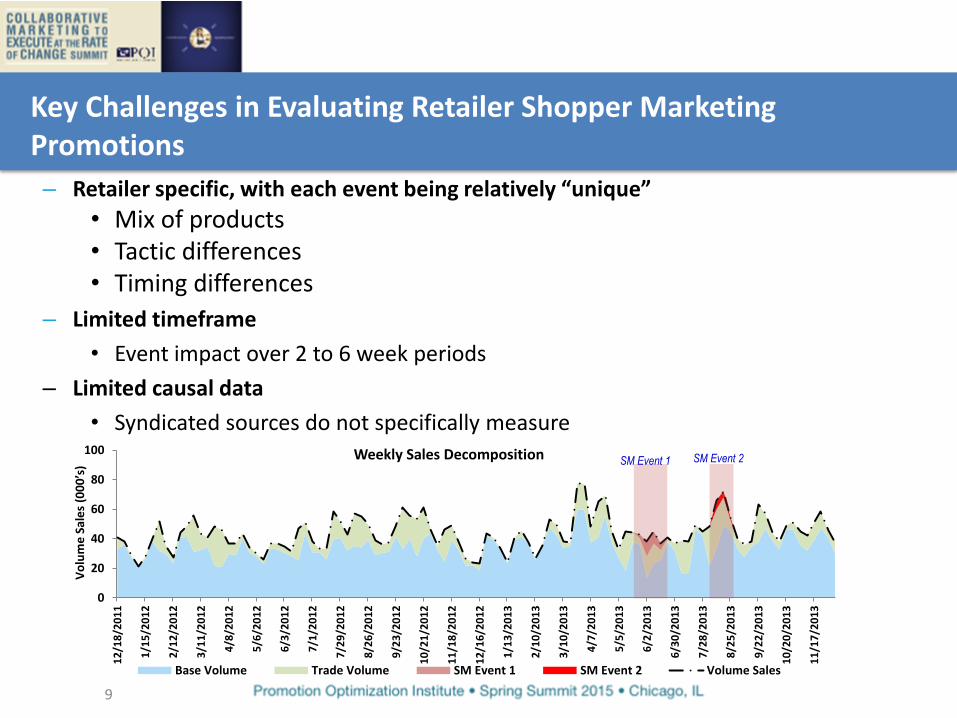
– Retailer specific, with each event being relatively “unique”
• Mix of products • Tactic differences • Timing differences
– Limited timeframe
• Event impact over 2 to 6 week periods
– Limited causal data
• Syndicated sources do not specifically measure
0
20
40
60
80
100
12
/18
/20
11
1/1
5/2
01
2
2/1
2/2
01
2
3/1
1/2
01
2
4/8
/20
12
5/6
/20
12
6/3
/20
12
7/1
/20
12
7/2
9/2
01
2
8/2
6/2
01
2
9/2
3/2
01
2
10
/21
/20
12
11
/18
/20
12
12
/16
/20
12
1/1
3/2
01
3
2/1
0/2
01
3
3/1
0/2
01
3
4/7
/20
13
5/5
/20
13
6/2
/20
13
6/3
0/2
01
3
7/2
8/2
01
3
8/2
5/2
01
3
9/2
2/2
01
3
10
/20
/20
13
11
/17
/20
13
Vo
lum
e S
ale
s (0
00
’s)
Weekly Sales Decomposition
Base Volume Trade Volume SM Event 1 SM Event 2 Volume Sales
SM Event 1 SM Event 2
Key Challenges in Evaluating Retailer Shopper Marketing Promotions
9
– Event execution details may be hard to track down, and store for post promotion evaluation • Event/Offer details • Volume results • Spending, fixed and variable
– Trade-off’s in measurement techniques: • Cost-timing-accuracy
• Pick two out of three!
Key Challenges in Evaluating Retailer Shopper Marketing Promotions
10

11
11
Total Sales Baseline vs.
Incremental
Baseline
Sales
Trade Merch
Impact
Trade
Merch
Impact
Shopper
Marketing
Impact
Baseline
Sales
Trade
Merch
Impact
Baseline
Sales
Shopper Marketing
Tactic “B”
Shopper Marketing
Tactic “A”
Baseline,
Incremental & SM Baseline,
Incremental &
SM by tactic
Fundamental Measurement Issue: How do I measure the “Incremental”?
11
Case Studies and Examples
12
• Examples from two large CPG products manufacturers • Full Portfolios of brands
• Broad range of shopper marketing events
• Retailer Events • Total Market Events
• Central team to provide direction and advice, but substantial
freedom for account teams to develop or execute programs for Retailer events • More modest flexibility for Total market events
Case Study #1 – Retailer Shopper Marketing Promotions
13
Manufacturer Goals • Establish cost effective and reliable method of measuring
over 400 events annually • Have low impact on field account teams for evaluation • Establish benchmarks for:
• Lift and ROI by product • Lift and ROI by retailer • Lift and ROI by tactic

Case Study #1 – Retailer Shopper Marketing Promotions
14
What they did…. • Evaluated multiple measurement methods • Developed a standard template and portal for collecting
promotion details and spending • Established benchmarks, after measuring a large number of
• Events • Tactic’s
• Central team diligently shared findings and observations
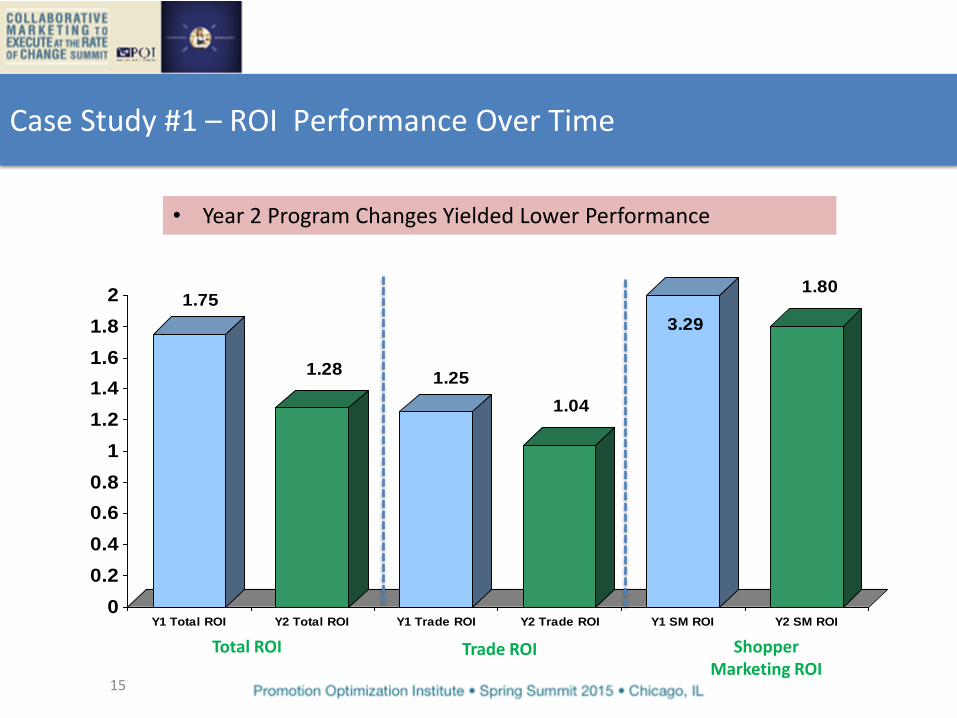
1.75
1.281.25
1.04
3.29
1.80
0
0.2
0.4
0.6
0.8
1
1.2
1.4
1.6
1.8
2
Y1 Total ROI Y2 Total ROI Y1 Trade ROI Y2 Trade ROI Y1 SM ROI Y2 SM ROI
15
Case Study #1 – ROI Performance Over Time
Total ROI Trade ROI Shopper Marketing ROI
• Year 2 Program Changes Yielded Lower Performance
15
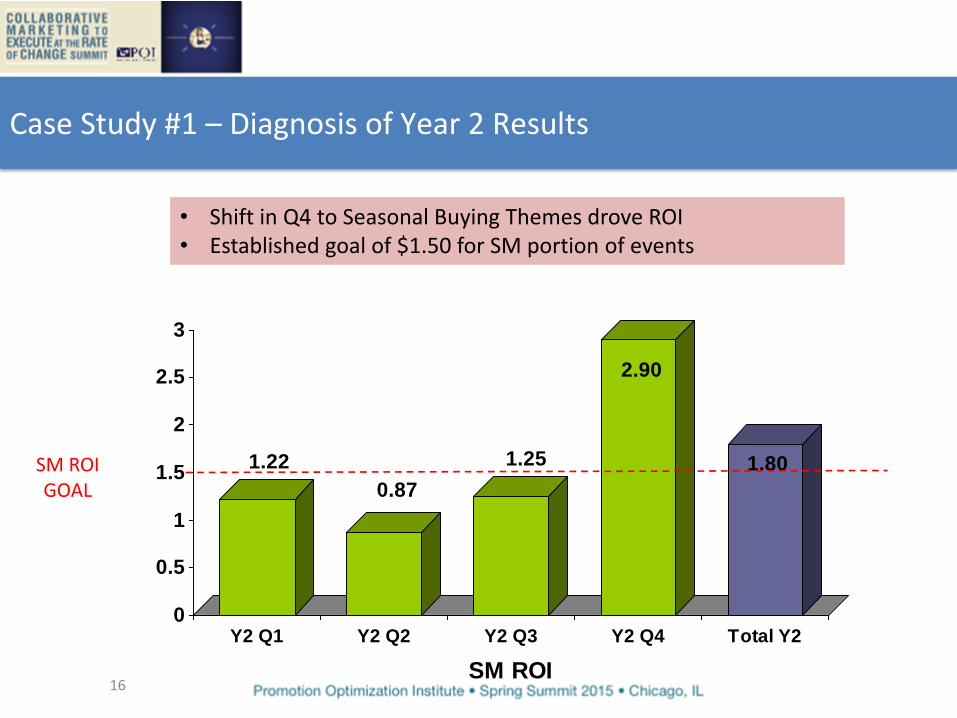
1.22
0.87
1.25
2.90
1.80
0
0.5
1
1.5
2
2.5
3
Y2 Q1 Y2 Q2 Y2 Q3 Y2 Q4 Total Y2
SM ROI 16
SM ROI GOAL
Case Study #1 – Diagnosis of Year 2 Results
• Shift in Q4 to Seasonal Buying Themes drove ROI • Established goal of $1.50 for SM portion of events
16

17
Case Study #1 – Diagnostics Lift and ROI by Tactic
• Identified significant differences in lift and ROI by tactic. • Shifted tactics towards higher lift/ROI opportunities
17
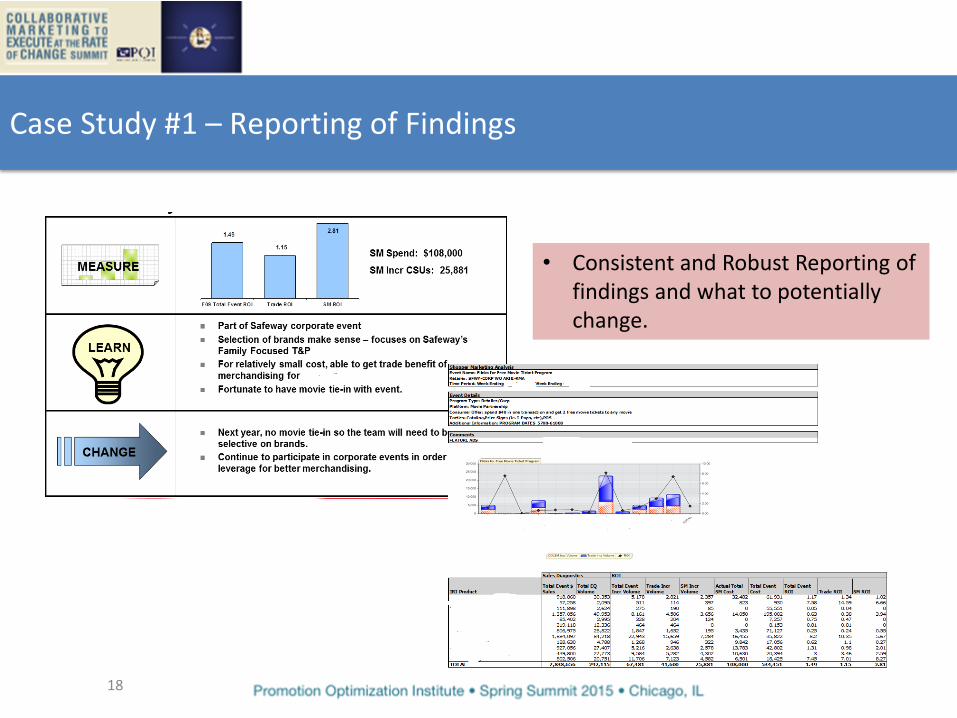
Case Study #1 – Reporting of Findings
• Consistent and Robust Reporting of findings and what to potentially change.
18
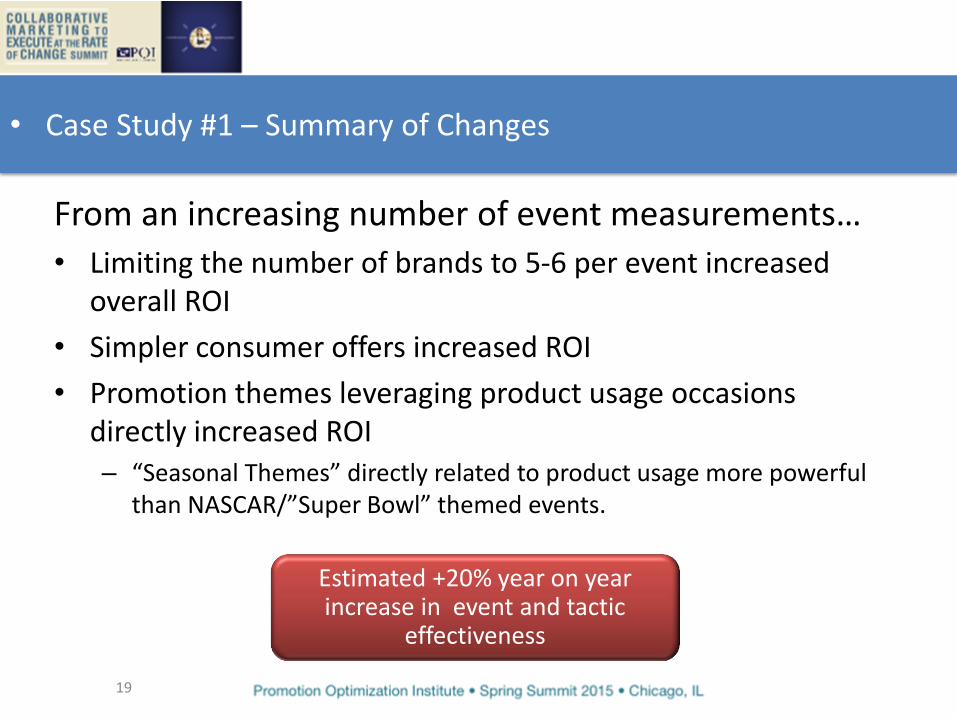
From an increasing number of event measurements…
• Limiting the number of brands to 5-6 per event increased overall ROI
• Simpler consumer offers increased ROI
• Promotion themes leveraging product usage occasions directly increased ROI – “Seasonal Themes” directly related to product usage more powerful
than NASCAR/”Super Bowl” themed events.
• Case Study #1 – Summary of Changes
Estimated +20% year on year increase in event and tactic
effectiveness
19
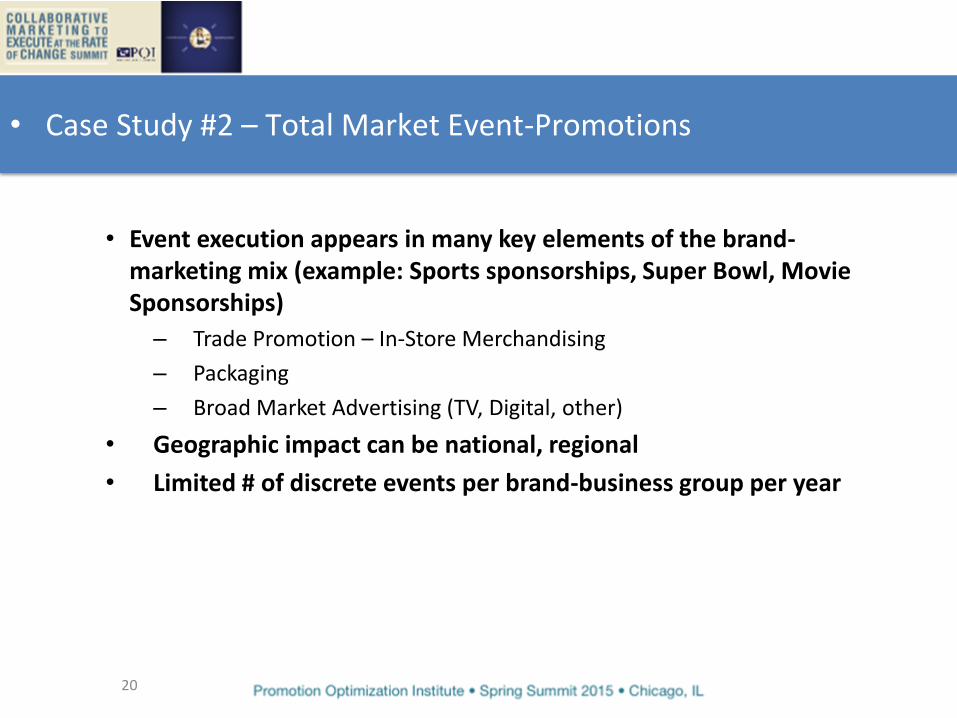
• Event execution appears in many key elements of the brand-marketing mix (example: Sports sponsorships, Super Bowl, Movie Sponsorships)
– Trade Promotion – In-Store Merchandising
– Packaging
– Broad Market Advertising (TV, Digital, other)
• Geographic impact can be national, regional
• Limited # of discrete events per brand-business group per year
• Case Study #2 – Total Market Event-Promotions
20

Major Beverage Manufacturer-Distributor
• Case Study #2 – Total Market Event-Promotions
Manufacturer Goals • Establish Valid and reliable method of measuring 5-6
National promotion events annually • Consider both consumer impact and retailer/bottler support
impact • Establish benchmarks for:
• Lift and ROI by program • Lift and ROI by product • Lift and ROI by Retailer
21

22
• Case Study #2 – Total Market Event-Promotions
Movie Tie-in Programs Holiday Programs-Halloween
“Super Bowl”
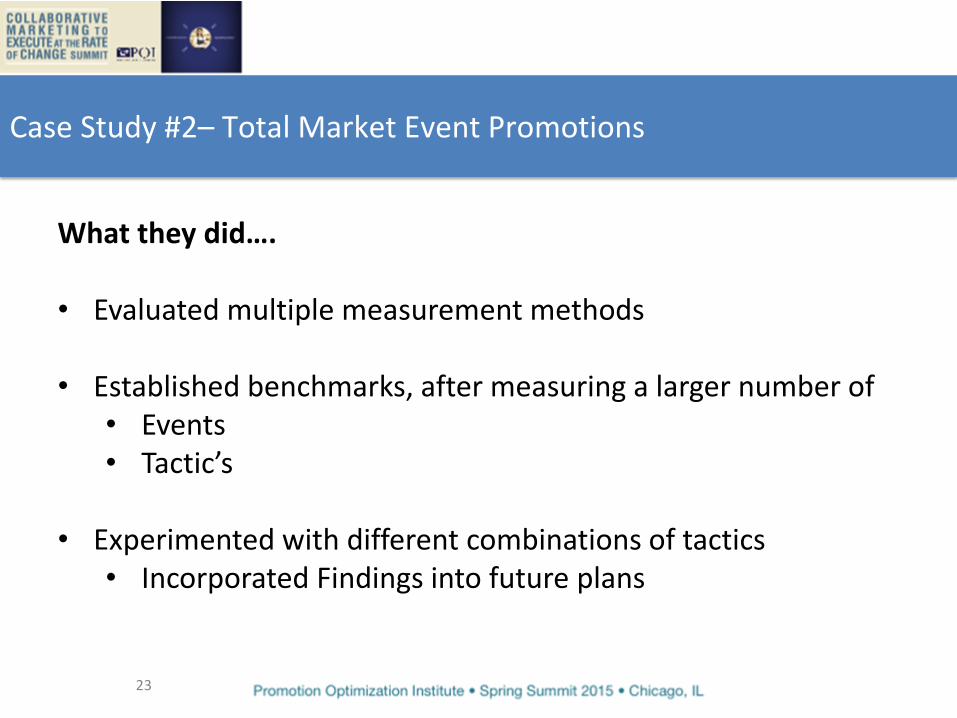
Case Study #2– Total Market Event Promotions
23
What they did…. • Evaluated multiple measurement methods • Established benchmarks, after measuring a larger number of
• Events • Tactic’s
• Experimented with different combinations of tactics
• Incorporated Findings into future plans

Separate out the consumer impact-lift, from the trade merchandising impact-lift.
Consumer Trade Total Impact + =
Increase in Effectiveness on
the consumer’s response
due to the Event
Some of the impact of events comes
from the value in gaining support
Case Study #2– Measurement Goal
24

1.9%
2.7%2.9%2.9%
4.6%
5.6%
9.1%
0.0%
1.0%
2.0%
3.0%
4.0%
5.0%
6.0%
7.0%
8.0%
9.0%
10.0%
Sports
Holiday
Q4 Holiday College
Sports
Early
Summer
Fall Holiday Mid Summer Late Summer
Total Incremental Contribution Summarized By Event Type
Case Study #2– Total Market Event Promotions - Lift
• Major Sports Holiday (Super Bowl) and Q4 Holiday events provided the largest volume lift
25
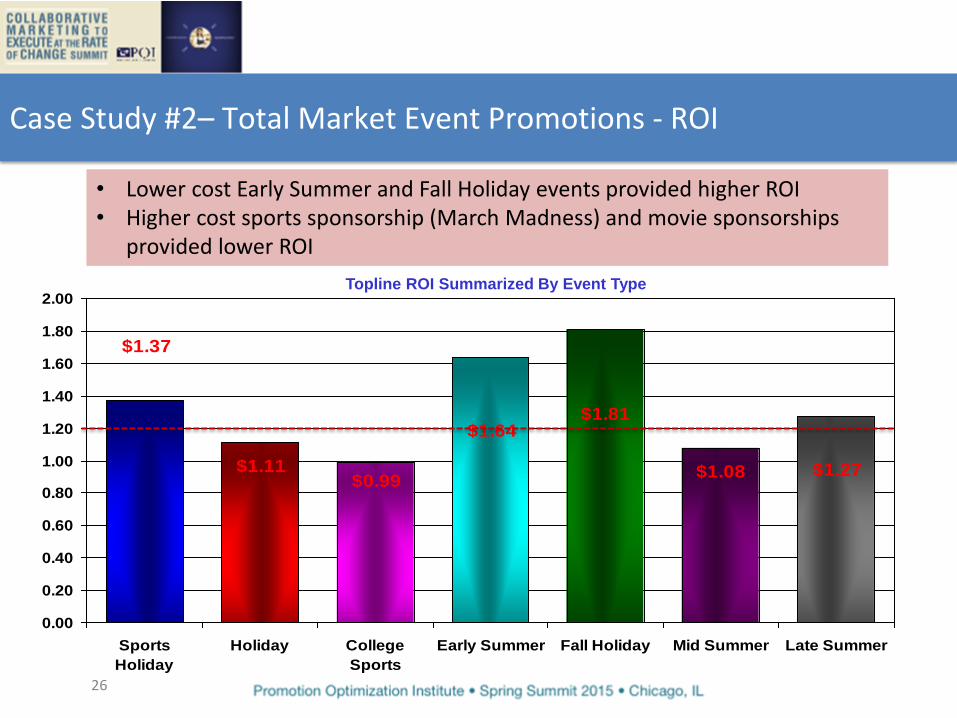
$1.37
$1.11$0.99
$1.64$1.81
$1.08 $1.27
0.00
0.20
0.40
0.60
0.80
1.00
1.20
1.40
1.60
1.80
2.00
Sports
Holiday
Holiday College
Sports
Early Summer Fall Holiday Mid Summer Late Summer
Topline ROI Summarized By Event Type
Case Study #2– Total Market Event Promotions - ROI
• Lower cost Early Summer and Fall Holiday events provided higher ROI • Higher cost sports sponsorship (March Madness) and movie sponsorships
provided lower ROI
26
27
0.0%
2.0%
4.0%
6.0%
8.0%
10.0%
12.0%
14.0%
Su
perb
ow
l Y3
Su
perb
ow
l Y2
Su
perb
ow
l Y1
Ho
liday Y
2
Ho
liday Y
3
Lab
or D
ay Y3
Mem
orial D
ay 2003w2
Su
perM
an Y
r 4
July 4th
Y3
Su
perb
ow
l Y4
Ho
liday Y
2 A
Mem
orial D
ay Y3
Lab
or D
ay Y2
Hallo
ween
Y3
Ho
liday Y
3 B
July 4th
Y2 A
March
Mad
ness Y
1 B
Mem
orial D
ay Y1
March
Mad
ness Y
2
July 4th
Y2 B
July 4th
Y1
March
Mad
ness Y
1 A
Hallo
ween
Y2
March
Mad
ness Y
3
Diet B
ox O
ffice Y4
NF
LY
1
Hallo
ween
Y1
Mem
orial D
ay Y2
Ho
liday Y
1
July 4th
Y1 A
Acad
emy A
ward
s Y2
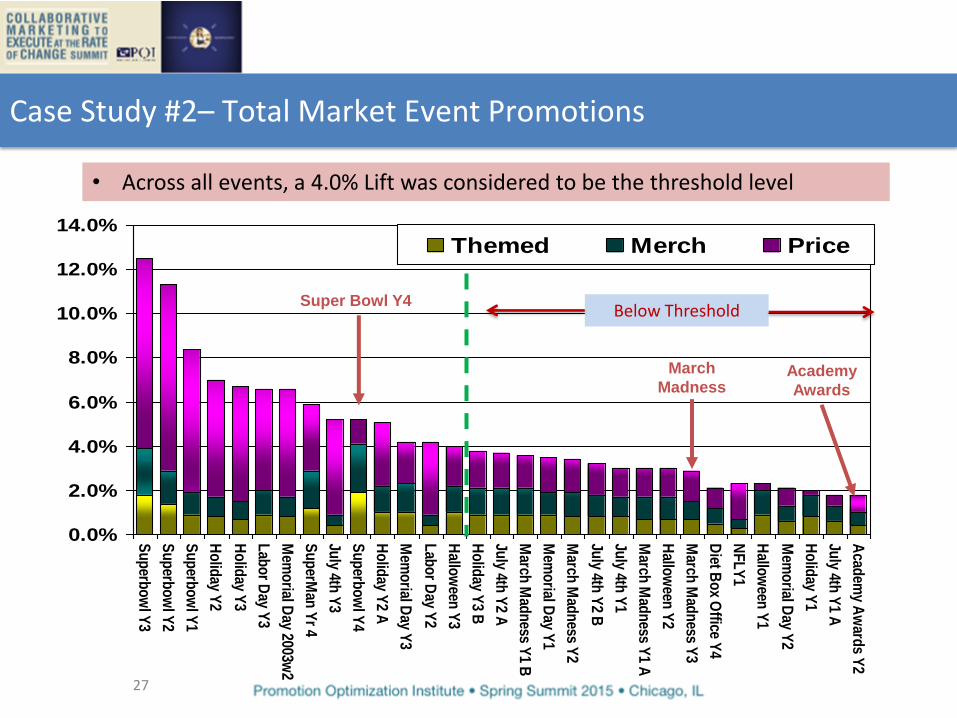
Themed Merch Price
Super Bowl Y4
March
Madness Academy
Awards
Case Study #2– Total Market Event Promotions
• Across all events, a 4.0% Lift was considered to be the threshold level
Below Threshold
28
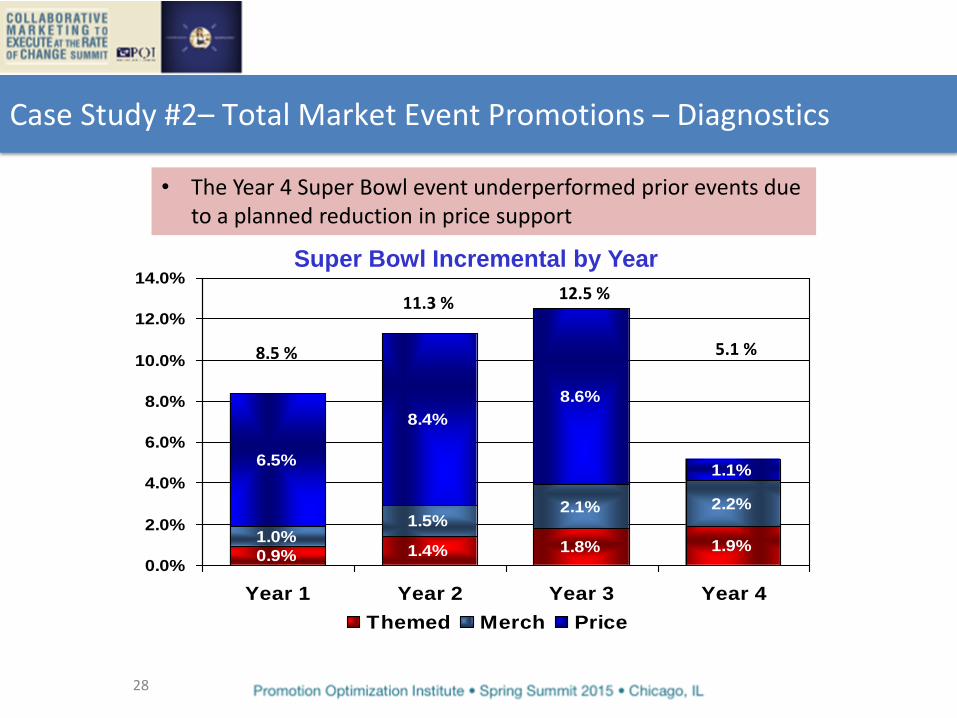
0.9% 1.4% 1.8% 1.9%1.0%
1.5%2.1% 2.2%
6.5%
8.4%
8.6%
1.1%
0.0%
2.0%
4.0%
6.0%
8.0%
10.0%
12.0%
14.0%
Year 1 Year 2 Year 3 Year 4
Themed Merch Price
Super Bowl Incremental by Year
8.5 %
11.3 % 12.5 %
5.1 %
Case Study #2– Total Market Event Promotions – Diagnostics
• The Year 4 Super Bowl event underperformed prior events due to a planned reduction in price support
• Included a price promotion component in all future events
• Avoided high cost/low ROI events requiring significant licensing fees or sponsorship costs – Movie sponsorships are boom or bust
– March Madness, high cost, lower than threshold incremental volume
– Continue to participate in the high volume occasions, but focus a bit more on optimizing pre summer and post summer holidays
• Case Study #2 – Summary of Changes
29

• Determine the value of measuring and necessary coverage – Establish a cost threshold for event measurement
– What breadth of coverage – all events, top accounts only, or a projectable sample?
• What level of accuracy and reliability? – Given the measurement challenge, having a “close” and
consistent technique, may outweigh having high levels of statistical accuracy
– At the very least, have a common method of determining “incremental”
30
Summary – Considerations for Measuring Shopper Marketing
• Consistent process for capturing the details – Determine a means of capturing key details for events, and keeping on
hand • Products/timing
• Event tactics
• Variable and fixed spend
• Criteria for Financial evaluation – Net Margin ROI and Payback above the cost of the event is hard to achieve for short term
events.
– Consider measures that include retail partner goals (payback on retail sales, category impact)
• Don’t forget the Consumer! – As available, use other data sources (HH panel, FSP data)
• Determining best combination of products for multi product events
• Post event evaluation for expanding trips or basket size
31
Summary – Considerations for Measuring Shopper Marketing
• Developing Benchmarks
– Identify reasonable threshold levels for lift and ROI, and evaluate over time
• Evaluating tactics and Implementing results
– Standard/common templates for sharing findings
– Regular team evaluation, and best practice sharing among • Field account teams
• HQ, Central Support teams
• And, Retail Partners
32
Summary – Considerations for Measuring Shopper Marketing
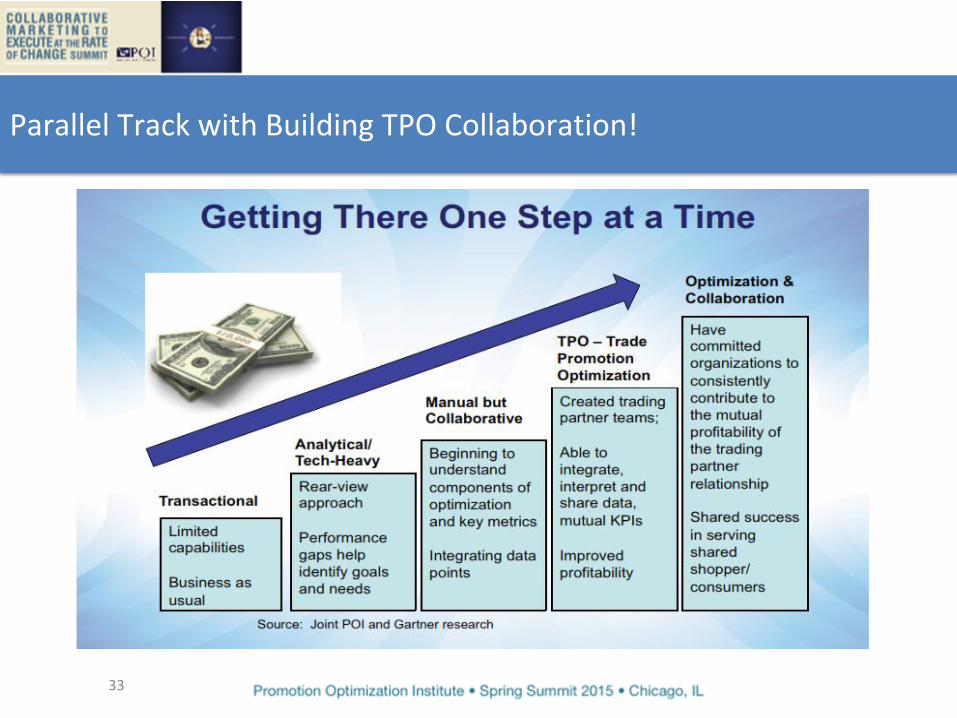
Parallel Track with Building TPO Collaboration!
33
Thank You!
34