Quality of investment decisions and disclosure timing · Quality of investment decisions and...
23
Quality of investment decisions and disclosure timing Manapol Ekkayokkaya Chulalongkorn Business School Krishna Paudyal University of Strathclyde SEC Working Paper Forum February 24, 2015
Transcript of Quality of investment decisions and disclosure timing · Quality of investment decisions and...

Quality of investment decisions and disclosure timing
Manapol Ekkayokkaya Chulalongkorn Business School
Krishna Paudyal
University of Strathclyde
SEC Working Paper Forum February 24, 2015

Ekkayokkaya&Paudyal 1
discussion plan background – what we know and don’t known
prediction and tests
data and method – main features
key results – central message
take-home messages
details: data sources and sample criteria
empirical methodology
key empirical results

Ekkayokkaya&Paudyal 2
background – known (1 of 2) well established . .. (e.g., Miller 2002; Sengupta 2004; Kothari et al 2009; Ge & Lennox 2011) Firms strategically release good news to investors early and delay bad news [good news early and bad news late] What kind of news ???
Financial news/information, e.g., management forecasts and earnings What is in for managers to engage in such strategic disclosure timing ???
Good news early rise in security price at no cost (Lang & Sul 2014) Bad news late buy time and “bury” it due to career-related concerns
Any importance to financial reporting convention ???
This disclosure behavior “contrasts conservative recognition rules and outcomes in financial reports” (Kothari et al 2009)
Ekkayokkaya&Paudyal 3
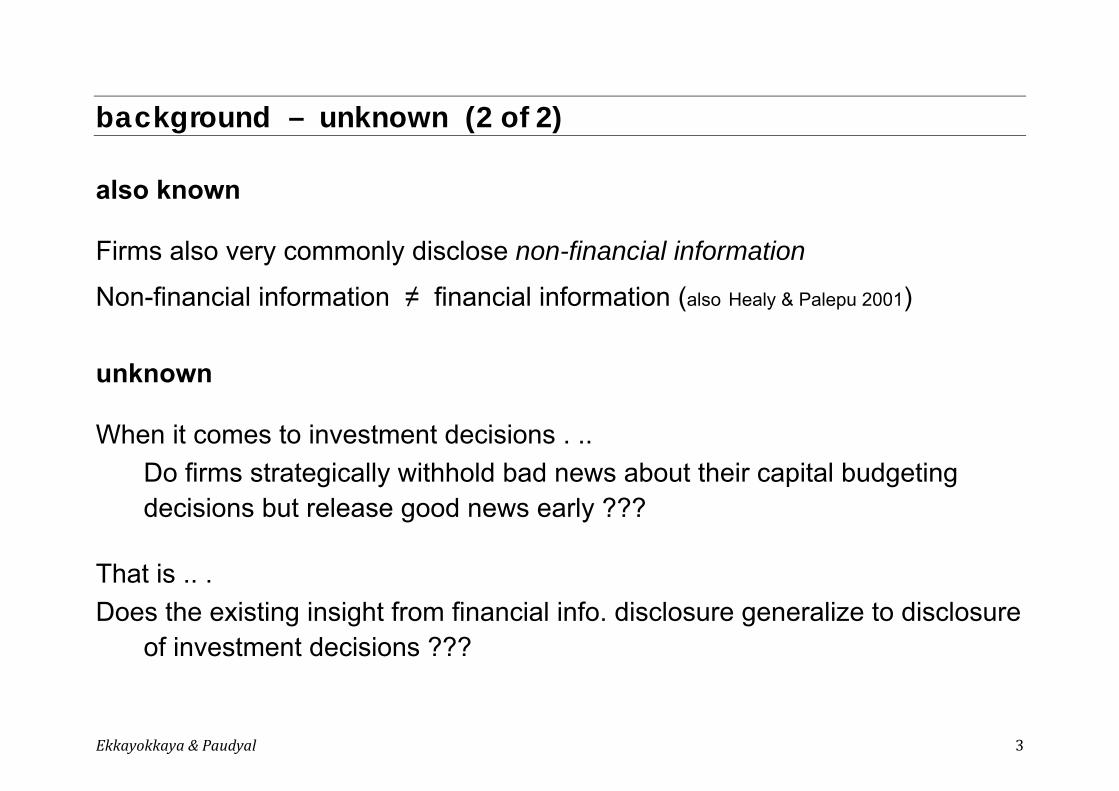
background – unknown (2 of 2) also known Firms also very commonly disclose non-financial information
Non-financial information ≠ financial information (also Healy & Palepu 2001)
unknown When it comes to investment decisions . ..
Do firms strategically withhold bad news about their capital budgeting decisions but release good news early ???
That is .. . Does the existing insight from financial info. disclosure generalize to disclosure
of investment decisions ???
Ekkayokkaya&Paudyal 4
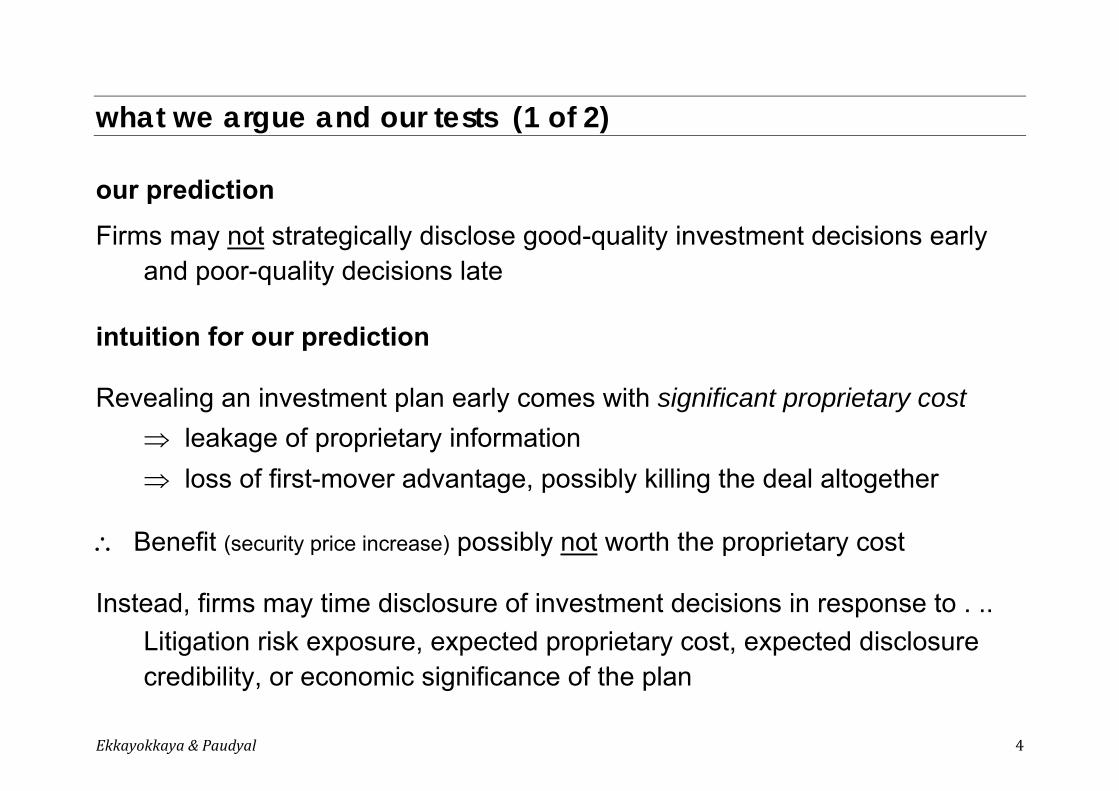
what we argue and our tests (1 of 2) our prediction
Firms may not strategically disclose good-quality investment decisions early and poor-quality decisions late
intuition for our prediction Revealing an investment plan early comes with significant proprietary cost
leakage of proprietary information loss of first-mover advantage, possibly killing the deal altogether
Benefit (security price increase) possibly not worth the proprietary cost Instead, firms may time disclosure of investment decisions in response to . ..
Litigation risk exposure, expected proprietary cost, expected disclosure credibility, or economic significance of the plan
Ekkayokkaya&Paudyal 5
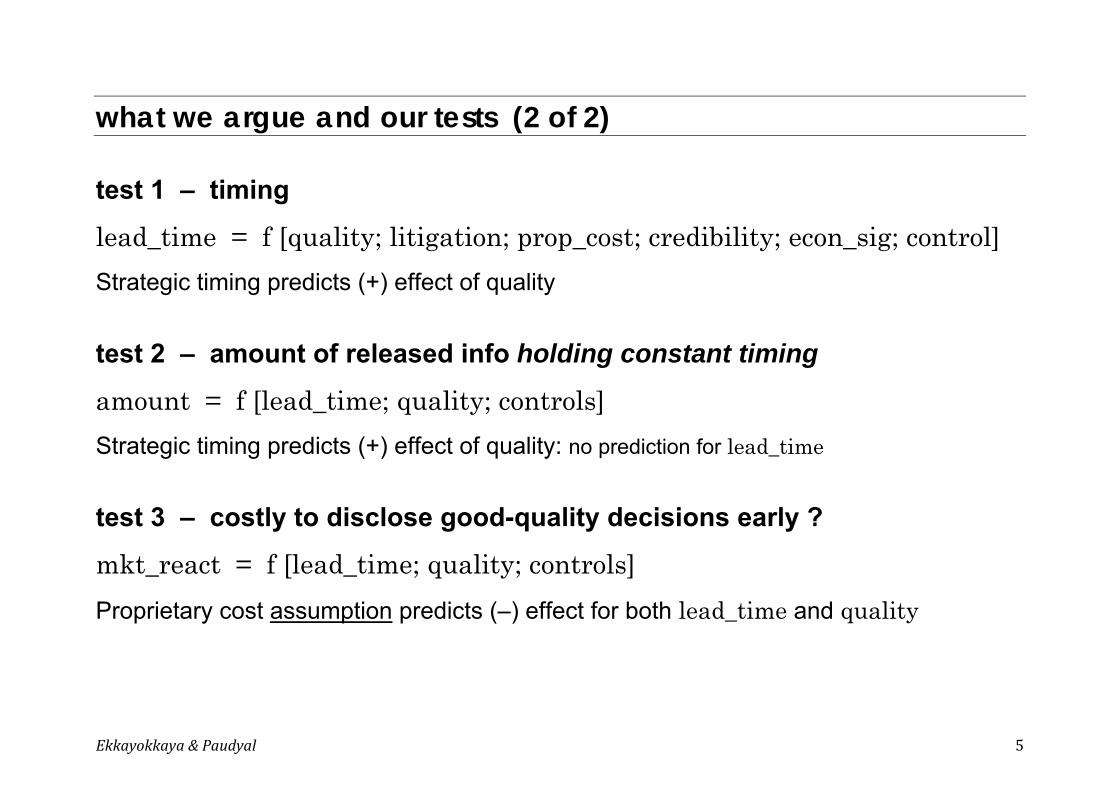
what we argue and our tests (2 of 2) test 1 – timing
lead_time = f [quality; litigation; prop_cost; credibility; econ_sig; control] Strategic timing predicts (+) effect of quality test 2 – amount of released info holding constant timing
amount = f [lead_time; quality; controls] Strategic timing predicts (+) effect of quality: no prediction for lead_time test 3 – costly to disclose good-quality decisions early ?
mkt_react = f [lead_time; quality; controls] Proprietary cost assumption predicts (–) effect for both lead_time and quality
Ekkayokkaya&Paudyal 6
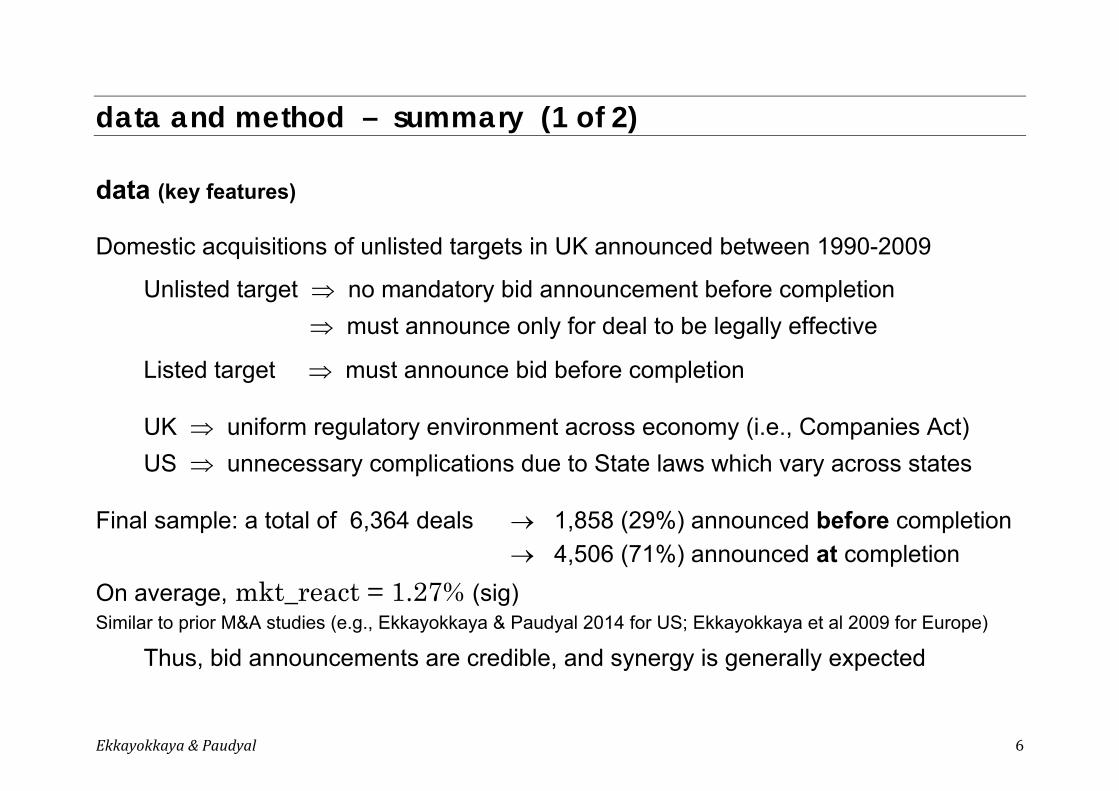
data and method – summary (1 of 2) data (key features) Domestic acquisitions of unlisted targets in UK announced between 1990-2009
Unlisted target no mandatory bid announcement before completion must announce only for deal to be legally effective
Listed target must announce bid before completion UK uniform regulatory environment across economy (i.e., Companies Act) US unnecessary complications due to State laws which vary across states
Final sample: a total of 6,364 deals 1,858 (29%) announced before completion 4,506 (71%) announced at completion On average, mkt_react = 1.27% (sig) Similar to prior M&A studies (e.g., Ekkayokkaya & Paudyal 2014 for US; Ekkayokkaya et al 2009 for Europe)
Thus, bid announcements are credible, and synergy is generally expected
Ekkayokkaya&Paudyal 7
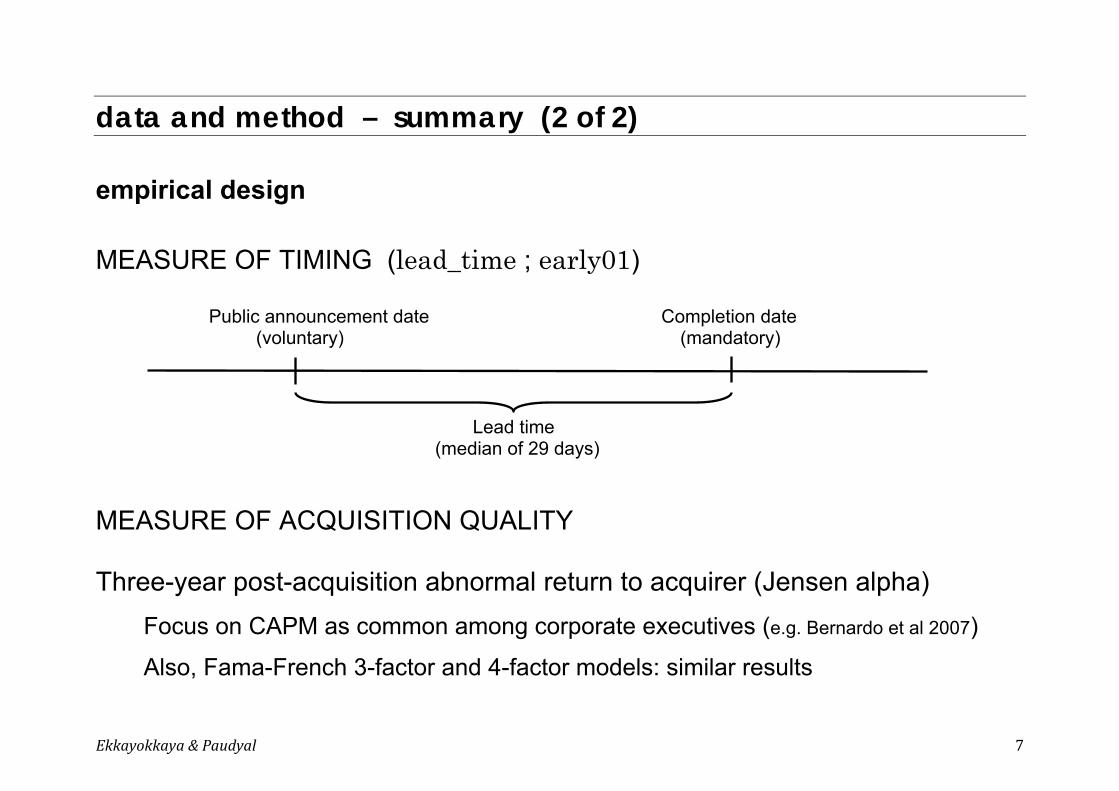
data and method – summary (2 of 2) empirical design MEASURE OF TIMING (lead_time ; early01) Public announcement date Completion date (voluntary) (mandatory) Lead time (median of 29 days)
MEASURE OF ACQUISITION QUALITY Three-year post-acquisition abnormal return to acquirer (Jensen alpha)
Focus on CAPM as common among corporate executives (e.g. Bernardo et al 2007)
Also, Fama-French 3-factor and 4-factor models: similar results

Ekkayokkaya&Paudyal 8
key results – summary (1 of 3) test 1 (do firms disclose good news early and bad news late?) Strategic timing predicts effect (+) of quality lead_time = f [quality; litigation; prop_cost; credibility; econ_sig; control] expected (+) (+) (-) (+) (+)
results (insig) () () () ()
No strategic disclosure timing Firms time disclosure of investment decisions by trading off between benefits
and costs of meeting demand for prompt disclosure These results not driven by firm-specific conditions (see key empirical results below)

Ekkayokkaya&Paudyal 9
key results – summary (2 of 3) test 2 (do firms say less at public announcements when announcing poor-quality deals?) Strategic timing predicts effect (+) of quality, holding constant timing amount = f [lead_time; quality; controls] expected (−/+) (+)
results (+) (−)
Sharp contrast to idea of strategic timing Holding constant timing, firms say less when announcing a good-quality deal Together with results from TEST 1, firms disclose their investment decisions
conservatively – in line with existence of material proprietary cost
Ekkayokkaya&Paudyal 10
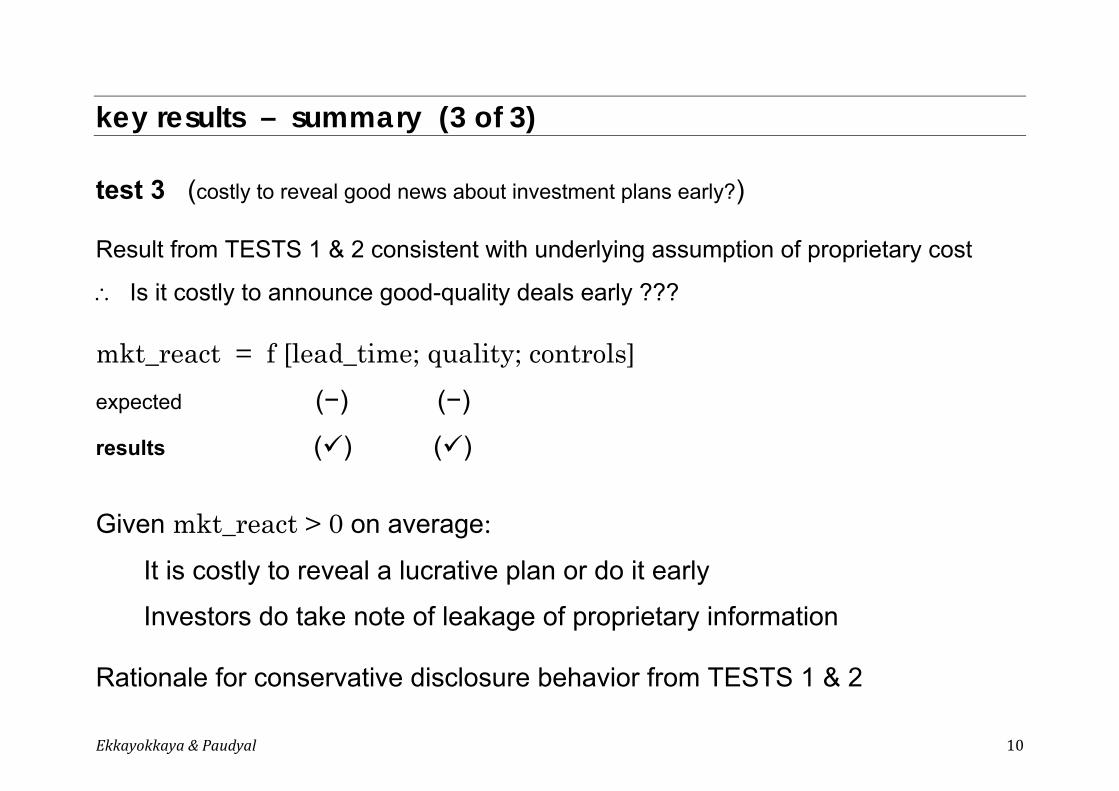
key results – summary (3 of 3) test 3 (costly to reveal good news about investment plans early?) Result from TESTS 1 & 2 consistent with underlying assumption of proprietary cost
Is it costly to announce good-quality deals early ??? mkt_react = f [lead_time; quality; controls] expected (−) (−)
results () ()
Given mkt_react > 0 on average: It is costly to reveal a lucrative plan or do it early
Investors do take note of leakage of proprietary information Rationale for conservative disclosure behavior from TESTS 1 & 2
Ekkayokkaya&Paudyal 11
take-home messages (1 of 1) Firms unlikely to withhold from investors bad news about their investment plan
“Good news early bad news late” unlikely to generalize to investment decisions Firms disclose their investment plan conservatively – due to proprietary cost
cf: practically no proprietary cost for financial info. disclosure Conservatism in recognition of expected future cash flows, which essentially become reported financial results
This conservatism arises before, and possibly independently of, conservatism in financial reporting
Investors understand and identify leakage of proprietary information, and value firms accordingly
Ekkayokkaya&Paudyal 12
data sources and sample criteria (1 of 1) SDC: transaction details; e.g., initial announcement dates, transaction value, SICs Worldscope: firms’ characteristics; e.g., total assets and revenue Datastream: share price data – daily and monthly sample criteria:
Domestic deals in UK only with transaction value (excl. fees and expenses)
Pre-announcement holdings in target < 49.9%
Acquirers have: share price 1 month before announcement; at least 12 monthly returns post-acquisition; total assets recorded on Worldscope
Excluded: privatized deals and JV deals; deals with acquirer having BE ≤ 0 (i.e., insolvent acquirers)

Ekkayokkaya&Paudyal 13
empirical methodology (1 of 2) For each deal i, (average monthly abnormal return to acquirer) is estimated:
(1) , , , , ,
(2) , , , , ,
(3) , , , , ,
Estimation window: 36 months post-acquisition (min. 12 months required)
For each deal i, amount of info. released at announcement is estimated:
amount ≡ |mkt_react| (Kothari et al 2009)
mkt_react (e.g., Fuller et al 2002)
Estimation window: (-2, +2) (e.g., Fuller et al 2002; Masulis et al 2007)
Ekkayokkaya&Paudyal 14
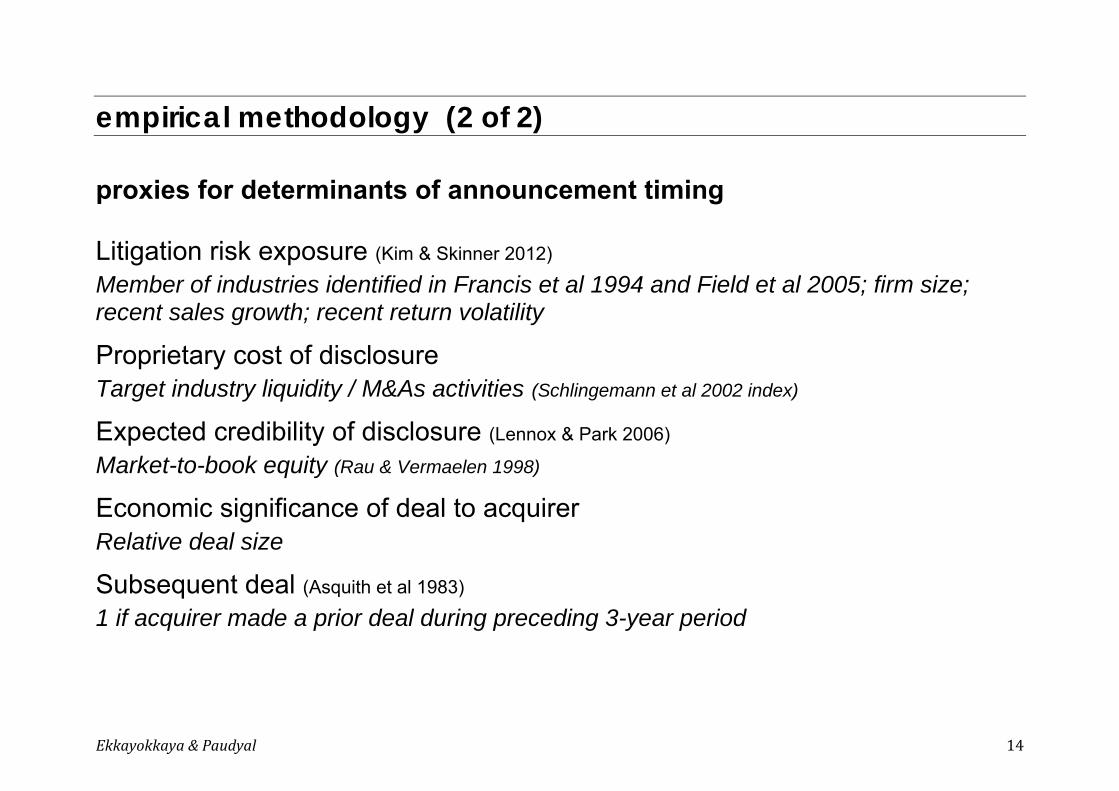
empirical methodology (2 of 2) proxies for determinants of announcement timing Litigation risk exposure (Kim & Skinner 2012) Member of industries identified in Francis et al 1994 and Field et al 2005; firm size; recent sales growth; recent return volatility
Proprietary cost of disclosure Target industry liquidity / M&As activities (Schlingemann et al 2002 index)
Expected credibility of disclosure (Lennox & Park 2006) Market-to-book equity (Rau & Vermaelen 1998)
Economic significance of deal to acquirer Relative deal size
Subsequent deal (Asquith et al 1983) 1 if acquirer made a prior deal during preceding 3-year period
Ekkayokkaya&Paudyal 15
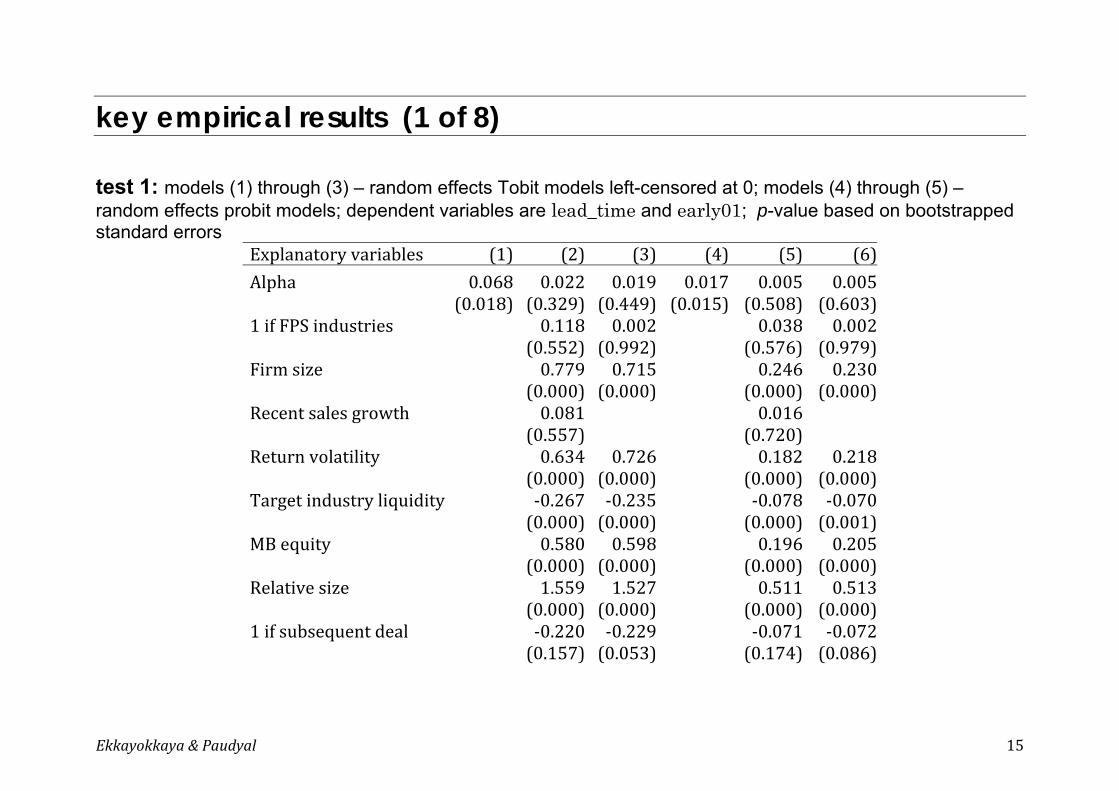
key empirical results (1 of 8) test 1: models (1) through (3) – random effects Tobit models left-censored at 0; models (4) through (5) – random effects probit models; dependent variables are lead_time and early01; p-value based on bootstrapped standard errors
Explanatoryvariables (1) (2) (3) (4) (5) (6)Alpha 0.068 0.022 0.019 0.017 0.005 0.005
(0.018) (0.329) (0.449) (0.015) (0.508) (0.603)1ifFPSindustries 0.118 0.002 0.038 0.002
(0.552) (0.992) (0.576) (0.979)Firmsize 0.779 0.715 0.246 0.230
(0.000) (0.000) (0.000) (0.000)Recentsalesgrowth 0.081 0.016
(0.557) (0.720)Returnvolatility 0.634 0.726 0.182 0.218
(0.000) (0.000) (0.000) (0.000)Targetindustryliquidity ‐0.267 ‐0.235 ‐0.078 ‐0.070
(0.000) (0.000) (0.000) (0.001)MBequity 0.580 0.598 0.196 0.205
(0.000) (0.000) (0.000) (0.000)Relativesize 1.559 1.527 0.511 0.513
(0.000) (0.000) (0.000) (0.000)1ifsubsequentdeal ‐0.220 ‐0.229 ‐0.071 ‐0.072
(0.157) (0.053) (0.174) (0.086)
Ekkayokkaya&Paudyal 16
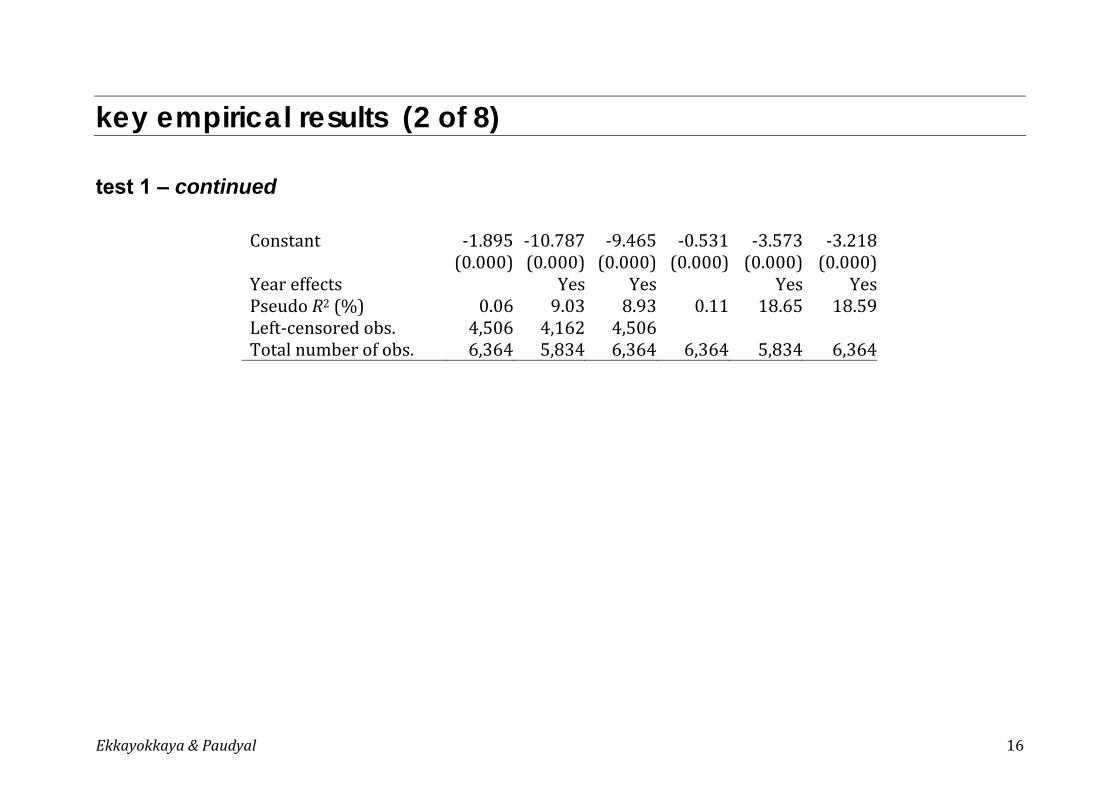
key empirical results (2 of 8) test 1 – continued
Constant ‐1.895 ‐10.787 ‐9.465 ‐0.531 ‐3.573 ‐3.218(0.000) (0.000) (0.000) (0.000) (0.000) (0.000)
Yeareffects Yes Yes Yes YesPseudoR2(%) 0.06 9.03 8.93 0.11 18.65 18.59Left‐censoredobs. 4,506 4,162 4,506Totalnumberofobs. 6,364 5,834 6,364 6,364 5,834 6,364

Ekkayokkaya&Paudyal 17
key empirical results (3 of 8) test 1 – continued does the influence of Alpha vary across firm-specific conditions? Models (1) and (3) – random effects Tobit models; models (2) and (4) – random effects probit models; dependent variables are lead_time and early01; p-value based on bootstrapped standard errors
Explanatoryvariables (1) (2) (3) (4)Alpha 0.023 0.002 0.061 0.016
(0.810) (0.931) (0.444) (0.445)1ifFPSindustries ‐0.031 ‐0.020 ‐0.140 ‐0.049
(0.903) (0.793) (0.605) (0.443)1iflargefirm 1.215 0.330 1.098 0.298
(0.000) (0.000) (0.000) (0.000)1ifhighrecentsalesgrowth ‐0.122 ‐0.022
(0.487) (0.703)1ifhighreturnvolatility 0.477 0.126 0.520 0.141
(0.027) (0.017) (0.006) (0.012)1ifhightargetindustryliquidity ‐0.489 ‐0.139 ‐0.466 ‐0.134
(0.005) (0.011) (0.013) (0.002)1ifhiMBequity 0.407 0.129 0.385 0.126
(0.016) (0.025) (0.013) (0.007)1iflargerelativesize 3.667 1.065 3.590 1.054
(0.000) (0.000) (0.000) (0.000)1ifsubsequentdeal ‐0.117 ‐0.050 ‐0.227 ‐0.075
(0.444) (0.318) (0.143) (0.091)

Ekkayokkaya&Paudyal 18
key empirical results (4 of 8) test 1 – continued does the influence of Alpha vary across firm-specific conditions?
FPSindustriesAlpha ‐0.026 ‐0.010 ‐0.037 ‐0.014(0.682) (0.600) (0.546) (0.354)
LargefirmAlpha 0.013 0.005 0.023 0.007(0.854) (0.840) (0.725) (0.740)
HighrecentsalesgrowthAlpha 0.074 0.025(0.138) (0.102)
HighreturnvolatilityAlpha ‐0.113 ‐0.036 ‐0.089 ‐0.027(0.038) (0.073) (0.053) (0.076)
HightargetindustryliquidityAlpha 0.072 0.020 0.049 0.015(0.135) (0.156) (0.273) (0.354)
HiMBequityAlpha 0.027 0.008 0.059 0.016(0.650) (0.697) (0.249) (0.275)
LargerelativesizeAlpha ‐0.054 ‐0.010 ‐0.062 ‐0.013(0.346) (0.522) (0.282) (0.355)
SubsequentdealAlpha 0.037 0.008 0.027 0.006(0.480) (0.634) (0.421) (0.676)
Constant ‐4.331 ‐1.298 ‐4.176 ‐1.269(0.000) (0.000) (0.000) (0.000)
Yeareffects Yes Yes Yes YesPseudoR2(%) 5.06 10.33 4.84 9.93Left‐censoredobs. 4,162 4,506Totalnumberofobs. 5,834 5,834 6,364 6,364

Ekkayokkaya&Paudyal 19
key empirical results (5 of 8) test 2: linear firm-year fixed effects regressions; dependent variable is |mkt_react|; p-value based on White standard errors robust to clustering at acquirer level
Explanatoryvariables (1) (2) (3) (4) (5) (6)ln(1+leadtime) 0.040 0.040
(0.001) (0.001)1ifannouncedearly 0.168 0.169
(0.000) (0.000)Alpha ‐0.019 ‐0.019 ‐0.033 ‐0.031
(0.035) (0.035) (0.003) (0.001)

Ekkayokkaya&Paudyal 20
key empirical results (6 of 8) test 2 – continued
1ifFPSindustries 0.077 0.089(0.702) (0.676)
Firmsize ‐0.031 ‐0.036(0.537) (0.417)
Recentsalesgrowth ‐0.086(0.043)
Returnvolatility 0.167 0.164(0.012) (0.010)
Targetindustryliquidity ‐0.027 ‐0.033(0.207) (0.112)
MBequity ‐0.052 ‐0.055(0.125) (0.094)
Relativesize 0.090 0.093(0.000) (0.000)
1ifsubsequentdeal ‐0.071 ‐0.069(0.175) (0.154)
Constant 0.717 0.707 0.700 0.690 1.563 1.547(0.000) (0.000) (0.000) (0.000) (0.008) (0.003)
Yearfixedeffects Yes Yes Yes Yes Yes YesFirmfixedeffects Yes Yes Yes Yes Yes YesR2(%) 12.69 12.75 12.78 12.84 13.18 13.89Totalnumberofobs. 6,364 6,364 6,364 6,364 5,834 6,364

Ekkayokkaya&Paudyal 21
key empirical results (7 of 8) test 3: linear firm-year fixed effects regressions; dependent variable is mkt_react ; p-value based on White standard errors robust to clustering at acquirer level
Explanatoryvariables (1) (2) (3) (4) (5) (6)ln(1+leadtime) ‐0.220 ‐0.223 ‐0.188
(0.004) (0.004) (0.015)1ifannouncedearly ‐0.549 ‐0.581 ‐0.548
(0.049) (0.041) (0.055)Alpha ‐0.189 ‐0.190 ‐0.186 ‐0.181 ‐0.122 ‐0.132
(0.013) (0.013) (0.008) (0.011) (0.083) (0.059)ln(1+leadtime)Alpha ‐0.003 ‐0.031
(0.917) (0.379)AnnouncedearlyAlpha ‐0.030 ‐0.064
(0.786) (0.592)

Ekkayokkaya&Paudyal 22
key empirical results (8 of 8) test 3 – continued
Firmsize ‐1.073 ‐1.082 ‐1.073 ‐1.083 ‐1.083 ‐1.082(0.005) (0.005) (0.005) (0.005) (0.001) (0.001)
Leverage 3.664 3.732 3.664 3.731 2.567 2.593(0.067) (0.062) (0.067) (0.062) (0.144) (0.140)
Freecashflow ‐5.846 ‐5.831 ‐5.847 ‐5.840 ‐5.507 ‐5.486(0.024) (0.024) (0.024) (0.024) (0.107) (0.109)
Tobin’sq ‐0.576 ‐0.581 ‐0.578 ‐0.585 ‐0.972 ‐0.961(0.377) (0.373) (0.375) (0.369) (0.091) (0.095)
Relativesize 0.522 0.490 0.521 0.489 0.469 0.458(0.000) (0.000) (0.000) (0.000) (0.000) (0.000)
1ifequityfinanced 1.297 1.260 1.294 1.255 1.034 1.031(0.141) (0.153) (0.140) (0.154) (0.243) (0.245)
1ifdiversifyingdeal 0.229 0.230 0.229 0.230 0.177 0.176(0.378) (0.376) (0.378) (0.377) (0.487) (0.491)
Targetindustryliquidity ‐0.096 ‐0.094 ‐0.096 ‐0.095 ‐0.124 ‐0.123(0.435) (0.444) (0.434) (0.440) (0.296) (0.302)
1ifsubsequentdeal ‐0.031 ‐0.032 ‐0.030 ‐0.031 0.030 0.017(0.922) (0.919) (0.924) (0.922) (0.928) (0.959)
Constant 9.340 9.401 9.348 9.419 10.234 10.206(0.018) (0.018) (0.018) (0.018) (0.002) (0.002)
Yearfixedeffects Yes Yes Yes Yes Yes YesFirmfixedeffects Yes Yes Yes Yes Yes YesR2(%) 19.23 19.14 19.21 19.13 18.82 18.76Totalnumberofobs. 6,230 6,230 6,230 6,230 5,745 5,745