QUALITY OF EARLY CHILDHOOD EDUCATION: A … QUALITY OF EARLY CHILDHOOD EDUCATION: A STUDY IN SIX...
37
1 QUALITY OF EARLY CHILDHOOD EDUCATION: A STUDY IN SIX BRAZILIAN STATE CAPITALS MARIA MALTA CAMPOS Researcher at the Educational Research Department, Fundação Carlos Chagas and Teacher on the Post-Graduate Program in Education: Curriculum; Catholic University of São Paulo [email protected] YARA LÚCIA ESPOSITO Researcher at the Educational Research Department, Fundação Carlos Chagas [email protected] ELIANA BHERING Researcher at the Educational Research Department, Fundação Carlos Chagas [email protected] NELSON GIMENES Researcher at the Educational Research Department, Fundação Carlos Chagas [email protected] BEATRIZ ABUCHAIM Researcher at the Educational Research Department, Fundação Carlos Chagas [email protected] Translator: David Coles ABSTRACT This article presents results from a research on the quality of Early Childhood Education in Brazil that was conducted in a collaborative effort between Fundação Carlos Chagas, the Ministry of Educations and the Inter-American Development Bank. Data were collected in
Transcript of QUALITY OF EARLY CHILDHOOD EDUCATION: A … QUALITY OF EARLY CHILDHOOD EDUCATION: A STUDY IN SIX...

1
QUALITY OF EARLY CHILDHOOD EDUCATION: A STUDY IN SIX BRAZILIAN
STATE CAPITALS
MARIA MALTA CAMPOS
Researcher at the Educational Research Department, Fundação Carlos Chagas
and Teacher on the Post-Graduate Program in Education: Curriculum;
Catholic University of São Paulo
YARA LÚCIA ESPOSITO
Researcher at the Educational Research Department, Fundação Carlos Chagas
ELIANA BHERING
Researcher at the Educational Research Department, Fundação Carlos Chagas
NELSON GIMENES
Researcher at the Educational Research Department, Fundação Carlos Chagas
BEATRIZ ABUCHAIM
Researcher at the Educational Research Department, Fundação Carlos Chagas
Translator: David Coles
ABSTRACT
This article presents results from a research on the quality of Early Childhood Education in
Brazil that was conducted in a collaborative effort between Fundação Carlos Chagas, the
Ministry of Educations and the Inter-American Development Bank. Data were collected in

2
147 crèches and preschools in six state capitals, during the second semester of 2009. The
instruments applied for the observation of classes were the translated versions of the
Infant/Toddler Environment Rating Scale–Revised Edition and the Early Childhood
Environment Rating Scale–Revised Edition. Questionnaires for principals and for teachers of
the observed classes were also applied. The main results are: crèches and preschools average
scores were in the basic level; the lowest scores received were related to Activities (crèche
and preschool), Personal care routines (crèche), and Program structure (preschool); if
changes were promoted in some of the institutions characteristics, those scores could be
significantly improved.
EARLY CHILDHOOD EDUCATION – DAY NURSERIES – PREPRIMARY EDUCATION –
QUALITATIVE EVALUATION
Towards the end of the twentieth century there had been major changes in education
for the under-sevens in Brazil, both as to the expansion of the number of children attending
school and as to the legal and institutional framework. There had been increased access to
crèches and pre-school institutions for the under-sevens ever since the 1970s, driven both by
social processes – urbanization, economic growth, social struggles, changes in women’s role
in society – and by public policies in the fields of education, social welfare, health and labor.
New legal frameworks brought in by the Federal Constitution of 1988 reinforced and
legitimized these processes. Municipalities were given the responsibility of providing this
education with priority, which accelerated a trend that had been taking shape in the previous
period.
In turn, the new legislation showed that there were changes that needed to be
encouraged and demanded of the educational systems, such as the need for higher education
courses to train teachers for early childhood education, just as was demanded for primary
school teachers.
However, the major change brought in by the new legislation was undoubtedly the
inclusion of crèches within the education sector, since early childhood education was now
defined as the first stage of basic education, encompassing crèches for the 0-3 year-old age
group, and pre-school for the 4 to 6-year-olds.
Although it was not made mandatory, childhood education was defined as a right
enjoyed by children and families, and the State was obliged to provide it in accordance with

3
demand. Municipal governments were thus under pressure, even from the judicial system, to
increase the number of places for early childhood education.
As of the first decade of the twenty-first century, a number of changes in legislation
and in educational policy boosted this trend toward the growth and recognition of the
importance of this educational stage. With the setting-up of the Basic Education Funding
System (Fundo de Manutenção e Desenvolvimento da Educação Básica e de Valorização do
Magistério – FUNDEB) to replace the previous Primary Education Funding System (Fundo
de Manutenção e Desenvolvimento do Ensino Fundamental e de Valorização do Magistério –
FUNDEF), itself created in 1996, soon after the enactment of the General Law of Education
(Lei de Diretrizes e Bases da Educação Nacional – LDB), the funding of crèches and pre-
schools was for the first time laid down in law, alongside the other stages in basic education.
Despite that difficulties have been accompaning and still accompany the process of
including this stage within the educational sector, crèches are slowly finding their own space
within municipal educational systems, now that they are included within in-service training
programs, pedagogical supervision, curriculum reformulations, and in programs for school
meals and the distribution of learning materials, among other measures.
Several teacher training programs (such as Proinfantil) have been set up at all three
levels of government (municipal, state and federal) for the lay teachers who made up the
largest contingent of people employed in crèches. This effort has borne fruit, as statistics
show. However, the so-called “auxiliaries” are still employed in school systems. The same
levels of training are not required of them although they are often the people who spend the
longest time with the children in full-time institutions. This problem has not yet been suitably
solved by teacher-training policies.
Access to educational institutions has grown steadily and significantly since 1998.
According to the Applied Economic Research Institute (Instituto de Pesquisa Econômica
Aplicada – IPEA, 2009), using data from the National Household Sampling Survey (Pesquisa
Domiciliar por Amostra de Domicílio – PNAD), the rate of children attending crèches
doubled from 1998 to 2008, reaching 18%, and pre school attendance among four to six-year-
olds rose 40%, to 80%, including children enrolled in primary school. However, as the same
report points out, this access to schooling is unequally shared among the population.

4
The Mid-West, South and South-East regions of Brazil have a higher growth rate,
among 0 to 3 year-olds, than the other regions, and virtually doubled their rates of attendance.
All regions grew significantly in the 4 to 6-year-old age bracket.
There is still a huge gap between urban and rural areas in early childhood education
coverage, above all in the case of crèches, with no more than 7.2% coverage in rural areas.
Grouping the population by per capita income, the highest growth was among the 3rd and 4th
fifths of the population, which doubled their coverage rates in crèches. White children
continue to enjoy greater access to childhood education than black and mixed-race children.
Thus progress in early childhood education has been very uneven over the last two
decades, when different ages and social, cultural and political situations in Brazil are taken
into account. This continued development depends on complex processes, which may suffer
setbacks, and have very little public visibility. The survey reported in this paper came face-to-
face with a national situation that is undergoing continuous intense changes that do not always
pull in the same direction, and that are interpreted in a number of ways at local level.
The study in question is entitled Early childhood education in Brazil: a qualitative and
quantitative evaluation1, conducted by Fundação Carlos Chagas (FCC) in partnership with the
Ministry of Education and Culture – MEC, and the Inter-American Development Bank – IDB.
The study took into consideration the history of early childhood education in Brazil up until
the first decade of this century, and the state of knowledge about this educational stage, and
made the following assumptions:
• there has been an increase in the provision of early childhood education in recent
years, but this expansion has not always been accompanied by suitable quality
standards;
• although MEC has developed National Quality Standards for Early Childhood
Education, most early childhood education institutions have only partially
implemented them;
• the quality of provision of early childhood education is variable and depends on
institutional characteristics of the school in question (such as whether it is a public,
1 The study was coordinated by Maria Malta Campos, and the following team of researchers: Yara Lúcia
Esposito, Eliana Bhering, Nelson Gimenes, Beatriz Abuchaim and Sandra Unbehaum (Campos, coord., 2010).

5
private, public, private or private with some state support-community philanthropic
and faith institutions),
• the positive impact of early childhood education on primary education is greater when
the service provided is of suitable quality.
These assumptions enabled the three main objectives of the study to be outlined, as
follows.
1. To evaluate the quality of 150 early childhood education institutions in six State
capitals of Brazil, namely: Belem, Campo Grande, Florianopolis, Fortaleza, Rio de
Janeiro and Teresina.
2. To estimate the impact of attending crèches and pre-schools on students’ performance
in the early years of primary school2.
3. To describe the municipal policy for early childhood education for each of the six
capitals mentioned3.
This article will focus on the results obtained in response to the objective4.
REVIEW OF LITERATURE
The definition of quality in education and the selection of criteria to enable quality
measures are topics constantly being discussed in the educational field. In early childhood
education this is a hot topic and the specialized publications have harbored several different
positions.
Actually, the debate on quality in education has followed a different path in early
childhood education, when compared with other educational levels. In primary and secondary
school the debate has become indistinguishable from disputes about the introduction of
2 Data on the study are available in Campos et al., 2011. 3 The financing of early childhood education in the six state capitals, a study carried out within the scope of the
same project, is the subject of an article by Marcos Bassi in this number. 4 The Final Report on the study is available for consultation in the Fundação Carlos Chagas library (Campos,
coord., 2010) and on this website: www.fcc.org.br.
6
centralized, quantitative, student performance assessment systems, adopted in many countries
including Brazil as of the 1990s (Campos, 2000).
The different trajectories of crèches and pre-schools have led to concepts of quality
focusing on children’s rights. In the case of crèches especially, social movements fighting for
women’s rights eventually recognized that gains in quality would only be obtained insofar as
the education focused primarily on the developmental needs of young children. This concern
led to several initiatives aiming at spreading concepts of early childhood education that aimed
to distance themselves both from the custodial welfare model and from the school model5.
This is a debate that is still very much alive and open among specialists in this area. In
the present study, the starting-point we have adopted acknowledges, as many authors point
out (including the document entitled ‘National Quality Parameters for Early Childhood
Education’ – Parâmetros Nacionais de Qualidade para a Educação Infantil), that
...quality: 1. is a socially constructed concept, subject to constant negotiation; 2. is context-dependent;
3. is based on rights, needs, demands, knowledge and possibilities; 4. the definition of quality criteria
has been constantly challenged by these different perspectives. (Brasil, 2006, v. 1, p.24)
This definition of quality therefore includes a consideration of: the rights of children,
women and families that are upheld in the legislation and in the commitments that Brazil has
undertaken at an international level; the range of needs of small children, taking their age
group into consideration; their families’ living conditions, the cultural characteristics of their
environment, and their individuality; social pressures demanding support for families, for the
employment and social participation of women, and for early childhood education; the
knowledge accumulated by science in the fields of education, psychology, health sciences and
social science; and the real possibilities of agencies responsible for the management of early
childhood education and of society as a whole in turning these demands into reality.
Several current indicators enable information to be obtained on the working of the set
of early childhood education institutions in Brazil, and although they cover only a few of the
quality aspects of teaching establishments, they enable a preliminary approach to be made to
this reality. The studies show that differences in quality combine with social and regional
5 See the document containing quality criteria for crèches, initially published by MEC in 1995 (Campos;
Rosemberg, 2009).

7
differences; in other words, the quality of education, like access itself, is distributed unequally
across different segments of the population.
For example, a study by Kramer and Kappel (2000), based on PNAD data, showed
that the material conditions of private crèches and pre-schools are markedly better than those
found in the public school system: “more private institutions have books, texts, videos,
televisions, computers and laboratories” (2000, p. 83).
Data compiled by UNICEF on expenditure by student/year in the public early
childhood education system in 1999 also reveal major regional disparities: while this
expenditure was 1,269 Reals (Brazil’s currency) in the South-East, it was 560 Reals per
student annually in the North-East (Unicef, 2005, p. 69). In the same report, data on the
working conditions of crèches and pre-schools showed that while works of literature could be
found in 76.7% of crèches and 89.8% of pre-schools in the South-East, percentages for the
North-East were 37.2% and 46.3% respectively. Specialized literature shows the importance
of small children coming into contact with children’s books even before they have learned
how to read. Most of the children enrolled in early childhood education institutions in the
North-East do not have this opportunity (p. 71-72).
From the perspective of the curriculum and the pedagogical guidance adopted in early
childhood education, the working conditions and working methods adopted with the children
are heterogeneous, and this has repercussions on the quality of schooling provided, with
crèches generally being in a worse situation than pre-schools (Unesco/OECD, 2005). In many
regions, crèches are still in the process of being incorporated into educational systems,
particularly in the case of private establishments in poorer neighborhoods, both those that
receive some public support and those that are fully private and thus escape the supervision of
educational agencies.
A review of studies published between 1996 and 2003 using empirical data on the
quality of crèches and pre-schools classified the major problems by the following dimensions:
training of staff; curriculum; pedagogical practices; infra-structure conditions; and relations
with families (Campos, Füllgraf; Wiggers, 2006). In the several aspects taken into
consideration:
The crèches always appear in a more precarious situation, both in regard to staff training and to material
infrastructure, adopting rigid routines nearly exclusively based on feeding, cleaning and controlling the
children. Comparatively speaking, better conditions are observed among pre-schools in terms of staff
8
training and material infra-structure. Routines, while still very inflexible, focus on schooling activities.
Both institutions face difficulties as far as communication with family is concerned. In turn, families are
often seen by crèche and pre school profissionals from negative and prejudice perspective. (Campos;
Füllgraf; Wiggers, 2006, p. 117-118)
These and other conclusions of the survey approach the problems observed during the
visit of the Unesco/OECD Commission to Brazil as part of the comparative study into early
childhood education in four countries: Brazil, Kazakhstan, Indonesia and Kenya
(Unesco/OECD, 2005, 2005a6.
One particularly serious issue is the “lack of concern about the educational program
carried out with the children”, pointed out both in the commission’s document and in the
article by Campos, Füllgraf and Wiggers (2006, p. 119). In fact, one of the major tasks of
early childhood education is to favor the full development of the child, including the learning
and mastery of new skills. Children who have the opportunity to go to a good early childhood
education institution are more likely to get good results in primary and middle school, as
recent Brazilian and international surveys have shown (Sylva et al., 2010). This advantage is
particularly important in a country like Brazil, where rates of school failure are still very high.
Two Brazilian studies (Carvalho, Pereira, 2008; Lima, Bhering, 2006) using the same
crèche quality evaluation instruments as the present study showed that quality in the education
of infants and toddlers, especially worring regarding personal care and activities available to
children.
The results of studies carried out in 21 early childhood education institutions in the
city of Rio de Janeiro in 2005 and 2006 are presented in a book organized by Sonia Kramer.
Seventeen institutions were public, two were community schools and two were private. The
texts in the book give detailed descriptions of the different aspects of the working of these
institutions, based on observations, interviews and a wide variety of records. The authors’
conclusions are:
The result provides important examples and interesting facets of these institutions’ daily routines for the
children. However, it makes a mirror that is sometimes hard to look into: what we see reflected in it is
the very image of what has not yet been achieved in practice, although it is the target of policies and of
6 Texts on this study were published in Portuguese by MEC and Unesco in 2009 (Brazil), 2009.

9
theoretical and empirical research. This image shows that there is still much work to be done to assure
quality in early childhood education as regards training, management and educational interventions.
(Kramer, 2009, p. 217)
The results of a longitudinal study carried out in the United Kingdom (Sylva et al.,
2010), although obtained in a very different context from Brazil, enable the characterization
of quality in early childhood education, since many of its conclusions are borne out by studies
carried out in other countries. The major findings of the study in its initial stages are
summarized below:
• pre-school experience, compared with none, favors the child’s development. These
effects are still clear in intellectual and social development in the first years of primary
school;
• the duration of attendance (in months) is important, and commencement before three
years of age correlates with greater intellectual development at the ages of 6 and 7 and
with an improvement in autonomy, concentration and sociability at entry into primary
school at 6 years of age;
• full-time attendance does not lead to better results for the children, compared with
part-time attendance;
• poorer children in particular may derive significant benefit from a quality pre-school
experience, above all if they attend centers receiving a population of heterogeneous
social origin;
• the quality of pre-schools is directly linked to enhanced results in the children’s
intellectual and socio-behavioral development, and these effects persist in assessments
carried out at six years and over;
• centers with more qualified staff, above all those with a good proportion of trained
teachers, are of a better quality and their children show greater progress (Sylva et al.,
2003, 2004, 2004a).
Analysis of the educational practices of the daily routine of 150 early childhood
education institutions in six State capitals of Brazil representing the country’s five
geographical regions enabled the present study to explore on a wider scale aspects of ECE
quality already identified in the previous studies. The challenge we faced was to investigate in

10
a systematic and detailed fashion the conditions of the institutions and environments in which
the children receive schooling, including staff in those units, since these conditions are what
provide children with a greater or smaller opportunity for the development and learning.
The premise we adopt is that attending a quality crèche or pre-school makes a
difference in the children’s lives, not only in the positive effect on their later school career,
but above all with regard to the nature of the experience they undergo during their time in
these institutions, enabling full experience of their childhood and increasing their chances of
understanding and interacting with the world around them and their fellows.
METHODOLOGY7
Sample
The six state capitals included in the sample were defined by MEC so as to cover all
the different regions of Brazil: Belem, Teresina, Fortaleza, Campo Grande, Rio de Janeiro and
Florianopolis. Institutions in each capital were chosen from the 2008 School Census database
made available by MEC/INEP, taking the following set of variables into consideration: the
institution’s administrative profile; the type of establishment; number of students; working
hours; location in neighborhoods/districts and average Education Development Indicator
(Indicador de desenvolvimento da educação – IDEB) for primary and middle schools located
near the early childhood education institutions.
The classes to be observed were selected by random draw in each institution, one with
children at daycare age and one with children at pre-school age, making up a total of 229
classes. Table 1 shows the number of crèche and pre-school classes evaluated in each of the
six cities. 147 institutions were evaluated8, 102 (69.4%) of which were municipal, 22 (15.0%)
private, and 23 (15.6%) were private with some state support. With regard to the type of
educational service provided, 93 (63.3%) exclusively schooled early childhood education
students and 54 (36.7%) catered for children from other stages of schooling.
7 We wish to thank statisticians Raquel Valle and Miriam Bizzocchi for their cooperation in this study. 8 Three instituitions were lost from the 150 initially planned for.

11
TABLE 1 NUMBER OF PARTICIPATING INSTITUTIONS FROM DIFFERENT SECTORS
Administrative profile
Cities Municipal
Private with some state
support Private Total
Belem 9 3 7 19
Campo Grande 25 5 0 30
Florianopolis 23 7 0 30
Fortaleza 9 1 10 20
Rio de Janeiro 10 3 5 18
Teresina 26 4 0 30
Total 102 (69.4%) 23 (15.6%) 22 (15.0%) 147 (100%) Source: Campos (coord) 2010.
Instruments
Instruments for observation in classrooms/groups of children
Special attention was needed for choosing and adapting the observation check lists,
since these instruments were intended to meet several criteria, such as: to be coherent with
official Brazilian documents containing curriculum guidance, parameters and quality
indicators9 for crèches and pre-schools; to be sufficiently detailed as to enable quality
evaluation, taking a broad range of aspects into consideration, covering the major early
childhood education quality dimensions identified in the literature; and to feasibly enable
adaptation to the goals of the survey within the planned time frame.
The following scales were selected after a literature survey: the Infant/Toddler
Environment Rating Scale–Revised Edition – Iters-R10 (Harms, Clifford, Cryer, 2003 – and
the Early Childhood Environment Rating Scale–Revised Edition – Ecers-R11 (Harms, Cryer,
Clifford, 1998). They are well-known and applied internationally12 as evaluation instruments
for the quality of early childhood education institutions. The scales were constructed for use
in observing and rating environments and/or programs intended for children from zero to two
9 The document entitled Quality Indicators in Early Childhood Education (Indicadores de qualidade na
educação infantil Brasil, 2009) was published after the study had commenced. 10 Iters-R was translated into Portuguese by Campos-de-Carvalho and Bhering (2006). 11 Ecers-R was translated into Portuguese by Abreu-Lima et al. (2008). We used an adaptation into Brazilian
Portuguese for this study (see Harms, Clifford, Cryer, 2009; Harms, Clifford, Cryer, 2006). 12 See Tietze et al. among others (1996) and Loeb et al. (2004).

12
and a half years of age (Iters-R) and from two years and seven months to five years (Ecers-R)
in the presence of the teacher responsible.
Their check lists contain aspects that include the major quality criteria adopted by
Brazilian official documents. The target age groups closely correspond to those served in
Brazil by crèches and pre-schools. Covering a wide range of situations, they also have
application manuals and videos for the guidance of users. These scales have also been used in
studies published in Brazil, and proved suitable for the situations found in Brazilian
institutions (Souza, Campos-de-Carvalho, 2005; Lima, Bhering, 2006; Carvalho, Pereira,
2008). The two observation instruments were translated into Portuguese and adapted to
Brazilian Portuguese.
The Iters-R has an observation script that includes seven sub-scales (Space and
furnishing; Personal care routines; Listening and talking; Activities; Interaction; Program
structure and Parents and staff) with 39 items made up of 455 indicators. The Ecers-R has a
script that also includes seven sub-scales (Space and furnishing; Personal care routines;
Language-Reasoning; Activities; Interaction; Program structure and Parents and staff) with 43
items made up of 470 indicators. Items on both scales may be scored from 1 to 7 points,
where 1 corresponds to an inadequate quality level, 3 is the minimum, 5 is good and 7 is
excellent. The average of the points scored for the set of items making up each of the seven
sub-scales indicates the institution’s level of quality in schooling. In the survey entitled ‘Early
Childhood Education in Brazil: a qualitative and quantitative evaluation’ – Educação infantil
no Brasil: avaliação qualitativa e quantitativa, the total points score for the scale, the sub-
scales and the items comprising them was transformed so as to become a scale from 1 to 10
points, the classification for which is shown in Chart 1.
CHART 1
POINT-SCORING AND CLASSIFICATION CRITERIA ADOPTED IN THE STUDY
Source: Campos (coord.) 2010
Rating Score
Inadequate 1 |-------3
Basic 3 |-------5
Adequate 5 |-------7
Good 7 |-------8.5
Excellent 8.5|-------10

13
The subscales are made up of items assessing a range of aspects in the crèche and pre-
school environments. The seven sub-scales of the Iters-R and Ecers-R scales deal with:
1. Space and furnishing: a set of indicators enabling classification of aspects such as state
of maintenance, level of comfort, degree of safety, accessibility to children with
disabilities, and suitability of the environments and equipment designed to stimulate
the children’s learning, independence and development;
2. Personal care routines: the six items are primarily related to routine personal care
procedures that promote the children’s health, safety and welfare;
3. Listening and talking (Iters-R) and Language – Reasoning (Ecers-R): these contain
three items assessing the stimuli children receive to develop their language skills. This
includes verbal communication (both speaking and listening), the use of books, and
the development of reasoning through language;
4. Activities: evaluates activities provided for children and the materials for these
activities. The quantity, suitability, and variety of the materials are considered, as well
as for how long they are available for the children’s use;
5. Interaction: the quality of interactions among the children, and between children and
adults is one of the aspects evaluated. The type of discipline and the modes of
oversight adopted by the team are also observed;
6. Program structure: the focus is on evaluation of the rhythm of the daily schedule,
including personal care routines, and free and group activities. The program is also
assessed for its flexibility in meeting the individual needs of the children, respecting
their wishes and interests and the institution’s ability to include disabled children;
7. Parents and Staff: the strategies used by the institution to meet the personal and
professional needs of the staff and to involve parents in the program. Emphasis is
given to relations between staff members, and between the staff and children’s
parents.
Questionnaires for staff at early childhood education institutions
The questionnaires were used in order to gather information about the institutions and
professionals working there, as described below:
14
• Institution Description Questionnaire (118 questions) and Questionnaire for the Director
(121 questions with varying formats): instruments that describe a wide range of issues
concerning the management of the institution;
• Questionnaire for the supervisor (123 questions): a research instrument given to the
professional responsible for pedagogical guidance activities, when there is one working at
the institution. To overcome issues when there is no pedagogical surpervisor or similar
professional at the institution, many pedagogical aspects were also included in the questions
for the Director;
• The Questionare for the Teacher (168 questions): a research instrument answered by the
person responsible for classes at the crèche or pre-school that was selected to be a part of
the sample for the early childhood education quality study. The aim of this questionnaire
was to gather data about the teacher’s profile and to cover aspects of the daily routine of
crèches and pre-schools that could not be covered by direct observation.
Field work
Six field work teams of five or six researchers were created for the study, coordinated
locally by teachers13 from the local Federal Universities (Universidade Federal do Pará;
Universidade Federal do Ceará; Universidade Federal do Piauí; Universidade Federal do Rio
de Janeiro; Universidade Federal de Mato Grosso do Sul; Universidade Federal de Santa
Catarina).
Each researcher visited five or six institutions, staying for at least three or four days in
each, during which time they gave out the questionnaires to the professionals. In the end, 147
institutions took part in the survey, as shown in Table 2.
Not all institutions catered to the two different age-brackets, which explains the
different numbers of classes observed in each capital. In total, 91 crèche classes (0 to 3 years)
and 138 pre-school classes (4 to 5 years) were evaluated.
13 The local researchers coordinating the field research were: Ana Maria O. Tancredi Carvalho, in Belem; Regina
A. Marques de Souza, in Campo Grande; Jodete B. G. Füllgraf, in Florianopolis; Silvia H. Vieira Cruz, in
Fortaleza; Eliana Bhering, in Rio de Janeiro and Olivette R. B. Prado Aguiar, in Teresina.

15
TABLE 2 DETAILS OF THE NUMBER OF INSTRUMENTS APPLIED, BY CAPITAL
SCALES QUESTIONNAIRES
Cities Expected number
Participations institutions ITERS-R ECERS-R
Creche teachers
Pre school teachers Director
Institution profile supervisor
Belem 20 19 4 19 4 19 19 19 12 Campo Grande 30 30 19 28 19 28 30 30 13
Florianopolis 30 30 30 30 29 30 29 29 22
Fortaleza 20 20 12 16 12 16 20 20 9 Rio de Janeiro 20 18 7 15 7 15 18 18 16
Teresina 30 30 19 30 19 30 30 30 22
Total 150 147 91 138 90 138 146 146 94 Source: Campos (coord.) 2010
THE EVALUATION OF CRÈCHES AND PRE-SCHOOLS
Crèches
91 classes in crèches were observed in the six capitals. The means for the ‘Activities’
(2.2) and ‘Personal care routines’ (2.9) subscales (Graph 1) are the lowest and indicate
Inadequate quality. The means for the ‘Space and furnishing’ (3.1), ‘Listening and talking’
(3.8) ‘Program structure’ (3.2) and ‘Parents and staff’ (3.6) subscales are of Basic quality. The
‘Interaction’ subscale received the highest mean score (5.7), achieving Adequate quality.
GRAPH 1 OVERALL MEAN AND MEANS FOR SUB-SCALES OF THE ITERS-R SCALE – CRÈCHES
3,1
4,1
3,7
2,3
5,6
2,5
3,6
3,4
1 2 3 4 5 6 7 8 9 10
I. ESPAÇO E MOBILIÁRIO
II. ROTINAS DE CUIDADO PESSOAL
III. LINGUAGEM E RACIOCÍNIO
IV. ATIVIDADES
V. INTERAÇÃO
VI. ESTRUTURA DO PROGRAMA
VII. PAIS E EQUIPE
MÉDIA GERAL NA ESCALA ECERS - PRÉ-ESCOLA
Overall mean for ITERSs
Source: Campos (coord) 2010.

16
On the ‘Personal care routines’ subscale, the items ‘Meals/snacks’, ‘Nap’ and ‘Health
practices’ were given Inadequate average scores14. Simple but very important habits like
washing one’s hands after toileting and/or diapering are included there.
Activities provided for the children, the materials available and the conditions of the
spaces were given worryingly low evaluations. The lowest averages (below 2 points) were
found in ‘Music and movement’; ‘Blocks’; ‘Nature/sciences’ and ‘Promoting acceptance of
diversity’. It should be pointed out that a rating of Inadequate means that in the average for
classes observed no material was found to be available for the activities in that area of the
curriculum, such as pictures books, materials or objects related to that item.
The absence of books in the classes is also worrying. For this item, part of the
Listening and talking subscale, the average score was 1.5. Specialized literature shows the
importance of young children being given the chance to handle books as part of their reading
and writing learning processes.
After applying the same scale to 12 crèche classes in a town in the state of Santa
Catarina, Lima e Bhering (2006, p. 585) found that the lowest scores were also obtained in the
‘Personal care routines’ and ‘Activities’ subscales. Carvalho e Pereira (2008, p. 274),
applying the Iters-R scale in 16 early childhood education institutions in one town, found that
the lowest average score was obtained in the ‘Personal care routines’ subscale, and noted the
lack of attention paid to procedures like washing children’s hands and hygiene when changing
diapers.
On the ‘Interaction’ subscale, which obtained the highest average score, as it did in
these two other surveys, the item with the highest evaluation was ‘Peer Interaction’. In this
case it seems that adults encourage relations between peers, which is a positive characteristic.
Averages obtained on the Iters-R Scale in the crèches observed in each capital are
shown on Graph 2. Although Florianopolis and Rio de Janeiro have the highest point scores,
this is only for the ‘Basic’ quality level, and there are no statistically significant differences
between the averages in these two cities. The other averages are Inadequate.
14 In an appendix there are Tables (one for the Iters-R Scale and the other for the Ecers-R Scale) with the points
obtained for each item on the sub-scales.

17
GRAPH 2
OVERALL MEAN ON THE ITERS-R SCALE - CRÈCHES, BY CAPITAL
Source: Campos (coord.) 2010.
Analysis of these scores differences should be cautiously done, since the six state
capitals are very different in their social and economic situations, and this is reflected in the
data obtained by the survey concerning the financial resources available (Bassi, in this
number) and for the social development indicators for each capital.
Pre-schools
The Ecers-R Scale was applied in 138 pre-school classes in the six capitals studied.
The average scores for the subscales shown in Graph 3 range from 2.3 to 5.6 points. Average
scores for the ‘Activities’ (2.3) and ‘Program structure’ (2.5) subscales are rated Inadequate;
‘Space and furnishing’ (3.1), ‘Parents and staff’ (3.6), ‘Language reasoning’ (3.7) and
‘Personal care routines’ (4.1) rank as Basic; and only the ‘Interaction’ subscale (5.6) is
Adequate.
ITERS-R - MÉDIA GERAL
2,7
2,8
4,4
2,7
3,9
2,3
3,3
1 2 3 4 5 6 7 8 9 10
Belém
Campo Grande
Florianópolis
Fortaleza
Rio de Janeiro
Teresina
GRUPO TOTAL

18
GRAPH 3
OVERALL MEAN AND MEANS FOR SUB-SCALES OF THE ECERS-R SCALE – PRE-SCHOOL
3,1
4,1
3,7
2,3
5,6
2,5
3,6
3,4
1 2 3 4 5 6 7 8 9 10
I. ESPAÇO E MOBILIÁRIO
II. ROTINAS DE CUIDADO PESSOAL
III. LINGUAGEM E RACIOCÍNIO
IV. ATIVIDADES
V. INTERAÇÃO
VI. ESTRUTURA DO PROGRAMA
VII. PAIS E EQUIPE
MÉDIA GERAL NA ESCALA ECERS -
PRÉ-ESCOLA
Source: Campos (coord.) 2010.
As with the crèche classes, the aspects evaluated on the ‘Activities’ subscale obtained
the lowest averages. The only item receiving an average score above Inadequate was
‘Math/numbers’, with 3.3 (Basic). Of the set of items, ‘Nature/Sciences’ obtained the lowest
score (1.6). According to the Scale, the lowest score is awarded when “There are no
accessible games, materials or activities about nature/sciences” (adapted Ecers-R, p. 56). In
this case it seens that the children have had no possibility to develop their sensitivity and
knowledge about the environment, an increasingly important issue for future generations.
Since the subscale Activities refers to material available for the several areas of the
curriculum and respective activities, one may conclude that pre-school classes have limited
access to materials that could allow them to explore a range of experiences that small children
should be able to enjoy at this stage of their education, and that some meaningful areas are
being virtually neglected.
Observing points scored by item (see Appendix), it can also be seen that most of the
pre-school classes in the study failed to include temporal and spatial organization models that
would enable the children to be more independent, allowing them to choose between several
types of activity and working in small groups. This is reflected in items on the ‘Space and
19
furnishing’, and ‘Program structure’ subscales that were assessed as Inadequate: ‘Furnishings
for relaxation and comfort’; ‘Room arrangement’; ‘Space for privacy’; ‘Scheduling’ and
‘Group time’. There also seems to have been little opportunity in the pre-school classes for
play and activities involving gross motor skills: these items – ‘Gross Motor Equipment’,
‘Sand/water’ and ‘Dramatic play’ – were also rated Inadequate.
As was the case in the crèche classes, the highest average scores for the pre-school
classes were in the ‘Interaction’ subscale (5.6 – Adequate). This aspect deserves to be more
widely explored in the Brazilian context. A study conducted in California and Florida using
other types of observation instruments apart from the Ecers-R scale identified the effects of
social interactions between adults and children on child development, both on the cognitive
and on the behavioral dimensions (Loeb et al., 2004, p. 62). Another study of 2,400 four-year-
olds in eleven US states using the Ecers-R, found that
...the quality of affective interactions was not associated with the development of academic and
language skills, but the quality of instructional interactions was positively associated with the five
measures of academic and language skills [adopted in the study]. (Mashburn et al., s.d., p. 25)
An analysis of the items making up the subscales shows some important quality
dimensions in the institutions evaluated in the six capitals. This analysis shows that in the
crèches and pre-schools that obtained the highest scores there was a greater likelihood of
supervision being adequate when the children were sleeping; of the children being familiar
with safety rules; of there being a good balance between speaking and listening; of not
working mechanically and repetitively on mathematics; of individual expression being more
respected; of toys, materials, equipment and clothes being more available for children to play
make-believe; of there being a larger amount of material for fine motor skills; of the children
not having to wait a long time between daily activities, and of there being greater opportunity
for the children to choose their partners in games and activities.
Graph 4 shows that the average for the total set of institutions in the cities was 3.4
points, which is equivalent to a Basic level of quality (a range from 3 to 5 points); but that in
two cities the averages were Inadequate.

20
GRAPH 4 GENERAL MEAN ON THE ECERS-R SCALE – PRE-SCHOOL, PER CAPITAL
Source: Campos (coord.) 2010.
In a city-by-city analysis it can be seen that pre-schools in Florianopolis achieved the
best results and the lowest average was found in Fortaleza, followed by Teresina and Belem.
As has been said, these results must be assessed within the social and economic context of
each city.
The data gathered about municipal policies showed that they had followed very
different paths with regard to the organization of early childhood education systems. To
which extent priority is given to full-time attendance; age-groups attended in the public
sector; types of support given to non-public institutions; – these are some facets of the diverse
range of situations.
This situation makes any comparison between the results of quality measurements
between public, private and semi-private institutions very complex, although that was one of
the aims of the study. Small differences were found in certain aspects, but owing to the
heterogeneity of situations observed in each of these segments, any generalizations based on
the sample defined for this study would be risky.
FACTORS ASSOCIATED WITH MEASURES OF QUALITY IN EARLY
CHILDHOOD EDUCATION
This part of the study sought to find which features of the institutions that were
evaluated (such as infrastructure conditions, staff profile, and characteristics of the region
where the crèches and pre-schools were located) could be proved to be associated with the
ECERS-R - MÉDIA GERAL
3,2
3,6
4,7
2,2
3,6
2,7
3,4
1 2 3 4 5 6 7 8 9 10
Belém
Campo Grande
Florianópolis
Fortaleza
Rio de Janeiro
Teresina
GRUPO TOTAL

21
variations in the scores obtained on the early childhood education quality evaluation scales.
The procedure adopted was Multiple Regression Analysis.
In applying this technique to crèches, the score obtained by applying the Iters-R scale
was used as the response variable, and in the case of pre-schools the response variable was the
score obtained by using the Ecers-R scale. Indicators constructed on the basis of the analysis
of information obtained from the questionnaires given out by the researchers in the
institutions that were assessed were used as explanatory variables15 . Some data characterizing
the institutions from the Census of Schools 2008 (Censo escolar de 2008 Brasil, 2008) and
other indicators of the Census of 2000, from the FIBGE database (Brazilian Demographic and
Statistical Institute Foundation – Fundação Instituto Brasileiro de Geografia e Estatística)
were used as explanatory variables for demographic and socio-economic characterization of
the neighborhoods where the early childhood education institutions visited are located.
Since the set of explanatory variables to be taken into consideration was very large,
the “Forward” method was used to select the variables for inclusion in the analysis model.
The set of explanatory variables investigated in the models for studying the quality of crèches
and pre-schools results from a pre-selection of the most interesting variables from a
pedagogical perspective, and was arrived at by means of descriptive statistical techniques.
This set of variables included information about the type of schooling offered, the
administrative profile, the working hours and the size of the institution; the infra-structure, the
institution’s supplementary and basic equipment, school transport and the family allowance;
information about the training of the director and about remuneration and institutional
procedures; information about the training, contractual situation and pedagogical practice of
teachers; and data from the 2000 Census about the percentage of children in the neighborhood
aged 0 - 3 and 4 - 6, the average monthly income of the heads of household and the
percentage of heads of household in the neighborhood who had from 0 to 7 years of
schooling.
15 The Coordinator’s questionnaire was not used since not all the institutions employed a professional in this
capacity.

22
Results for crèches
The Forward process for selecting variables included nine variables in the model. Two
variables had more than two response categories: the teacher’s age and the director’s gross
income. Thus an intermediate step before the final adjustment of the regression model was to
see whether the number of categories for these variables could be reduced. Contrasts were
carried out, comparing the categories of the variables two by two. It was thus found that the
two first categories of the teacher’s age variable could be grouped together, as could the
second and third categories of the director’s gross salary. After final adjustment to the
regression model the estimates shown in Table 3 were obtained.
TABLE 3
ESTIMATES (AND STANDARD ERRORS) FOR PARAMETERS FOR THE REGRESSION MODEL ADJUSTED FOR STUDYING CRÈCHE QUALITY
Variables Categories Estimates (e.p.) p-value
Intercept 4.904 (0.525) < 0.0001
Census of Schools 2008
Only ECE 0.783 (0.334) 0.0217 Service provided
ECE and BE 0 –
Institution description questionnaire
Fewer than 5 classrooms -0.571 (0.227) 0.0141 Infrastructure
5 or more classrooms 0 –
Up to 8 pieces of supplementary
equipment
-0.664 (0.244) 0.0081
Supplementary equipment
More than 8 0 –
No -0.465 (0.254) 0.0708 School transport
Yes 0 –
Director’s Questionnaire
Up to 4 minimum wages -1.416 (0.412) 0.001
From 4 to 9 minimum wages -0.835 (0.387) 0.0344 Gross salary
Over 9 minimum wages 0 –
Yes -0.632 (0.220) 0.0054 Guaranteed enrollment for children
of staff No 0 –
Teachers’ Questionnaire
Up to 44 years old. 0.973 (0.269) 0.0005 Age
45 or over 0 –
Up to 8 activities daily -0.434 (0.207) 0.0395 Frequency of activities carried out
with children Over 8 daily 0 –
IBGE
From 0 to 7 years of schooling -0.013 (0.006) 0.0312
Source: Campos (coord.) 2010

23
Interpretation of the data shown in Table 3 allows it to be stated that the crèches with
the best quality measurements share the following characteristics:
• They operate in establishments catering exclusively to children from early childhood
education; they have a better infrastructure (five or more classrooms or spaces) and have a
larger number of pieces of supplementary equipment and/or resources (more than eight).
• They cater to children who use some form of school transport.
• Enrollment of the children of staff is not automatically assured.
• The gross salary of the director is over R$ 4,186.00 (over nine times the minimum wage).
• The teachers are younger (up to 44 years of age) and report that they carry out a set of
activities with the children on a daily basis (more than eight daily activities).
• They are located in neighborhoods with a low percentage of heads of household with fewer
than seven years’ schooling.
A simulation of the quality expected of a crèche with all the characteristics listed
above, in other words, a crèche achieving the best conditions in all the variables, showed that
the score on the Iters-R scale would be 6.56.16 Analogously, for the worst scenario, the
average quality expected would be 0.07.17 It should be remembered that the measurement of
quality of the crèche obtained by applying the Iters-R scale was on a scale of 1 to 10 points.
However, the expected values obtained on the basis of an adjusted model do not necessarily
follow the same variation, as can be seen in the calculation of the best and worst scenarios.
When a regression model is adjusted, another relevant item of information is knowing
how important each of the selected variables is. This importance is measured by the reduction
of variability provoked by the inclusion of the variable in the model.
Thus in order to identify the variables that had the greatest influence on the quality of
the crèche, the starting-point is the final model (with all the variables) and then another nine
models are adjusted, each one by removing only one of these variables. The reductions in
variability caused by the entry of each variable were assessed.
16 A value of 7.91% was used for the variable zero to seven years’ schooling, corresponding to the lowest
percentage observed for the crèches evaluated in the study. 17 In this case 50% was taken as the variable for schooling from zero to seven years.

24
The value for the reduction is calculated by the difference between 1 (or 100%) and the
ratio between the complete model (0.8350 in this particular case) and the variance of the
model without the variable being evaluated. The results of this procedure are presented in
Table 4.
TABLE 4
RESIDUAL VARIANCE OF THE REGRESSION MODEL: THE STUDY OF CRÈCHE QUALITY
Variable excluded from the model Variance Reduction in
variability
Complete Model 0.8350
2008 Census
Provision 0.8884 6.00%
Institution description questionnaire
Infrastructure 0.8963 6.80%
Supplementary equipment 0.9067 7.90%
School transport 0.8676 3.80%
Director’s Questionnaire
Gross salary 0.9835 15.10%
Guaranteed enrollment for children of staff 0.9148 8.70%
Teachers’ Questionnaire
Age 0.9528 12.40%
Frequency of activities carried out with children 0.8776 4.90%
IBGE
From 0 to 7 years’ schooling 0.8818 5.30%
TOTAL 70.90%
Source: Campos (coord.), 2010.
The data in Table 4 show that the variables with the greatest impact on the
measurement of crèche quality are the director’s salary and the teachers’ ages, accounting
respectively for 15.1% and 12.4% of the reduction in variability. All the variables taken
together explain 70.9% of the differences observed in the ‘crèche quality’ response variable.
Pre-school results
As with crèches, the same set of indicators and the same analytical procedure were
used, except for the response variable, since the results are now obtained using the Ecers-R
25
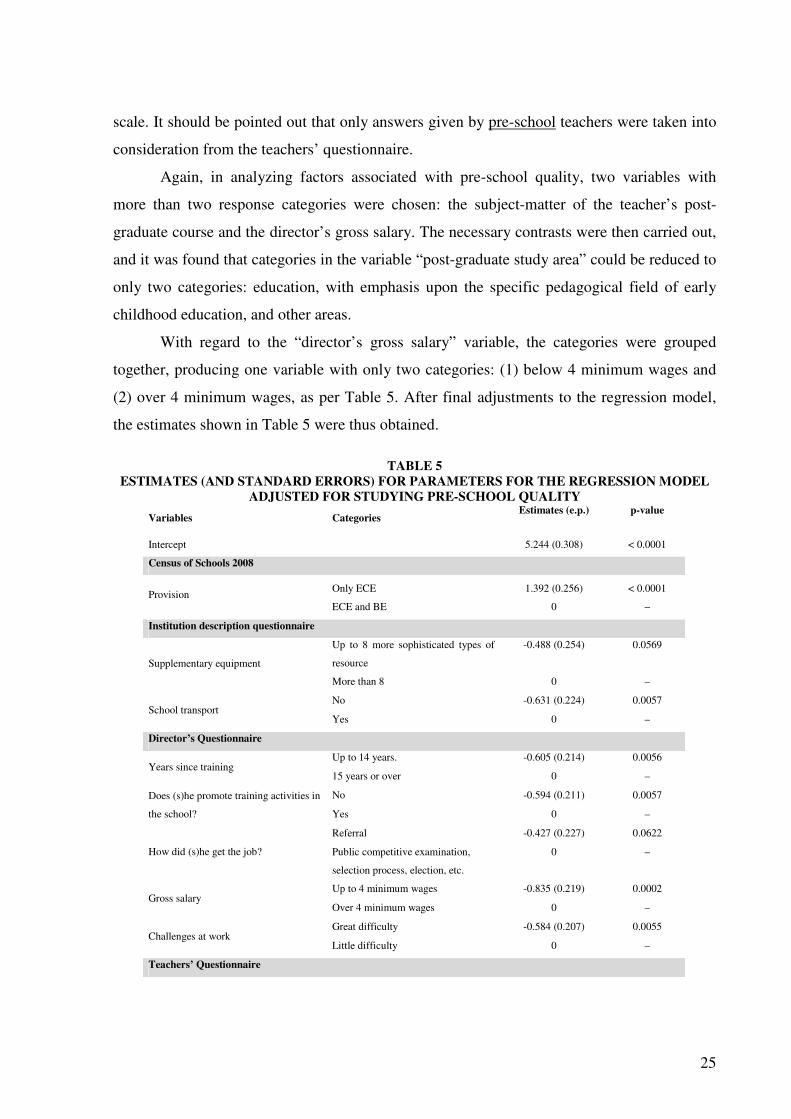
scale. It should be pointed out that only answers given by pre-school teachers were taken into
consideration from the teachers’ questionnaire.
Again, in analyzing factors associated with pre-school quality, two variables with
more than two response categories were chosen: the subject-matter of the teacher’s post-
graduate course and the director’s gross salary. The necessary contrasts were then carried out,
and it was found that categories in the variable “post-graduate study area” could be reduced to
only two categories: education, with emphasis upon the specific pedagogical field of early
childhood education, and other areas.
With regard to the “director’s gross salary” variable, the categories were grouped
together, producing one variable with only two categories: (1) below 4 minimum wages and
(2) over 4 minimum wages, as per Table 5. After final adjustments to the regression model,
the estimates shown in Table 5 were thus obtained.
TABLE 5
ESTIMATES (AND STANDARD ERRORS) FOR PARAMETERS FOR THE REGRESSION MODEL ADJUSTED FOR STUDYING PRE-SCHOOL QUALITY
Variables Categories Estimates (e.p.) p-value
Intercept 5.244 (0.308) < 0.0001
Census of Schools 2008
Only ECE 1.392 (0.256) < 0.0001 Provision
ECE and BE 0 –
Institution description questionnaire
Up to 8 more sophisticated types of
resource
-0.488 (0.254) 0.0569
Supplementary equipment
More than 8 0 –
No -0.631 (0.224) 0.0057 School transport
Yes 0 –
Director’s Questionnaire
Up to 14 years. -0.605 (0.214) 0.0056 Years since training
15 years or over 0 –
No -0.594 (0.211) 0.0057 Does (s)he promote training activities in
the school? Yes 0 –
Referral -0.427 (0.227) 0.0622
How did (s)he get the job? Public competitive examination,
selection process, election, etc.
0 –
Up to 4 minimum wages -0.835 (0.219) 0.0002 Gross salary
Over 4 minimum wages 0 –
Great difficulty -0.584 (0.207) 0.0055 Challenges at work
Little difficulty 0 –
Teachers’ Questionnaire

26
Other -0.838 (0.248) 0.001
Post-graduation Field Specific pedagogical field related to
early childhood education
0 –
Source: Campos (coord.) 2010.
Interpretation of the data shown in Table 5 allows it to be stated that the pre-schools
with the best quality measurements share the following characteristics:
• They operate in establishments catering exclusively to children in early childhood education
and possess a larger number of items of supplementary equipment (more than eight).
• They cater to children who use some form of school transport.
• They are units run by professionals who completed their higher education 15 years or more
ago, and who became directors through a public competitive examination, selection process
or election.
• The directors hold training activities or courses for teachers and staff in the unit itself.
• The gross salary of the director exceeds four minimum wages (R$ 1,861.00).
• They are run by professionals who report that they face few problems at work concerning
staffing, class size, etc.
• Finally, in the top-quality pre-schools, teachers have taken post-graduate courses
(specialization or academic courses) in Education, with emphasis on the specific
pedagogical field of early childhood education.
A simulation of the quality expected of a top-quality pre-school produced a score of
6.64 in the best scenario, in other words, with all the features listed above. Analogously, in
the worst-case scenario, the quality measurement expected would be 0.24.
The same procedure as was previously applied to crèche results was used to identify
which variables had the greatest influence on pre-school quality: the final model (with all the
variables) was applied, and then another nine models were adjusted, each by removing only
one of these variables, assessing the reduction in variability caused by the entry of each one of
them.
27
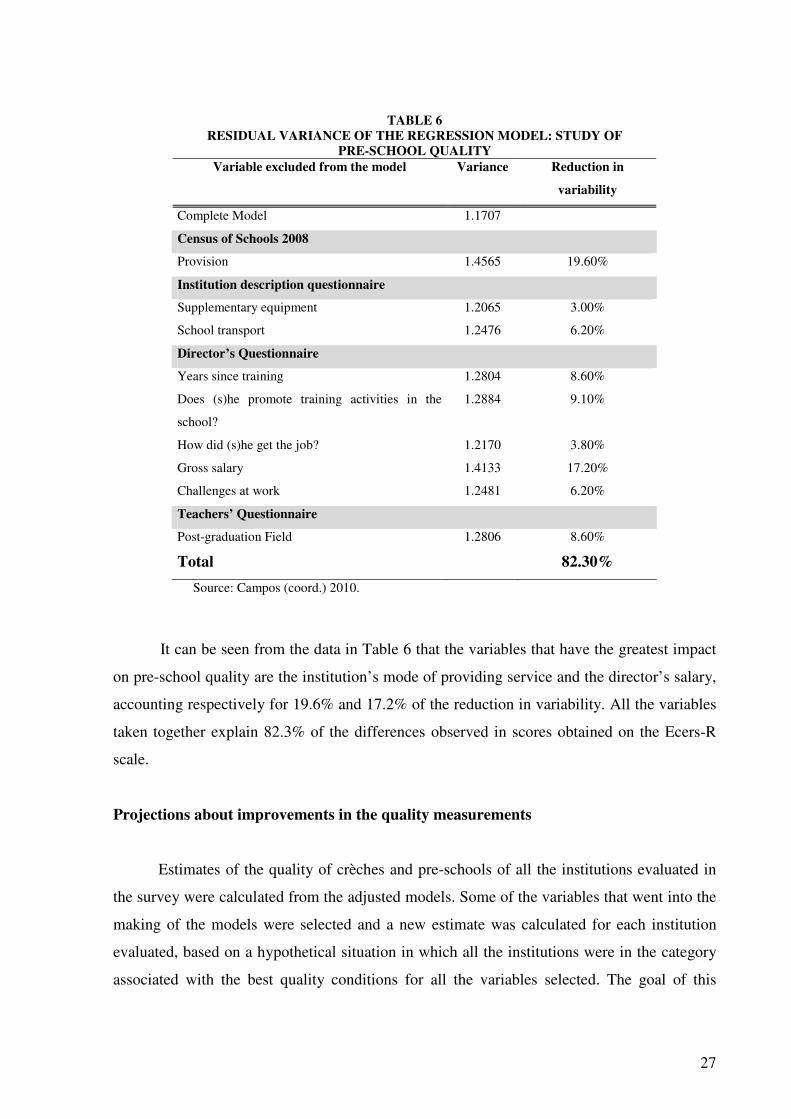
TABLE 6 RESIDUAL VARIANCE OF THE REGRESSION MODEL: STUDY OF
PRE-SCHOOL QUALITY Variable excluded from the model Variance Reduction in
variability
Complete Model 1.1707
Census of Schools 2008
Provision 1.4565 19.60%
Institution description questionnaire
Supplementary equipment 1.2065 3.00%
School transport 1.2476 6.20%
Director’s Questionnaire
Years since training 1.2804 8.60%
Does (s)he promote training activities in the
school?
1.2884 9.10%
How did (s)he get the job? 1.2170 3.80%
Gross salary 1.4133 17.20%
Challenges at work 1.2481 6.20%
Teachers’ Questionnaire
Post-graduation Field 1.2806 8.60%
Total 82.30%
Source: Campos (coord.) 2010.
It can be seen from the data in Table 6 that the variables that have the greatest impact
on pre-school quality are the institution’s mode of providing service and the director’s salary,
accounting respectively for 19.6% and 17.2% of the reduction in variability. All the variables
taken together explain 82.3% of the differences observed in scores obtained on the Ecers-R
scale.
Projections about improvements in the quality measurements
Estimates of the quality of crèches and pre-schools of all the institutions evaluated in
the survey were calculated from the adjusted models. Some of the variables that went into the
making of the models were selected and a new estimate was calculated for each institution
evaluated, based on a hypothetical situation in which all the institutions were in the category
associated with the best quality conditions for all the variables selected. The goal of this

28
exercise was to quantify the impact that some changes in certain characteristics of the early
childhood education institutions would have, on average, on the quality of crèches and pre-
schools in each of the cities.
The model thus calculated average quality estimates for the crèches, supposing that all
the institutions evaluated presented the best conditions in four selected variables (mode of
providing service, infrastructure, supplementary equipment and activities carried out with the
children). For the other variables, the conditions observed in each institution were preserved.
Table 6 presents the following information for each state capital, beginning with the
measurement of crèche quality:
• n: number of institutions with crèches evaluated in the city;
• quality of the crèche: average quality of the crèches evaluated in the city (applying the
Iters-R scale);
• estimate 1: estimate (via the model) of the average quality of crèches evaluated in the city;
• estimate 2: estimate (via the model) of the average quality of crèches evaluated in the
city. In estimate 2, as mentioned, the calculation considered that all the institutions
evaluated presented the best conditions in four selected variables (mode of providing
service, infrastructure, supplementary equipment and activities carried out with the
children). For the other variables, the conditions observed in each institution were
preserved.
TABLE 7 OBSERVED AND ESTIMATED VALUES FOR QUALITY OF
CRÈCHE BY CITY
Municipality n
Quality of
crèche Estimate 1 Estimate 2
Belem 4 2.7 3.0 4.7
Campo
Grande 19 2.8 2.9 3.7
Florianopolis 30 4.4 4.0 4.9
Fortaleza 12 2.7 2.8 3.9
Rio de Janeiro 7 3.9 3.7 4.6
Teresina 19 2.3 2.6 4.0
Total 91 3.3 3.3 4.3
Source: Campos (coord.) 2010.

29
The values presented in Table 7 show, for example, that: if the service provided in all
the crèches evaluated in Belem was only early childhood education; if all the institutions had
at least five items from those making up the infrastructure indicator; if the number of items of
supplementary equipment available in the institutions was greater than eight; and if the
teachers did more than eight activities daily with the children; then the estimate for average
quality of crèches would be 4.7, as opposed to the estimate of 3.0 obtained in current
conditions.
The data enable one to conclude that the greatest gain in the crèche quality indicator
would occur in Belem, with an increase in 1.7 points for the average of institutions from this
city that were evaluated. It should, however, be pointed out that the number of crèches
evaluated in Belem was very low (only four).
The city that would enjoy the second largest gain (over 1.4 points on average on the
scale) would be Teresina, where 19 early childhood education institutions with crèches were
evaluated.
However, it is important to stress that smaller gains mean that most of the crèches
evaluated in some cities already enjoyed better conditions of quality for the four variables
selected.
In the case of pre-schools, Table 7 presents the following information for each capital
city:
• n: number of institutions with pre-schools evaluated in the city;
• pre-school quality: average quality of the pre-schools evaluated in the city (calculated by
applying the Ecers-R scale);
• estimate 1: estimate (via the model) of the average quality of pre-schools evaluated in the
city;
• estimate 2: estimate (via the model) of the average quality of pre-schools evaluated in the
city. To calculate this estimate all the institutions evaluated were deemed to present the
most favorable conditions for three of the variables used in the model (mode of providing
service, gross salary of the director, and field of study of the post-graduate course). For the
other variables, the conditions observed were preserved.

30
TABLE 8 OBSERVED AND ESTIMATED VALUES FOR QUALITY OF
PRE-SCHOOL BY CITY
Municipality n
Quality of
pre-school Estimate 1 Estimate 2
Belem 19 3.2 3.1 5.0
Campo Grande 28 3.6 3.5 4.9
Florianopolis 30 4.7 4.4 5.0
Fortaleza 16 2.2 2.6 5.2
Rio de Janeiro 15 3.6 3.3 5.3
Teresina 30 2.7 2.7 4.2
Total 138 3.4 3.3 4.9
Source: Campos (coord.) 2010.
The data in Table 8 show that the greatest average gain (in other words, the difference
between the value obtained by calculating estimate 2 and the observed value) is enjoyed by
Fortaleza, with an additional 2.6 points on the scale. It seems important to point out that in
general the improvements in the conditions subsumed under these three variables would result
in a gain of approximately 1.5 points in the average quality of the pre-schools evaluated.
Florianopolis is the exception, its gain being smaller since most of the pre-schools evaluated
there already present the best quality conditions represented by these three indicators.
FINAL REMARKS
Generally speaking, the average scores obtained by applying the scales for observing
the environments in which children are received in crèches (Iters-R) and pre-schools (Ecers-
R) in this study do not correspond to satisfactory levels of quality. Examining the averages for
each of the sub-scales that make up these instruments, we found that important aspects of a
program intended for children in these age-brackets are being neglected in most of the
institutions evaluated.
The analyses seeking to measure the association between the quality indicators
obtained from questionnaires for the staff, and data on the socio-economic conditions in the
surrounding areas of the schools in the survey showed that if certain basic conditions were
assured for these institutions and their professionals, and if certain changes were made in their

31
pedagogical practices, significantly higher point-scores could be achieved on rating scales for
the crèches and pre-school environments.
It should also be observed that some of the variables associated with enhanced quality
results have to do with the socio-economic characteristics of the neighborhoods and of the
clientele served by the institution, suggesting that not only is it more difficult for lower-
income populations to gain access to education, but also that the quality of education provided
in the institutions in these neighborhoods tends to be worse.
On the other hand, the differences found between the averages obtained in each capital
city should be understood in the context of the major regional inequalities that continue to
exist in Brazil. A study of the funding of early childhood education in these cities found huge
differences between the sums spent per student/year estimated for the public school system
(Bassi, in the present number).
Furthermore, in another part of this study, not approached here, a survey of the history
of early childhood education policies in each of the cities revealed very different paths, with
very different priorities and lack of continuity between successive city governments. Since the
results of the application of the scales paint a portrait of the schooling provisions found in the
present, one should consider the history of policies in each case, and the steps taken, whether
forward or backward. Access to education has extended more significantly in some cities than
in others, and different priorities have been given to the different age ranges, to the modes of
providing service and to how long the school day should last (Bassi, in this number). Since
the concept of quality should include the goal of more equal access to education, these aspects
are important in reflecting upon the situation found in the institutions evaluated.
In any case, the results of the study reinforce how urgent it is to adopt educational
policy measures that allow quality gains in early childhood education, both in crèches and in
pre-schools. The data obtained indicate specific aspects of the operations of crèches and pre-
schools that need more suitable infrastructure prerequisites, enhanced guidance, on-going
staff training – which includes managers and Education Secretariat technical teams – and
more efficient supervision systems. As seen in the impact study (Campos et al, 2011), these
actions may have positive effects not only on the quality of early childhood education, but
also in offering the children enhanced learning opportunities and in the continuation of their
schooling.

32
The results of this study broadly confirm results of other investigations in Brazil into
the daily operations of crèches and pre-schools.
Academic output on the subject of childhood education has emphasized the importance of
children being considered producers of culture and therefore being entitled to their say, with a
right to participate and create. The question is knowing whether the real and objective
conditions existing in most crèches and pre-schools allow children to fully exercise this right
during the long hours they spent in these environments.
It would therefore be important for studies to broaden knowledge of operating
conditions and the practices in force in these institutions, but also to move toward showing
ways to change these conditions, not just for a single teacher, class or unit but above all for
school systems catering for large populations, many of whom face challenging living
conditions, as the study showed in these capital cities.
We should remember that it is precisely the children in this least fortunate segment of
the population who stand to gain most from quality early childhood education.
Received: November 2010
Appoved to publication: December 2010
BIBLIOGRAPHICAL REFERENCES
ABREU-LIMA; I. et al. Escala de avaliação de ambientes em educação de infância. (Early
childhood education environment rating scale) Ed. rev. Portugal: Livpis/Legis, 2008.
BASSI, Marcos. Financiamento da educação infantil em seis capitais brasileiras. (Funding
early childhood education in six capital cities) Cadernos de Pesquisa, v. 41 n. 142 p. XX,
jan./abr., 2011.
BRASIL. Ministério da Educação. (Ministry of Education) Instituto Nacional de Estudos e
Pesquisas Educacionais “Anísio Teixeira” (The Anisio Teixeira National Institute for
Educational Studies and Research) Microdados do censo escolar 2008. (Micro-data from the
2008 Census of Schools) Brasília, 2008.
________. Ministério da Educação. (Ministry of Education) Secretaria de Educação Básica.
(Basic Education Secretariat) Parâmetros nacionais de qualidade para a educação infantil.
(National quality parameters for early childhood education) Brasília, 2006.

33
________. Ministério da Educação. (Ministry of Education) Secretaria de Educação Básica.
(Basic Education Secretariat) Política de educação infantil no Brasil. (Early childhood
education policy in Brazil) Brasília: MEC, SEB,Unesco, 2009. (Report of evaluation).
BRASIL. Indicadores da qualidade na educação. (Quality indicators in education). São
Paulo: Fundação Orsa, Undime, Unicef, Ação Educativa, Coedi/MEC, 2009.
CAMPOS-de-CARVALHO, M.; BHERING, E. Escala de avaliação de ambientes coletivos
para crianças de 0 a 30 meses (Collective environment rating scale for education of children
from 0 to 30 months of age) – Esac, 2006. (unpublished version).
CAMPOS, M. M. A Qualidade da educação em debate. (Quality of education in debate)
Estudos em avaliação educacional, (Studies in educational evaluation) n. 22, p. 5-35, jul./dez.
2000.
CAMPOS, M. M. (Coord.); BHERING, E.; ESPOSITO, Y. L. et al. Educação infantil no
Brasil: avaliação qualitativa e quantitativa. (Early childhood education in Brazil: a
qualitative and quantitative evaluation). São Paulo: Fundação Carlos Chagas; Ministério da
Educação; Banco Interamericano de Desenvolvimento, 2010. (Final Report)
CAMPOS, M. M.; ROSEMBERG, F. Critérios para um atendimento em creches que respeite
os direitos fundamentais das crianças. (Criteria for education in crèches respecting children’s
fundamental rights) 6. ed. MEC, SEB, 2009,
CAMPOS, M. M.; FÜLLGRAF, J.; WIGGERS, V. A Qualidade da educação infantil
brasileira: alguns resultados de pesquisa. (The quality of Brazilian early childhood education:
some research results) Cadernos de Pesquisa, São Paulo, v. 36, n. 127, p. 87-128, set./dez.
2006.
CAMPOS, M. M. et al. A Contribuição da educação infantil de qualidade e seus impactos no
início do ensino fundamental. (The contribution of quality early childhood education and its
impacts on early primary school) Educação & Pesquisa. São Paulo, v. 37, n.1, jan./abr. 2011.
On the presses.
CARVALHO, A. M.; PEREIRA, A. S. Qualidade em ambientes de um programa de educação
infantil pública.(Quality in environments within a public early childhood education policy)
Psicologia: Teoria e Pesquisa, v. 24, n.3, p.269-277, ju/set. 2008.
34
________. Escala de avaliação de ambientes para bebês e crianças pequenas (Infant/toddler
environmental rating scale). São Paulo, 2006. Mimeo.
FUNDAÇÃO IBGE. Censo demográfico de 2000. (2000 Demographic Census) Brasília,
2000.
HARMS, T.; CLIFFORD, R. M.; CRYER, D. Early childhood environment rating scale. Ed.
rev. New York: Teachers College, 1998.
________. Escala de avaliação de ambientes de educação infantil (EcerS-revised). São
Paulo, 2009. Mimeo. (translated and adapted.: Fundação Carlos Chagas; use limited to
research).
HARMS, T.; CRYER, D.; CLIFFORD, R. M. Infant/toddler environment rating scale. Ed.
Rev. New York: Teachers College, 2003.
________. Escala de avaliação de ambientes para bebês e crianças pequenas (Infant/toddler
environmental rating scale). São Paulo, 2006. Mimeo (translated and adapted: Fundação
Carlos Chagas; use limited to research).
IPEA. PNAD 2008: primeiras análises. (Preliminary analyses) Educação, gênero, migração.
(Education, gender, migration) Brasília, out. 2009. (Presidential communiqué, n. 32)
KRAMER, S. (Org.). Retratos de um desafio: crianças e adultos na educação infantil.
(Portrait of a challenge: children and adults in early childhood education) São Paulo: Ática,
2009.
KRAMER, S.; KAPPEL, M. B. Educação da criança de 0 a 6 anos. (Educating children from
0 to 6 years of age) In: FUNDAÇÃO IBGE. Pesquisa sobre padrões de vida 1996-1997.
Primeira Infância. (Research into living standards 1996-1997: Early childhood) Rio de
Janeiro: IBGE, 2000. p. 49-87.
LIMA, A. B. R; BHERING, E. Um estudo sobre creches como ambiente de desenvolvimento.
(A study of crèches as environments for development) Cadernos de Pesquisa, São Paulo, v.
36, n. 129, p. 573-596, set.dez. 2006.
LOEB, S. et al.. Child care in poor communities: early learning effects of type, quality, and
stability. Child Development, v. 75, n. 1, p. 47-65, jan./fev. 2004.

35
MASHBURN, A. J. et al. Measures of classroom quality in pre-kindergarten and children’s
development of academic, language and social skills, s.d. Mimeo.
SOUZA, T. N.; CAMPOS-DE-CARVALHO, M. Qualidade de ambientes de creche: uma
escala de avaliação. (Crèche environment quality: a rating scale) Cadernos de Pesquisa, São
Paulo, v. 10, n. 1, p. 87-96, set./dez. 2005.
SYLVA, K. et al. Early childhood matters: evidence from the effective pre-school and
primary education project. London: Routledge, 2010.
________ . The Effective provision of pre-school education (EPPE) project: findings from the
early primary years. London: Institute of Education, University of London, 2004. (Sure Start,
Evidence & Research). Available at: www.ioe.ac.uk/school/ecpe/eppe/. Visited: Jan. 2011.
________. The Effective provision of pre-school education (EPPE) project: findings from the
pre-school period. London: Institute of Education. University of London, 2003. (Research
Brief no. RBX15-03). Available at: www.ioe.ac.uk/school/ecpe/eppe/. Jan. 2011.
________. The Effective provision of pre-school education (EPPE) project: findings from the
pre-school to end of key stage 1. London: Institute of Education, University of London, 2004.
(Sure Start, Evidence & Research). Available at: www.ioe.ac.uk/school/ecpe/eppe/. Visited
Jan. 2011.
TIETZE, W. et al. Comparisons of observed process quality in early child care and education
in Five countries. Early Childhood Research Quarterly, v.4, n.11, p. 447-475, 1996.
UNESCO; OECD. Early childhood care and education in Brazil. Paris, 2005. (Policy review
report)
________. Preliminary observations of the review mission to Brazil. Paris, May 2005a. (Early
Childhood Policy Review Project. S.1)
UNICEF. Crianças de até 6 anos: o direito à sobrevivência e ao desenvolvimento. (Children
up to 6 years of age: the right to survival and development). Brasília, 2005. (Situation of
children in Brazil).
APPENDICES1
RESULTADOS RELATIVOS AOS ITENS DA ESCALA ITERS-R, POR SUBESCALAS

36
Item N Média Classificação 1. Espaço Interior 91 3,6 Básico 2. Móveis para cuidados de rotina e brincadeiras 91 1,9 Inadequado 3. Recursos para relaxamento e conforto 91 2,6 Inadequado 4. Organização da sala 91 3,9 Básico 5. Exposição de materiais para as crianças 91 3,8 Básico Total da subescala 91 3,1 Básico
Item N Média Classificação 6. Chegada / Saída 91 3,3 Básico 7. Refeições / merendas 91 2,5 Inadequado 8. Sono 66 1,8 Inadequado 9. Troca de fraldas / Uso do banheiro 91 3,3 Básico 10. Práticas de saúde 91 2,6 Inadequado 11. Práticas de segurança 91 3,6 Básico Total da subescala 91 2,9 Inadequado
Item N Média Classificação 12. Auxílio às crianças para a compreensão da linguagem 91 4,9 Básico 13. Auxílio para o uso da linguagem pelas crianças 91 5,1 Adequado 14. Uso de livros 91 1,5 Inadequado Total da subescala 91 3,8 Básico
Item N Média Classificação 15. Motora fina 91 2,7 Inadequado 16. Atividade física 91 2,7 Inadequado 17. Arte 91 2,7 Inadequado 18. Música e movimento 91 1,7 Inadequado 19. Blocos 91 1,7 Inadequado 20. Brincadeira de faz de conta 91 2,8 Inadequado 21. Brincadeira com areia e água 89 2,4 Inadequado 22. Natureza / Ciências 91 1,9 Inadequado 23. Uso de TV, vídeo e/ou computadores 76 2,1 Inadequado 24. Promoção da aceitação da diversidade 91 1,4 Inadequado Total da subescala 91 2,2 Inadequado
Item N Média Classificação 25. Supervisão do brincar e do processo de aprendizagem 91 5,6 Adequado 26. Interação criança-criança 91 6,3 Adequado 27. Interação equipe-criança 91 5,8 Adequado 28. Disciplina 91 5,1 Adequado Total da subescala 91 5,7 Adequado
Item N Média Classificação 29. Programação 91 4,4 Básico 30. Atividade livre 91 2,6 Inadequado 31. Atividade em grupo 85 2,8 Inadequado 32. Provisões para as crianças com deficiência 19 2,7 Inadequado Total da subescala 91 3,2 Básico
Item N Média Classificação 33. Estratégias para o envolvimento dos pais 91 2,7 Inadequado 34. Estratégias para as necessidades pessoais da equipe 91 2,8 Inadequado 35. Estratégias para as necessidades profissionais da equipe 91 2,5 Inadequado 36. Interação e cooperação entre a equipe 80 6 Adequado 37. Estabilidade da equipe 91 4,2 Básico 38. Supervisão e avaliação da equipe 87 4,6 Básico 39. Oportunidades para crescimento profissional 91 3,1 Básico Total da subescala 91 3,6 Básico
I – Espaço e mobiliário
II – Rotinas de cuidado pessoal
III – Falar e Compreender
OBS. As variações no "n" ocorrem por que alguns itens da escala podem ser pontuados com NA (Não se aplica) quando determinado aspecto não pode ser avaliado, por não se aplicar ao grupo observado. Por exemplo, o item “Brincadeira com areia e água” é assinalado
com NA quando todas as crianças do grupo tiverem menos de 18 meses, já que não é esperado por questões de segurança e de saúde que crianças com menos de 18 meses façam atividades com areia e água. Os itens que podem ser pontuados com NA são: 8 , 21, 23 , 32, 36 e 38 . Quando marcados com NA, os itens não são contabilizados ao se calcular a pontuação de uma subescala ou escala total.
IV – Atividades
V – Interação
VI – Estrutura do programa
VII – Pais e equipe

37
Item N Média Classificação 1. Espaço Interior 138 3,8 Básico 2. Móveis destinados aos cuidados de rotina, brincadeiras e aprendizagem 138 3,9 Básico 3. Mobiliário para relaxamento e conforto 138 2,2 Inadequado
4. Organização da sala para atividades 138 2,1 Inadequado
5. Espaço de privacidade 138 2,3 Inadequado
6. Exposição de materiais relacionados com as crianças 138 3,8 Básico 7. Espaço para motricidade ampla 138 4,2 Básico 8. Equipamentos de motricidade ampla 138 2,9 Inadequado
Total da subescala 138 3,1 Básico
Item n Média Classificação 9. Chegada / Saída 138 4,8 Básico 10. Refeições / merendas 138 2,7 Inadequado
11. Sono 70 2,5 Inadequado
12. Uso do banheiro/ Troca de fraldas 138 4,7 Básico 13. Práticas de saúde 138 4,4 Básico 14. Práticas de segurança 138 5,1 Adequado Total da subescala 138 4,1 Básico
Item n Média Classificação 15. Livros e imagens 138 2,5 Inadequado
16. Estímulos às crianças a se comunicarem 138 3,8 Básico 17. Uso da linguagem para desenvolver o raciocínio 138 4,3 Básico 18. Uso informal da linguagem 138 4,3 Básico Total da subescala 138 3,7 Básico
Item n Média Classificação 19. Motricidade fina 138 2,5 Inadequado
20. Arte 138 2,7 Inadequado
21. Música e movimento 138 2,5 Inadequado
22. Blocos 138 2,1 Inadequado
23. Areia / água 138 2,3 Inadequado
24. Brincadeira de faz de conta 138 1,9 Inadequado
25. Natureza / Ciências 138 1,6 Inadequado
26. Matemática / número 138 3,1 Básico 27. Uso de TV, vídeo e/ou computadores 122 2 Inadequado
28. Promoção da aceitação da diversidade 138 2,1 Inadequado
Total da subescala 138 2,3 Inadequado
Item n Média Classificação 29. Supervisão das atividades motoras amplas 138 4,9 Básico 30. Supervisão geral das crianças 138 5,4 Adequado 31. Disciplina 138 5 Adequado 32. Interações entre adultos e crianças 138 6,6 Adequado 33. Interações entre as crianças 138 6,1 Adequado Total da subescala 138 5,6 Adequado
Item n Média Classificação 34. Programação 138 2,4 Inadequado
35. Atividade livre 138 3 Básico 36. Atividade em grupo 138 2,1 Inadequado
37. Condições para as crianças com deficiências 47 2,1 Inadequado
Total da subescala 138 2,5 Inadequado
Item n Média Classificação 38. Condições para os pais 138 3,2 Básico 39. Condições para as necessidades pessoais da equipe 138 3,1 Básico 40. Condições para as necessidades profissionais da equipe 138 3,2 Básico 41. Interação e cooperação entre a equipe 92 5,4 Adequado 42. Supervisão e avaliação da equipe 136 4,7 Básico 43. Oportunidades para o desenvolvimento profissional 138 3,3 Básico Total da subescala 138 3,6 Básico
OBS. As variações no "n" ocorrem por que alguns itens da escala podem ser pontuados com NA (Não se aplica) quando determinado aspecto não pode ser
avaliado, por não se aplicar ao grupo observado. Por exemplo, o item “Sono” não pode ser observado em um grupo que freqüenta a instituição apenas
meio período (menos de 4 horas por dia), sendo assinalado com NA. Os itens que podem ser pontuados com NA são: 11, 27, 37, 41 e 42. Quando marcados
com NA, os itens não são contabilizados ao se calcular a pontuação de uma sub-escala ou escala total.
IV – Atividades
V – Interação
VI – Estrutura do programa
VII – Pais e Equipe
I – Espaço em Mobiliário
II – Rotinas de cuidado pessoal
III – Linguagem e raciocínio
Resultados relativos aos itens da escala ECERS-R, por subescalas