Quality nonconformity data management in electrical motor ...
95
FACULTY OF TECHNOLOGY QUALITY NONCONFORMITY DATA MANAGEMENT IN ELECTRICAL MOTOR MANUFACTURING Simo Alatulkkila Industrial Engineering and Management Master’s thesis October 2018
Transcript of Quality nonconformity data management in electrical motor ...

FACULTY OF TECHNOLOGY
QUALITY NONCONFORMITY DATA
MANAGEMENT IN ELECTRICAL MOTOR
MANUFACTURING
Simo Alatulkkila
Industrial Engineering and Management
Master’s thesis
October 2018

TIIVISTELMÄ
OPINNÄYTETYÖSTÄ Oulun yliopisto Teknillinen tiedekunta Koulutusohjelma Pääaineopintojen ala Tuotantotalous
Tekijä Työn ohjaaja yliopistolla Alatulkkila Simo Kauppila O. TkT
Työn nimi Laatupoikkeamadatan hallinta sähkömoottorien valmistuksessa
Opintosuunta Työn laji Aika Sivumäärä
Tuotehallinta Diplomityö Lokakuu 2018 89 + 6
Tiivistelmä
Laadunhallinta ja laatujohtaminen voivat olla tärkeitä menestystekijöitä yrityksille. Tehokkaalla laadunhallinnalla
yritykset voivat tutkitusti lisätä tuottavuuttaan, vähentää laatupoikkeamien määrää ja parantaa kannattavuuttaan.
Laatupoikkeamien hallinta on tärkeä osa laadunhallintaa. Laatupoikkeamat ovat hyvä mahdollisuus oppia ja
poikkeamien tehokas eliminointi ja hallinta voi johtaa huomattaviin parannuksiin yrityksen laatutasossa. Tämä
diplomityö on tehty ABB:n moottorit ja generaattorit -yksikköön Vaasassa ja sen tavoitteena on kehittää
kohdeyrityksen laatupoikkeamadatan hallintaa.
Tämä diplomityö on kvalitatiivinen case-tutkimus. Tutkimuksen kirjallisuuskatsauksessa käsiteltiin laadunhallinnan,
laatupoikkeamienhallinnan ja laatupoikkeamadatan hallinnan pääkohdat. Empiirisessä osuudessa toteutettiin
teemahaastattelut kohdeyrityksen henkilöstölle. Haastattelujen tavoitteena oli kartoittaa kohdeyrityksen nykytila,
vaatimukset ja ongelmat laatupoikkeamadatan hallinnan suhteen. Tämän jälkeen toteutettiin benchmarking-
haastattelut neljään yritykseen eri toimialoilta. Benchmarkingin avulla kartoitettiin alan parhaita käytäntöjä.
Haastattelujen lisäksi tutkimuksessa käytettiin kohdeyrityksen keräämää dataa laatupoikkeamatietokannasta.
Työn tuloksena saatiin kehitysehdotuksia kohdeyrityksen laatupoikkeamadatan hallintaan. Datan keräämisen
vaatimukset määriteltiin ja niiden pohjalta luotiin malli datan keräämisen kehittämiseksi. Lisäksi laatupoikkeamille
luotiin uusi luokittelumalli, joka edesauttaa tärkeimpien poikkeamatyyppien tunnistamista. Tiedonkulun ja
kommunikaation kehittämiseksi työssä suunniteltiin ja toteutettiin kaksi raportointityökalua, jotka edesauttavat
laatuun liittyvää kommunikaatiota sekä raportoinnin ja laatumittareiden kehittämistä kohdeyrityksessä. Työn
käytännön tulokset eivät enimmäkseen ole sovellettavissa kohdeyrityksen ulkopuolelle. Teoreettisesta näkökulmasta
työn tuloksia voidaan kuitenkin käyttää ohjenuorana massaräätälöityjä tuotteita valmistavan yrityksen
laatupoikkeamadatan hallintaan.
Muita tietoja
Avainsanat: laatu, laadunhallinta, laatupoikkeamien hallinta, data, datan hallinta

ABSTRACT
FOR THESIS University of Oulu Faculty of Technology Degree Programme Major Subject (Licentiate Thesis) Industrial Engineering and Management
Author Thesis Supervisor Alatulkkila Simo Kauppila O., D.Sc. (Tech)
Title of Thesis
Quality nonconformity data management in electrical motor manufacturing
Major Subject Type of Thesis Submission Date Number of Pages Product Management Master’s Thesis October 2018 89 + 6
Abstract
Quality management can be an important success factor for organisations. With effective quality management,
companies can increase their productivity, reduce quality nonconformities and as a result, improve their profitability.
One key aspect in quality management is the management of quality nonconformities. Nonconformities are important
learning opportunities and effective management of them can help companies strive towards better quality. This
thesis was done for ABB Motors & Generators in Vaasa and the goal was to find ways to improve quality
nonconformity data management in the case company.
This thesis was completed as a qualitative case study. At first, a literature review covering quality management,
quality nonconformity management and quality nonconformity data management was conducted. Secondly, semi-
structured interviews were performed inside the case company to understand the current situation, requirements and
problems within the case company. Then, benchmarking visits were done to four companies from different industries
in order to understand the best practices of quality nonconformity data management. Lastly, nonconformity data was
analysed from the nonconformity database of the case company.
As a result, improvements were proposed for the quality nonconformity data management inside the case company.
Requirements for data collection were defined and data collection framework was created based on that. In addition,
new categorisation model for quality nonconformities was developed. Furthermore, two reporting tools were
designed and implemented to increase and develop information-sharing about quality problems. These tools facilitate
quality communication and the development of quality reporting and metrics. The practical results of this study are
mostly case-specific and are not fully applicable outside the case company. However, the field of quality
nonconformity data management is not studied extensively, so this study can be taken as a general guideline on how
to organise quality nonconformity data management in a mass customization production environment.
Additional Information
Key words: quality, quality management, quality nonconformity management, data, data management

PREFACE AND ACKNOWLEDGEMENTS
This thesis was done for ABB Motors & Generators in Vaasa between March and
October in 2018. I would like to thank ABB for giving me this opportunity. Especially I
would like to express my gratitude to my supervisors and colleagues Päivi Palmujoki,
Otto Rautiainen and Virpi Haarala for your support and guidance during the thesis
process. I am also thankful for other people that contributed to this thesis both at ABB
and in other companies. In addition, I would like to thank my supervisor, D.Sc. Osmo
Kauppila from the University of Oulu. The feedback and guidance in the thesis process
have been valuable. Last but not least, big thanks to friends and family members who
have supported me through my university studies.
In Vaasa, 4.10.2018 Simo Alatulkkila

TABLE OF CONTENTS
TIIVISTELMÄ ...................................................................................................................... 2
ABSTRACT ........................................................................................................................... 3
PREFACE AND ACKNOWLEDGEMENTS ....................................................................... 4
TABLE OF CONTENTS ....................................................................................................... 5
LIST OF ABBREVIATIONS ................................................................................................ 7
1 INTRODUCTION .............................................................................................................. 8
1.1 Background .................................................................................................................. 8
1.2 Research objective ....................................................................................................... 9
1.3 Research process ........................................................................................................ 10
2 LITERATURE REVIEW.................................................................................................. 11
2.1 Fundamentals of quality ............................................................................................. 11
2.1.1 Definition of quality ......................................................................................... 11
2.1.2 Benefits of quality management ....................................................................... 14
2.1.3 The evolution of quality management .............................................................. 16
2.1.4 Quality KPI and performance metrics .............................................................. 19
2.2 Cost of quality ............................................................................................................ 21
2.2.1 Conformance costs ............................................................................................ 23
2.2.2 Non-conformance costs .................................................................................... 25
2.2.3 Classical and modern views of quality costs .................................................... 27
2.2.4 Measuring the cost of quality ........................................................................... 29
2.3 Quality nonconformity management .......................................................................... 30
2.3.1 Quality nonconformities in manufacturing ....................................................... 33
2.3.2 Quality nonconformity management process ................................................... 35
2.4 Quality nonconformity data management .................................................................. 39
2.4.1 Quality nonconformity data collection ............................................................. 40
2.4.2 Quality nonconformity data utilisation ............................................................. 42
2.5 Synthesis .................................................................................................................... 45
3 EMPIRICAL RESEARCH ............................................................................................... 48
3.1 Research methods ....................................................................................................... 48
3.1.1 Internal interviews ............................................................................................ 48
3.1.2 Benchmarking ................................................................................................... 49
3.2 Research environment – ABB Motors and Generators .............................................. 50
3.3 Quality nonconformity data management – current situation at ABB ....................... 51
3.4 Results from internal interviews ................................................................................ 53

3.4.1 Quality measures and KPI ................................................................................ 53
3.4.2 Quality nonconformity data collection ............................................................. 54
3.4.3 Reporting and communication .......................................................................... 58
3.4.4 Key improvements from internal interviews .................................................... 59
3.5 Best practices from benchmarking interviews ........................................................... 59
3.5.1 Quality measures and KPI ................................................................................ 60
3.5.2 Quality nonconformity data collection ............................................................. 60
3.5.3 Reporting and communication .......................................................................... 64
3.5.4 Key improvements from benchmarking companies ......................................... 65
4 DISCUSSION ................................................................................................................... 66
4.1 Data collection ........................................................................................................... 66
4.2 Reporting and data analysis ....................................................................................... 73
4.3 Communication .......................................................................................................... 75
5 CONCLUSION ................................................................................................................. 77
5.1 Scientific contribution ................................................................................................ 77
5.2 Managerial implications ............................................................................................. 78
5.3 Evaluation of the thesis .............................................................................................. 78
5.4 Topics for further study .............................................................................................. 80
REFERENCES ..................................................................................................................... 82
APPENDICES
Appendix 1. Internal interview questions
Appendix 2. Benchmarking interview questions
Appendix 3. Required improvements in internal quality nonconformity data collection
based on the C5 model.
Appendix 4. Proposed defect coding for internal quality nonconformities

LIST OF ABBREVIATIONS
ABC Activity based costing
CAPA Corrective and Preventive Action
CoQ Cost of Quality
FPY First pass yield
KPI Key performance indicator
QA Quality assurance
QC Quality control
QM Quality management
QMS Quality management system
QNCDM Quality nonconformity data management
QNCM Quality nonconformity management
QNCMS Quality nonconformity management system
NC Non-conformity
PAF Prevention-appraisal-failure
SAP ERP (enterprise resource planning) system used in the case company
TQM Total quality management

8
1 INTRODUCTION
1.1 Background
In today’s competitive market environment, focusing on quality and quality
management (QM) has become more and more important for companies (Hoyer &
Hoyer 2001; Feigenbaum & Feigenbaum 1999; Reeves & Bednar 1994). Due to
advancements in information technology and the internet, customers have the ability to
evaluate the quality of products more easily and thoroughly than before. Thus,
customers have become more sensitive to quality. They are demanding for it and are
willing to share their thoughts about the customer experience. For these reasons,
companies offering products with poor or mediocre quality are likely to fail.
(Feigenbaum & Feigenbaum 2005; Gill 2009) Successful businesses have adapted to the
changed market environment and are creating value for their customers by putting
quality in the centre of their business processes. QM has become an essential part of the
company culture in most successful companies of the 21st century. (Dale 1999; Gill
2009; Sousa & Voss 2002)
It is important to note that quality management has a significant influence on
companies’ financial performance (Majanoja et al. 2017; Campanella 1999). De (2009)
has estimated that the proportion of quality costs is about 5-25 % of the revenue of a
company. According to Schonberger (1986), the proportion is 15-30 %. The total
amount of quality costs depends on the type industry and what is considered and what is
not considered to be quality costs (Williams et al. 1999). In any case, the financial
influence of quality is significant and the top management should be interested in
quality improvements (Cheah et al. 2011).
One way of improving quality is reducing and managing quality nonconformities
(Claver et al. 2003). According to ISO 9000:2015, a nonconformity is defined as non-
fulfilment of requirements. It can also be described as an unplanned and unwanted event
which can cause deviation. Quality nonconformity management (QNCM) is an essential
part of the QM processes in companies and correct practises can help them achieve their
quality targets (Majanoja et al. 2017). Through effective detection, reporting, analysing
and solving quality nonconformities, companies can improve the information flow to
internal and external stakeholders. It also enables continuous improvements and

9
learning within the organisation. (Bredehoeft & O’Hara 2009) Donauer et al. (2015b)
propose a data-driven approach to solving quality nonconformities. If nonconformity
data is collected systematically, it can be utilised to prioritise the most important quality
improvements (Donauer et al. 2015a; Majanoja et al. 2017)
1.2 Research objective
QM and QNCM are important focus areas also in the case company of this study, ABB.
Even though ABB is renowned for their high quality products, there is a lot of work to
be done in managing quality nonconformities. Information about quality
nonconformities is constantly collected from production and customers, and the data is
stored into databases. Currently, ABB has sufficient tools and procedures for handling
individual nonconformities. However, there is room for improvements. The data coming
from nonconformities is not fully utilised. By better utilisation and analysis of
nonconformity data, emerging trends and patterns in certain problem areas could be
notified, tracked and solved more effectively. The research objective of this study is to
analyse the current state of quality nonconformity data management at ABB and
propose improvements in the challenges and problems that exist. The research objective
is divided into two research questions:
RQ1. What are the key elements in quality nonconformity management and how
quality nonconformity data should be managed to improve quality?
The first research question will be answered in the literature review section of this
study. Based on the literature review, a theoretical framework of best practices in
quality management, quality nonconformity management and quality nonconformity
data management is created.
RQ2. How is quality nonconformity data managed at ABB and benchmarking
companies and how the management can be improved at ABB?
The second research question is answered in the empirical research of this study. The
goal is to give improvement recommendations for quality nonconformity data
management in terms of data collection, data analysis and reporting. Information
collection for the empirical research is done by internal interviews, benchmarking visits

10
to four other companies and collecting data from the quality nonconformity databases of
ABB.
1.3 Research process
The research process is illustrated in Figure 1. The first chapter, introduction, presents
the background for the topic and defines the purpose for this study. The second chapter,
literature review covers the theoretical background and provides an answer for RQ1.
The third chapter, empirical research is based on the research inside the case company.
In this chapter, the current state of quality nonconformity data management is analysed
via analysing the nonconformity data and internal interviews. In addition, four selected
companies are visited for benchmarking. Based on this, the second research question is
answered. Together with the theoretical framework, the empirical research contributes
to the main purpose of the study, finding improvement opportunities in the quality
nonconformity data management in the case company. The development proposals are
presented in chapter 4.
Figure 1. Research process of this thesis.
Introduction
• Background of the study
• Research objective
Literature review
• Answer to RQ1
Empirical research & Discussion
• Current state analysis
• Development proposals
• Answer to RQ2
Conclusion
• Key results
• Evaluation of the study
• Proposals for future research

11
2 LITERATURE REVIEW
In this section of the thesis, theoretical background of QNCM and nonconformity data
management are introduced. Before that, it is important to define what quality is and
how quality should be managed. The structure of the literature review section is
illustrated in Figure 2.
Figure 2. Structure of the literature review.
2.1 Fundamentals of quality
2.1.1 Definition of quality
The term quality was first introduced in business literature in 1940s by American
theorists and practitioners. At first, the need for quality improvements was mostly
ignored in the Western world but the Japanese were quick to adopt the idea and used it
in commercial applications. It wasn’t until the 1970s that companies in the west became
interested in QM as the growing economies started to mature and forced companies to
challenge their ways of working. Quality and QM have been hot managerial topics ever
since. (Beckford 2002) Even though quality as a term has been around for a long time,
we still have not reached a consensus about its definition. Several different definitions
have been suggested by QM gurus and business practitioners. (Hoyer & Hoyer 2001;
Dale 1999) Over the years, quality has at least been defined as excellence, value,
conformance to specifications, conformance to requirements, fitness for use, loss
avoidance and meeting or exceeding customer requirements (Reeves & Bednar 1994;
Sousa & Voss 2002; Van Kemenade et al. 2008). Some of the common definitions of
quality are presented in Table 1 and explained in detail later in the text.
2.5. Synthesis
2.1 Fundamentals
of quality
2.2 Cost of quality 2.3. Quality
nonconformity
management
2.4. Quality
nonconformity
data management

12
Quality definition Author
“Quality means investment of the best
skill and effort possible to produce the
finest and most admirable results
possible.”
Tuchman (1980)
“Fitness for purpose or use” Juran & Gryna (1988)
“Conformance to requirements” Crosby (1979)
“Degree to which a set of inherent
characteristics fulfils requirements”
ISO (EN) 9000:2000 Quality
Management System- fundamentals
and vocabulary
“Quality should be aimed at the needs
of the consumer, present and future”
Deming (1986)
“Quality does not have the popular
meaning of “best” in any absolute
sense. It means “best for certain
customer conditions. These conditions
are (a) the actual use and (b) the selling
price of the product. Product quality
cannot be thought of apart from
product cost.”
Feigenbaum (1951)
Table 1. Quality definitions. Adapted from Oakland (2003); Reeves & Bednar (1994)
The most traditional and philosophical way to define quality is excellence (Sousa &
Voss 2002). Significant discussions about quality were initiated by famous Greek
philosophers Socrates, Plato and Aristotle. The ideal for them was excellence. The
meaning of excellence depended on the context but the general idea was to pursue for
excellence which was thought to be the highest form of quality. Even though striving
for excellence is generally a very good idea for companies and it can send a strong
marketing message, the definition has little relevance in terms of practical guidance for
managers. (Reeves & Bednar 1994) Excellence is very subjective and it is almost
impossible to evaluate or measure anything concrete based on excellence (Dahlgaard et
al. 2008; Yong & Wilkinson 2002).
Probably one of the best known definitions for quality was developed by the American
quality guru Joseph Juran. According to Juran & Gryna (1988), the meaning of quality
is “fitness for purpose or use”. This meaning can be divided into two separate
approaches. Firstly, quality means those features of products that meet customers’ needs
and thereby provide customer satisfaction. In this sense, providing better quality
requires investments and generally costs more. Secondly, quality means freedom from
deficiencies. Deficiencies can be for example errors, field failures, customer

13
dissatisfaction or customer claims. In this sense higher quality costs less. Deming
(1986) has a similar view that quality should be defined as meeting or exceeding
customer expectations. He emphasizes that this approach is especially important in
service businesses (Reeves & Bednar 1994).
Crosby has a slightly different approach to the definition of quality. According to
Crosby (1979), quality means “conformance to requirements”. His definition does not
take into account customers’ needs and expectations since the requirements may not
fully represent customer expectations. Crosby treats the alignment of requirements and
customer expectations as a separate problem. In other words, the quality of a product be
“conforming to requirements” even though the customer is not fully satisfied with it.
(Garvin 1984) Crosby also sees quality as a binary, yes or no question. A product either
meets the specifications or it does not. According to his definition, things like good or
bad quality do not exist. (Reeves & Bednar 1994)
According to Feigenbaum (1951), quality and price cannot be separated. He claims that
the quality of a product must always be compared to its price. In this sense, quality is
value. (Garvin 1984) This approach is quite practical as most of the purchasing
decisions are based on both price and quality. It can also give a more precise indication
of how products are perceived in the market. (Dahlgaard et al. 2008; Yong & Wilkinson
2002) If the quality of a product is determined by the value offered to customers,
companies have to focus on both internal efficiency and external effectiveness in order
to improve their quality. Most researchers do not agree with the value-based definition
of quality and they want to treat quality and price separately. (Reeves & Bednar 1994)
Garvin (1988) argues that treating quality as value is a bad hybrid, so called “affordable
excellence” that does not have clearly defined limits and is highly subjective. Also
Gryna et al. (1999) suggests that quality and value should be treated as separate topics.
Each of the quality definitions has its pros and cons regarding measurement,
generalizability, managerial usefulness and consumer relevance. (Reeves & Bednar
1994) None of the above mentioned definitions is explicitly right or wrong and thereby
managers and researchers should evaluate which definition is the most suitable for them
(Gill 2009). It is important for the quality culture in companies that all people involved
have the same perception of the definition. (Bauer et al. 2002.) To avoid

14
misunderstandings, Hoyle (2009) has defined three dimensions in quality which may
help business practitioners understand the complexity of the term:
The business quality dimension. This is the extent to which the business
satisfies the needs of all interested parties. These parties are not only
interested in the quality of individual products but judge the overall
organizational quality of operations.
The product quality dimension. The fulfilment of customer expectations
by products and services.
The organizational quality dimension. This is the extent to which the
organization maximizes its efficiency and effectiveness. Efficiency is
linked to productivity and utilisation of resources while effectiveness is
about doing the right thigs. This dimension is internal but it affects all
aspects of quality. (Hoyle 2009)
2.1.2 Benefits of quality management
The bottom line in QM is to satisfy customers’ needs and creating customer enthusiasm.
The customer is the ultimate reason the organisation exists and therefore customer
loyalty and satisfaction should be the most important measure for companies. (Gill
2009; Dale 1999) As previously mentioned in this study, nowadays customers’
tolerance for bad quality is non-existent and therefore every manager should be
interested in quality improvements (Williams et al. 1999). Other factors that make
quality a serious movement are environmental challenges, market competition and
pressure to reduce costs. (Gill 2009; Flynn et al. 1995) In order to highlight the
importance of QM, Beckford (2002) has divided the motivation for QM into three
arguments: the economic, the social and the ethical.
Economic – Improving quality will increase revenues and decrease
costs. Quality is crucial for the economic success of the organisation.
Social – producing non-quality goods is wasting human capabilities and
talent. Furthermore, working in non-quality environment is demoralizing
for employees. The goal should be to minimize waste of talents and
maximize satisfaction.
Ethical – The world has limited resources. They should not be wasted
them for non-quality goods. (Beckford 2002)

15
According to Gill (2009), investing in quality results in better productivity. The idea is
illustrated in Figure 3. The reason for this is simple: when quality is improved by
eliminating wasteful activities, more output is available with the same amount of input
resources (Gryna et al. 1999). For some managers, the connection between productivity
and quality may sound counterintuitive as a product with better quality may seem like a
greater use of resources. Also, many managers believe that taking eye off the
productivity is harmful for the business in the current market situation. (Gill 2009)
There is a lot empirical evidence on the linkage between the best QM practices and
operational performance (Douglas & Judge 2001). For instance, Lakhal (2014) and
Ahire et al. (1996) have found out that the correlation between the maturity of QM
practices and operational results is clear.
Figure 3. Way ahead with implementing quality improvements (Adapted from Stainer
& Stainer 1995)
While most of the research is focused on the operational benefits of quality, it is
important to note that quality does not only impact the operational performance but also
the overall competitive advantage of an organization. (Lakhal 2009) For example Flynn
et al. (1995) have studied the correlation between quality management and competitive
advantage. They found out that quality management is a significant contributor to
competitive advantage. The different dimensions of quality function in different
strategic ways. Internal, conformance-related quality acts as an order qualifier. It is
required from a product to even be considered in the marketplace. Order winning
quality characteristics are related to aesthetics and features. When customers are
considering multiple products, all of which are conforming to standards, aesthetics and
features are the ultimate deciding factors that win the order and create competitive edge.
(Flynn et al. 1995)

16
2.1.3 The evolution of quality management
As a concept, QM has a long history. Traditionally QM activities have been reactive and
focusing on inspections, but today QM activities can also be proactive and closely
linked to organizations strategic goals. (Yong & Wilkinson 2002) According to Dale
(1999), there are four stages in the evolution of QM: inspection, quality control (QC),
quality assurance (QA) and total quality management (TQM). These QM stages and
examples of related activities are presented in Figure 4.
Figure 4. The evolution of quality management. Adapted from Dale (1999)
Inspection
According to ISO 8402:1994, inspection means “activities such as measuring,
examining, testing, gauging one or more characteristics of a product or service and
comparing these with specified requirements to determine conformity.” Inspection is the
simplest way of making sure that a product meets its specifications and for a long time,
inspection was thought to be the only method for ensuring quality (Yong & Wilkinson
2002). In a manufacturing environment, inspection systems are most commonly applied
for incoming goods and materials, manufactured components and assemblies during the
manufacturing process, and before passing the finished goods into the warehouse. (Dale
1999)
Inspection is an essential part of manufacturing processes. It helps to control quality,
eliminate scrap losses, reduce manufacturing costs and identify causes for defective
Inspection
• Sorting, grading
• Corrective actions
Quality control
• Process performance data
• Use of statistics
Quality assurance
• FMEA
• Quality costing
• SPC
Total quality management
• Teamwork
• Supplier and customer involvement
• Process management

17
work. (Dale 1999). According to Naidu et al. (2006), inspection has nine different
purposes:
1. To separate good lots form bad lots
2. To separate good products from bad products
3. To identify changes in the process
4. To identify if the process is approaching the specification limits
5. To evaluate the quality of a product
6. To evaluate the accuracy of the inspectors
7. To measure the accuracy of measuring equipment
8. To secure products – design information
9. To measure process capability
There are two methods of inspection, 100% inspection and sampling inspection. 100%
inspection means that every piece is separately inspected at the inspection point. It
requires a lot of resources and therefore it is a costly method. However, it is the only
way of making sure that every piece meets the requirements. 100% inspection is a
suitable method if the amount of pieces is low and the quality standards are high. 100%
inspection method is used for example in aviation and medical industries. (Juran &
Gryna 1988) In sampling method, only randomly selected samples are inspected.
Samples taken from different batches are representatives and if the sample proves to be
defective, the whole batch is rejected or recovered. Sampling inspection method is
relatively cheap and quick but there is always a possibility of sampling errors. Usually
these errors can be statistically estimated and taken into account in sampling
procedures. Sampling inspection is common in industries with high volumes and low
quality standards. (Naidu et al. 2006)
Quality control
According to ISO 8402:1994, QC “is the operational techniques and activities that are
used to fulfil requirements for quality”. The development of quality control (QC)
brought more sophisticated methods and systems, self-inspection, use of information
and tools and techniques into the QM field (Dale 1999). The focus shifted from
inspections to controlling and reducing variability in the production process. A QC
system performs inspection, testing and analysis to check if the quality of a product is
according to quality standards. QC systems may use statistical techniques to solve

18
quality control problems. Applying statistical techniques into the QC system can
improve the reliability of the system. (Naidu et al. 2006)
The QC activities are reactive by nature. The QC systems focus on observing the
production and only react when performance is deviating from the standard. Problems
are not necessarily removed but repeated all over again because the root cause of the
problem is not fully understood nor analysed. (Naidu et al. 2006) Yong & Wilkinson
(2002) call this type of QM fire-fighting, as it can only detect and handle but not
prevent problems. Another major flaw in QC is that it only involves the operational
level people in an organization. (Naidu et al. 2006)
Quality assurance
Opposite to inspection and quality control, the fundamental idea behind QA activities is
preventing, not detecting problems. Introduction of QA activities was the transition
from reactive to proactive QM systems. Prevention emphasizes more developed quality
planning, training, problem solving tasks, advanced design of products, services and
processes and motivating and involving people. (Dale 1999) The introduction of QA
activities enabled quality to evolve from a narrow manufacturing-based discipline to one
with broader managerial implications. The scope of tools also expanded from the statistical
tools of QC. (Yong & Wilkinson 2002) For example, comprehensive QM system, seven
quality tools and failure mode and effect analysis (FMEA) were introduced. (Dale 1999)
Total quality management
According to Dale (1999), TQM is “the mutual co-operation of everyone in an
organisation and associated business processes to produce value-for-money products
and services which meet, and hopefully exceed the needs and expectations of customer.”
TQM consists of eight key elements which can be seen as a set of values and principles
that an organisation should follow when applying TQM. (Naidu et al. 2006) According
to Dale (1999), the key elements of TQM are:
Commitment and leadership of the chief executive officer
Planning and organizing
Using tools and techniques
Education and training

19
Involvement
Teamwork
Measurement and feedback
Ensuring that the culture is conducive to continuous improvement
2.1.4 Quality KPI and performance metrics
To be able to improve quality, performance measurements have to be implemented for
areas that need improvement. Before implementing the performance measurement
system, critical business success factors and quality objectives of the organisation need
to be identified. (Dale 1999) The quality objectives have to be measurable and the
achievement of the objectives should have a positive impact on product quality or
operation (Torkko et al. 2013). The objectives depend on the organisation type and
industry. The main objective of satisfying customers’ needs is the same across the
industries but the main objective can be divided into performance metrics which may be
industry-specific. (Dale 1999) Organisation-wide quality performance metrics should
include metrics regarding customer satisfaction, internal performance and supplier
performance (Hoyle 2005).
According to Boltic et al. (2010), key performance indicators (KPI) and performance
metrics should not be mixed. KPIs represent a few important business indicators aimed
to drive the business at a high level. On the other hand, performance metrics are
supportive to KPIs and are used to drive the progress of business, department or a
project on a lower level. Performance metrics are useless if they are not directly linked
to KPIs. (Boltic et al. 2010) Choosing the right metrics is not easy but can be critical to
success (Hauser & Katz 1998). A good metric is precise, applicable to all employees
and tied to overall profit of the company. Also, it is designed to encourage extranormal
efforts. (Torkko et al. 2013; Hauser & Katz 1998). There is not an explicitly correct way
of defining the right metrics but for example Hauser & Katz (1998) provide a seven step
process for developing effective measures to help organisations achieve their goals. This
process is illustrated in Figure 5.

20
Figure 5. Seven steps towards effective metrics (adapted from Hauser & Katz
1998).
Selecting the correct quality metrics can improve the overall performance and quality
culture in organisations. To achieve the best results, performance metrics should be
standardised across the whole organisation. This can lead to several benefits, such as:
comparability of quality performance across products and services
Increased data validity because of unified definitions
Improved communication because of common vocabulary. (ASQ 2013)
Quality performance metrics, like every other performance metrics, have to be
monitored, showed and communicated regularly. They give important information
about the capability of process performance and at the same time they have a
psychological impact on people. Performance measures act as motivators for employees
to pursue for better. When people can see the results of their efforts, they will be
motivated to improve the issues that need to be focused on. (Dale 1999)
Listen to the customer
Understand the job
Understand interrelationships
Understand the linkages
Test the correlation and test manager and employee reaction
Involve managers and employees
Seek new paradigms

21
Quality can be measured based on the information coming from customers or internal
operations (Hoyle 2005). Customer-based measures may include for example customer
satisfaction, field failure statistics, customer returns, nonconformity statistics and lost
businesses. This information can be gathered by specific customer surveys or from daily
communication with customers. Internal performance measures can be related to
product quality or the quality of internal processes. The quality of internal processes can
be evaluated for example by measuring employee satisfaction, safety of the working
environment or process waste. (Dale 1999) Product quality is the most measured quality
indicator in most companies. The most common product quality measures include first
pass yield, defect rate, product return rate (non-defective), product return rate
(defective), rework rate and scrap rate. (Ghalayini et al. 1997)
2.2 Cost of quality
Cost of Quality (CoQ) is usually defined as “costs incurred because poor quality can
exist or because poor quality does exist.” In other words, quality costs incur to ensure
that quality standards are met or because quality standards are not met. (Albright &
Harold 1992) CoQ covers for example costs related to quality planning, implementation
and maintenance of quality management systems, quality improvements, reducing
wasteful work, customer complaints, scrap and warranty repairs (He 2010; Crosby
1979). According to De (2010), quality-related costs are generated from a number of
activities and involve all the departments in an organisation. These departments are
mainly:
Sales & marketing
Research & development
Purchasing, storage & handling
Production planning & control
Manufacturing
Delivery, installation
Service
Finance and accounts (De 2010)
Schiffauerova & Thomson (2006) have studied various models of classifying CoQ and
they have summarized the models into four groups: prevention-appraisal-failure (PAF)

22
or Crosby’s model, activity-based costing models, opportunity cost models and process
cost models. These models and related cost categories are presented in Table 2.
CoQ model Cost categories
PAF model Prevention
Appraisal
Failure
Crosby’s model Conformance
Non-conformance
Process cost model Conformance
Non-conformance
Activity-based costing Value-adding
Non-value-adding
Opportunity cost model Prevention
Appraisal
Failure
Opportunity
Table 2. CoQ models and related cost categories. Adapted from Schiffauerova &
Thomson (2006)
The simplest way to classify CoQ is the one introduced by Crosby (1979). He divides
them to conformance costs and non-conformance costs. Conformance costs are related
to quality assurance and non-conformance costs are caused by nonconforming products
or processes. (Crosby 1979) The PAF model is a slight modification to Crosby’s model
and it divides CoQ into three categories:
Prevention costs – these costs arise from efforts to avoid defects from
happening at all.
Appraisal costs – arise form detecting defects
Failure costs – arise from defects caught internally or externally and
dealt by discarding or repairing the items. (Campanella 1999)
Process cost model focuses on processes rather than on products or services. Quality
costs in this model are divided into conformance costs and non-conformance costs.
Conformance costs are the actual process costs of producing a product. Non-
conformance costs are the failure costs related to the process not working according to

23
standards. The costs can be measured at any step of the process. High conformance
costs can implicate the need for a process redesign while high non-conformance costs
may show the need for investing in failure preventing activities. (Porter & Rayner 1992)
According to Schiffauerova & Thomson (2006), process cost model might provide more
accurate information than PAF model since it recognises the importance of process cost
measurement and ownership. It is also presents a more integrated approach to quality
than the PAF model. However, process cost models are not in common use in
businesses.
Opportunity cost models are based on the fact that many quality costs are hidden or
intangible and are therefore difficult to evaluate (Schiffauerova & Thomson 2006).
According to Sandoval-Chavez and Beruvides (1998), CoQ is the revenue lost and
profit not earned because of bad quality. Opportunity cost models should not only be
seen as a separate model to evaluate CoQ but as an extension to the traditional models.
Even though intangible costs are difficult to estimate by, the need to include intangible
costs into CoQ calculations is widely recognised in the literature. For example Cheah et
al. (2011) claim that many intangible quality costs, such as quality of design or loss of
sales, are strategically important for companies and should be included in CoQ
calculations. There is also empirical evidence that introducing intangible costs in CoQ
calculations has resulted in reductions in CoQ. (Schiffauerova & Thomson 2006) For
these reasons, in this thesis, CoQ are classified according to the extended PAF model
where in addition to prevention, appraisal and failure costs, intangible (or hidden) costs
are taken into account. The extended PAF model presented in Figure 6.
Figure 6. Extended PAF model. Adapted from Schiffauerova & Thomson (2006).
2.2.1 Conformance costs
Prevention costs
Conformance costs
Prevention costs
Appraisal costs
Non-conformance costs
Internal failure costs
External failure costs
Intangible costs

24
Prevention costs are the costs of activities specially designed to prevent poor quality in
product or service. In financial sense, prevention costs should be considered as
investments rather than costs. Investments in preventive activities allow the organisation
to do things right every time. (Crosby 1979) Prevention costs can be for instance:
Planned inspections
Supplier evaluations and audits
Calibration of production equipment
Quality training for employees
Preventive maintenance
Administration (Campanella 1999)
The basic idea behind investing in preventive activities is that in general, preventing a
failure from happening is much more cost-efficient than repairing already made
mistakes later. (Schiffauerova & Thomson 2006) Prevention costs is the only CoQ
category which is value-adding while all other quality costs are non-value-adding. For
this reason, companies should not overlook preventive activities as they create
customer-value by improving the quality of products and services. (Tsai 1998) In the
long run, investing in preventive activities reduces the number of internal and external
failures and can reduce appraisal costs. (Schiffauerova & Thomson 2006)
Appraisal costs
Appraisal costs are all the costs that occur when executing inspections, tests and
evaluations to define whether a product or service fulfils the requirements. (Campanella
1999) The purpose of appraisal activities is to sort conforming and non-conforming
products through inspections and prevent defective products from being delivered to
customers. Once a defect is produced it is too late to do anything but remove it from the
process. (Dhafr et al. 2006) Appraisal costs include, for example:
Checking and testing purchased goods and services
In-process and final inspections
Field testing
Supplier performance monitoring
Calibration of measuring and test equipment (Crosby 1979)

25
According to Tsai (1998), appraisal costs are non-value-adding and are caused by low
quality products and processes. Also Schiffauerova & Thomson (2006) point out that
appraisal activities would not be needed if prevention was 100% effective. Of course
this is not realistic in today’s businesses, so appraisal activities have an important role in
reducing external failures. Reducing appraisal costs would most likely lead to an
increase in non-conformance costs. Figure 7 illustrates the impact of appraisal costs on
non-conformance costs. In the figure external failure costs are considered to be two
times the internal failure costs even though the real amount can be even higher. This
highlights the importance of appraisal costs. As external failures are much more
expensive than internal failures, realising defective products internally results in lower
total costs. (Cauchick Miguel & Pontel 2004)
Figure 7. Correlation between appraisal costs and failure costs (adapted from
Harrington 1987)
2.2.2 Non-conformance costs
Traditionally quality costs have been seen as costs of non-conformances, meaning
internal and external failures. However, it is important to expand the scope of non-
conformance costs to include the costs of inefficient processes and lost opportunities.
Even though most of these costs are hidden, intangible and difficult to measure, it is
very important to know that the visible non-conformance costs are only the “tip of the
iceberg”. (Campanella 1999) As De (2010) points out, it is essential to identify all the
potential cost elements in order to reduce quality costs and improve quality. According

26
to Schiffauerova & Thomson (2006), all non-conformance costs are non-value-adding
and thus a reduction in non-conformance costs results directly in larger profits.
Internal failure costs
Internal failure costs are the costs associated with defects when found before shipment
of the product to the customers. They include the costs that incur from the time that an
item is shipped from a supplier until it is accepted by the customer. If failures are not
found in-house, non-conforming products are shipped to customers causing external
failures. Internal failure costs can be caused by defective products but also defective or
wasteful processes are considered to be internal failure costs. (Campanella 1999).
According to Omachonu et al. (2004), internal failure costs include:
Scrap cost
Loss cost
Rework cost
Failure analysis cost
Re-inspection and re-testing cost
Downgrading cost
External failure costs
External failure costs are created when a defective product is received by the customer
(Dale 1999). According to Cauchick Miguel & Pontel (2004), external failure costs is
the most important CoQ category as it is expensive to repair the defective product if it
has already been shipped to a customer. In addition, many intangible costs are
especially related to external failures. External failure costs include costs related to:
Complaints
Product service: liability
Products returned or recalled
Returned material repair
Warranty replacement (Tsai 1998)

27
Warranty claims are the most significant cause of external failure costs. Warranty is an
agreement between a vendor and a customer where the vendor is required to replace or
compensate a non-conforming product during the warranty period. (Schiffauerova &
Thomson 2006) Even though warranty costs can be large, they can be reduced by
removing the root cause of the problem with simple problem-solving methods.
(Cauchick Miguel & Pontel 2004). According to Sower (2004), external failure costs
can be reduced by investing in prevention and appraisal of the quality problems.
Intangible costs
The traditional PAF model has several limitations that restrict the determination of total
non-conformance costs (Tsai 1998). Many failure costs such as warranty repairs or
rework are available in the accounting records but other costs have to be estimated.
These are, for instance:
Down-time
Excess inventory
Lost sales
Lost customer goodwill (Albright & Harold 1992; Cheah et al. 2011)
As these costs are usually not recorded in the accounting system, they are called
intangible or hidden quality costs (Albright & Harold 1992). Sandoval-Chavez and
Beruvides (1998) have identified three types of intangible costs that companies should
take into account: underutilization of installed capacity, inadequate material handling
and poor delivery of service.
2.2.3 Classical and modern views of quality costs
There are a couple of ways to model the proportions of the CoQ categories. According
to the classical model, which is presented in Figure 8, there is a clear trade-off between
conformance costs and non-conformance costs. (Schiffauerova & Thomson 2006) When
the quality level is low, non-conformance costs are naturally high. If a company wants
to improve their quality it has to invest in prevention and appraisal (conformance)
activities. When approaching 100% quality level, conformance costs rise exponentially.
(Crosby 1979) Therefore, the classical model assumes that the optimal quality level in
terms of total costs, is not 100%. The lowest total costs are at the level where the cost of

28
securing higher quality would exceed the benefits of higher quality. (Schiffauerova &
Thomson 2006)
Figure 8. Classical model of CoQ (adapted from Schiffauerova & Thomson 2006)
The classical model of quality cost behaviour is often challenged and it is argued that
spending on prevention and appraisal activities is always justified (Schiffauerova &
Thomson 2006) The modern approach (Figure 9) assumes that the conformance costs
increase linearly as the quality level increases. Therefore the optimal quality level is
100%. (Omachonu et al. 2004) According to Schiffauerova & Thomson (2006),
empirical research shows that the CoQ behave according to the classical model when
considering short-term quality improvements. However, in a longer time horizon,
modern model is more accurate. Burgess (1996) states that his simulations support the
classical view in a static environment but the business situations are often
multidimensional and dynamic where non-conformance costs can continue to decline
without corresponding increase in conformance costs. This supports the use of modern
model. (Burgess 1996)

29
Figure 9. Modern model of CoQ (adapted from Omachonu et al. 2004)
2.2.4 Measuring the cost of quality
Regardless of the CoQ model used, measuring CoQ is essential as companies try to
satisfy the needs of their customers with least amount of resources (Dale 1999).
However, the available data in companies about CoQ is often inconsistent and does
support accurate measures on CoQ (Schiffauerova & Thomson 2006). According to
Yang (2008), there are four critical issues that are required from an effective quality
cost technique:
Establish appropriate categorization of various quality costs, and ensure
that every item of quality costs is captured;
Collect and analyse the relevant data thoroughly, and thus to quantify all
quality-cost items accurately;
Identify areas of poor performance on the basis of the above data
analysis; and
Allocate responsibilities for the overall cost.
According to Porter & Rayner (1992), companies often measure visible and easily
measurable costs, such as scrap and warranty but they tend to ignore hidden, intangible
opportunity costs. Even though evaluating intangible costs is difficult, it is better to
have a rough estimation of them than ignoring them completely (Sower 2004). Ignoring
some of the cost components leads to significant underestimations in total quality costs.
Accurate and reliable information about CoQ is important and can be used to improve

30
quality (Williams et al. 1999; De 2009). Dale (1999) presents four uses for the CoQ
information:
possibility to control and plan quality costs
promoting quality as a business parameter
possibility to measure productivity and efficiency form cost perspective
motivation for quality improvements
The measurement of CoQ allows quality-related activities to be expressed in the
language of top management, i.e. money. This enables that quality is treated as a
business parameter along with functions such as marketing, production or research and
development. Drawing attention to CoQ emphasizes the importance of product and
service quality and encourages employees towards thinking continuous quality
improvements. Also, accurate CoQ measurements help draw attention to problematic
areas and helps internal comparisons between products, services, processes and
departments. Finally, measuring CoQ is the first step towards actually controlling CoQ
and quality improvement activities. (De 2009)
Many researchers have studied the total amount of CoQ in various industries. Dale and
Plunkett (1991) have estimated that the proportion of quality costs is about 5-25 % of
the revenue of a company. According to Schonberger (1986), the proportion is 15-30 %
in manufacturing companies. Plunkett and Dale (1988) have studied how quality costs
are divided between the components of the PAF model. According to them, prevention
costs account of about 2.5% of the total costs, appraisal costs are approximately 10%
and failure costs 87.5%. Sandoval-Chavez and Beruvides (1998) have similar results.
According to them, the proportion of prevention costs is very small compared to the
appraisal, failure and intangible costs. They also found correlation between increase in
prevention costs and decrease of non-conformance costs.
2.3 Quality nonconformity management
The terminology around nonconformities and nonconformity management is not at all
clear (Kari 2012). In QM literature, the terminology regarding nonconformities varies
between scientists and business practitioners. Terms such as variation, deviation,
incident, event, defect, and failure are used as a synonym for a nonconformity even

31
though the meanings are slightly different. (Bredehoeft & O’Hara 2009). Variation is
defined as the difference between ideal and actual situation. An ideal situation means a
standard of perfection which is defined by a stakeholder, for example a customer.
Variation should not be used as a synonym for nonconformity as variation in a process
does not result in a nonconformity if control limits are not exceeded. (Escalante 1999)
In regulated industries, such as medical and food, where all nonconformities must be
reported and analysed, the terms deviation and incident are used. Incidents are defined
as “unexpected events” that are related to for example operation maintenance, safety or
regulatory compliance (Escalante 1999). Deviation is defined as “an unplanned
departure from current good manufacturing practices, regulations, standards, procedures
or specifications that may affect product safety, quality, identity or purity” (Bredehoeft
& O’Hara 2009).
While term deviation is mostly used to describe incidents and errors in manufacturing,
the term nonconformity is more comprehensive. It covers events such as non-
conforming material, non-conforming operating procedures and process deviations.
(Escalante 1999) Mitra (2016) defines nonconformity as a quality characteristic that
does not meet its stipulated specifications requirement. A nonconforming unit is “one
that has one or more nonconformities such that the unit is unable to meet the intended
standards and is unusable to function as required”. According to Hoyle (2005),
nonconformities can be either product or process related but companies tend to focus
mainly on product related issues in their QM activities. Process related nonconformities
arise from inefficient processes and they are often regarded as waste. Product related
nonconformities can be either internal or external and a nonconforming product fails to
meet at least one of the below mentioned requirements:
Specified customer requirements
Intended usage requirements
Stated or implied needs
Organisation’s own requirements
Customer expectations
Hoyle (2005) divides nonconformities into three categories according to their severity.
These categories are critical nonconformity: product is unfit for use, major
nonconformity: product does not fulfil the requirements included in contract or customer

32
specification and minor nonconformity: product does not fulfil the requirements not
included in contract or customer specification. Savino et al. (2014) claim that the
criticality of a nonconformity should be evaluated with four attributes: cost, occurrence,
gravity (or consequences) and detection point. Nonconformities should be categorised
and prioritised according to these attributes. Also Donauer et al. (2015a) state that it is
important to categorise and prioritise nonconformities because quality improvement
projects are competing with each other and it is important to know where the potential
benefits are the highest. Donauer et al. (2015a) present a prioritisation matrix for
evaluating the criticality of nonconformities. The matrix is based on risk level attributes
and causes and impact attributes, which are illustrated in Table 3.
Attributes Definition
Ris
k a
ttri
bu
tes
Occurrence Total numbers of nonconformities in a given
period
Severity The impact of a given nonconformity if
delivered to a customer
Detectability The difficulty of detecting a nonconformity
Cau
ses
and i
mpac
ts a
ttri
bute
s
Rework rate The number of products reworked in relation
to its number of occurrences of a specific
nonconformity
Scrap rate The number of products scrapped in relation to
its number of occurrences of a specific
nonconformity
Concentration of
nonconformities at
specific manufacturing
machines
The concentration of occurrences of
nonconformities at a given machine
Correlation of
nonconformities to a
specific product
attribute
The occurrence of nonconformities in a
specific product attribute
Cost Scrap or rework cost of a product
Customer complaints The occurrences of customer complaints
related to a specific nonconformity
Table 3. List of attributes for nonconformity criticality evaluation. (Adapted from
Donauer et al. 2015a)
Quality nonconformity management (QNCM) is an essential part of the quality
management system in any manufacturing organisation. A well-designed QNCM
system offers a mechanism for gathering critical quality data in real-time. The data

33
enables quick reactions to failures, warnings of potential failures and transferring
resources to problematic areas. Failure to understand and control quality
nonconformities can result in severe financial losses and it can harm the organisation’s
brand. (Bredehoeft & O’Hara 2009).
According to Kari (2012), the goals and benefits of QNCM are aligned with the overall
QM benefits. These benefits include:
High quality of processes and products
Eliminating waste from processes
Customer focus, internal and external customer satisfaction, stakeholder
satisfaction
Collaboration along the supply chain
Preventing nonconformities
Reducing CoQ, detecting nonconformities as early as possible
Continuous improvement and learning
Development of risk management
Better manageability of business
2.3.1 Quality nonconformities in manufacturing
Products may become nonconforming in manufacturing because of insufficient
performance of a processing operation (Shetwan et al. 2011). The main reasons for
nonconformities are equipment malfunction, process variation, surroundings and an
improper process operation. In other words, manufacturing system variables affecting
product quality are related to operators’ skills, capability of machines, human actions
during the production process and workplace environment. (Dhafr et al. 2006) The
nonconformities vary from minor, recoverable cosmetic problems to severe
imperfections that may not be recoverable. The various sources for manufacturing
nonconformities are illustrated in Figure 10. It is worth noting that a nonconforming
product can be caused by a single fault or by a combination of several faults. (Donauer
et al. 2015a)

34
Figure 10. Fault tree for defining sources of nonconformities in manufacturing.
(Adapted from Dhafr et al. 2006; Aravindan & Maiti 2012)
According to Lilrank & Kujala (2005) there are two causes for quality nonconformities
in manufacturing that should not be confused with each other:
Common causes – process is running normally, but there is variation in
the process and it effects all the outputs of the process
Special causes – variation is caused by an unusual event in the process
which is not a normal part of the process.
It has been discovered that up to 95% of quality problems in manufacturing arise from
common causes, i.e. flaws in the design of the production system when it is run under
normal conditions (Lillrank & Kujala 2005). Removing the common causes requires
improvements in the manufacturing process (Hoyle 2005). To remove special causes
form the production process, the primary focus should be in isolating the problem. Data
must be collected as soon as possible so that the problem can be localised to a certain
process point. Then, unsatisfactory designs or working methods can be corrected (Britz
2000).
On the production line, nonconformities are detected at inspections stations where
product appraisal is performed (Shetwan et al. 2011). Usually inspections are made by
employees who manually assess the product for conformance to requirements.
Conforming products are accepted and forwarded to the next process phase.
Nonconforming products are rejected and the nonconformity type is added to the
Nonconforming product
Operator error
Inadequate skills
Ignorance of opearation instruction
Machine fault
Faulty machine design
Temporary fault
Surroundings
Inadequate cleaning
Contamination not noticed
Fault in the process
Inadequate procedure
Procedure temporarily inadequate
Faulty raw material

35
information system. Nonconforming products may be recoverable or unrecoverable.
Recoverable products are sent to rework or repair and unrecoverable products are
scrapped. (Donauer et al. 2015a)
2.3.2 Quality nonconformity management process
Organisations are required to solve discovered nonconformities, identify their causes,
plan and implement corrective actions and eliminate the causes of nonconformities
(Nikolay 2016). In order to solve nonconformities effectively, a standard process for
recording and analysing nonconformities should be developed. (Dhafr et al. 2006)
According to Bredehoeft & O’Hara (2009), the nonconformity management process is
designed to describe which activities are required from the moment that a
nonconformity is detected until it is solved. The process includes incident discovery,
reporting, data collection and analysis, root cause analysis and corrective and preventive
actions (CAPA) plan and execution (Boltic et al. 2010; Bredehoeft & O’Hara 2009).
This nonconformity management process is presented in Figure 11.

36
Figure 11. Quality nonconformity management process. Constructed from Kari (2012);
Bredehoeft & O’Hara (2009) & Majanoja et al. (2017).
The first step in nonconformity management process is nonconformity discovery. The
source of a nonconformity can be in various places for example order handling, raw
material, production (machine or operator error) or logistics. However, nonconformities
are often discovered a lot after they are formed. (Bredehoeft & O'Hara 2009) Savino et
al. (2014) have identified five detection points were nonconformities can be discovered:
material acceptance, production line, quality control point (inspection), final testing and
customer. The later the nonconformity is found, the higher is the criticality of the
nonconformity. In other words, nonconformities discovered by customers should be
treated with higher priority than nonconformities found in incoming material
acceptance. After a nonconformity has been discovered, the first action is to prevent the
NC discovery:
• NC sources can be e.g. in operator errors, machines, processes
• NCs are revealed by e.g. QC, customer complaints, warranties
• Tools, e.g. kaizen, jidoka, TPM and 5S can help revealing NCs
• Rewarding systems, training and management support encourage revealing NCs
Reporting:
• Key information: who, what, where, when
• Root cause, if available
• Risk-level effects the urgency of the NC
• NC records are stored into databases
o information can be used in QM
Ad hoc corrections:
• Immediate actions
according to the situation
• Report to stakeholders
Data analysis and collection:
• Additional information about the NC by e.g. interviews, databases, documents,
inspections, simulations or testing
• Prioritising actions based on e.g. FMEA, RPN, Pareto-analysis, quality costs
• Categorising the data e.g. root causes, process steps, products
Root cause analysis:
• Tools e.g. fishbone diagram, five why matrices, FMEA, flowcharts, value-
stream maps, brainstorming etc.
• The target is to create a NC free process, not to find the guilty person
• There can be multiple root causes for a NC and one root cause can cause
multiple NCs
• CAPA plan and execution:
• Develop an action plan (responsibilities, target schedule, follow-up, metrics)
to correct the problem and prevent the occurrence
• Implement CAPA plan
• Evaluate the effectiveness of CAPA
37
escalation of the nonconformity with ad hoc corrections. For example, if nonconforming
raw material is detected by an operator on the production line, the immediate action
should be to remove the nonconforming material, prevent the usage of nonconforming
material in any products and inform the stakeholders about the situation. (Majanoja et
al. 2017) Several tools can be used to help people discover nonconformities. These tools
include for example kaizen, jidoka, 5S, reward systems and TPM (Bredehoeft & O'Hara
2009).
After the nonconformity has been discovered, it needs to be documented into a reporting
system. The document should clearly state who discovered the nonconformity, what
exactly happened, where it happened and when the nonconformity occurred. (Hoyle
2005) Bredehoeft & O’Hara (2009) present a good and a bad example of a
nonconformity description:
good example: “On Friday Feb3 2008, during the manufacturing of drug
ABC, in room B-2 the technician failed to take the hourly in-process
sample at 4pm as per SOP (standard operating procedure) 1234.”
Bad example: “Cycle count from machine hours 4:20 to 9:36 is not
correct. The 24-hour inspection not performed. Cycle count from 9 to 11
is not possible.”
Some nonconformities can be solved immediately after they occur but at least critical
nonconformities have to be taken into closer analysis. The investigation starts by
gathering more information about the nonconformity. (Majanoja et al. 2017) This can
be done by for example interviewing personnel, reviewing records, testing and
inspecting products or materials, observing operations or reviewing similar
nonconformities. Gathering facts about the situation enables the investigators to fully
understand the situation. It also forms a good basis for the root cause analysis. As
information is gathered, investigators should not immediately jump to conclusions about
what happened and how because this could prevent discovering additional information
leading to a more comprehensive analysis of the situation. Incomplete understanding
may also limit the ability to analyse the root causes of the nonconformity. (Bredehoeft
& O’Hara 2009)

38
Root cause analysis an approach used to identify the underlying reason for a
nonconformity (Motschman & Moore 1999). It is an important part of the
nonconformity management processes because actions taken to correct and prevent the
nonconformity are directly linked to finding the right root causes. Finding the right root
causes is not always easy. The reasons for a nonconformity can often be something else
than it seems to be at first glance. Also, there may be multiple root cause that are
contributing to the same nonconformity. (Dale 1999) The team analysing the root cause
should consist of people who: perform the steps of the process, supervise the process,
are knowledgeable about the process but are not directly linked to its performance or
supervision, and are knowledgeable about process improvement tools and activities
(Motschman & Moore 1999). Several techniques exist to support effective root cause
analysis, such as, brainstorming, value stream mapping, flowcharts, cause and effect or
fishbone diagrams, failure mode and effect analysis (FMEA) and five why matrices.
The root cause of a nonconformity can usually be attributed to a defect in the system
design (i.e. inadequate procedures, materials, facilities or personnel). In circumstances
where two or more potential root causes exist, investigators should prioritize the list
from most probable to least probable causes. CAPA plan can then be done to focus on
the causes that are most likely causing the nonconformity. (Bredehoeft & O’Hara 2009)
Once the root causes of the nonconformity are defined, CAPA plan can be created. This
means that corrective and preventive actions are planned in order to find solutions to
correct the nonconformity and prevent it from happening again. Corrective actions are
reactive and are targeted for nonconformities that have already happened whereas
preventive actions are proactive and focus on eliminating potential future
nonconformities by eliminating the root causes. (Motschman & Moore 1999) A CAPA
plan should include at least:
Actions – the actions planned to correct and prevent the nonconformity
Implementation plan
Target schedule
Responsibilities – responsible people should have the power the implement the
planned actions
Follow-up plan – plan to follow and measure the effectiveness of the taken
actions (Bredehoeft & O’Hara 2009)

39
Quality unit has an important role in overseeing the nonconformity management
process. The quality unit employees make sure that each key step is performed
appropriately form discovery and reporting through CAPA completion and verification.
(Majanoja et al. 2017) The quality unit also assures that the investigators have explored
all the possible aspects of the nonconformity, assessed the potential risks and used the
correct investigation techniques. Some of the tasks of the quality unit include:
Initial review and criticality evaluation after nonconformity discovery
Review and approval of investigation report
Review and approval of CAPA
Monitoring and ensuring that the projects are on schedule
Tracking trends in nonconformities
Generate and issue nonconformity status reports
Communication to senior management about critical nonconformities
Provide training about the nonconformity management system
(Bredehoeft & O’Hara 2009)
2.4 Quality nonconformity data management
Organisational knowledge depends heavily on the IT solutions and the data that is
collected in them. For this reason, it is more and more important that the IT systems are
well designed and implemented to facilitate knowledge creation, storage, transfer and
sharing, both inside and outside the company’s boundaries. (Majanoja et al. 2017) In
terms of QNCM, all companies have at least three types of nonconformities to handle in
their IT systems: supplier nonconformities, internal nonconformities and customer
complaints. This puts pressure on the data collection and management as the different
types of nonconformities have all have a specific work flow and different requirements
for actions and documentation. (Oxfeldt 2013) It is important that all the needed data is
collected so root cause analysis is possible. When collected and analysed correctly
nonconformity data management enables quality improvements as well as time and cost
savings. (Hoyle 2005) Also Provost & Fawcett (2013) have recognised that data driven
decision making improves business performance.

40
2.4.1 Quality nonconformity data collection
Before implementing a quality nonconformity management system (QNCMS),
requirements for data collection have to be planned (Chin et. al 2004). Like with all data
collection activities, the collected nonconformity data should be linked to overall targets
of the organisation. The data should support the achievement of quality targets,
otherwise the data is not needed. (Bredehoeft & O’Hara 2009). According to Hoyle
(2005), the purpose of setting data requirements is that you only:
collect data on nonconformities that you are planning to analyse
analyse data with the intention of discovering problems
provide solutions for real problems
implement solutions that will improve performance
Setting the data requirements is essential in the success of the QNCMS. Failure to
define the requirements may lead to data paralysis which means that the amount of data
is overwhelming and therefore it cannot be used for problem-solving. (Hoyle 2005)
Also Bredehoeft & O’Hara (2009) state that irrelevant and excessive information should
be avoided in nonconformity reporting as it only confuses the person investigating the
nonconformity. On the other hand, if all the needed data is not collected, fact-based
problem-solving is not possible.
Figure 12. Nonconformity data collection process (constructed from Hoyle (2005);
Chin et al. (2004) & Bredehoeft & O’Hara (2009))
According to ISO 9000:2015, records must be kept about the nature of nonconformities,
as well as the corrective actions taken to solve nonconformities. A quality

41
nonconformity management system (QNCMS) should ensure that nonconformities are
reported immediately, the severity is assessed and the appropriate CAPAs are identified.
(Boltic et al. 2010) The nonconformities are reported in order to save the information
for immediate and later use. The aim of the nonconformity report is also to collect and
transfer nonconformity information inside the organisation but also to external
stakeholders. (Hoyle 2005) The data collection has to be aligned with the QNCM
process. Whenever new information emerges, the nonconformity report has to be
updated. (Majanoja et al. 2017) The nonconformity data collection process is presented
in Figure 12. Nonconformity reports should contain at least the following information:
documented details of the product, the specific deviations from requirements (what it is
and what it should have been), the condition where the nonconformity was detected,
time and date of detection, person detecting it and the actions taken, revised
requirements and decisions. (Hoyle 2005) A person who understands the subject and
surroundings should evaluate and approve the content of the report as well as assess the
risk related to the nonconformity (Bredehoeft & O’Hara 2009). Majanoja et al. (2017)
present a C5 model for the information needed in nonconformity reporting. The model
is based on five Cs: condition, cause, correction, communication and cost. These
elements are further explained in Table 4. Nonconformities shall be recorded with a
standard report form so that they can be handled in a consistent manner. This also
enables that the data collected to the nonconformity database can be used to find quality
improvements. In addition, consistent data collection allows for example generating
trending data based on the same parameters. (Bredehoeft & O’Hara 2009)
C5 element Data attribute
Condition Failures experienced
Customers impacted
Countries impacted
Product impacted
Quantities impacted
Locations of product
Sources of product
Cause Root-cause
Correction Solution
Solution schedule
Solution location

42
Communication Contact people
Plan and schedule
Cost Cost to customer
Cost to company
Table 4. C5 model for nonconformity data collection. (Adapted from Majanoja et al.
2017)
According to Oxfeldt (2013), QNCMS should not be a separate system but to interact
directly with the ERP (enterprise resource planning) and MES (manufacturing execution
system) systems used in a company. These systems can provide additional and
important information to nonconformity reports. The information can be related to for
example testing records, calibration or complaints management. Integrating other
systems with QNCMS eliminates the need for redundant processes and reduces the time
needed for investigating a nonconformity. (Bredehoeft & O’Hara 2009)
2.4.2 Quality nonconformity data utilisation
According to Boltic et al. (2010), nonconformity data can support the measurement of
achieving quality objectives. Performance measures for QNCM can be linked to some
of the most common KPIs related to efficiency, including for example cost per unit,
higher utilisation, reduction of waste and non-value-added activities. Nonconformity
data can provide information to fully or partially measure these indicators. The relation
between KPIs, performance measures and nonconformity data analysis is presented in
Figure 13. According to Kari (2012), collected and analysed data from QNCM
processes acts as an input for business development in for example QM, production
planning, safety, risk management, process development and supply chain management.

43
Figure 13. The relation between KPIs, performance measures and nonconformity data
analysis (adapted from Boltic et al. 2010)
Once nonconformity data is collected into a nonconformity database in a systematic and
consistent way, it can be used to understand and analyse problematic areas that need to
be improved (McGurk & Snee 2005). Manufacturing companies often collect data about
their processes, but transferring the data into usable knowledge is something that many
companies are not capable of doing. If a suitable tool for data analysis is not available,
the knowledge remains hidden in the databases. (Donauer et al. 2015b) Donauer et al.
(2013) present a process for transferring nonconformity data into usable knowledge.
This process is presented in Figure 14. It starts by selecting a relevant dataset from the
nonconformity database. The target data must be processed to remove “noise” and
abnormalities from the data before it can be processed further. The cleaned data can
then be fed with specific algorithms to generate patterns. Finally, patterns must be
interpreted and evaluated to extract relevant knowledge.
Figure 14. Knowledge discovery from nonconformity data (adapted from Donauer et
al. 2013)
Companies that have the most mature QNCM capabilities use the data about
nonconformities to improve and upgrade their systems and processes continuously to
KPIs
• Strategic, specific and few
Performance measures
• Sensitive and precise measures to support KPIs
Data analysis
• Understandable information
• Simple for interpretation
Data Selection
& processing
Processed data
Data mining
Patterns Analysis/ evaluation
Knowledge

44
reduce risks and costs. On the other hand, companies that are less mature in their
QNCM capabilities are only able to eliminate individual nonconformities in the interest
of short-term objectives such as batch dispositions. (McGurk & Snee 2005). A mature
QNCMS allows companies to analyse company-level nonconformity data which allows
the identification of overall trends and prediction of potential failures that would affect
the achievement of a product, process or QMS requirements. (Hoyle 2005)
One way of analysing the information about reported nonconformities is to classify
them and look for trends and patterns. When nonconformities are classified, one can get
a sense of the most frequently occurring problems within a system, process or facility.
Those nonconformities that are occurring more frequently or have the highest priority,
can be targeted with CAPA. The most effective classification methods involve the use
of multiple categories so that patterns, that have not caught the attention before, can
emerge. (Motschman & Moore 1999) The probability of finding root causes of system
failures and making corrections more sustainable may be increased by using six sigma
tools. (Boltic et al. 2010) According to Donauer et al. (2015b), data analysis and data
mining tools are especially needed in a mass production environment, where finding the
root cause for an individual nonconformity can be difficult because of multiple
sequential process steps. One example of data analysis tools is Pareto analysis that can
be conducted to find the most critical nonconformities from a large amount of data.
Being able to eliminate the most critical nonconformities will reduce the process
variance significantly. (Hoyle 2005)
An example of analysing system level failures is illustrated in Figure 15. In the
example, a system consists of five separate processes. First step of the analysis is to
categorize nonconformities by systems and identify the most critical systems according
to the amount or total impact of related nonconformities. The critical systems are taken
into closer analysis. Then, a Pareto chart can be used to categorize the nonconformities
for a given system on a process level. (McGurk & Snee 2005) The processes that are the
major sources of nonconformities (largest bars in the pareto chart) are the problems that
have to be solved first. Combined with the data about non-conformance costs, the
problems can be prioritised according to their cost impact. (Kubiak & Benbow 2009).

45
Figure 15. An example of using nonconformity data to find process improvements
(McGurk & Snee 2005; Boltic et al. 2010)
2.5 Synthesis
Quality nonconformity as a term is very comprehensive. It covers incidents related to
product, process and system quality, and they can vary from minor cosmetic flaws to
severe issues that may harm the overall success of a company. Nonconformities can be
roughly divided into two categories: internal and external nonconformities. Internal
nonconformities are discovered internally while external nonconformities are only
discovered after a product has been shipped to a customer. Obviously it is important to
address and manage both of the nonconformity categories, but in terms of costs,
external nonconformities, i.e. warranty claims, are more important as they generate
more quality costs.
In general, quality nonconformities are a significant source of quality costs. The costs
can be either conformance or non-conformance costs. As nonconformities occur, they
generate internal or external failure costs depending on where the nonconformity is
discovered. These costs can be reduced in prevention and appraisal activities, so that
nonconformities do not occur and if they occur, they are discovered internally. Of
course investing in nonconformity prevention and appraisal also costs money but if
these projects are successful, they can lead to significant reductions in non-conformance
costs and reduce the overall costs. It is good to remember that many of the quality costs

46
are hidden, and therefore it is difficult to evaluate the overall quality costs in companies.
Many of the hidden costs, such as lost sales or underutilised capacity are caused by
nonconformities that have occurred. Quality costing is an important part of QNCM.
Putting a price tag on an individual nonconformity or on nonconformities as a whole
can increase the awareness of the impacts of nonconformities. In addition, quality
costing can be used to prioritise nonconformities and evaluate preventive actions.
Following quality costs also helps in business development and guides companies
towards financial success. The main goal of QNCM is to minimise the internal and
external failure costs. Doing this reduces the hidden quality costs as well.
The formal QNCM process includes five phases: nonconformity discovery,
nonconformity reporting and ad hoc corrections, data analysis and correction, root cause
analysis and CAPA plan and execution. Solving a nonconformity should always follow
this process but the scope of each process phase has to be modified based on the
criticality of the nonconformity. The goals and benefits of QNCM are aligned with
overall QM benefits. With an effective QNCM process companies can for example
ensure the high quality of products and processes, satisfy internal and external
customers’ needs, minimise nonconformities and reduce non-conformance costs.
Data management is an essential part of QNCM. Nonconformity data can be used for
improvements in operations but only if the data is managed correctly. In practice,
nonconformity reporting is at least partly manual work in companies which emphasises
the importance of defining the requirements for data collection. Requirements should be
set so that the collected data supports quality improvements and the achievement of
quality targets. Also data requirements should ensure that all relevant information is
collected. Clear definition of data requirements enables that nonconformity reports can
be evaluated with the same parameters and that the data is consistent. A model for
quality nonconformity data management is presented in Figure 16. The model is
constructed based on the literature review.

47
Figure 16. Model for quality nonconformity data management. Constructed based on
the literature review.
Data requirements:
C5 model
o condition, cause, correction,
cost, contact
Training of employees to enable the
consistency of data
Integration with other information
systems:
information transfer between MES,
ERP and NC reporting system
Initial NC report after NC discovery:
All NCs have to be reported after discovery
Standardised format for NC reporting
Final NC report after QNCM process:
NC report has to be updated when new information comes up
Root cause information, CAPA plan and execution information
NC database:
Collecting all NC reports into a NC database
Common database for different NC categories: internal and external
Data analysis and knowledge discovery:
Extracting knowledge from data
Enabling fact-based decision-making
Finding NC trends and patterns using
quality tools / data analysis tools
KPI reporting:
Reporting based on quality targets
and metrics
Sharing information with
stakeholders
Reacting and focusing on
problematic areas
Business development:
Improvement projects on problematic areas
Prioritising actions and projects based on their criticality

48
3 EMPIRICAL RESEARCH
3.1 Research methods
The empirical research process starts with gathering information about the current state
of nonconformity data collection and utilisation in the case company. This is done in
three parts. Firstly, the current nonconformity management system and its possibilities
are studied by analysing previously collected data. Then, internal interviews are
conducted to understand the requirements and challenges in the quality nonconformity
data and its utilisation. Internal interviews are also used to get improvement ideas. After
internal interviews, benchmarking visits are done to four pre-selected companies to
collect best practices from the field. After all information fathering is done, results are
analysed. Final improvement plan presented in the discussion chapter. The research
process for the empirical section is presented in Figure 17.
Figure 17. Empirical research process.
3.1.1 Internal interviews
A total of 12 people were interviewed from ABB. The target of these interviews was to
understand the requirements, challenges and problems in the current quality
nonconformity data and its usage. The interviewees consisted of people from different
departments and functions of the case company. The people were mainly from the
managerial levels in their functions. The variety of interviewees ensured a wide
overview of the current QNCM practises within the case company. The interview group
included:
3 people from operations (incl. production)
Information gathering:
• Internal interviews
• Benchmarking interviews
• Nonconformity data analysis
Analysis:
• Requirements, problems and ideas from internal interviews
• Best practices from benchmarking
• Results from data analysis
Results:
• Improvement plan
• Implementation of the results
• Answer to RQ2

49
2 people form supply chain management
2 people from purchasing
2 people from R&D
1 person from application engineering
1 person from customer support
1 person from quality & operational development
Internal interviews were conducted as semi-structured interviews based on 15 questions.
Interview questions were designed based on the literature review and divided into four
sections: quality, quality targets and measures, QNCM, QNCDM and communication
and reporting. All interviews were done in Finnish. The focus of the interview changed
a little bit depending on the interview but all of these topics were discussed in all of the
interviews. The interview frame is presented in Appendix 1. One interview lasted
approximately one hour and all interviews were recorded. After the interviews were
done, the answers of each question were collected to an Excel sheet. The most common
answers were then combined as key findings from the interviews. The findings are
described in chapter 3.4.
3.1.2 Benchmarking
In total, four companies were visited for benchmarking. The goal of the benchmarking
visits was to understand how QNCM and especially QNCDM is done in other
businesses and get ideas that may be applicable for ABB as well. Companies were
chosen to be large or medium-large and they are all known for their efforts in quality
management work. The benchmarking companies are operating in various industries:
Company A: Mobile technology company (50,000 employees)
Company B: Oil refining and marketing company (5,000 employees)
Company C: bio-based chemicals and polymers manufacturing and marketing
company (2,000 employees)
Company D: Pharmaceuticals company (3,500 employees)
In each benchmarking visit, a quality manager was interviewed. Benchmarking
interviews were conducted as semi-structured interviews and the interview frame was
divided into three sections: quality targets and metrics, QNCM and QNCDM and
Quality reporting and communication. Each section consisted of a couple of questions

50
and the whole interview frame for benchmarking is presented in Appendix 2. All
interviews were done in Finnish. Each interview lasted about two hours. All interviews
were recorded and transcribed afterwards. The results from each company were then
gathered into an Excel sheet where they were analysed and compared. Finally, best
practices of each topic were gathered as key results of the benchmarking section. These
results are presented in chapter 3.5.
3.2 Research environment – ABB Motors and Generators
The case company for this thesis is the Motors and Generators business unit of ABB. To
be more precise, the thesis considers the factory that is located in Vaasa, Finland. ABB
is a Swedish-Swiss based power and automation technologies provider that has
headquarters in Zürich, Switzerland. ABB’s share is listed in Stockholm, Zürich and
New York stock exchanges. The company is known for their expertise in the fields of
electrification, power grids, robotics and motion. ABB products are designed to improve
the overall efficiency and competitiveness of customers. The customers of ABB include
utility, industry, transport and infrastructure companies. Globally ABB operates in
around 100 countries and has approximately 135,000 employees. In Finland, the total
amount of employees is roughly 5,300 in about 20 locations. This means that ABB is
one of the biggest industrial employers in Finland. (ABB 2018a)
ABB group is organised into four divisions according to customers and industries they
serve. The business unit Motors and Generators belongs to Robotics and Motion
division. The Motors and Generators business unit offers a comprehensive range of
reliable high efficiency motors and generators for all applications. In Finland, the
factories of Motors and Generators unit are located in Vaasa and Helsinki. In Vaasa,
ABB designs, manufactures and markets low voltage motors and generators which are
used in for example chemical, pulp and paper, metal and marine industries. The Vaasa
factory is capable of providing motors for challenging environments, such as potentially
explosive atmospheres. The products are configurable motors and each product is
custom-made. This means that when customers are placing orders, they may choose the
needed features from predefined variant codes. After the variant codes have been
selected, a module structure is created for the motor. (ABB 2018a)

51
In Vaasa factory the annual production volume is approximately 70,000 motors.
Because most of the motors are custom-made, there are about 30,000 different motor
variants included in this number. This means that the average production lot size is
somewhere between two and three. (ABB 2018b) The small production lot size means
that there is a lot of variance in the whole supply chain. This also sets a lot of challenges
in the field of quality management as the high amount of variance in product portfolio
also means that there are many possibilities to make errors. The problem is widely
acknowledged in the case company. Quality is recognised as one of the key
improvement areas and a quality road map has been created to improve quality. One
aspect of this road map is better analysis and utilisation of quality data which is also the
target in this thesis.
3.3 Quality nonconformity data management – current situation at
ABB
Quality nonconformity cases at ABB are divided into two different categories, which
are warranty cases (customer complaints) and internal quality nonconformities.
Warranty cases are quality nonconformities where a customer has received a
nonconforming product and is requesting to replace or repair the product or part of the
product. Warranty cases are handled by the After Sales team and the cases are managed
in an After Sales tool. When a customer complaint is received, basic information about
the situation is collected into the system. This includes
Claim number
Serial number of the motor
Motor type
Product code
Running hours of the motor
Quantity of nonconforming products
Defect code
Creation date or the warranty case
Manufacturing date of the motor
Delivery date of the motor
Name of the customer
Status of the warranty case

52
Internal quality nonconformities are cases where the quality problem is noticed in
internal operations, before the nonconforming product has been delivered to a customer.
They can be issues regarding internal or supplier operations. Internal quality
nonconformities are mainly noticed during production, inspections and testing.
Employees are encouraged to report all quality problems they notice. Internal
nonconformities are managed in the QM module of SAP, which is the ERP system in
the case company. When an internal nonconformity is detected a quality notification is
created into SAP. A quality notification includes information about the nonconformity.
Most of the information is created automatically based on the material, production order
and sales orders but some of the information, for example notification description,
defect type and quantities have to be input manually. The following information is
collected to every quality notification:
Notification number
Notification description
Notification creator
Notification coordinator
Responsible persons
Creation date
Notification status
Nonconforming material information
Quantity of nonconforming items
Serial number of the motor
Material supplier
Amount claimed and amount received from the supplier
Production order
Sales order
End customer
Defect location
Defect type

53
3.4 Results from internal interviews
3.4.1 Quality measures and KPI
For some of the interviewees, it was not clear how quality is and should be measured at
their department. However, all of the interviewees thought that it is important to
measure quality because “what you do not measure, you cannot manage”. At the
moment, quality metrics vary a lot depending on the depending on the department.
Other than for production, the interviewees thought that there are not clear instructions
on how quality should be measured. Current metrics related to product quality that were
mentioned during the interviews were:
On-time deliveries (OTD)
Amount of internal quality nonconformities
FPY (first pass yield)
Scrap costs
Amount of claims to suppliers
Supplier FPY
Warranty costs
Warranty costs / revenue
Amount of customer reclamations
o Before commissioning
o After commissioning
According to the interviewees, the existing quality indicators do not give enough
feedback about their own performance. For example, in product development, the main
quality indicator at the moment is the amount of customer claims after commissioning,
i.e. field failures and a target is set to reduce these claims by 50%. Because of the long
lifespan of the motors, this indicator does not provide instant feedback for the product
development team. A field failure today can be caused by poor design that was made
many years ago. It does not make sense to follow an indicator that does not provide
actual feedback. It would be better to implement indicators that have a clear correlation
to how a certain process or department performs.
A couple of interviewees pointed out that money is a good metric when trying to
motivate people towards a certain direction. At the moment, true costs of poor quality
54
cannot be measured. Many interviewees thought that quality costs should be measured
more closely. There has been pressure to reduce costs but it is unknown how certain
cost reductions have resulted in increases of costs of poor quality. Also, some people
pointed out that poor quality is accepted in some processes because the total costs
cannot be calculated. It would be interesting to know the correlation between
investments in internal quality assurance versus the costs of customer claims.
Another problem with the current quality metrics is that they cannot always be trusted
because of poor data quality. For example, the FPY indicator that is used production is
not always correct. The indicator is based on the quality notification data from SAP.
Because the notifications are made manually there are errors in quantities of
nonconforming units or defect codes which effect the FPY indicator. Also, some of the
interviewees pointed out that FPY is not necessarily the best indicator for quality as
lower FPY can mean that more nonconformities have been detected internally resulting
in less customer complaints. This is way more emphasis should be put into measuring
the quality that customers are experiencing.
Most of the interviewees thought that there is a clear need to unify the quality KPIs and
metrics on a plant level or on a business unit level. This would make quality easier to
understand for everyone. A few quality KPIs should be defined and implemented. They
should be comparable between departments, give direct feedback to employees and
promote quality as a business success factor. Now that each department has their own
KPIs, it can be that people from other function do not even understand the KPI the same
way because there is always room for interpretation.
Another improvement idea is to visualize some of the quality KPIs so that everyone can
see them. At the moment there are info screens in production facilities which show
production-related information, for example production amounts and late deliveries.
Some of the interviewees thought that quality KPIs should be integrated to these screens
so that people could see changes in quality levels and act accordingly.
3.4.2 Quality nonconformity data collection
According to the interviewees, management of quality nonconformities has improved a
lot at ABB in the past couple of years. However, all quality nonconformities are still not
reported. For example if a nonconformity is noticed and it can be fixed right away

55
without external help, some people may think that it is not necessary to create a quality
notification about the nonconformity. This kind of thinking is problematic because then
the problem cannot be tracked in the system and therefore it falsifies the statistics. Some
recurrent quality problems may remain hidden only because they are not reported. Many
of the interviewees agreed that it would be very important to get data from all
nonconformities that have occurred. One interviewee said that “if a problem is not
reported, for me it does not exist”. It is not possible to make informed decisions without
data and it is difficult to evaluate which quality problems are the most important if the
evaluation cannot be based on data. It was thought that the reason for not reporting all
quality nonconformities may be lack of open quality culture or lack of understanding
why nonconformities should be reported. Most nonconformities are noticed in
production by operative personnel who are mainly interested in getting the immediate
problem fixed and may not understand all the aspects of why nonconformities should
always be documented.
Another problem that was mentioned in many interviews is the quality of notifications.
Sometimes the information that is written about the nonconformity is insufficient or
even faulty. Also, same quality problems are reported in many different ways which
makes it difficult to understand the magnitude of a certain quality problem if it is not
reported consistently. Most interviewees stated that they cannot fully trust the data that
is currently collected. There are multiple reasons for the bad quality of data. One
explanation is that the system is not user-friendly and it is not easy to do everything
correctly. As previously said, the creator of the quality notification is usually mostly
interested in fixing the immediate problem and does not necessarily know what
information is needed about the nonconformity for later use. It is also clear that the
person detecting the nonconformity usually does not have the capability of evaluating
the root cause right away and defining the correct defect code. Still, our system requires
that a defect code is input when a quality notification is created. As one of the
interviewees said, “When a nonconformity is detected, the most important thing is to
find out who is the person that starts to investigate the issue. It is not necessary to guess
the cause for the nonconformity because it might be completely wrong at the time”. The
interviewees felt that the defect codes are often not updated by the coordinators if the
nonconformity turns out to be caused by another reason than originally defined.

56
Defect codes were discussed a lot during most of the interviews. It was widely agreed
that the current defect coding does not work as it should. At the moment it is unclear
what information defect codes are supposed to provide. Some of these codes describe
the symptom or consequence of the nonconformity (for example noise or vibration)
while other codes describe the reason behind the nonconformity (for example fault in
work procedure). Also, some of the defect codes are quite vague and do not tell much
about the problem. For example, one of the most commonly used defect codes in
internal quality notifications at the moment is “faulty part”. It is very easy for the
creator of the quality notification to select it as a defect code because it can be used for
almost every nonconformity, but in terms of generating reliable statistics and being able
to understand the problem, it does not help much. A clear message from the internal
interviews was that nonconformities should be categorised more precisely with defect
codes so that it is possible to see which nonconformity categories are the biggest
problems to tackle.
It was also pointed out that defect coding is completely different for internal quality
notifications and customer complaints. In an ideal situation the defect codes would be
the same regardless of where the nonconformity is detected. Unifying the defect coding
is not realistic at the moment because of the separate systems but it is good to remember
that it would be easier to compare different nonconformity types and create statistics if
the parameters were the same.
Some interviewees thought that they do not get all the information they need about
nonconformity cases. For example, people from product development wanted that
product information would be included in the quality notifications. At the moment,
material information is included in the notifications but if the nonconformity does not
consider a whole motor, only the nonconforming part of the motor is visible on the
notification. Now that the end product information is not connected to quality
notifications it is very difficult to find reliable product specific information about
nonconformities. It would be important to have that information especially for product
development.
In addition to product information, also customer information is currently insufficient
on the quality notifications. From customer support point of view, it would be helpful to
see the nonconformities that are related to a particular end customer. This is not possible

57
at the moment. The customer information comes automatically from the sales order of
the motor. Sometimes the customer information is the actual end customer but
sometimes it is an ABB sales company that has been an intermediary in the sales
process. Also, a customer may have many customer numbers in SAP which makes
recognising the customer more difficult.
Another issue that was pointed out during the interviews was that corrective actions are
not documented systematically on the quality notifications. It is possible to link
additional documents about corrective actions or write the corrective actions on a free
text field but it is not always done. Because the corrective actions are not systematically
documented it is often difficult to find information how certain nonconformities have
been solved in the past. It would help solving future nonconformities if it was easy to
find corrective actions from previous nonconformities
Overall, there are plenty of improvement opportunities regarding the collection of
nonconformity data. All requirements that were presented during the interviews are
listed below:
Unified definitions
o when quality notifications shall be created
o how quality notifications shall be created and what information is
required
o systematic way of documenting nonconformities
Separating process problems and product problems
More detailed nonconformity classification
o Development of defect coding
o Defect codes have to be updated in the system during or after the
investigation
Better documentation of corrective actions
Feedback loop to the creator of quality notification about corrective actions
Customer focus: linking customer information to quality notifications
Product focus: linking product information to quality notifications

58
3.4.3 Reporting and communication
Current communication about quality and quality nonconformities was thought to be
insufficient. The interviewees felt that they do not get enough information about current
quality issues. The most recognised problems regarding communication were
too many information channels and no systematic way of communicating about
quality nonconformities
Quality communication does not reach operative workers. Quality should be a
part of daily communication, like safety.
Success stories or corrective actions are not communicated enough.
Communication focuses too much on negative issues.
Most of the interviewees were satisfied with the current report about customer
complaints that is sent by e-mail every two weeks. It gives a good overview about the
overall situation in the factory. However, most of the interviewees said that they would
like to have more precise information about the nonconformities that consider their own
department. As the current reporting is very generic, it is difficult to improve one’s own
work based on that. The requirement was that the monthly or weekly report should be
modified to each department so that it considers only that particular department. This
way each department could better follow their own performance in terms of quality. The
following problems regarding current reporting were mentioned during the interviews:
Information is too generic. The reports should be modified for the recipient.
Information is scattered. Reports should be collected to one place
Poor quality of data does not enable the reports that would be needed
Different reporting and communication channels were discussed during the interviews.
Some people were not satisfied with the current way of sending reports via e-mail as the
information is not available for everyone and e-mails are easy to miss. A quality portal
was proposed as a solution for this. The idea behind this is that all the nonconformity
data would be in one place where people could modify their own report according to
their needs.

59
3.4.4 Key improvements from internal interviews
Most repeated answers from the internal interviews are summarised into Figure 18.
Figure 18. Key improvements from the internal interviews.
3.5 Best practices from benchmarking interviews
To get a better understanding of how quality nonconformity data utilisation can be
improved at ABB, it was thought that ideas from other companies and industries would
be valuable to understand the best practices in the field. These four companies were
approached as they are known for their high quality work. Benchmarking discussions
were divided into similar themes as the internal interviews, so that results would be easy
to compare with each other and improvement opportunities would be easier to identify.
Quality measures and KPI
• Unification and standardisation of quality KPIs
• Selection of a few quality KPIs that motivate employees
• Visualisation of quality KPIs
Data collection
• Systematic collection of nonconformity data
• Data quality must be improved
• Clarified requirements and instructions for data collection
• Product information and customer information should be included in the data
Nonconformity classification
• Development of defect coding
• Current defect codes do not always describe the defect type
• Same nonconformities can be under different defect codes in the statistics
• Removing vague defect codes
Reporting and data analysis
• Possibility to modify own reports and dashboards
• Increased information-sharing and transparency
• especially reporting about customer complaints is insufficient
• Reporting and communication should reach the operative level
Key improvements from internal
interviews

60
3.5.1 Quality measures and KPI
The methods for measuring quality are very different in the four companies. This is
understandable as all of the companies are operating in different industries. All
companies have quality indicators for customer perceived quality. For example, at
company D, the amount and severity of customer complaints are followed regularly for
each product or product group. On top of that, product recalls and stock outs caused by
nonconforming products are followed. At company C, customer complaints are also
followed and measured even though they admit that it is not the most objective indicator
since some customers tend to complain more easily than other. Some of the companies
also follow how long it takes to solve customer-related issues. For example according to
company B, their target is to process and communicate 95% of the customer complaints
within three months. In terms of internal quality performance, following product quality
indicators were mentioned during the interviews:
Assembly and testing lead times (company A)
Defects per unit (companies A and D)
Scrap costs (all companies)
Quality costs are followed in each of the four companies but the scope of measuring
quality costs varies a lot. At company C, the CoQ model is the most extensive of the
four companies. The model takes into account warranty costs, excess inventory,
reprocessing, scrap costs and downgrade costs. At company A, the quality cost model
covers scrap costs, excess & obsolete costs, warranty costs and retrofit costs. At
company B, costs of poor quality are documented for each quality nonconformity.
When a nonconformity is detected, actual and potential financial impacts are evaluated
and actions are selected based on that.
3.5.2 Quality nonconformity data collection
In the beginning of the benchmarking interviews, definitions for quality
nonconformities were asked in each company. This was thought to be important as the
definition effects on how the nonconformities are managed. The definition of a quality
nonconformity is slightly different in the four companies. At company B, quality is
thought to be closely linked to safety. According to them, quality issues are often also
safety issues in their industry. This is why the management processes for quality and

61
safety incidents are similar. At company C, each quality and safety nonconformity is
handled by a separate team. By definition, nonconformities include near misses and
potential hazards that may have affected product quality. At company D, the definition
is very strict because of regulatory requirements. Everything that deviates from good
manufacturing practices of the industry is considered a quality nonconformity. Every
process has to be documented and if documentation does not exist or process is not
working according to the documentation it is considered to be a quality nonconformity.
The nonconformities can be for example related to production environment or
qualification of employees. At company A, the definition is more traditional. Everything
that deviates from the quality level that is defined by the customer or the company itself,
is considered as a quality nonconformity.
All of the four companies systematically collect information about quality
nonconformities but the systems for collecting and managing the information are quite
different. Some have focused to manage all nonconformity information in only one
system while others have different systems for different nonconformity categories.
There are also differences in the automatization of data collection. The systems for
nonconformity data management are described in Table 5. In the companies where data
collection is manual, efforts are made to ensure data quality. For example at company
D, all nonconformities from the previous day are discussed and evaluated in a daily
meeting of the quality team. Company B has a similar procedure. The quality function is
responsible for making sure that the collected data is accurate.
Company Quality nonconformity management system
B Information about quality and safety incidents is collected into a
continuous improvement reporting system. The system is not
integrated into other information systems in the company. It is used
to collect data from all quality nonconformity categories (e.g.
customer complaints, internally detected nonconformities,
nonconformities detected during audits). All data collection is done
manually.
A Failure and yield data is collected automatically from production and
testing. DfX (Design for Excellence) feedback is used as a tool to
give feedback from internal operations to R&D. For example
employees in production can provide feedback about the
manufacturability of a product. Customer complaints are managed in
another system.
D Nonconformity data is collected to the QM module of SAP. This
includes customer complaints, internal quality nonconformities and
supplier related nonconformities. All data collection is done

62
manually.
C Three separate systems for managing quality nonconformities.
Customer complaints are managed in a CRM (Customer relationship
management) tool. Internal quality and safety incidents are
documented in a separate, local reporting system. Supplier related
nonconformities are managed in another, global tool.
Table 5. Quality nonconformity management systems in the benchmarking companies.
There are no major differences between the companies in what information is collected
about a quality nonconformity. All companies collect roughly the same basic
information: what has happened, who has detected the nonconformity, who are the
responsible people for investigation, where has the nonconformity happened, when has
it happened, what is the root cause and what are the corrective actions. The differences
are in the scope and accuracy of the collected information. At company B, where all
nonconformity information is collected manually there are problems with the reliability
and accuracy of the collected data because people can report similar nonconformities
differently. On the other hand, company A collects a lot of testing data automatically
which means that they get accurate and reliable statistical data about nonconformities in
testing. With automatic data collection, nonconformities can be tracked to a component
level in products. Figures 19 and 20 describe the data collection and utilisation
processes in companies D and B.
Figure 19. Quality nonconformity data collection and utilisation process at company D.
Data collection to ERP system
• Basic information
• NC category
• NC criticality
• Root cause
• Evaluation of the NC within a quality team
Data utilisation
• KPI reporting
• Using history data to solve future NCs

63
Figure 20. Quality nonconformity data collection and utilisation process at company B.
Benchmarking companies have different ways to categorise detected nonconformities.
All four companies evaluate the criticality of detected nonconformities. At company B,
the evaluation is made by assessing the financial impact and risk that is related to the
nonconformity. Evaluation takes into account the costs caused by the nonconformity but
also the potential cost impact i.e. what could have happened in the worst case scenario.
Based on the total financial impact, quality nonconformities are divided into three
categories: critical, major and minor. Critical nonconformities have a total financial
impact of over five million euros. The scope of corrective actions is decided based on
the criticality. At company D, there are four criticality classes for nonconformities
regarding a production batch:
Other – No impact on product quality. For example maintenance of production
equipment
Minor – Small and known impact on product quality. Does not affect product
approval
Major – Negative impact on product quality or major deviation from good
manufacturing practice
Critical – Negative impact on the end customer
At company C, every customer complaint is evaluated on a scale from A to E based on
the negative impact on the customers’ business. Most complaints fall into category E or
EE which are the least severe categories but if a higher category incident is detected,
more resources are used in solving and removing the problem.
In addition to criticality evaluation, there are other ways to classify quality
nonconformities. For example, company D has a strict procedure of categorising every
Data collection QNCMS
• Basic information about the incident (what, where, when, why)
• Risk evaluation for each nonconformity based on actual and potential financial impact
• Root cause
• consequence
Data utilisation
• Data available for all employees for analysis
• Monthly / quarterly KPI reporting
• Finding trends and patterns from the data
• Learning from NC data

64
nonconformity in terms of nonconformity category, cause and criticality. In their system
nonconformity categories include customer complaints, complaints to suppliers,
nonconformities regarding a production batch, other production related
nonconformities, analytics nonconformities and nonconformities regarding production
environment. The root cause is analysed for each nonconformity. For example for
nonconformities regarding a production batch, possible root cause categories are
equipment, environment, system error, instructions, lack of resources, carelessness,
failure to follow instructions, material and inadequate training.
3.5.3 Reporting and communication
The reporting system at company B offers good possibilities for reporting and data
analysis by visualising the nonconformity data. The data is available for all employees
and can be filtered by for example organisation, production location, nonconformity
category etc. Employees can also create their own dashboard according to their needs.
For example, if an employee is interested in information about quality nonconformities
in a certain product or in a certain production location, they can get a monthly or weekly
report about those nonconformities automatically to their e-mail.
At company D, quarterly reports are created from the nonconformity data where the
amount of nonconformities, nonconformity types and their criticality are followed. If
some nonconformity types are noticed to be increasing on a certain production line or
product, they will be taken into closer observation in the future. Making these reports
requires a lot of manual work as the data has to be taken from the ERP system. In
addition to quarterly reports, the quality levels are visible on visual management boards
on each production line where basic quality metrics are visualised and can be followed
by employees.
At company A, nonconformity reports are available at company intranet. All employees
have access to the information and can modify the reports according to their needs. For
example production line, testing area or product specific quality levels can be followed
in the reporting tool. At company C, weekly and monthly summaries are created from
the nonconformity data. However, the amount of quality nonconformities is fairly small
so there is no need for precise data analysis.
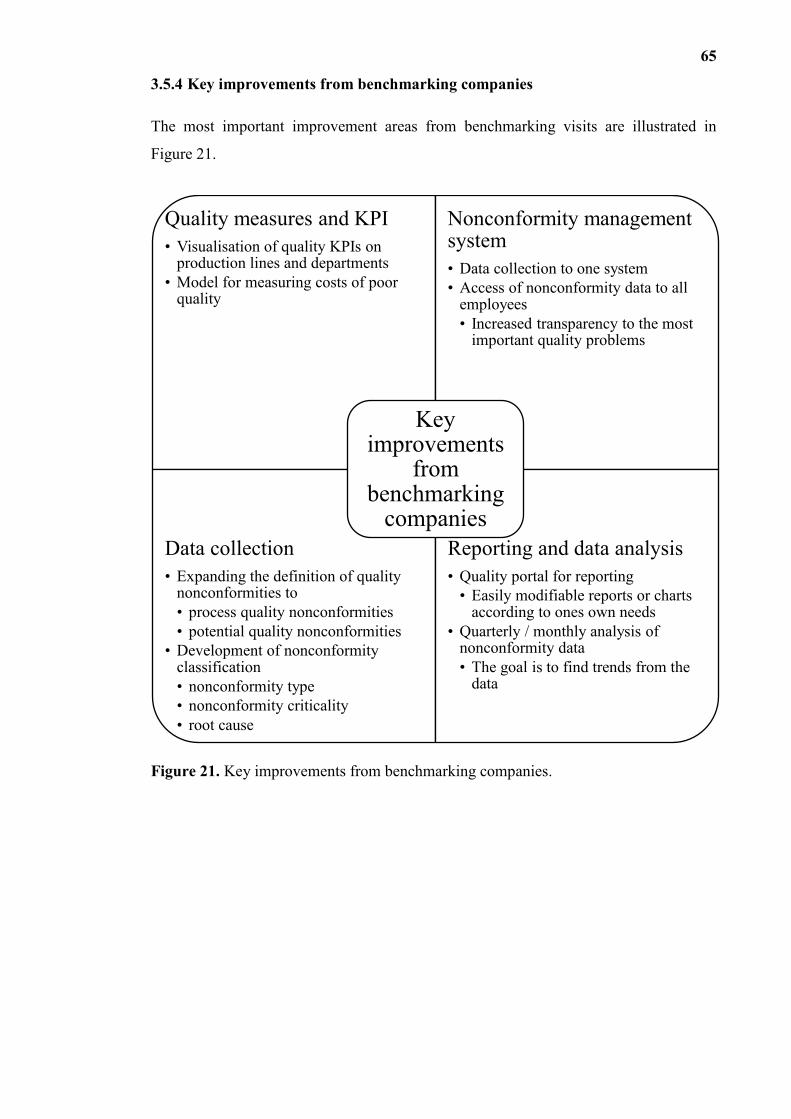
65
3.5.4 Key improvements from benchmarking companies
The most important improvement areas from benchmarking visits are illustrated in
Figure 21.
Figure 21. Key improvements from benchmarking companies.
Quality measures and KPI
• Visualisation of quality KPIs on production lines and departments
• Model for measuring costs of poor quality
Nonconformity management system
• Data collection to one system
• Access of nonconformity data to all employees
• Increased transparency to the most important quality problems
Data collection
• Expanding the definition of quality nonconformities to
• process quality nonconformities
• potential quality nonconformities
• Development of nonconformity classification
• nonconformity type
• nonconformity criticality
• root cause
Reporting and data analysis
• Quality portal for reporting
• Easily modifiable reports or charts according to ones own needs
• Quarterly / monthly analysis of nonconformity data
• The goal is to find trends from the data
Key improvements
from benchmarking
companies

66
4 DISCUSSION
In this chapter, improvement plan is presented based on the literature review and the
findings of the empirical section. The improvements are divided into three categories:
data collection, reporting and data analysis, and communication. All of these categories
are closely linked to each other and have to be addressed when implementing
improvements in the case company. The improvement plan is illustrated in Figure 22.
Figure 22. Improvement plan.
4.1 Data collection
In this chapter, improvement plan for data collection is presented. It focuses on the data
collection of internal quality nonconformities because the possibilities to change the
data collection of customer complaints are limited. To define the requirements for data
collection in the case company, the C5 model created by Majanoja et al. (2017) was
used as a basis. The model is created as a data structure for telecommunications industry
so it needs slight modifications for the needs of this thesis. However, the C5 model is a
solid guideline for what data needs to be collected about every nonconformity. In
Appendix 3, the current data collection practices in internal quality nonconformities are
evaluated in comparison to the modified C5 model and improvement needs are
explained.

67
The most important improvement needs are related with the first C in the C5 model –
condition. First of all, the failures experienced should be documented more precisely.
Defect coding is a good tool for documenting the failure type and this is discussed later
in this chapter. In addition to, Majanoja et al. (2017) propose that the magnitude of the
nonconformity is evaluated and documented. The findings from benchmarking visits
also support this theory. At ABB, criticality categories do not currently exist, but high
level criticality categories could provide valuable information. For customer complaints,
warranty costs of a nonconformity case give a good indication of the criticality. For
internal quality nonconformities, criticality categories could be created based on the
potential impact on the end customer. The categories could be for example:
Other – No impact on product quality. For example missing parts.
Small - Small and known impact on product quality that can be detected and
fixed internally. For example errors in production that are fixed in the next
process step.
Major – Can result in a customer claim before commissioning. For example
errors in surface treatment or faulty parts.
Critical – Can result in a customer claim after commissioning. For example
vibration.
It is difficult to define explicit criticality categories as the variety of possible
nonconformities is large. Also, detectability of a nonconformity should influence the
criticality category. Difficult detectability should increase the criticality of the
nonconformity. However, categorising nonconformities in terms of criticality even on a
rough level can help identifying those nonconformities that require more attention.
Secondly, a clear message from the internal interviews was that product-related quality
data should be available more easily. Critical product characteristics should be linked to
each quality notification to enable monitoring of product specific quality levels. Based
on the interviews, the most important product characteristics are motor type, frame size,
pole number and variant codes. Because product information is currently not linked to
quality notifications it is difficult to notice if certain nonconformity types are related to
a certain product category. Thirdly, Defect location information does not provide
accurate enough information about where the nonconformity is created. For example in

68
production-related nonconformities, defect location should be defined according to the
process phase on the production line.
Apart from collecting data about the condition of nonconforming item, also causes and
corrections can be documented more precisely. At the moment, there are not separate
fields for documenting the root cause and corrective actions in quality notifications.
Usually the root cause information cannot be found on quality notifications. Of course,
conducting a root cause analysis may not be feasible for all nonconformities but when
an analysis is made, it should be linked to the notification or written on the long text
field. The same applies to corrective and preventive actions. Long text field should be
used to document the immediate actions taken to remove the nonconforming item as
well as preventive actions that describe how the nonconformity will be prevented from
happening in the future.
Quality costing was discussed a lot during the internal interviews. Currently, only scrap
costs are taken into account in the internal quality nonconformities. On the contrary, for
example Omachonu et al. (2004) have studied that internal failure costs include, scrap
costs, loss costs, rework costs, failure analysis costs, re-inspection and re-testing cost
and downgrading costs. Measuring all of these is not easy and realistic in the case
company at the moment, but it is good to at least keep in mind that scrap costs may not
give accurate information about the cost impact of a nonconformity. In the long run, it
would be beneficial to develop a quality costing model that takes into account the before
mentioned cost categories for each quality nonconformity.
Based on the comparison to the C5 model, data collection framework for internal
quality nonconformities was created into Table 6. The table illustrates what data
attributes are important to collect for each quality nonconformity. Quality notification
218630416 was used as a basis for this example. All needed information was not
available on the notification and had to be searched from other information sources. In
the table 6, the current situation column shows the comparison of current data collection
to the C5 model. If the colour is green, the relative data attribute is available in SAP and
is collected consistently. If the colour is yellow, data attribute is available in SAP but is
not collected consistently at the moment. If the colour is red, data attribute is not
available in SAP and should be added to enable optimal data collection.
C5 data Data attribute Example: quality Current

69
attribute required in SAP notification
218630416
situation
Failures
experienced
Description Wrong couplings
used
Defect code (group) Production error
Defect code Winding error
Priority Normal
Customers
impacted
End customer name Customer x
Products
impacted
Material 3GZV113009-20
Material description STATOR FRAME
Motor M3BP 200MLB 6-12
Frame type BP
Frame size 200
Pole number 6
Quantities
impacted
Complaint quantity 1
Location of
products
Defect location AL3B
Defect location 2 Winding
Sources of
products
Vendor name -
Vendor number -
Reason for
occurrence
(root cause)
Long text Negligence
Solution
(corrective
actions)
Long text Stator frame sent to
winding for repairs
Solution
(preventive
actions)
Long text Update of work
instructions x
Execution plan Processing
Contact people Partner assignment
Cost to
company
Scrap costs 0
Table 6. Example of nonconformity data collection according to the C5 model.
Defect codes
Because defect coding was considered to be an important development area in the
internal interviews, it was taken into closer analysis. To understand the current situation

70
and requirements better, quality notifications created in May 2018 were taken into an
analysis. The timeframe of one month is quite short for reliable analysis but it still
included a total of 956 quality notifications. If the timeframe was any longer, it would
have taken too much time to evaluate each nonconformity individually. Also, in this
thesis it is not essential to know how quality levels or certain nonconformities have
developed during the past. The main idea is to evaluate the current practices is data
collection where a short timeframe with relatively new data can provide accurate
results.
These notifications included 58 different defect codes. Ten most used defect codes are
presented in Table 7. In the following tables, defect codes are presented in both English
and Finnish since Finnish terms are used within the case company. The table 7 shows
that the most used defect codes are quite vague and do not tell the problem behind the
nonconformity. For example the most used defect code, “part faulty”, accounts for
15.7% of the total amount of notifications because it can be used for almost any
nonconformity. In addition, defect codes “fault in inventory”, “part missing” and “part
lost” account in total for 18.1% of the quality notifications even though they are not
related to product quality. These codes are used for example if production cannot be
started or production has to be stopped due to missing parts or components.
Defect code in English Defect code in Finnish Amount of
nonconformities
Part faulty Osa virheellinen 150
Fault in no-load current IO, tyhjäkäyntivirta 72
Fault in inventory Saldovirhe 64
Part missing Osa puuttuu 61
Fault in short circuit current IK, oikosulkuvirta 50
Part lost Kadonnut 48
Fault in coupling Kytkentävirhe 41
Fault in resistor Vastusvirhe 39
Check values missing Tarkistusarvot puuttuvat 36
Fault in work procedure Virhe työnsuorituksessa 34
Table 7. Top 10 defect codes in May 2018.
Since the current defect coding is not the most effective, new defect coding is proposed
as a part of this thesis. For example Dhafr et al. (2006) and Jamaludin (2008) have

71
created nonconformity classification models in their research. In this thesis, these
models are modified to fit the needs of electrical motor manufacturing. The idea behind
the proposed coding is to simplify the system in order to collect more accurate data
about the internal quality nonconformities. The proposed new defect coding is presented
in Appendix 4. The complete new defect coding is only available in Finnish. In the
proposed defect coding, the total amount of possible defect codes is reduced from 145
to 49. The codes consist of two levels. The first level describes the defect category on a
high level and the second level tells the actual defect. The first level categories are
electrical or testing errors, production errors, material errors, design errors, logistics
errors and purchasing errors. The before mentioned nonconformities from May 2018
were analysed with the new coding. It is good to remember that this analysis is partly
subjective because it was made by evaluating each nonconformity one by one.
However, the analysis gives a good overview about the situation at the moment. Table 8
shows how nonconformities are spread out between the first level defect codes. 217 of
the 958 nonconformities were not related to product quality and these were left out of
the statistics. Also, for 73 nonconformities it was difficult to define the defect code as
the description of the nonconformity was unclear. These nonconformities were also left
out of the statistics.
First level defect code in
English
First level defect code in
Finnish
Amount of
nonconformities
Electrical or testing errors Sähköiset virheet ja
koestustvirheet
282
Production errors Tuotannon virheet 139
Design errors Suunnitteluvirheet 120
Material errors Materiaalivirheet 117
Logistics errors Logistiikan virheet 7
Purchasing errors Hankinnan virheet 1
Table 8. Internal quality nonconformities in May 2018 with the proposed first level
defect codes.
Table 9 shows an example of how the two-level coding works. The 120 design errors in
table 8 are shown in detail in table 9.
Design errors in English Design errors in Finnish Amount of
nonconformities
Fault in structure Virhe rakenteella 52

72
Fault in production card Virhe työkortilla 41
Fault in nameplate Virhe arvokilvessä 22
Fault in calculations Virhe laskelmassa 4
Missing information Tieto puuttuu 1
Table 9. Design errors in May 2018 with the proposed defect codes.
The proposed defect coding has several benefits compared to the current one. First of
all, the new coding provides more accurate and reliable information about the incidents.
Vague codes, such as “part faulty”, are removed and each defect code describes an
actual nonconformity. More accurate defect coding provides new opportunities for
reporting. It allows for instance each department to get information about
nonconformities that they have an influence on. For example production managers
should be interested in production errors while people in R&D could follow design
errors. This distinction is unclear in the current defect coding and it is difficult to
identify the most important quality problems in a certain department or process point.
Furthermore, the proposed defect coding makes a difference between product quality
and process quality. As mentioned before, 217 of the 956 quality notifications in May
were not related to product quality. In the new coding, a new notification type is
proposed for these notifications. While it is also important to improve process quality,
the needed actions are inherently different, so it does not make sense to show these
incidents in the same statistics. If the distinction between process and product quality is
clear, real quality problems will be identified from the statistics more easily.
Even though the defect coding proposed in this thesis would clarify the categorisation of
nonconformities, it is not enough without the commitment of personnel. The people
interviewed during internal interviews were unanimous that there is not enough
supervision and control over the quality of the collected data. Too often the data
collection is seen as necessary evil in order to get the immediate problem solved while it
should also be considered as an opportunity to collect valuable data about the incident.
The importance of data quality should be emphasized. First steps towards better data
collection could be training of employees of what data is required and why the data
collection is important. Secondly, responsible people, for example notification
coordinators should be assigned to follow the data quality and consistency. This method
is in use in some of the benchmarking companies and they thought it is important to
ensure the data quality by supervising it on a regular basis. In an ideal situation, all data

73
collection would be automatic. While this is not reality in the near future, attention
should be paid to data attributes that have to be collected manually, such as defect
codes, defect locations and complaint quantities.
As Bredehoeft & O’Hara (2009) state in their research, defining the requirements for
quality nonconformity data collection is important in order to be able to utilise the data
for business development. It was pointed out in the internal interviews that the current
data collection does not fully support the utilisation of the data at ABB. With the
improvements proposed in this chapter, more consistent and useful data can be
collected. This increases the value of collected data and allows better, data-driven
approach to decision-making.
4.2 Reporting and data analysis
Based on the internal interviews, reporting and information sharing is a key
improvement area in the case company. The data about quality nonconformities is not
easily available in a form that it would provide feedback and input for decision-making.
The lack of easy and user-friendly analysis tools limits the awareness of the most
important quality problems at the moment. The problem is also recognised in the
literature. Boltic et al. (2010) state that manufacturing companies often struggle to
transfer the collected data into knowledge. To tackle this problem, two reporting tools
were designed and implemented as a part of this thesis. The tools were developed based
on the needs and ideas that were presented in the internal and benchmarking interviews.
They are planned to be used by internal stakeholders, such as production, supply chain
management, product development and customer support. In addition, they can also be
used to create monthly or quarterly quality summaries by the quality team since it is
easier to use the reporting tools than having to download the data from different
information systems.
The first tool contains data about customer claims and the other contains data about
internal quality nonconformities. Both of these tools are Excel files that are available in
the case company SharePoint for all relevant employees. The tools contain different
pivot tables and charts that visualise the data as needed. Each pivot chart contains
slicers that enable filtering the data based on users’ needs. The internal nonconformity

74
report has an automatic data connection to SAP with weekly data updates while the data
to customer claim report has to be updated manually for example once a month.
The customer claim report contains five sections that are defect types, defect locations,
customers, products (motor type and frame size) and timeline. In each section, the
number of customer claims and the number of claimed motors are presented. An
example view of the customer claim report is presented in Figure 23. This particular
sheet visualises the amount of claimed motors per production line for each year. On the
right hand side of the view, slicers can be applied to filter the data shown in the chart. In
this example, possible slicers that can be applied are claim type, frame size, running
hours, claim status, fault type, manufacturing year or month, customer, production line
and fault code. For example if the user is interested in seeing where certain
nonconformity types occur, they can select the fault codes from the slicer and the chart
changes to show on which production lines those fault codes have occurred on a
selected time frame.
Figure 23. Example view of the customer claim reporting tool.
The internal quality nonconformity reporting tool contains seven sections that are defect
codes, defect locations, suppliers, customers and timeline. In addition, the tool can be
used to calculate FPY% and supplier PPM indicators. A section for product information
could not be made yet as the data is not available at the moment. Product section (motor
type and frame size) should be added to the report when product attributes are collected
for each nonconformity as was proposed in chapter 4.1.1. In each section, the amount of
nonconformities and the amount of scrap costs are presented. Similarly to customer

75
claim reporting tool, the data can be filtered with slicers. In Figure 24, an example view
of the internal quality nonconformity reporting tool is presented. The layout is similar to
the customer complaint reporting tool so that the tools are as easy to use as possible.
The example view shows the top ten defect locations in terms of scrap costs. The view
can be filtered with defect code, defect location and supplier slicers. The time frame can
also be selected by the user. In the example, a comparison between years 2017 (blue)
and 2018 (red) is visualised.
Figure 24. Example view of the internal quality nonconformity reporting tool.
4.3 Communication
Communication about quality issues was thought to be an important development area
in the internal interviews. With the help of the reporting tools that were presented in
chapter 4.1.2., transparency and communication about quality nonconformities can be
improved. The main concern in the interviews was the visibility to customer claims but
now statistical data about them is available with an easily usable tool.
Visualisation of data is a good way to communicate effectively. According to Kubiak &
Benbow (2009), visual management boards are an effective method to guide employees
focus to the most important aspects. At the moment, there are visual management
boards on production lines that show quality metrics and KPIs. However, based on the
data analyses and experiences from the interviews, the current quality metrics do not
provide enough information. Several improvement proposals were presented in chapters
4.1. and 4.2. that can help providing more useful visual management boards. The data

76
collection framework in chapter 4.1. would provide more accurate statistics. For
example product-related statistics can be created and visualised when the framework is
implemented. The proposed defect coding would clarify defect categories and make it
more clear which defect categories are the most important ones to tackle. The proposed
defect coding allows each department to focus on the nonconformities that they can
influence on. In addition, the proposed defect coding removes process quality problems
from the statistics which emphasizes issues related to product quality.
A common concern in internal interviews was that quality and quality management do
not have the role that they should have at ABB at the moment. This issue is linked to
quality culture and it takes a long time to improve it. However, with consistent and
reliable data collection about quality nonconformities, the role of quality as a business
parameter can be clarified. Of course, only data collection is not enough. Quality related
messages have to be communicated consistently which requires commitments especially
from the top management. With the improvement proposals presented in this chapter, a
more statistical approach can be taken to quality nonconformity management. In
addition, quality-related communication can be done more easily and reliably.

77
5 CONCLUSION
The objective of this master’s thesis was to find ways to utilise quality nonconformity
data collected at ABB’s electrical motor factory in Vaasa. The research was done by
conducting a literature review, internal interviews within the case company,
benchmarking visits to four companies and data analysis from the quality
nonconformity databases of the case company.
5.1 Scientific contribution
The first research question (What are the key elements in quality nonconformity
management and how quality nonconformity data should be utilised to improve
quality?) was answered in the literature review. The previous literature about quality
nonconformity management is not yet mature and focuses on only a limited number of
areas, such as food and pharmaceutical industries. Some general guidelines (for
example Bredehoeft & O’Hara 2009; Kari 2012) for quality nonconformity
management have been developed in the previous literature. This study provides a new
perspective for quality nonconformity management as most of the previous research is
done for mass production environment. Challenges in mass customization production
environment are somewhat different and this study can provide new insight in this
regard.
In terms of quality nonconformity data management, the previous literature focuses on
either data collection requirements (for example Majanoja et al. 2017) or data utilisation
(for example McGurk & Snee 2005; Boltic et al. 2010). The existing literature does not
provide explicit framework for combining data collection requirements and data
utilisation. This study fills this research gap and extends the research coverage by
introducing a framework that covers the whole quality nonconformity data management
process. Based on the previous literature, general guidelines were created on how data
requirements have to be defined and how quality nonconformity data can be utilised to
find quality improvements. The main scientific contribution of this study is summarised
into chapter 2.5 which also provides the answer for RQ1. Furthermore, Figure 16
presents the previously mentioned framework for quality nonconformity data collection
and utilisation.

78
5.2 Managerial implications
The second research question (How is quality nonconformity data managed at ABB and
benchmarking companies and how the management can be improved at ABB?) was
answered during empirical research and discussion chapters. The internal interviews
revealed that the current nonconformity data collection is not on a sufficient level. The
data collection is not systematic enough and all needed data attributes are not collected.
Furthermore, the nonconformity data analysis and internal interviews revealed that there
are problems regarding current defect coding and it does not fully enable recognising
the most important quality problems. In addition, problems regarding data analysis and
reporting were identified. Information-sharing about internal nonconformities and
customer complaints was considered to be important but current practices do not always
provide the needed information.
Four benchmarking visits were conducted to understand best practices in the field and
collect ideas that could be valuable at ABB. Best practices were concluded into chapter
3.5.4. Main improvements consider quality measures and KPIs, nonconformity data
collection, nonconformity management system and reporting and data analysis.
Based on the findings from internal interviews, benchmarking visits and nonconformity
data analysis, improvement plan was created in chapter 4. In the improvement plan,
requirements for data collection were defined to enable collecting accurate and valuable
data about each nonconformity. In addition, new defect coding was developed to help
categorise nonconformities. Moreover, two reporting tools were designed and
implemented to help data analysis and reporting. One reporting tool visualises data from
internal quality nonconformities and the other from customer complaints. These tools
increase the transparency of quality problems to case company employees, help the
creation of monthly or quarterly quality metrics and reports. Lastly, they can facilitate
the development of visual quality boards in departments and production lines.
5.3 Evaluation of the thesis
Critical evaluation of the thesis and its results is an important part of good research
practice. There are many ways to evaluate the quality of a study but in this thesis Yins
(2009) criteria are used. According to Yin (2009), the quality of research design can be
79
evaluated based on four criteria: construct validity, internal validity, external validity
and reliability.
According to Yin (2009), construct validity can be achieved by establishing correct
operational measures for the concepts being studied. In this study, construct validity can
be evaluated by assessing if the chosen research methods were the correct way to
approach the research problem. The research objective in this study was to improve
quality nonconformity data management in the case company. In comparison to the
research objective, the chosen research methods are logical. It is typical for a case study
that different data sources and literature are combined to increase the validity (Yin
2009). The literature review chapter built a good basis on how to organise quality
nonconformity data management in a company. In the empirical section, semi-
structured interviews were chosen as a research method inside the case company since
they enable open discussion which was thought to be valuable when evaluating the
current situation and problems. However, weaknesses of semi-structured interviews
include inaccuracy and interviewers influence on the interviewee (Bryman & Bell
2003). Benchmarking interviews were included in this study to gain improvement ideas
from outside. They brought a new perspective into the study and helped in achieving the
research objective.
Internal validity is evaluated based on causal relationships, i.e. why event a caused
event b. However, internal validity concerns mainly explanatory studies and is not
completely relevant in case studies. (Yin 2009) In this thesis, internal validity was
increased by the comprehensive literature review which created a basis for the analysis
and reasoning that were done in the empirical section. The empirical research was
conducted by doing 12 internal interviews and four benchmarking interviews which can
be considered a good amount in a master’s thesis. Interview results were supported by
additional data analyses from the nonconformity database of the case company.
According to Yin (2009), external validity means how the results of the research can be
generalised outside that case study. The external validity of the literature review is on a
good level. It is rather generic and can be understood as a guideline for quality
nonconformity data management. The empirical section is more case specific and thus it
is more difficult to generalise the results. However, it is very likely that other companies
are struggling with similar problems and therefore they could use some elements of this

80
study. This considers especially companies operating in similar industries or companies
with a similar production strategy.
According to Yin (2009), the reliability of a study tells how well another researcher
could follow the research process as described in the study, and end up in the same
results. Overall, the reliability of this thesis is on a good level as the research process
and methods are described precisely and for example interview questions are provided
in the appendix. Also, the previous literature about the topic is rather unanimous
without major contradictions. For this reason, it is justified to assume that another
researcher would end up in similar results after the literature review. One thing that
decreases the reliability is that semi-structured interviews always vary a little bit
depending on the interviewer and interviewee. Also, the interviews did not always
follow the questions strictly and slightly different topics were highlighted in different
interviews. Furthermore, data analyses that were made during the thesis process were
partly subjective and another researcher could end up in slightly different results.
5.4 Topics for further study
Several topics for further study emerged during the thesis process. There are possible
research topics both inside and outside the case company. Firstly, the literature
concerning quality nonconformity management and especially quality nonconformity
data management is not comprehensive. As mentioned before, the literature focuses on a
limited number of industries and may not be fully applicable for other purposes. The
case company in this thesis has a mass customization production strategy, while most of
the research focuses on high-volume mass production. The selected production strategy
affects the required level and methods for nonconformity management and
nonconformity data management. Therefore, the variety of researched industries and
production models in quality nonconformity management could be increased.
Secondly, the research inside the case company can be continued. This study focuses a
lot on data collection and data quality requirements as they did not correspond the best
practices in the literature. Therefore further research about the implementation and
effects of the proposals of this study could be necessary. Another interesting topic
would be to conduct a more quantitative approach on nonconformity data analysis.
After the proposals regarding data collection have been implemented, a more statistical

81
approach can be taken to analyse nonconformity data. In addition, the application of
advanced data analytics could be studied. The data utilisation proposals in this thesis
focus on the exploratory level of data analytics (understanding what has happened).
Research about predictive (forecasting the future based on the data) and prescriptive
data analytics (suggesting business decisions based on the data) could be done in the
future.

82
REFERENCES
ABB 2018a. Homepage. https://new.abb.com/ [8.6.2018]
ABB 2018b. Intranet. [12.6.2018]
Ahire S. L., Waller M. A. & Golhar D. Y., 1996. Quality management in TQM versus
non-TQM firms: an empirical investigation. International Journal of Quality &
Reliability Management, 13(8), 8-27.
Albright T. L. & Roth H. P., 1992. The measurement of quality costs: an alternative
paradigm. Accounting Horizons, 6(2), 15-27.
Aravindan S. & Maiti J. 2012. A framework for integrated analysis of quality defects in
supply chain. Quality Management Journal, 19(1), 34-52.
ASQ research 2013. The ASQ Global State of Quality research discoveries. Milwaukee:
ASQC.
Bauer J. E., Duffy G. L. & Westcott R. T 2002. The Quality Improvement Handbook.
U.S: ASQ.
Beckford J., 2002. Quality: A Critical Introduction. USA: Routledge Florence.
Boltic Z., Ruzic N., Jovanovic M. & Petrovic S. 2010. Measuring the performance of
quality assurance processes: pharmaceutical industry deviation management case
study. Accreditation and quality assurance, 15(11), 629-636.
Britz G.C. 2000. Improving performance through statistical thinking. ASQ Quality
Press.
Bryman A. & Bell E. 2003. Business research methods. Oxford, Oxford University
Press.
Burgess T. F. 1996. Modelling quality-cost dynamics. International Journal of Quality
& Reliability Management, 13(3), 8-26.

83
Campanella J. 1999. Principles of Quality cost. U.S: ASQ.
Cauchick Miguel P. A. & Pontel S. 2004. Assessing quality costs of external failures
(warranty claims). International Journal of Quality & Reliability Management, 21(3),
309-318.
Cheah S. J., Shah A., Shahbudin M., Fauziah & Taib M. 2011. Tracking hidden quality
costs in a manufacturing company: an action research. International Journal of Quality
& Reliability Management, 28(4), 405-425.
Chin S., Kim K. & Kim Y. S. 2004. A process-based quality management information
system. Automation in Construction, 13(2), 241-259.
Claver E., Tarí J. J. & Molina J. M. 2003. Critical factors and results of quality
management: An empirical study. Total Quality Management and Business Excellence
14(1): 91-118.
Crosby P. B. 1979. Quality is Free. Penguin Books, New York.
Dahlgaard J. J., Khanji G. K. & Kristensen K. 2008. Fundamentals of total quality
management. Routledge.
Dale B. G. 1999. Managing quality. Third edition. USA: Blackwell Pub.
Dale B. G. & Plunkett J. J. 1991. Quality Costing. UK: Chapman & Hall.
De R. N. 2009. Quality costing: An efficient tool for quality improvement measurement.
In Industrial Engineering and Engineering Management, 2009. IE&EM'09. 16th
International Conference on (pp. 1117-1123). IEEE.
Deming W. E. 1986. Out of the crisis: Quality, productivity and competitive position.
Cambridge: Cambridge University Press.
Dhafr N., Ahmad M., Burgess B. & Canagassababady S. 2006. Improvement of quality
performance in manufacturing organizations by minimization of production defects.
Robotics and Computer-Integrated Manufacturing, 22(5-6), 536-542.

84
Donauer M., Peças P. & Azevedo A. 2013. Nonconformity root causes analysis through
a pattern identification approach. In Advances in Sustainable and Competitive
Manufacturing Systems (pp. 851-863). Springer, Heidelberg.
Donauer M., Peças P. & Azevedo A. L. 2015a. Nonconformity tracking and
prioritisation matrix: an approach for selecting nonconformities as a contribution to the
field of TQM. Production Planning & Control, 26(2), 131-149.
Donauer M., Peças P. & Azevedo A. 2015b. Identifying nonconformity root causes
using applied knowledge discovery. Robotics and Computer-Integrated
Manufacturing, 36, 84–92.
Douglas T. J. & Judge W. Q. 2001. Total quality management implementation and
competitive advantage: the role of structural control and exploration. Academy of
Management journal, 44(1), 158-169.
Escalante E. J. 1999. Quality and productivity improvement: a study of variation and
defects in manufacturing. Quality Engineering, 11(3), 427-442.
Feigenbaum A. V. 1951. Quality Control: Principles, practice and administration. New
York: McGraw-Hill
Feigenbaum A. V. & Feigenbaum D. S. 1999. New quality for the 21st century
developments are the fundamental drivers of business. Quality Progress, 32(12), 27-31.
Feigenbaum A. V. & Feigenbaum D. S. 2005. What quality means today. MIT Sloan
Management Review, 46(2): 96.
Flynn B. B., Schroeder R. G., & Sakakibara S. 1995. The impact of quality management
practices on performance and competitive advantage. Decision sciences, 26(5), 659-
691.
Garvin D. A. 1984. What Does “Quality” Really Mean?. Sloan management review, 25.
Garvin D. A. 1988 Managing quality: The strategic and competitive edge. New York:
Free Press.

85
Ghalayini A. M., Noble J. S. & Crowe T. J. 1997. An integrated dynamic performance
measurement system for improving manufacturing competitiveness. International
Journal of production economics, 48(3), 207-225.
Gill J. 2009. Quality follows quality: Add quality to the business and quality will
multiply the profits. TQM Journal 21(5): 530-539.
Gryna F. M., Juran J. M., Juran J. M., Godfrey A. B., Hoogstoel R. E. & Schilling E. G.
1999. Juran's quality handbook (5th ed.). New York: McGraw-Hill.
Harrington H. J. 1987. Poor-Quality Cost. American Society for Quality Control,
Wisconsin: ASQC Quality Press.
Hauser J. & Katz G. 1998. Metrics: you are what you measure!. European Management
Journal, 16(5), 517-528.
He D. 2010. Engineering quality systems: Cost of quality. Modern Applied
Science, 4(5), 102.
Hoyer R. W & Hoyer B. B. Y. 2001. What is quality? Quality Progress, 34(7): 52-62.
Hoyle D. 2005. Automotive quality systems handbook: ISO/TS 16949:2002 edition
(2nd ed.). Oxford: Elsevier Butterworth-Heinemann.
Hoyle D. 2009. ISO 9000 Quality Systems Handbook: Using the standard as a
framework for business improvement 6th edition. Routledge; Great Britain
ISO 1994. 8402: 1994: Quality Management and Quality Assurance-Vocabulary.
International Organization for Standardization.
ISO 2015 9000: 2015 Quality management systems. Fundamentals and vocabulary. SFS
69
Jamaludin R. 2008. A product-based non-conformance classification. In Proceedings of
the 9th Asia Pacific Industrial Engineering & Management Systems Conference
(APIEMS 2008), 3rd–5th Dec, Nusa Dua, Bali, Indonesia (pp. 2846-2854).

86
Juran J. M. & Gryna F. M. 1988. Juran´s Quality Control Hanbook, 4th edition. New
York: McGraw- Hill
Kari J. 2012. Improving deviation management process at Skanska. University of Oulu
Kubiak T. M. & Benbow D. W. 2009. The certified six sigma black belt handbook.
Milwaukee (Wis.), ASQ Quality Press.
Lakhal L. 2009. Impact of quality on competitive advantage and organizational
performance. Journal of the Operational Research Society, 60(5), 637-645.
Lakhal L. 2014. The relationship between ISO 9000 certification, TQM practices, and
organizational performance. Quality Management Journal, 21(3), 38-48.
Lillrank P. & Kujala J. 2005. Managing common and specific causes of quality
problems in project-based organisations. International Journal of Productivity and
Quality Management, 1(1-2), 56-68.
Majanoja A. M., Linko, L. & Leppänen V. 2017. Global corrective action preventive
action process and solution: insights at the Nokia Devices operation unit. International
Journal of Productivity and Quality Management, 20(1), 29-47.
McGurk T. L. & Snee R. D. 2005. A systematic approach to deviation reduction
through Six Sigma. Pharmaceutical Technology Sourcing and Management, 1(7), 14-
18.
Mitra A. 2016. Fundamentals of quality control and improvement. John Wiley & Sons.
Motschman T. L. & Moore S. B. 1999. Corrective and preventive action. Transfusion
science, 21(2), 163-178.
Naidu N. V. R., Babu K. M. & Rajendra G. 2006. Total quality management. New
Delhi: New Age International.

87
Nikolay I. 2016. A study on optimization of nonconformities management cost in the
quality management system (QMS) of small-sized enterprise of the construction
industry. Procedia Engineering, 153, 228-231.
Oakland J. S. 2003. Total quality management: text with cases. 3rd ed. Oxford:
Butterworth-Heinemann
Omachonu V. K., Suthummanon, S. & Einspruch N. G. 2004. The relationship between
quality and quality cost for a manufacturing company. International Journal of Quality
& Reliability Management, 21(3), 277-290.
Oxfeldt P. & Skog F. 2013. Industrial Data Collection Advances. Quality, 52(6), 42.
Plunkett J. J. & Dale B. G. 1988. Quality costs: a critique of some ‘economic cost of
quality’ models. The International Journal of Production Research, 26(11), 1713-1726.
Porter L. J. & Rayner P. 1992. Quality costing for total quality management.
International Journal of Production Economics, 27(1), 69-81.
Provost F. & Fawcett T. 2013. Data science and its relationship to big data and data-
driven decision making. Big Data 1(1), 51-59.
Reeves C. A. & Bednar D. A. 1994. Defining quality: Alternatives and implications.
Academy of Management. The Academy of Management Review, 19(3), 419
Sandoval-Chavez D. A. & Beruvides M. G. 1998. Using opportunity costs to determine
the cost of quality: A case study in a continuous-process industry. The Engineering
Economist, 43(2), 107-124.
Savino M., Brun A. & Mazza A. 2014. Assessing Non Conformities in Quality
Management Systems from Customer perspective and Firm perspective. Proceedings of
18th International Working Seminar on Production Economics. In "18th International
Working Seminar on Production Economics" (pp. 1-8).
Schonberger R. J. 1986. World Class Manufacturing: the Lessons of Simplicity
Applied. New York: Free Press.

88
Schiffauerova A. & Thomson V. 2006. A review of research on cost of quality models
and best practices. International Journal of Quality & Reliability Management, 23(6),
647-669.
Shetwan A. G., Vitanov V. I. & Tjahjono B. 2011. Allocation of quality control stations
in multistage manufacturing systems. Computers & Industrial Engineering, 60(4), 473–
484.
Sousa R. & Voss C. A. 2002. Quality management re-visited: a reflective review and
agenda for future research. Journal of operations management, 20(1), 91-109.
Sower V. E. 2004. Estimating external failure costs: A key difficulty in COQ systems.
In ASQ World Conference on Quality and Improvement Proceedings (Vol. 58, p. 547).
American Society for Quality.
Stainer A. & Stainer L. 1995. Productivity, quality and ethics – a European viewpoint.
European Business Review, 95(6), 3-11.
Tsai W. H. 1998. Quality cost measurement under activity-based costing. International
Journal of Quality & Reliability Management, 15(7), 719-752.
Torkko M., Linna A., Katajavuori N. & Juppo A. M. 2013. Quality KPIs in
pharmaceutical and food industry. Journal of Pharmaceutical Innovation, 8(4), 205-211.
Tuchman B. W. 1980. The decline of quality. New York Times Magazine. November 2:
38-41
Van Kemenade E., Pupius M. & Hardjono T. W. 2008. More value to defining quality.
Quality in Higher Education, 14(2), 175-185.
Williams A. R. T., van der Wiele A. & Dale B. G. 1999. Quality costing: a management
review. International Journal of Management Review, 1(4), 441-461.
Yang C. C. 2008. Improving the definition and quantification of quality costs. Total
Quality Management, 19(3), 175-191.

89
Yin R.K. 2009. Case study research: Design and methods (Vol. 5). Sage.
Yong J. & Wilkinson A. 2002. The long and winding road: the evolution of quality
management. Total Quality Management, 13(1), 101-121.

APPENDICES
Appendix 1. Internal interview questions.
Laatu / Quality
1. Miten määrittelette laadun?
How do you define quality?
2. Mitä laatu tarkoittaa omassa työssänne?
What does quality mean in your own work?
Laatutavoitteet ja-mittarit / Quality targets and metrics
3. Mitä laatuun liittyviä tavoitteita osastollanne / tiimillänne on?
What quality-related targets do you have in your department?
4. Miten em. tavoitteiden saavuttamista seurataan ja mitataan?
How do you follow and measure the achievement of these targets?
5. Miten laatutavoitteita ja -mittareita tulisi kehittää?
How should quality targets and metrics be developed?
Laatupoikkeamat ja niiden käsittely / Quality nonconformity management
6. Miten määrittelette laatupoikkeaman?
How do you define a quality nonconformity?
7. Miten laatupoikkeamat vaikuttavat osastonne työhön?
How do quality nonconformities influence on the work of your department?
8. Miten laatupoikkeamia käsitellään ja ratkaistaan osastollanne?
How are quality nonconformities managed and solved at your department?
9. Miten laatupoikkeamista saatavaa dataa hyödynnetään osastollanne?
How do you utilise quality nonconformity data?
10. Mitä ongelmia datan hyödyntämiseen liittyy?
What kind of problems are there regarding quality nonconformity data and its
utilisation?
Kommunikaatio ja raportointi / Communication and reporting
11. Miten laatupoikkeamiin liittyvistä asioista raportoidaan osaston sisällä ja
ulkopuolelle?
How does your department report quality nonconformity issues?
12. Miten raportointia tulisi kehittää?
How should reporting be developed?
13. Miten laatupoikkeamiin liittyvistä asioista kommunikoidaan osastonne sisällä ja
osaston ulkopuolelle?
How does your department communicate quality nonconformity issues?
14. Miten kommunikaatiota tulisi kehittää?
How should communication be developed?
15. Millä foorumeilla laatupoikkeamiin liittyviä asioita tulisi käsitellä? (Esim.
intranet, viikko- /kuukausipalaverit yms.?)
What are the right forums for quality reporting and communication?

Appendix 2. Benchmarking interview questions.
Laatu / Quality
1. Mitä laatu tarkoittaa yrityksessänne?
How does your organisation define quality?
Laatutavoitteet ja-mittarit / Quality targets and metrics
2. Mitä laatuun liittyviä tavoitteita yrityksellänne on?
What quality-related targets do you have in your organisation?
3. Miten em. tavoitteiden saavuttamista seurataan ja mitataan?
How do you follow and measure the achievement of these targets?
Laatupoikkeamat ja niiden käsittely / Quality nonconformity management
4. Miten yrityksenne määrittelee laatupoikkeaman?
How does your organisation define a quality nonconformity?
5. Miten laatupoikkeamia käsitellään ja ratkaistaan yrityksessänne?
How are quality nonconformities managed and solved in your organisation?
6. Millainen laatupoikkeamienhallintajärjestelmä yrityksellänne on?
What kind of quality nonconformity management system do you have?
7. Mitä dataa laatupoikkeamista kerätään?
What data is collected about quality nonconformities?
8. Miten em. dataa hyödynnetään laadun kehityksessä?
How is the data utilised to improve quality?
9. Mitä ongelmia datan hyödyntämiseen liittyy?
What kind of problems are there regarding quality nonconformity data and its
utilisation?
Kommunikaatio ja raportointi / Communication and reporting
10. Miten laatupoikkeamista raportoidaan?
How does your organisation report quality nonconformity issues?
11. Miten laatupoikkeamiin liittyvistä asioista kommunikoidaan yrityksessänne?
How does your organisation communicate quality nonconformity issues?
12. Millä foorumeilla laatupoikkeamiin liittyviä asioita käsitellään? (Esim. intranet,
viikko- /kuukausipalaverit yms.?)
What kind of forums are used for quality reporting and communication?

Appendix 3. Required improvements in internal quality nonconformity data collection
based on the C5 model.
C5 data
attribute
Data
attribute in
SAP
Improvement required C
ondit
ion
Failures
experienced
Defect code,
Description,
Priority
Defect codes are discussed in detail in
chapter 4.1.1. Priority field in SAP could
be used to define the importance of the
nonconformity.
Customers
impacted
End customer
name
End customer name in SAP is not always
the actual end customer. It can be for
example a sales company.
Products
impacted
Material,
material
description
Material field does not tell the end
product but only the nonconforming
material. Information about critical
product characteristics (motor type, frame
size, pole number, variant codes) should
be linked to quality notifications.
Quantities
impacted
Quantities,
complaint
quantity
Quantities of nonconforming items have
to be input manually. For this reason,
quantities are often faulty in quality
notifications.
Location of
products
Defect
location,
Author name
Defect location tells the production line
where a nonconformity is detected. It
would be more valuable to know where
the nonconformity is created. Also,
production line level is not accurate
enough.
Sources of
products
Vendor name,
Defect
location
Cau
se
Reason for
occurrence
Root cause is usually not documented.
Corr
ecti
on
Solution Long text Solutions and corrective actions are not
documented systematically. Sometimes
the information in the long text field tells
how the nonconformity is solved but that
is often not the case.
Com
munic
ati
on
Execution
plan and
schedule
Processing
Contact
people
Partner
assignment

Cost
Cost to
company
Scrap costs Only scrap costs are taken into account.
Other costs, such as repair costs,
additional work and lost production
should not be overlooked.

Appendix 4. Proposed defect coding for internal quality nonconformities.
1. taso 2. taso
Sähköiset virheet ja koestusvirheet Maasulku
Vaihesulku
Vyyhtisulku
Kierrossulku
Vastusvirhe
Erityisvastus
Lisälaitevirhe
IO, tyhjäkäyntivirta
IK, oikosulkuvirta
Lisälaitevirhe
Tärinä
Tarkistusarvot puuttuvat
Ääni
Hyötysuhde
Lämpenemä
Valmistusvirheet Laitevirhe
Riparikko
Valuvirhe
Puristusvirhe
Pintakäsittelyvirhe
Huokonen
Mittavirhe
Käämintävirhe
Kytkentävirhe
Virhe työnsuorituksessa
Materiaalivirheet Mittavirhe
Käämintävirhe
Kytkentävirhe
Dokumenttivirhe
Huokonen
Pintakäsittelyvirhe
Virhe työnsuorituksessa

Ruoste
Toimituksesta puuttuu osa / Rakenne
väärin
Suunnitteluvirheet Tieto puuttuu
Virhe arvokilvessä
Virhe dokumenteissa
Virhe konfiguraattorissa
Virhe laskelmassa
Virhe rakenteella
Virhe työkortilla
Logistiikkavirheet Kuljetusvaurio
Hankinnan virheet