Q1 2018 Results - gsk.com · Common goal to improve health, from prevention to treatment...
29
Q1 2018 Results 25 April 2018
-
Upload
truongnguyet -
Category
Documents
-
view
214 -
download
0
Transcript of Q1 2018 Results - gsk.com · Common goal to improve health, from prevention to treatment...
Q1 2018 Results
25 April 2018

This presentation may contain forward-looking statements. Forward-looking statements give the Group’s current expectations or forecasts of future events. An investor can identify these statements by the fact that they do not relate strictly to historical or current facts. They use words such as ‘anticipate’, ‘estimate’, ‘expect’, ‘intend’, ‘will’, ‘project’, ‘plan’, ‘believe’, ‘target’ and other words and terms of similar meaning in connection with any discussion of future operating or financial performance. In particular, these include statements relating to future actions, prospective products or product approvals, future performance or results of current and anticipated products, sales efforts, expenses, the outcome of contingencies such as legal proceedings, and financial results.
Other than in accordance with its legal or regulatory obligations (including under the Market Abuse Regulations, UK Listing Rules and the Disclosure Guidance and Transparency Rules of the Financial Conduct Authority), the Group undertakes no obligation to update any forward-looking statements, whether as a result of new information, future events or otherwise. Investors should, however, consult any additional disclosures that the Group may make in any documents which it publishes and/or files with the US Securities and Exchange Commission (SEC). All investors, wherever located, should take note of these disclosures. Accordingly, no assurance can be given that any particular expectation will be met and investors are cautioned not to place undue reliance on the forward-looking statements.
Forward-looking statements are subject to assumptions, inherent risks and uncertainties, many of which relate to factors that are beyond the Group’s control or precise estimate. The Group cautions investors that a number of important factors, including those in this presentation, could cause actual results to differ materially from those expressed or implied in any forward-looking statement. Such factors include, but are not limited to, those discussed under Item 3.D ‘Risk factors’ in the Group’s Annual Report on Form 20-F for FY 2017. Any forward-looking statements made by or on behalf of the Group speak only as of the date they are made and are based upon the knowledge and information available to the Directors on the date of this presentation.
A number of adjusted measures are used to report the performance of our business. These measures are defined in our first quarter 2018 earnings release on page 21 and Annual Report on Form 20-F for FY 2017.
All expectations and targets regarding future performance should be read together with “Assumptions related to 2018 guidance and 2016-2020 outlook” on page 22 of our first quarter 2018 earnings release.
Cautionary statement regarding forward-looking statements
2

David Redfern, Chief Strategy Officer, Chairman of ViiV Healthcare
Agenda
3
Q1 2018 progress
Q&A:Dr Hal Barron, Chief Scientific Officer and President, R&DBrian McNamara, Chief Executive Officer, GSK Consumer HealthcareLuc Debruyne, President, Global Vaccines
Emma Walmsley, Chief Executive Officer
Luke Miels, President, Global Pharmaceuticals
Pharma update
Q1 2018 financial results Simon Dingemans, Chief Financial Officer
Summary Emma Walmsley, Chief Executive Officer

Q1 2018 progressEmma Walmsley, CEO
25 April 2018

Balanced business to deliver growth and returns to shareholders
5
Vaccines
Broadest portfolio with leading position in meningitis and opportunity in shingles
Pharmaceuticals
Leading positions in HIV and Respiratory
Consumer Healthcare
Category leadership in Respiratory, Pain Relief and Oral Health
Common goal to improve health, from prevention to treatment
Therapeutic and category leadership
Global opportunities
Strategic and operational synergies
Balanced set of cash flows and returns

CER Sales growth in all 3 businesses; improved Group operating margin
6
Consumer Healthcare+2%
Vaccines+13%
Pharmaceuticals+2%
Shingrix reported sales of £110 millionMeningitis sales -2%; Bexsero +13%
New Respiratory products +42%HIV sales +14%; dolutegravir +23%
Strong performance in Oral Health and Pain ReliefContinued strong growth of Power brands
Group sales growth of +4%
130bp improvement in Group Adjusted operating margin
Adjusted EPS growth of +11%
FCF of £324 million
All growth rates and margin changes at CER. The definitions and reconciliations for non-IFRS measures are set out on page 21 of our Q1 2018 earnings release

Q1 progress made on our 3 long-term priorities
7
Trust
Performance
Innovation Commercial execution
Strong launches for Shringrix, Trelegy, Juluca
Growth in Ellipta, Nucala and HIV
Strengthen R&D
Cost, cash and capital discipline
New leadership appointments
Continued prioritisation and focus on development discipline
Buyout of Novartis consumer healthcare stake Commercial and supply chain restructuringNew incentives
Culture change
Pharma update
Luke Miels, President, Global Pharmaceuticals
David Redfern, Chief Strategy Officer, Chairman of ViiV Healthcare
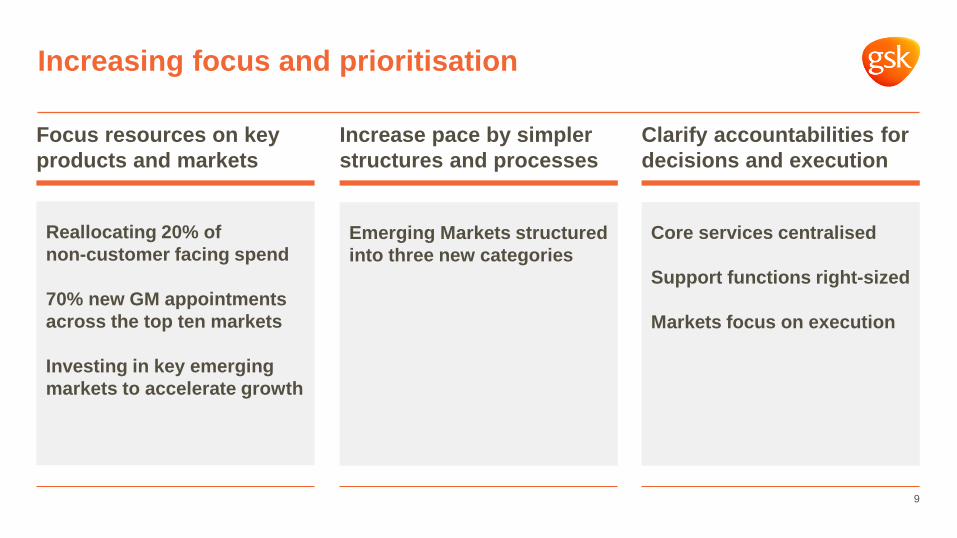
Increasing focus and prioritisation
Focus resources on key products and markets
Clarify accountabilities for decisions and execution
Increase pace by simpler structures and processes
Core services centralised
Support functions right-sized
Markets focus on execution
Emerging Markets structured into three new categories
Reallocating 20% of non-customer facing spend
70% new GM appointments across the top ten markets
Investing in key emerging markets to accelerate growth
9

Trelegy: driving continued leadership
Strongest US Ellipta launch to date
IMPACT published in NEJM 18th April 2018sNDA approved 24 April 2018
Significant exacerbation reduction with TRELEGY in COPD
1. Annual rate of on-treatment moderate and severe exacerbations (IMPACT)
15%reduction vs Breo1
25%reduction vs Anoro1
10
-
1,000
2,000
3,000
4,000
5,000
6,000
1 2 3 4 5 6 7 8 9 10 11 12 13 14 15 16 17 18 19 20Weeks post launch
Breo Incruse Arnuity Anoro Trelegy
Source: IQVIA NPA weekly TRx data
TRx

Nucala: a leading respiratory biologic with significant growth opportunity
11
Market continues to demonstrate strong growth
Highly competitive profile
Leading in scienceConsistent exacerbation reduction1
OCS reduction 50%, sustained up to 1.5 years2
Effective in SEA patients uncontrolled on Xolair3
Significant growth opportunity<25% of eligible patients treated in US
Steady uptake in new EGPA indication in the US
US regulatory submission for use in COPD filed November 2017
Global rollout continuing
1. MENSA and MUSCA studies: EOS > 150 cells/µl: 53 - 58% reduction in exacerbations, EOS > 300 cells/µl: 61 - 64% reduction in exacerbations2. SIRIUS and COSMOS studies3. OSMO study
Source: IQVIA NPA weekly TRx dataSEA market: comprises Nucala, Fasenra™ and ~20% of Xolair™patient populationEOS: eosinophil; OCS: oral corticosteroid; SEA: severe eosinophilic asthma; EGPA: eosinophilic granulomatosis with polyangiitis. All trademarks are the property of their respective owners
0
2,000
4,000
6,000
8,000
10,000
12,000
14,000
Mar-16 Mar-17 Mar-18
TRx for SEA market
Competitor A Nucala Competitor B

Building a new standard of prevention
Strong uptake, rapidly surpassing competitor volumes
Source: IQVIA NPA weekly TRx data
Shingrix: encouraging launch performance
Strong clinical profile>90% efficacy across identified age groups1,2
Sustained efficacy2
Building US access and share>90% access with both Medicare and Commercial
>90% of known market share3
Q1 2018 sales of £110 million, with strong channel demand and encouraging initial uptake
Market recovering after several months of transition
1. Does not include immunocompromised population 2. Lal H et al. Efficacy of an Adjuvanted Herpes Zoster Subunit Vaccine in Older Adults. N Engl J Med. 2015;372:2087-96; Cunningham et al. Efficacy of the herpes zoster subunit vaccine in adults 70 years of age or older. N Engl J Med. 2016;375:1019-32. 3. IQVIA data, represents ~60% of the market
- 10,000 20,000 30,000 40,000 50,000 60,000 70,000
Weekly Shingrix volume vs '17 competitor weekly (weekly pharmacy administered doses)
Weekly Shingrix TRx Weekly Competitor TRx (2017)
12
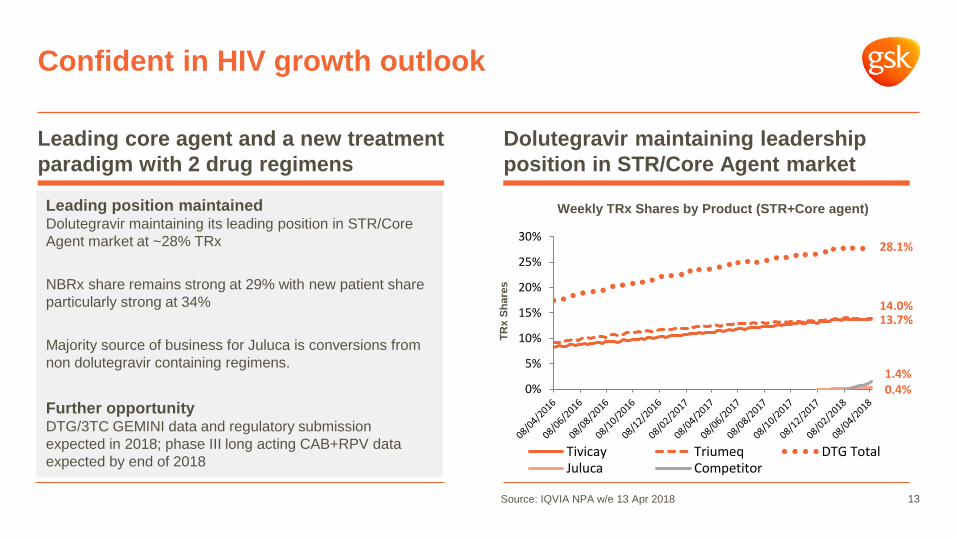
Confident in HIV growth outlook
Source: IQVIA NPA w/e 13 Apr 2018 13
Leading position maintainedDolutegravir maintaining its leading position in STR/Core Agent market at ~28% TRx
NBRx share remains strong at 29% with new patient share particularly strong at 34%
Majority source of business for Juluca is conversions from non dolutegravir containing regimens.
Further opportunityDTG/3TC GEMINI data and regulatory submission expected in 2018; phase III long acting CAB+RPV data expected by end of 2018
Leading core agent and a new treatment paradigm with 2 drug regimens
Dolutegravir maintaining leadership position in STR/Core Agent market
14.0%13.7%
28.1%
0.4%1.4%
0%
5%
10%
15%
20%
25%
30%
Tivicay Triumeq DTG TotalJuluca Competitor
TRx
Shar
es
Weekly TRx Shares by Product (STR+Core agent)

Q1 2018 financial resultsSimon Dingemans, CFO

Q1 2018 Reported growth %
£m AER CER
Turnover 7,222 (2) 4
Total operating profit 1,240 (28) (15)
Total EPS 11.2 (48) (33)
Adjusted operating profit 1,923 (3) 9
Adjusted EPS 24.6 (2) 11
Free cash flow 324 (50) n/a
Sales growth and operating leverage offset by currency headwindHeadline results
15

Total results
Intangible amortisation
Intangible impairment
Major restructuring
Transaction related
Disposals,significant legal and other
Adjustedresults
Turnover (£bn) 7.2 7.2
Operating profit (£bn) 1.2 0.1 <0.1 0.1 0.4 - 1.9
EPS (pence) 11.2 2.4 0.5 1.0 9.0 0.5 24.6
Q1 17 EPS(pence) 21.4 2.3 0.7 2.7 0.9 (3.0) 25.0
Q1 2018 resultsResults reconciliation
16
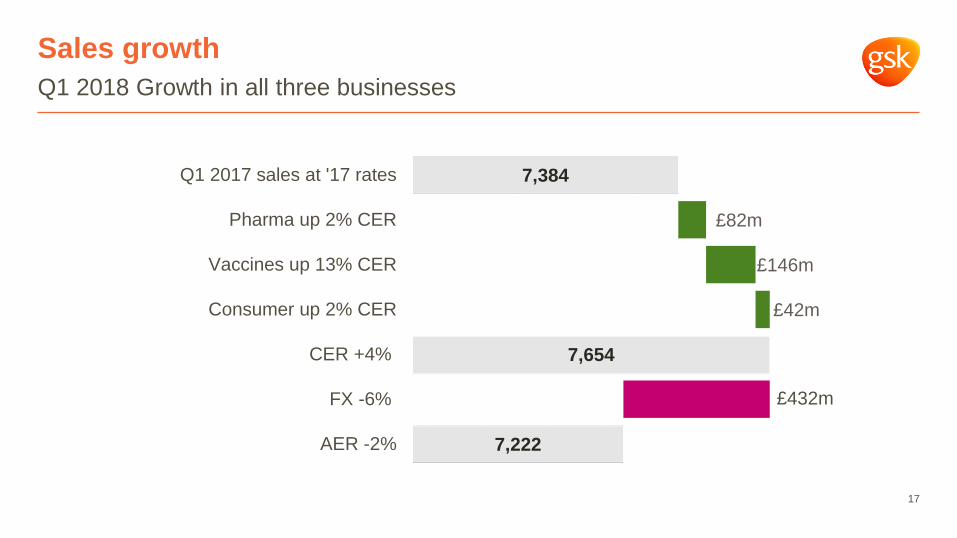
Sales growthQ1 2018 Growth in all three businesses
17
7,384
7,654
7,222
£82m
£146m
£42m
£432m
Q1 2017 sales at '17 rates
Pharma up 2% CER
Vaccines up 13% CER
Consumer up 2% CER
CER +4%
FX -6%
AER -2%
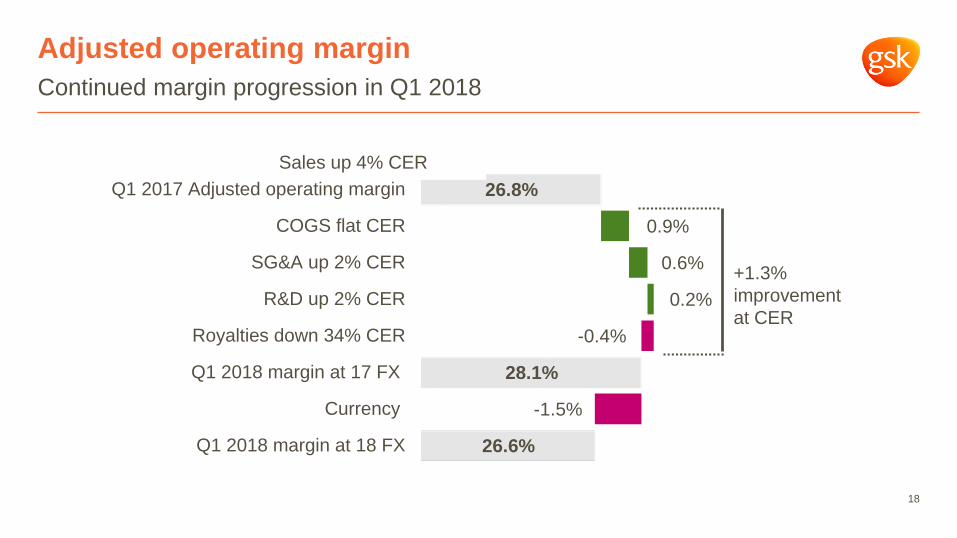
26.8%
28.1%
26.6%
0.9%
0.6%
0.2%
-0.4%
-1.5%
Q1 2017 Adjusted operating margin
COGS flat CER
SG&A up 2% CER
R&D up 2% CER
Royalties down 34% CER
Q1 2018 margin at 17 FX
Currency
Q1 2018 margin at 18 FX
+1.3% improvement at CER
Adjusted operating marginContinued margin progression in Q1 2018
18
Sales up 4% CER
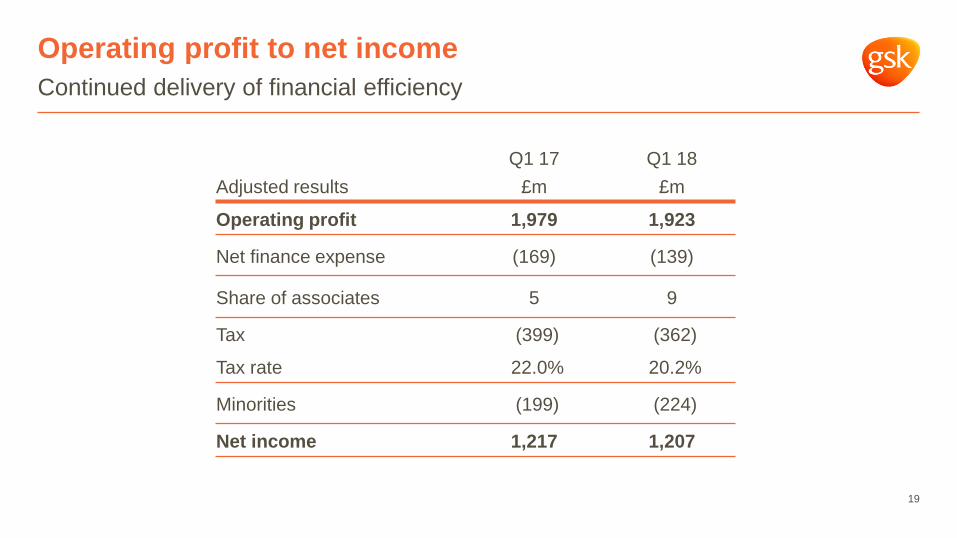
Continued delivery of financial efficiencyOperating profit to net income
19
Q1 17 Q1 18Adjusted results £m £m
Operating profit 1,979 1,923
Net finance expense (169) (139)
Share of associates 5 9
Tax (399) (362)
Tax rate 22.0% 20.2%
Minorities (199) (224)
Net income 1,217 1,207
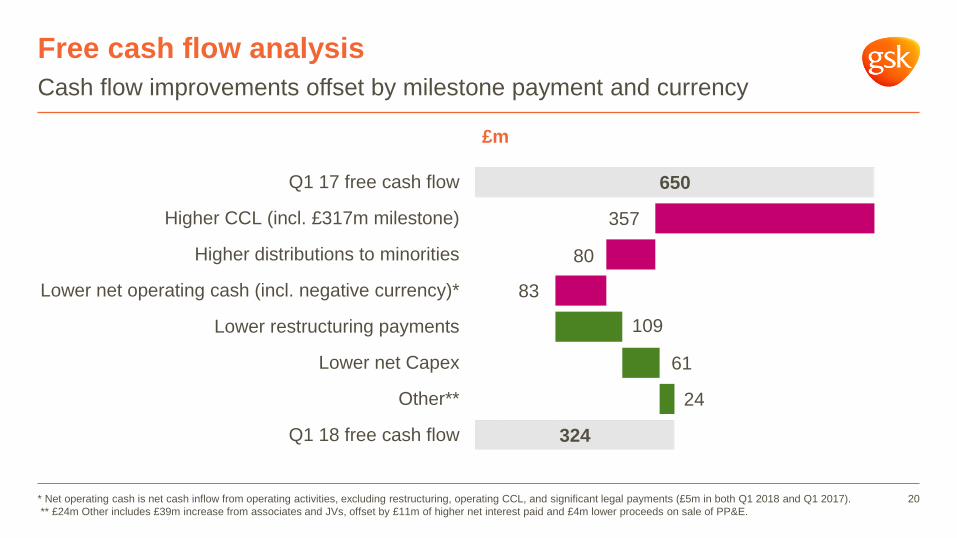
Cash flow improvements offset by milestone payment and currencyFree cash flow analysis
20* Net operating cash is net cash inflow from operating activities, excluding restructuring, operating CCL, and significant legal payments (£5m in both Q1 2018 and Q1 2017).** £24m Other includes £39m increase from associates and JVs, offset by £11m of higher net interest paid and £4m lower proceeds on sale of PP&E.
£m
650
324
109
61
24
357
80
83
Q1 17 free cash flow
Higher CCL (incl. £317m milestone)
Higher distributions to minorities
Lower net operating cash (incl. negative currency)*
Lower restructuring payments
Lower net Capex
Other**
Q1 18 free cash flow
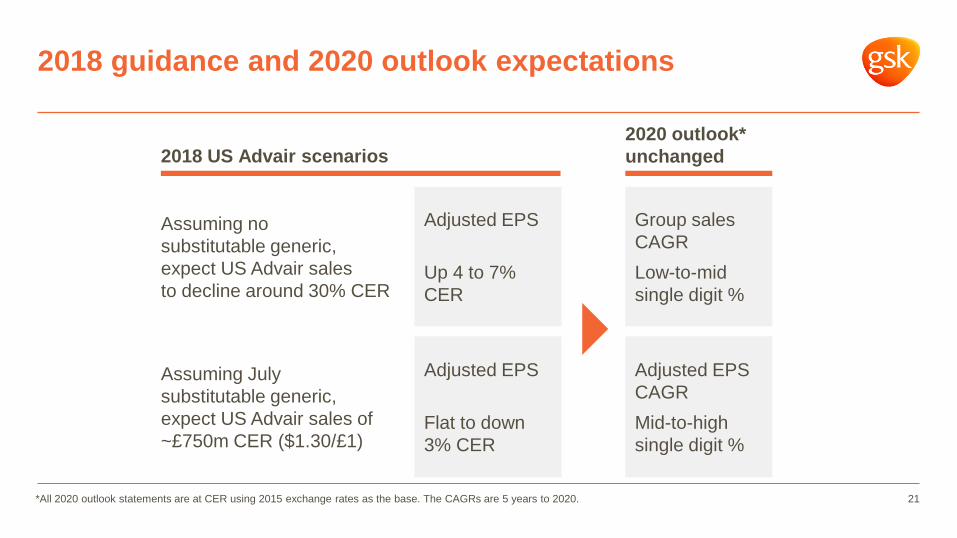
2018 guidance and 2020 outlook expectations
21
Assuming no substitutable generic, expect US Advair sales to decline around 30% CER
Assuming July substitutable generic, expect US Advair sales of ~£750m CER ($1.30/£1)
Adjusted EPS
Flat to down 3% CER
Adjusted EPS
Up 4 to 7% CER
2018 US Advair scenarios2020 outlook* unchanged
Group sales CAGR Low-to-mid single digit %
Adjusted EPS CAGRMid-to-high single digit %
*All 2020 outlook statements are at CER using 2015 exchange rates as the base. The CAGRs are 5 years to 2020.

SummaryEmma Walmsley, CEO
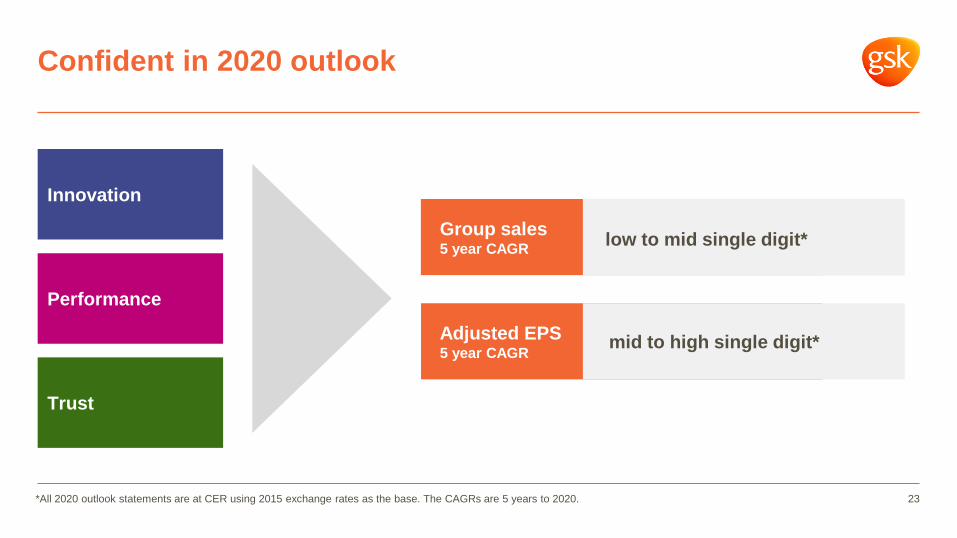
Confident in 2020 outlook
23
Group sales5 year CAGR low to mid single digit*
Adjusted EPS5 year CAGR mid to high single digit*
Trust
Performance
Innovation
*All 2020 outlook statements are at CER using 2015 exchange rates as the base. The CAGRs are 5 years to 2020.

Q&A

Appendix

Capital allocation framework
26
Invest in the business
1. Pharma pipeline including BD
2. Consumer put
3. Vaccines capacity
Key priorities for capital
Improved cash generation
Shareholderreturns
80p per share expected for 2018Focus on rebuilding free cash flow cover over time Target 1.25x to 1.5x FCF cover before returning to dividend growth
Other BD/M&A
Strict discipline on returnsTrust
Performance
Innovation

2398852 (dezamizumab)in amyloidosisPhase IIb data
dolutegravir +lamivudine2DR in HIVUS/EU approvals
HIV/Infectious diseases
Respiratory
Immuno-inflammation
Oncology
Other therapy areas
Regulatory
Ph II/III data
Ph I/II data
cabotegravir + rilpivirineinjectable 2DR in HIVUS approval
cabotegravir + rilpivirineinjectable 2DR in HIVEU approval
dolutegravir +lamivudine2DR in HIVUS/EU submissions
Data on key assets in next 3 years to inform investment in Pharma pipeline, organically or inorganically
cabotegravir + rilpivirineinjectable 2DR in HIVUS/EU submissions
dolutegravir + rilpivirine2DR in HIVEU approval
dolutegravir+ lamivudine2DR in HIVPhase III data
cabotegravir + rilpivirineinjectable 2DR in HIVPhase III data
danirixinCXCR2 in COPD Phase IIb data
Closed tripleAsthmaPhase III data
3359609 ICOS agonist mAb in cancersPhase Ib data
1278863 (daprodustat)PHI in anaemia with chronic renal disease Phase III data
3196165 anti-GM-CSF mAb in OAPhase IIb data
cabotegravirHIV preventionPhase III data
3196165 anti-GM-CSF mAb in RAPhase IIb data
2982772 RIP1 kinase inhibitor in psoriasisPhase IIb data
3174998 OX40 agonist mAb in cancersPhase Ib data
2982772 RIP1 kinase inhibitor in UCPhase IIa data
525762 BET inhibitor in heme. malignanciesPhase Ib data
3377794 NY ESO-1 in NSCLCPhase Ib data
2857916BCMA + SoC (2L) in MMPhase Ib data
525762 BET inhibitor for other solid tumoursPhase Ib data
2982772 RIP1 kinase inhibitor in RAPhase IIa data
2982772 RIP1 kinase inhibitor in psoriasisPhase IIa data
Closed triple AsthmaUS/EU approvals
Closed triple AsthmaUS/EU submissions
2018 2019 2020
2269557 (nemiralisib)PI3Kδ in COPD Phase IIa/b data
2857916BCMA (4L) in MM Phase II (pivotal) data
2857916BCMA (4L) in MM US/EU submissions
2857916BCMA (4L) in MM US/EU approvals
2894512 (tapinarof)topical NSAID in atopic dermatitis, psoriasis Phase III data
2894512 (tapinarof)topical NSAID in atopic dermatitis, psoriasis US/EU submissions

Main programme mostly completed, so lower incremental savings going forwardsGood progress on restructuring
28* 2018-2020 cumulative FX benefit estimated using March 2018 rates.
Annual savings at 2015 FX£bn
Cumulative FX benefit*: 0.4 0.4 0.4 0.4
2016 2017 2018 2019 2020
4.03.73.53.32.8
0.2
Costs of up to £5.7bn £4.1bn cash£1.6bn non cash
£4.8bn expensed to date (up to Q1 2018)£3.5bn cash, £3.2bn paid£1.3bn non cash
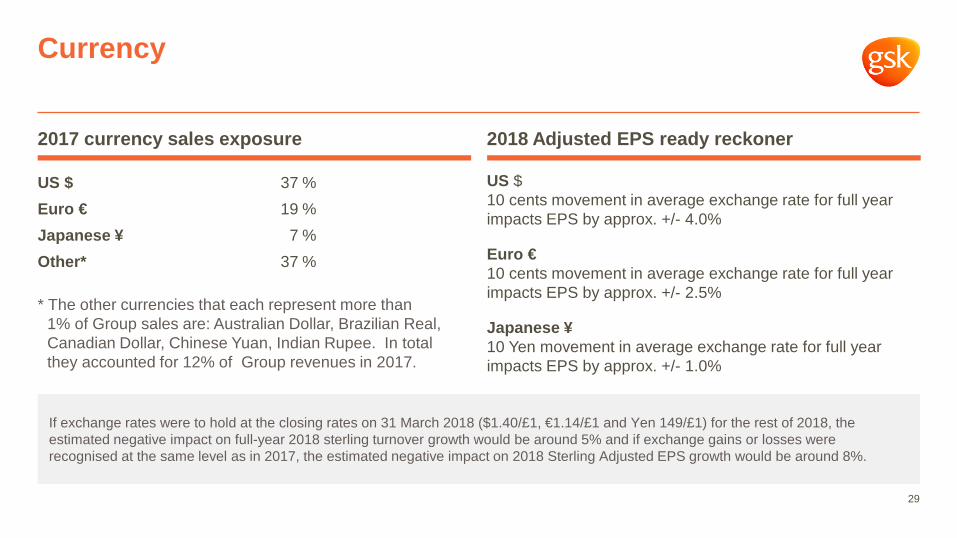
Currency
If exchange rates were to hold at the closing rates on 31 March 2018 ($1.40/£1, €1.14/£1 and Yen 149/£1) for the rest of 2018, the estimated negative impact on full-year 2018 sterling turnover growth would be around 5% and if exchange gains or losses were recognised at the same level as in 2017, the estimated negative impact on 2018 Sterling Adjusted EPS growth would be around 8%.
US $10 cents movement in average exchange rate for full year impacts EPS by approx. +/- 4.0%
Euro €10 cents movement in average exchange rate for full year impacts EPS by approx. +/- 2.5%
Japanese ¥10 Yen movement in average exchange rate for full year impacts EPS by approx. +/- 1.0%
US $ 37 %Euro € 19 %Japanese ¥ 7 %Other* 37 %
* The other currencies that each represent more than 1% of Group sales are: Australian Dollar, Brazilian Real, Canadian Dollar, Chinese Yuan, Indian Rupee. In total they accounted for 12% of Group revenues in 2017.
2018 Adjusted EPS ready reckoner 2017 currency sales exposure
29