Pyxis tanker company presentation - may 2016
32
COMPANY PRESENTATION May 2016
-
Upload
pyxistankers2016 -
Category
Investor Relations
-
view
232 -
download
0
Transcript of Pyxis tanker company presentation - may 2016
COMPANY PRESENTATIONMay 2016
2
DISCLAIMERFORWARD-LOOKING STATEMENTS & INFORMATION
This presentation contains forward-looking statements and forward-looking information within the meaning of
applicable securities laws. The use of any of the words “expected'', “budget”, “scheduled”, “anticipated”, “outlook”, “is
estimated”, “forecasts”, “potential”, “continues”, “may”, “will”, “positioned”, “should”, “believe”, “intends” and
variations of these terms and similar expressions, or the negative of these terms or similar expressions, are intended to
identify forward-looking, information or statements. Forward-looking information is based on the opinions, expectations
and estimates of management of Pyxis Tankers Inc. (“we” or “our”) at the date the information is made, and is based
on a number of assumptions and subject to a variety of risks and uncertainties and other factors that could cause
actual events or results to differ materially from those projected in the forward-looking information. Although we believe
that the expectations and assumptions on which such forward-looking statements and information are based are
reasonable, you should not place undue reliance on the forward-looking statements and information because we
cannot give any assurance that they will prove to be correct. Since forward-looking statements and information
address future events and conditions, by their very nature they involve inherent risks and uncertainties and actual results
and future events could differ materially from those anticipated in such information. Factors that might cause or
contribute to such discrepancy include, but are not limited to, the risk factors described in our Annual Report on Form
20-F for the year ended December 31, 2105 and other filings with the Securities and Exchange Commission (the “SEC”).
The forward-looking statements and information contained in this presentation are made as of the date hereof. We do
not undertake any obligation to update publicly or revise any forward-looking statements or information, whether as a
result of new information, future events or otherwise, except in accordance with U.S. federal securities laws and other
applicable securities laws.
This presentation and any oral statements made in connection with it are for informational purposes only and do not
constitute an offer to buy or sell our securities. For more complete information about us, you should read the
information in this presentation together with our filings with the SEC, which may be accessed at the SEC’s website
(http://www.sec.gov).
3
COMPANY HIGHLIGHTSEMERGING GROWTH - PURE PLAY PRODUCT TANKER COMPANY
Competitive Cost Structure & Solid Balance Sheet►Comparable total daily operational costs to peer group
►Moderate capitalization with low cost, long-lived bank debt
►Excess balance sheet capacity to grow tonnage through acquisitions
Experienced, Incentivized Management & Board►Strong management team with 100+ years of combined industry and capital markets
experience
►Founder/CEO has proven track record and is a substantial shareholder
►Board Members consist of prominent industry figures and/or with significant experience
Attractive, Modern Fleet Including “Eco” Vessels►Focus on modern medium range (“MR”) product tankers with “eco” features
►Young tanker fleet of 6 IMO-certified vessels with weighted average age of 5.1 years (dwt)
►Potential for an additional 1 or 2 MR’s to be acquired
Reputable Customer Base & Diversified Chartering Strategy►Long-standing relationships with reputable, first-class customers worldwide
►Time charter and spot market exposure with 53% of remaining available chartering days
covered for 2016 (59% with options) as of March 31, 2016
►Positioned to capitalize when spot rates improve
4
COMPANY STRATEGYQUALITY, GROWTH, SERVICE & FLEXIBILITY
Utilize Portfolio Approach to Commercial Management
►Employ vessels primarily through time charters (with and without profit share) and on the
spot market
►Diversify charters by customer and staggered duration
►Position employment to capture upside during periods of market strength
Maintain Financial Flexibility►Expand fleet by targeting balanced capital structure of debt and equity
►Maintain commercial banking and expand public capital markets relationships
Grow the Fleet Opportunistically►Focus on acquisition of IMO II and III class product tankers of eight years of age or less
built in Tier 1 Asian shipyards
►Potential acquisition opportunity of one or two MR tankers owned/controlled by
affiliates of our CEO
Focus on the Needs of Our Customers►Meet charterers’ preference for modern tankers, which offer more operating reliability and
efficiency
►Maintain high standards to ensure high level of safety, customer service and support, while
continuing ship level financial discipline
5
FLEET & EMPLOYMENT OVERVIEWSTABLE, VISIBLE CASH FLOWS WITH UPSIDE OPPORTUNITY
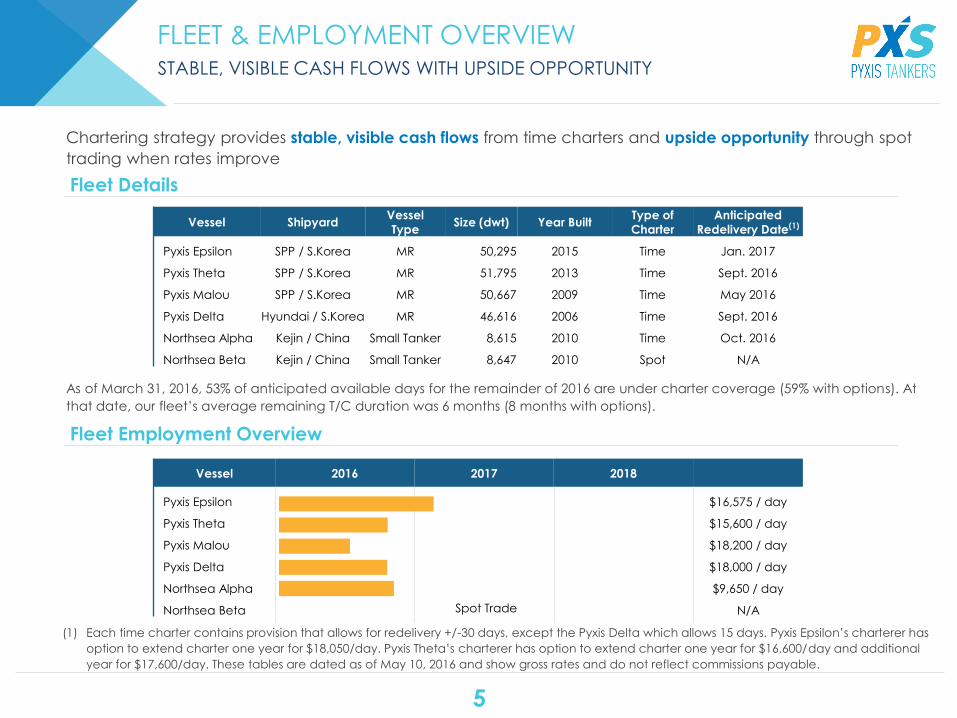
Chartering strategy provides stable, visible cash flows from time charters and upside opportunity through spot
trading when rates improve
Vessel ShipyardVessel
TypeSize (dwt) Year Built
Type of
Charter
Anticipated
Redelivery Date(1)
Pyxis Epsilon SPP / S.Korea MR 50,295 2015 Time Jan. 2017
Pyxis Theta SPP / S.Korea MR 51,795 2013 Time Sept. 2016
Pyxis Malou SPP / S.Korea MR 50,667 2009 Time May 2016
Pyxis Delta Hyundai / S.Korea MR 46,616 2006 Time Sept. 2016
Northsea Alpha Kejin / China Small Tanker 8,615 2010 Time Oct. 2016
Northsea Beta Kejin / China Small Tanker 8,647 2010 Spot N/A
Fleet Details
Fleet Employment Overview
(1) Each time charter contains provision that allows for redelivery +/-30 days, except the Pyxis Delta which allows 15 days. Pyxis Epsilon’s charterer has
option to extend charter one year for $18,050/day. Pyxis Theta’s charterer has option to extend charter one year for $16,600/day and additional
year for $17,600/day. These tables are dated as of May 10, 2016 and show gross rates and do not reflect commissions payable.
As of March 31, 2016, 53% of anticipated available days for the remainder of 2016 are under charter coverage (59% with options). At
that date, our fleet’s average remaining T/C duration was 6 months (8 months with options).
Vessel 2016 2017 2018
Pyxis Epsilon $16,575 / day
Pyxis Theta $15,600 / day
Pyxis Malou $18,200 / day
Pyxis Delta $18,000 / day
Northsea Alpha $9,650 / day
Northsea Beta N/ASpot Trade
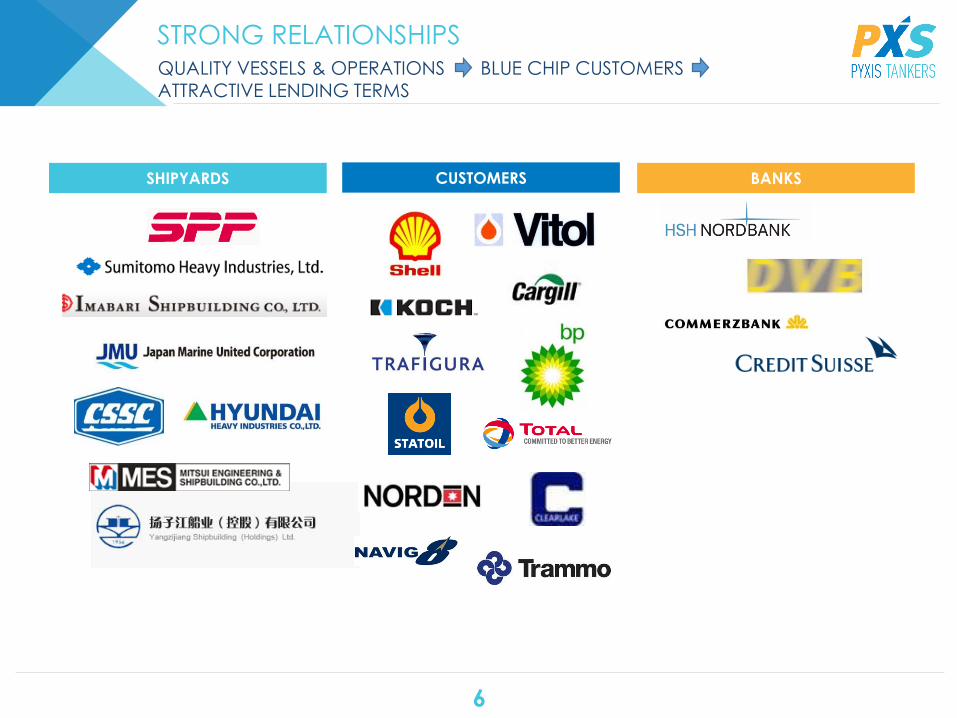
SHIPYARDS BANKS
6
STRONG RELATIONSHIPSQUALITY VESSELS & OPERATIONS BLUE CHIP CUSTOMERS ATTRACTIVE LENDING TERMS
CUSTOMERS
7
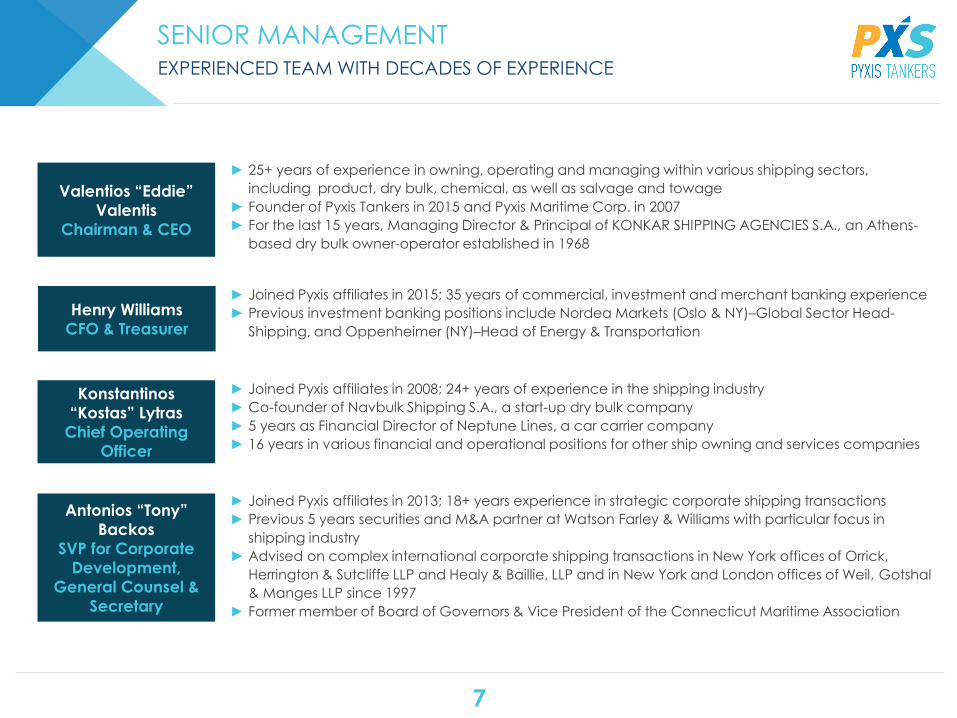
SENIOR MANAGEMENTEXPERIENCED TEAM WITH DECADES OF EXPERIENCE
► Joined Pyxis affiliates in 2013; 18+ years experience in strategic corporate shipping transactions
► Previous 5 years securities and M&A partner at Watson Farley & Williams with particular focus in
shipping industry
► Advised on complex international corporate shipping transactions in New York offices of Orrick,
Herrington & Sutcliffe LLP and Healy & Baillie, LLP and in New York and London offices of Weil, Gotshal
& Manges LLP since 1997
► Former member of Board of Governors & Vice President of the Connecticut Maritime Association
► Joined Pyxis affiliates in 2008; 24+ years of experience in the shipping industry
► Co-founder of Navbulk Shipping S.A., a start-up dry bulk company
► 5 years as Financial Director of Neptune Lines, a car carrier company
► 16 years in various financial and operational positions for other ship owning and services companies
► 25+ years of experience in owning, operating and managing within various shipping sectors,
including product, dry bulk, chemical, as well as salvage and towage
► Founder of Pyxis Tankers in 2015 and Pyxis Maritime Corp. in 2007
► For the last 15 years, Managing Director & Principal of KONKAR SHIPPING AGENCIES S.A., an Athens-
based dry bulk owner-operator established in 1968
► Joined Pyxis affiliates in 2015; 35 years of commercial, investment and merchant banking experience
► Previous investment banking positions include Nordea Markets (Oslo & NY)–Global Sector Head-
Shipping, and Oppenheimer (NY)–Head of Energy & Transportation
Antonios “Tony”
Backos
SVP for Corporate
Development,
General Counsel &
Secretary
Konstantinos
“Kostas” Lytras
Chief Operating
Officer
Valentios “Eddie”
Valentis
Chairman & CEO
Henry Williams
CFO & Treasurer
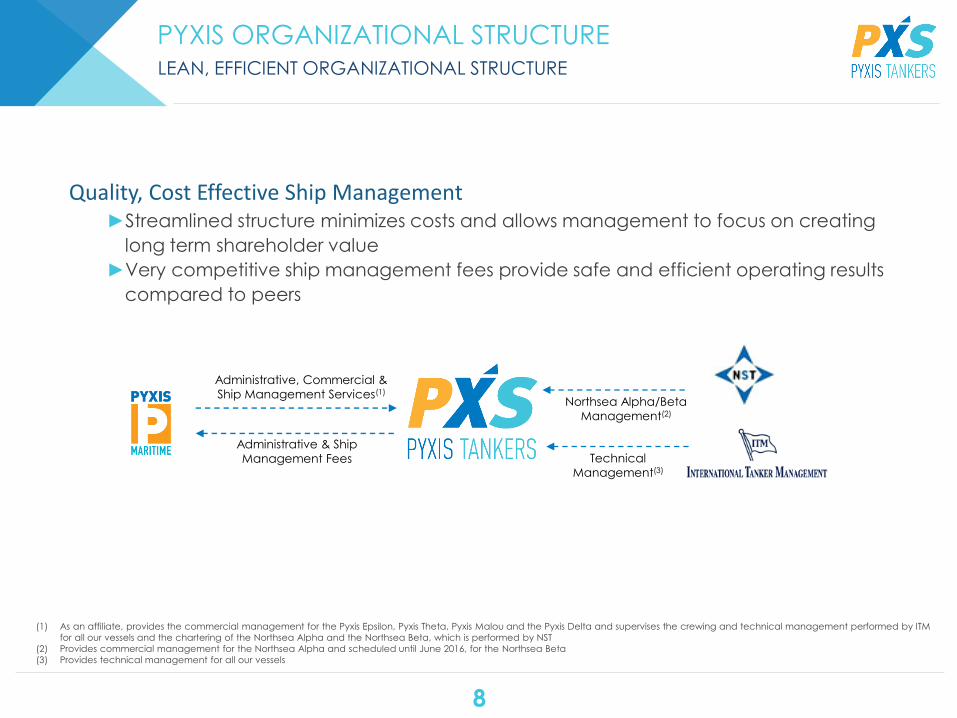
PYXIS ORGANIZATIONAL STRUCTURELEAN, EFFICIENT ORGANIZATIONAL STRUCTURE
Administrative, Commercial &
Ship Management Services(1)
Administrative & Ship
Management Fees
(1) As an affiliate, provides the commercial management for the Pyxis Epsilon, Pyxis Theta, Pyxis Malou and the Pyxis Delta and supervises the crewing and technical management performed by ITM
for all our vessels and the chartering of the Northsea Alpha and the Northsea Beta, which is performed by NST
(2) Provides commercial management for the Northsea Alpha and scheduled until June 2016, for the Northsea Beta
(3) Provides technical management for all our vessels
Northsea Alpha/Beta
Management(2)
Technical
Management(3)
8
Quality, Cost Effective Ship Management►Streamlined structure minimizes costs and allows management to focus on creating
long term shareholder value
►Very competitive ship management fees provide safe and efficient operating results
compared to peers
MARKET OVERVIEWPRODUCT TANKER INDUSTRY
10
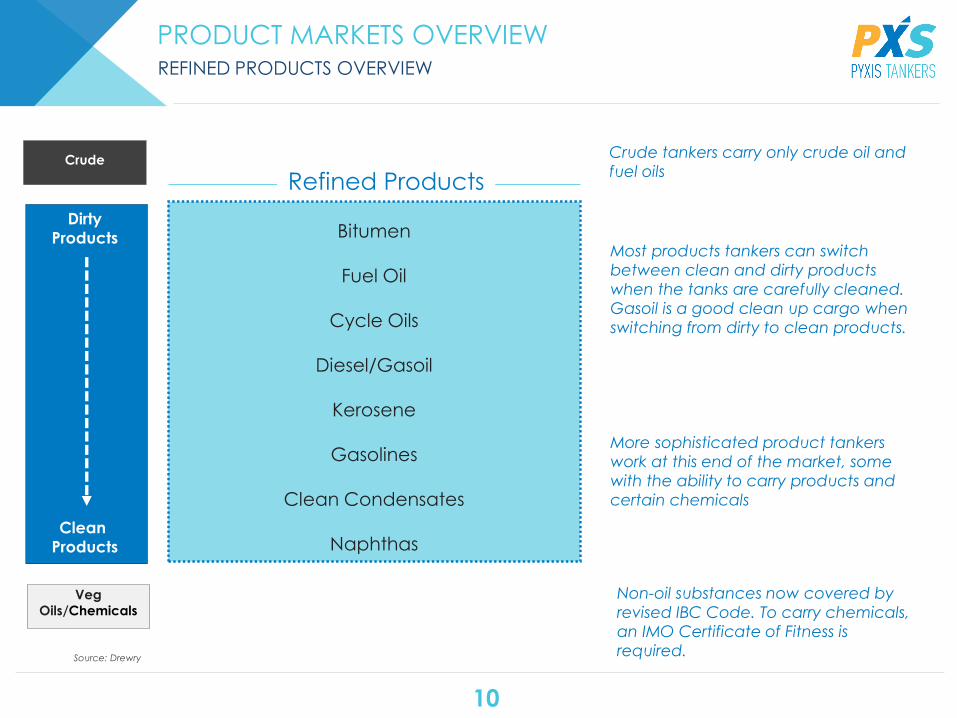
PRODUCT MARKETS OVERVIEWREFINED PRODUCTS OVERVIEW
Source: Drewry
Bitumen
Fuel Oil
Cycle Oils
Diesel/Gasoil
Kerosene
Gasolines
Clean Condensates
Naphthas
Dirty
Products
Clean
Products
Veg
Oils/Chemicals
Crude
Most products tankers can switch
between clean and dirty products
when the tanks are carefully cleaned.
Gasoil is a good clean up cargo when
switching from dirty to clean products.
More sophisticated product tankers
work at this end of the market, some
with the ability to carry products and
certain chemicals
Crude tankers carry only crude oil and
fuel oils
Non-oil substances now covered by
revised IBC Code. To carry chemicals,
an IMO Certificate of Fitness is
required.
Refined Products
11
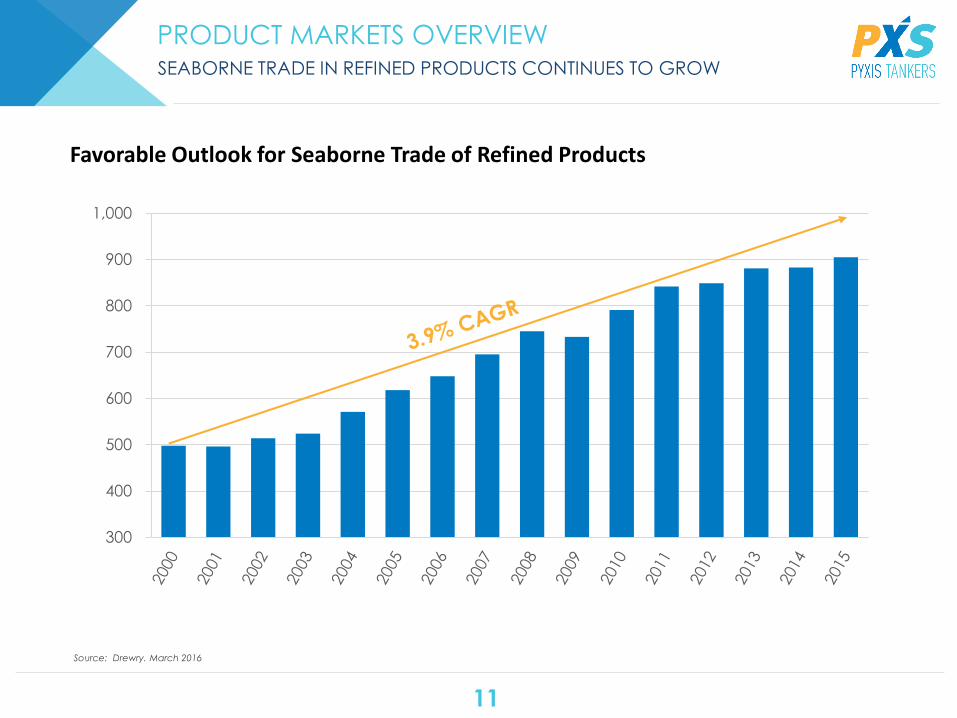
PRODUCT MARKETS OVERVIEWSEABORNE TRADE IN REFINED PRODUCTS CONTINUES TO GROW
Source: Drewry. March 2016
300
400
500
600
700
800
900
1,000
Favorable Outlook for Seaborne Trade of Refined Products
12
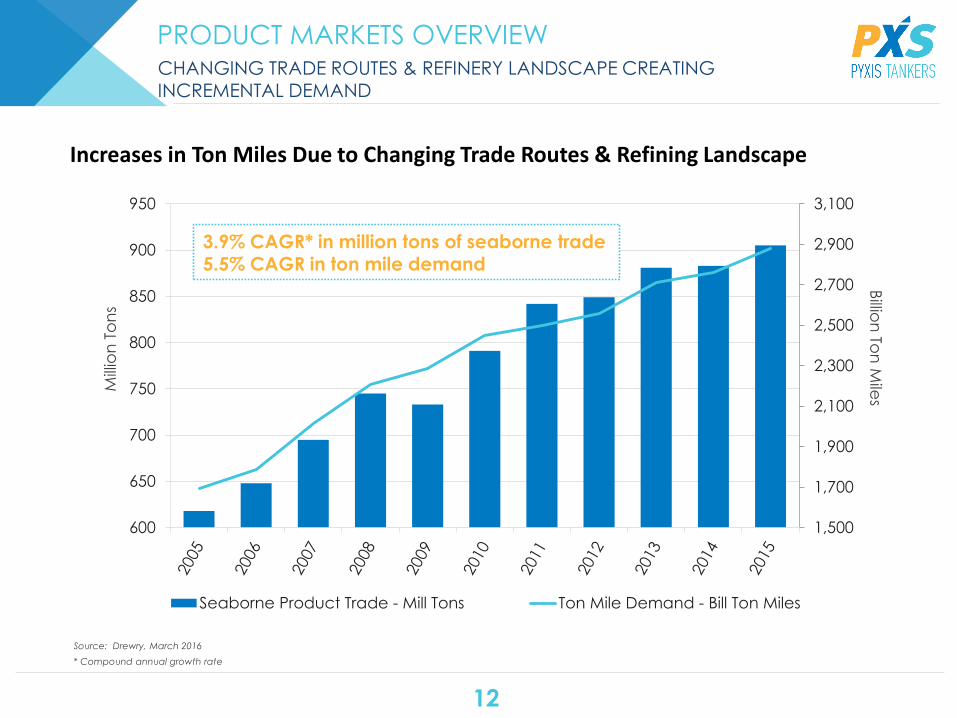
PRODUCT MARKETS OVERVIEWCHANGING TRADE ROUTES & REFINERY LANDSCAPE CREATING INCREMENTAL DEMAND
Source: Drewry, March 2016
* Compound annual growth rate
1,500
1,700
1,900
2,100
2,300
2,500
2,700
2,900
3,100
600
650
700
750
800
850
900
950
Seaborne Product Trade - Mill Tons Ton Mile Demand - Bill Ton Miles
Mill
ion
To
ns
Billio
n To
n M
iles
Increases in Ton Miles Due to Changing Trade Routes & Refining Landscape
3.9% CAGR* in million tons of seaborne trade5.5% CAGR in ton mile demand
13
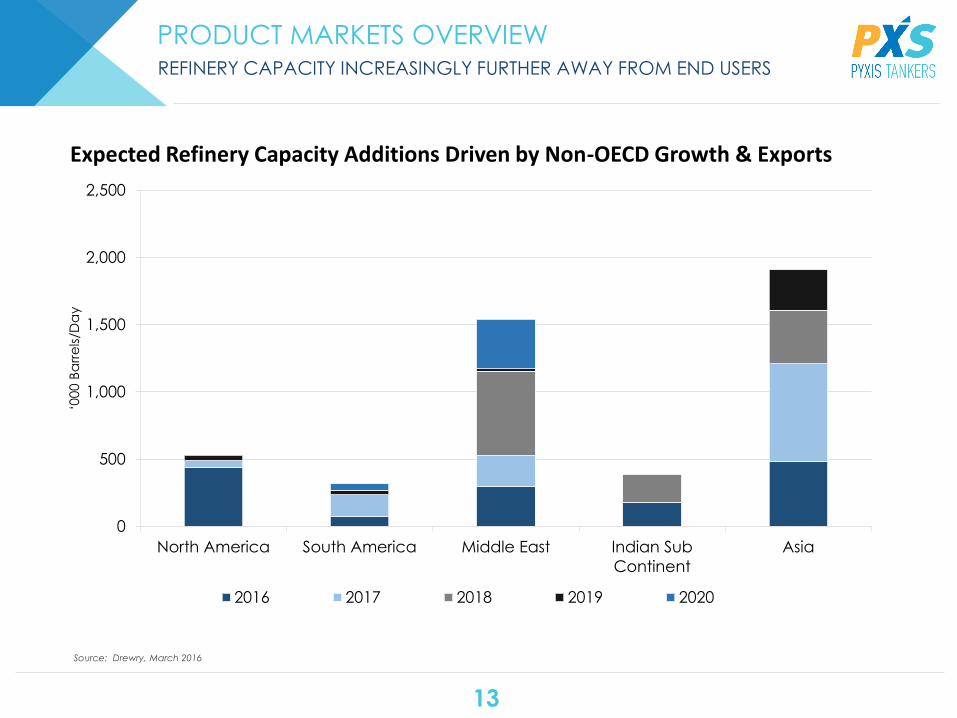
PRODUCT MARKETS OVERVIEWREFINERY CAPACITY INCREASINGLY FURTHER AWAY FROM END USERS
Source: Drewry, March 2016
0
500
1,000
1,500
2,000
2,500
North America South America Middle East Indian Sub
Continent
Asia
‘000 B
arr
els
/Da
y
2016 2017 2018 2019 2020
Expected Refinery Capacity Additions Driven by Non-OECD Growth & Exports
14
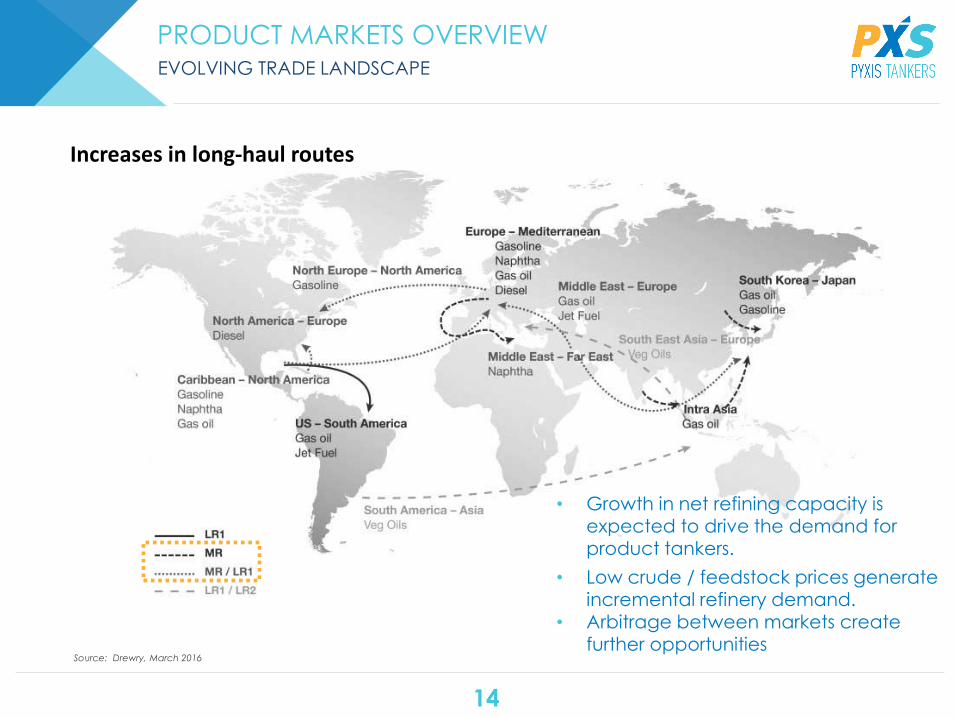
PRODUCT MARKETS OVERVIEWEVOLVING TRADE LANDSCAPE
Source: Drewry, March 2016
Increases in long-haul routes
• Growth in net refining capacity is expected to drive the demand for product tankers.
• Low crude / feedstock prices generate incremental refinery demand.
• Arbitrage between markets create further opportunities
15
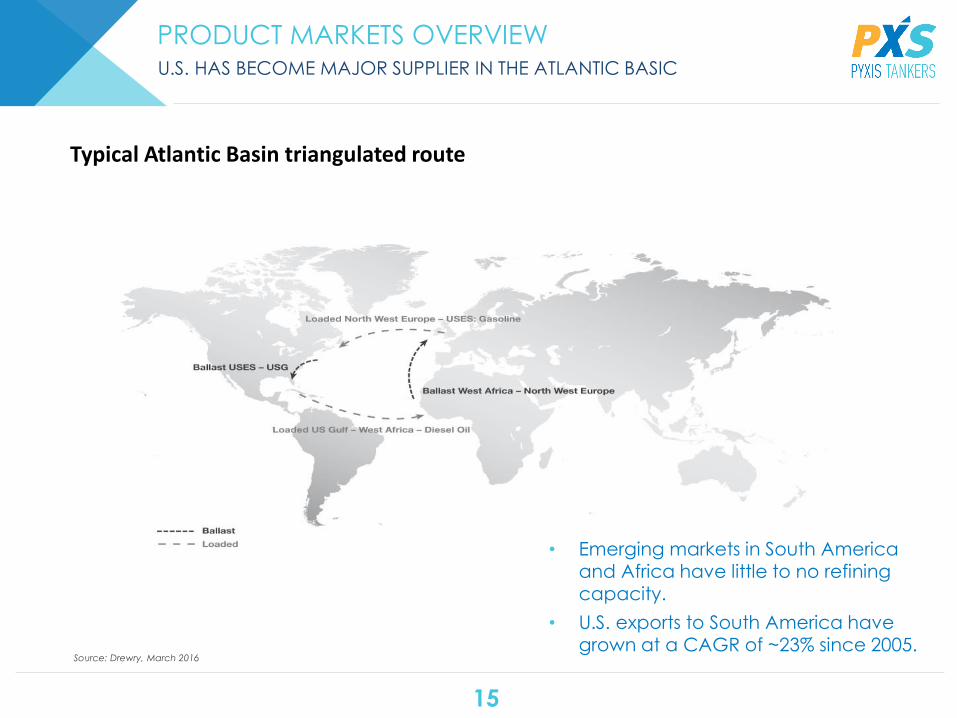
PRODUCT MARKETS OVERVIEWU.S. HAS BECOME MAJOR SUPPLIER IN THE ATLANTIC BASIC
Source: Drewry, March 2016
Typical Atlantic Basin triangulated route
• Emerging markets in South America and Africa have little to no refining capacity.
• U.S. exports to South America have grown at a CAGR of ~23% since 2005.
16
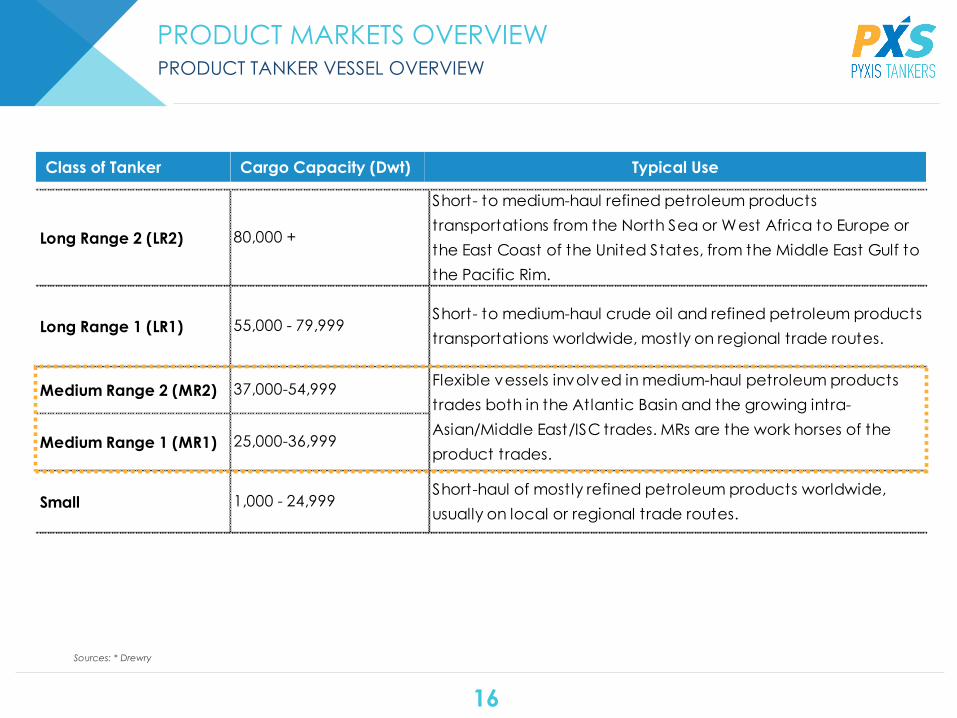
PRODUCT MARKETS OVERVIEWPRODUCT TANKER VESSEL OVERVIEW
Sources: * Drewry
Long Range 2 (LR2) 80,000 +
Short- to medium-haul refined petroleum products
transportations from the North Sea or West Africa to Europe or
the East Coast of the United States, from the Middle East Gulf to
the Pacific Rim.
Long Range 1 (LR1) 55,000 - 79,999Short- to medium-haul crude oil and refined petroleum products
transportations worldwide, mostly on regional trade routes.
Medium Range 2 (MR2) 37,000-54,999
Medium Range 1 (MR1) 25,000-36,999
Small 1,000 - 24,999Short-haul of mostly refined petroleum products worldwide,
usually on local or regional trade routes.
Flexible vessels involved in medium-haul petroleum products
trades both in the Atlantic Basin and the growing intra-
Asian/Middle East/ISC trades. MRs are the work horses of the
product trades.
Class of Tanker Cargo Capacity (Dwt) Typical Use
17
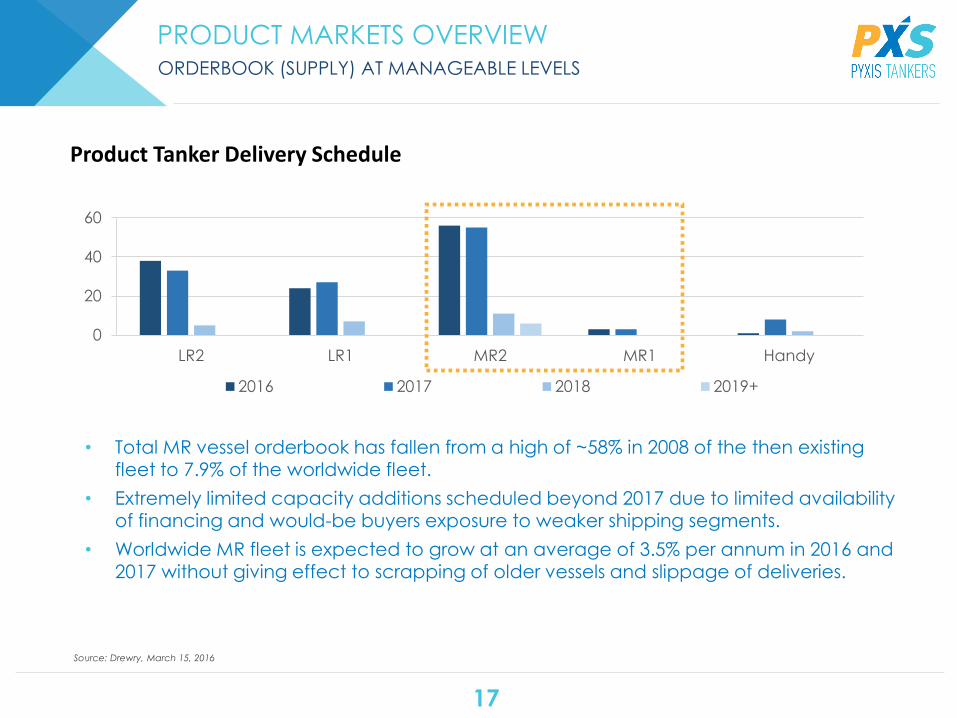
PRODUCT MARKETS OVERVIEWORDERBOOK (SUPPLY) AT MANAGEABLE LEVELS
Source: Drewry, March 15, 2016
0
20
40
60
LR2 LR1 MR2 MR1 Handy
2016 2017 2018 2019+
• Total MR vessel orderbook has fallen from a high of ~58% in 2008 of the then existing fleet to 7.9% of the worldwide fleet.
• Extremely limited capacity additions scheduled beyond 2017 due to limited availability of financing and would-be buyers exposure to weaker shipping segments.
• Worldwide MR fleet is expected to grow at an average of 3.5% per annum in 2016 and 2017 without giving effect to scrapping of older vessels and slippage of deliveries.
Product Tanker Delivery Schedule
18
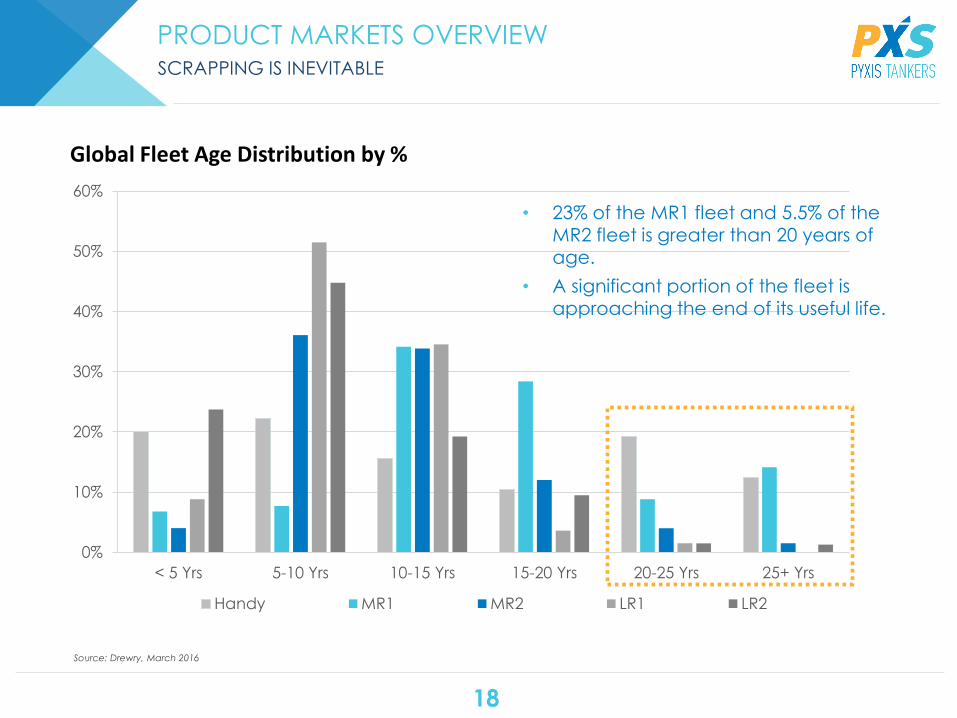
PRODUCT MARKETS OVERVIEWSCRAPPING IS INEVITABLE
Source: Drewry, March 2016
Global Fleet Age Distribution by %
0%
10%
20%
30%
40%
50%
60%
< 5 Yrs 5-10 Yrs 10-15 Yrs 15-20 Yrs 20-25 Yrs 25+ Yrs
Handy MR1 MR2 LR1 LR2
• 23% of the MR1 fleet and 5.5% of the MR2 fleet is greater than 20 years of age.
• A significant portion of the fleet is approaching the end of its useful life.
19
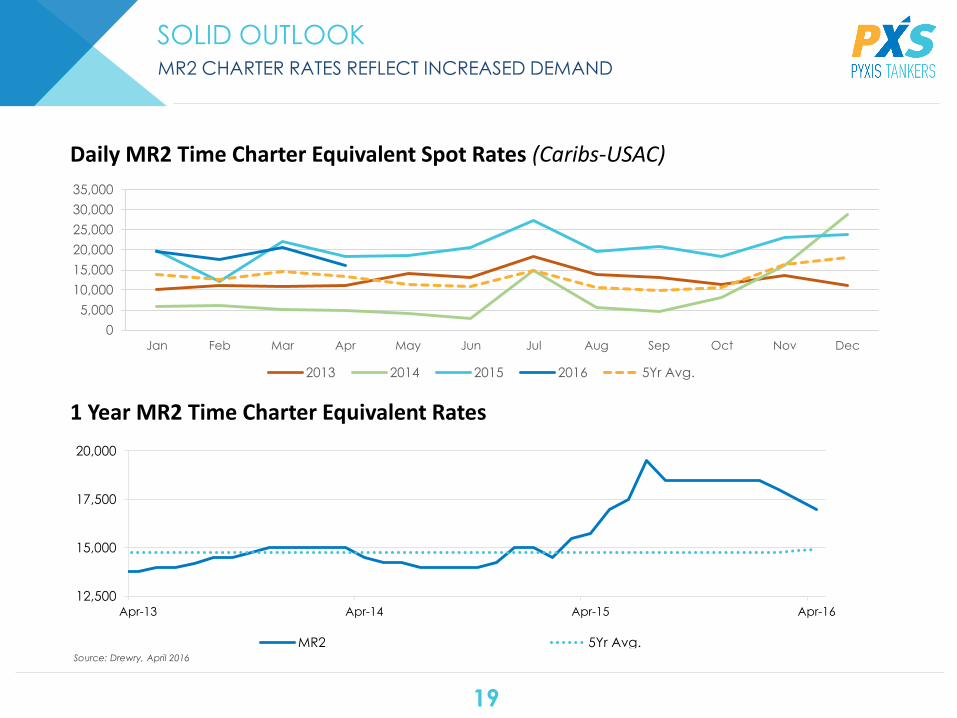
SOLID OUTLOOKMR2 CHARTER RATES REFLECT INCREASED DEMAND
0
5,000
10,000
15,000
20,000
25,000
30,000
35,000
Jan Feb Mar Apr May Jun Jul Aug Sep Oct Nov Dec
2013 2014 2015 2016 5Yr Avg.
Daily MR2 Time Charter Equivalent Spot Rates (Caribs-USAC)
1 Year MR2 Time Charter Equivalent Rates
12,500
15,000
17,500
20,000
Apr-13 Apr-14 Apr-15 Apr-16
MR2 5Yr Avg.Source: Drewry, April 2016
20
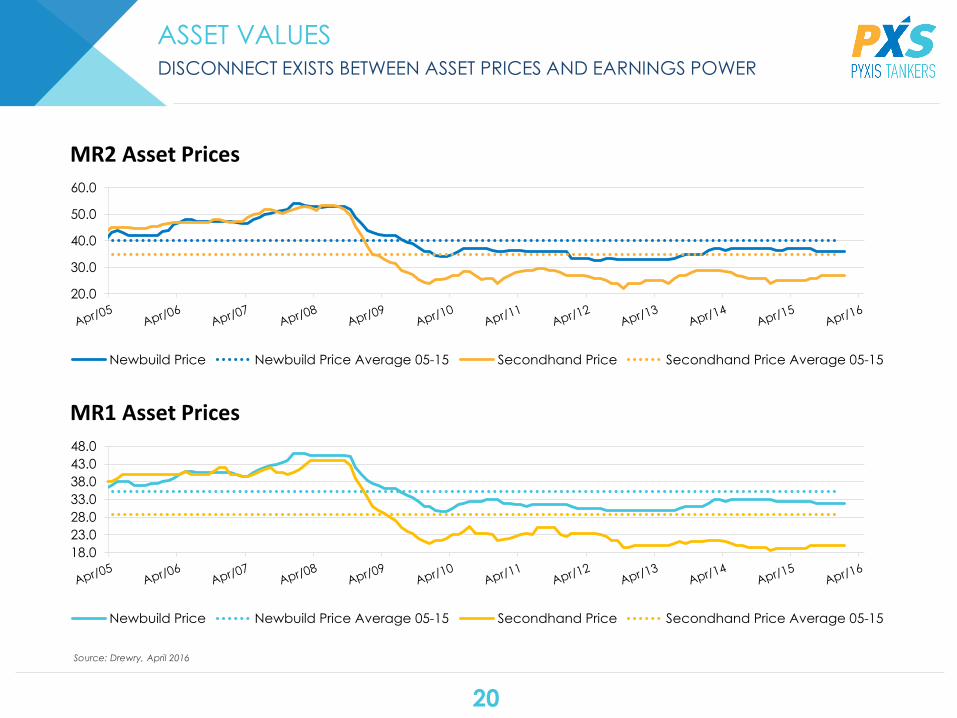
ASSET VALUESDISCONNECT EXISTS BETWEEN ASSET PRICES AND EARNINGS POWER
MR2 Asset Prices
MR1 Asset Prices
20.0
30.0
40.0
50.0
60.0
Newbuild Price Newbuild Price Average 05-15 Secondhand Price Secondhand Price Average 05-15
18.0
23.0
28.0
33.0
38.0
43.0
48.0
Newbuild Price Newbuild Price Average 05-15 Secondhand Price Secondhand Price Average 05-15
Source: Drewry, April 2016

PYXIS TANKERSFINANCIAL SUMMARY
22
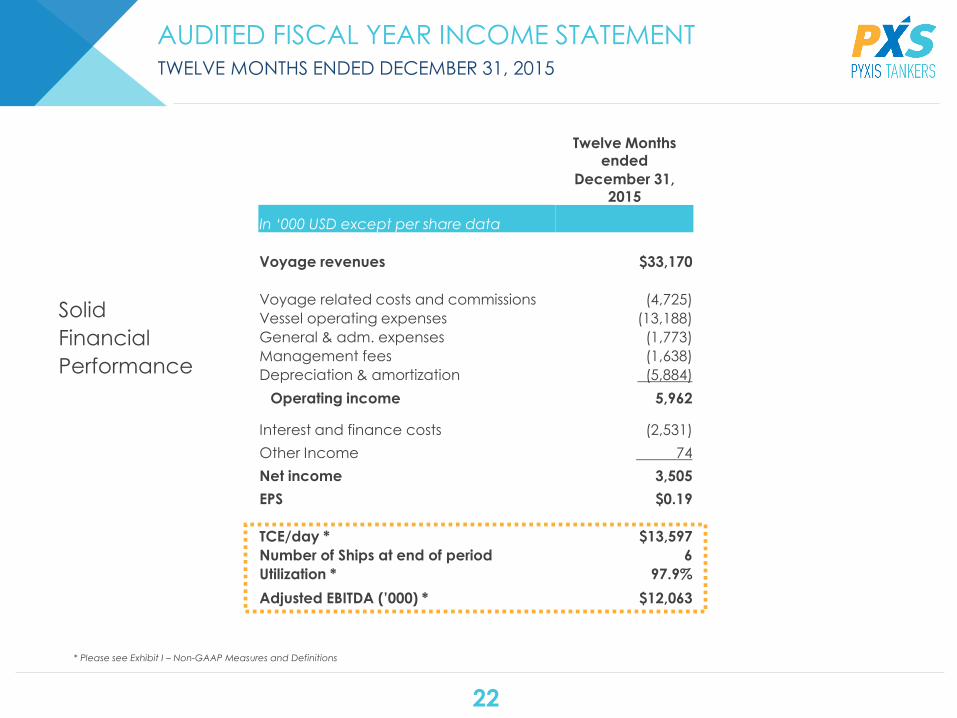
AUDITED FISCAL YEAR INCOME STATEMENTTWELVE MONTHS ENDED DECEMBER 31, 2015
Twelve Months ended
December 31, 2015
In ‘000 USD except per share data
Voyage revenues $33,170
Voyage related costs and commissions (4,725)
Vessel operating expenses (13,188)
General & adm. expenses (1,773)
Management fees (1,638)
Depreciation & amortization (5,884)
Operating income 5,962
Interest and finance costs (2,531)
Other Income 74
Net income 3,505
EPS $0.19
TCE/day * $13,597
Number of Ships at end of period 6
Utilization * 97.9%
Adjusted EBITDA (’000) * $12,063
* Please see Exhibit I – Non-GAAP Measures and Definitions
Solid
Financial
Performance
23
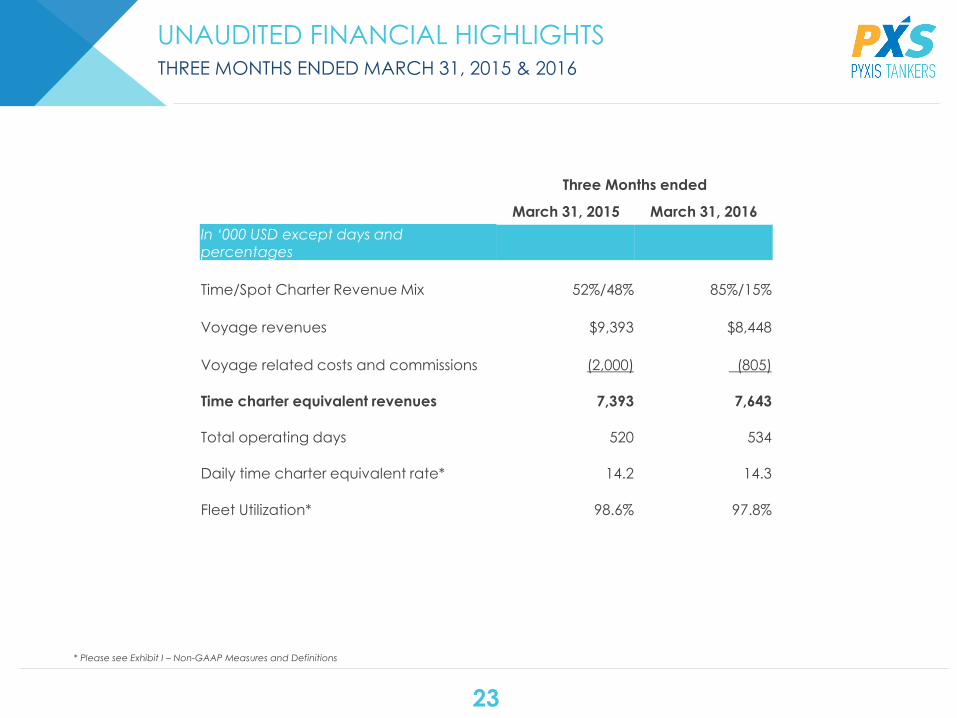
UNAUDITED FINANCIAL HIGHLIGHTSTHREE MONTHS ENDED MARCH 31, 2015 & 2016
Three Months ended
March 31, 2015 March 31, 2016
In ‘000 USD except days and percentages
Time/Spot Charter Revenue Mix 52%/48% 85%/15%
Voyage revenues $9,393 $8,448
Voyage related costs and commissions (2,000) (805)
Time charter equivalent revenues 7,393 7,643
Total operating days 520 534
Daily time charter equivalent rate* 14.2 14.3
Fleet Utilization* 98.6% 97.8%
* Please see Exhibit I – Non-GAAP Measures and Definitions
24
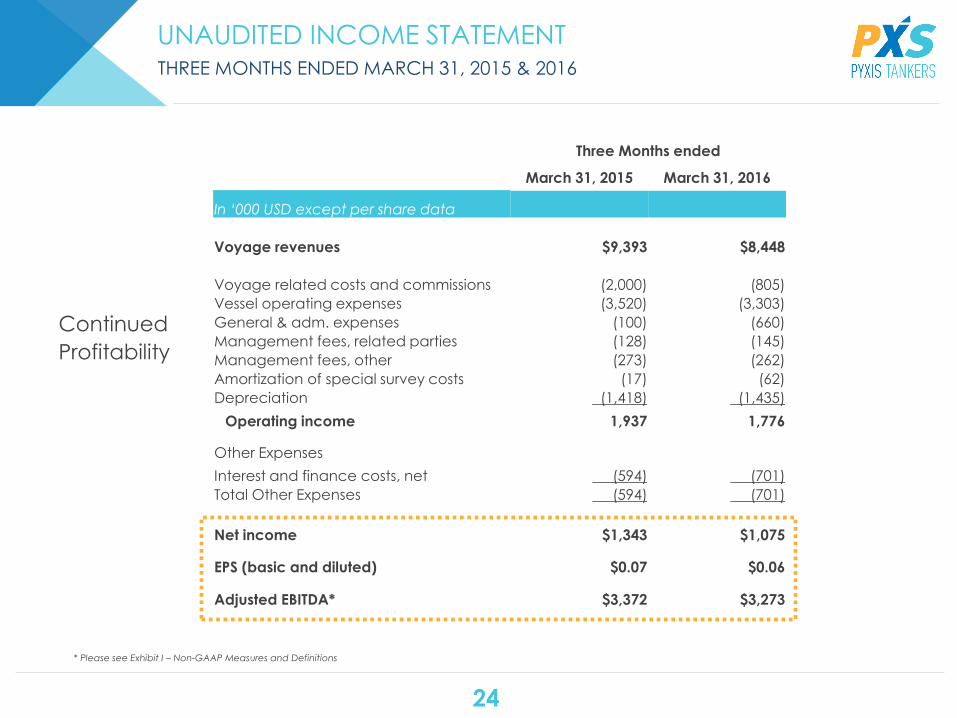
UNAUDITED INCOME STATEMENTTHREE MONTHS ENDED MARCH 31, 2015 & 2016
* Please see Exhibit I – Non-GAAP Measures and Definitions
Continued
Profitability
Three Months ended
March 31, 2015 March 31, 2016
In ‘000 USD except per share data
Voyage revenues $9,393 $8,448
Voyage related costs and commissions (2,000) (805)
Vessel operating expenses (3,520) (3,303)
General & adm. expenses (100) (660)
Management fees, related parties (128) (145)
Management fees, other (273) (262)
Amortization of special survey costs (17) (62)
Depreciation (1,418) (1,435)
Operating income 1,937 1,776
Other Expenses
Interest and finance costs, net (594) (701)
Total Other Expenses (594) (701)
Net income $1,343 $1,075
EPS (basic and diluted) $0.07 $0.06
Adjusted EBITDA* $3,372 $3,273
25
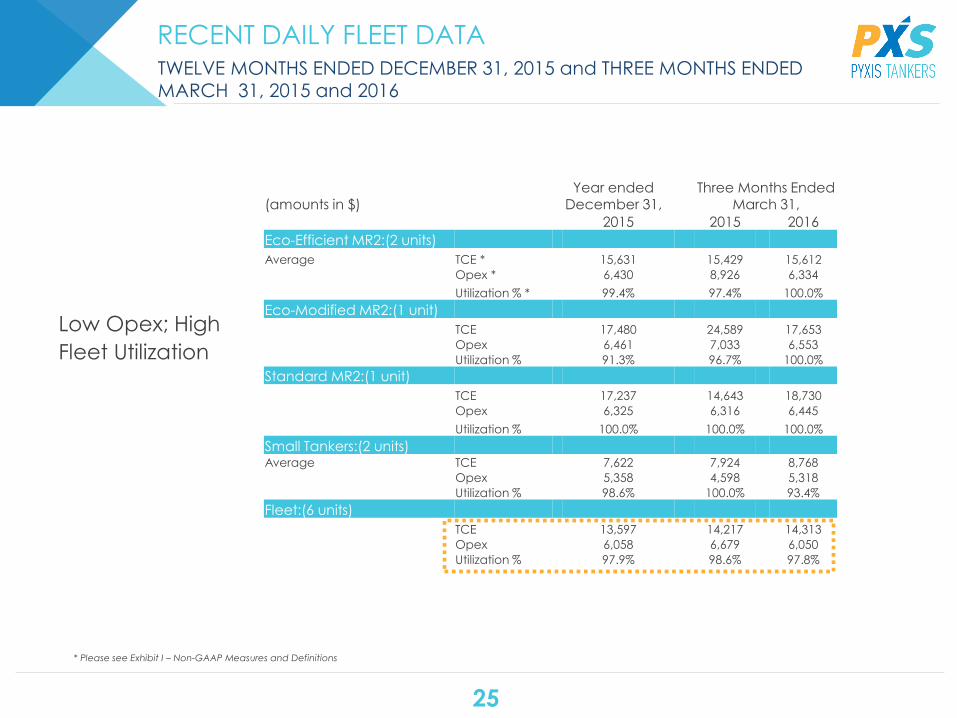
RECENT DAILY FLEET DATATWELVE MONTHS ENDED DECEMBER 31, 2015 and THREE MONTHS ENDEDMARCH 31, 2015 and 2016
Low Opex; High
Fleet Utilization
(amounts in $)Year ended
December 31,Three Months Ended
March 31,
2015 2015 2016
Eco-Efficient MR2:(2 units)
Average TCE * 15,631 15,429 15,612
Opex * 6,430 8,926 6,334
Utilization % * 99.4% 97.4% 100.0%
Eco-Modified MR2:(1 unit)
TCE 17,480 24,589 17,653
Opex 6,461 7,033 6,553
Utilization % 91.3% 96.7% 100.0%
Standard MR2:(1 unit)
TCE 17,237 14,643 18,730
Opex 6,325 6,316 6,445
Utilization % 100.0% 100.0% 100.0%
Small Tankers:(2 units)Average TCE 7,622 7,924 8,768
Opex 5,358 4,598 5,318
Utilization % 98.6% 100.0% 93.4%
Fleet:(6 units)
TCE 13,597 14,217 14,313
Opex 6,058 6,679 6,050
Utilization % 97.9% 98.6% 97.8%
* Please see Exhibit I – Non-GAAP Measures and Definitions
26
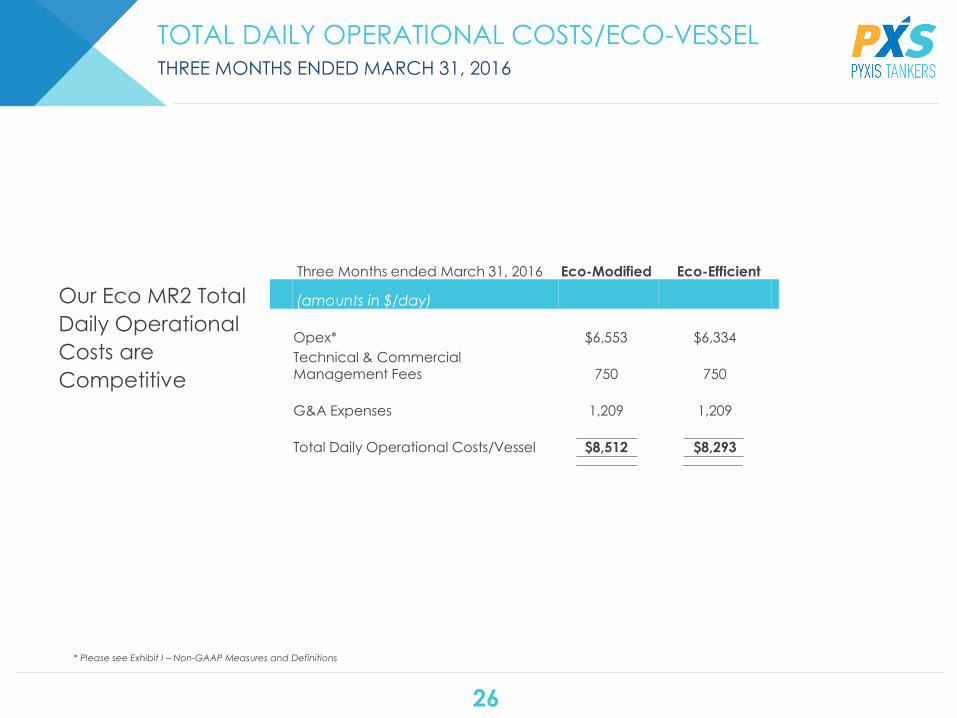
TOTAL DAILY OPERATIONAL COSTS/ECO-VESSELTHREE MONTHS ENDED MARCH 31, 2016
Our Eco MR2 Total
Daily Operational
Costs are
Competitive
Three Months ended March 31, 2016 Eco-Modified Eco-Efficient
(amounts in $/day)
Opex* $6,553 $6,334
Technical & Commercial Management Fees 750 750
G&A Expenses 1,209 1,209
Total Daily Operational Costs/Vessel $8,512 $8,293
* Please see Exhibit I – Non-GAAP Measures and Definitions
27
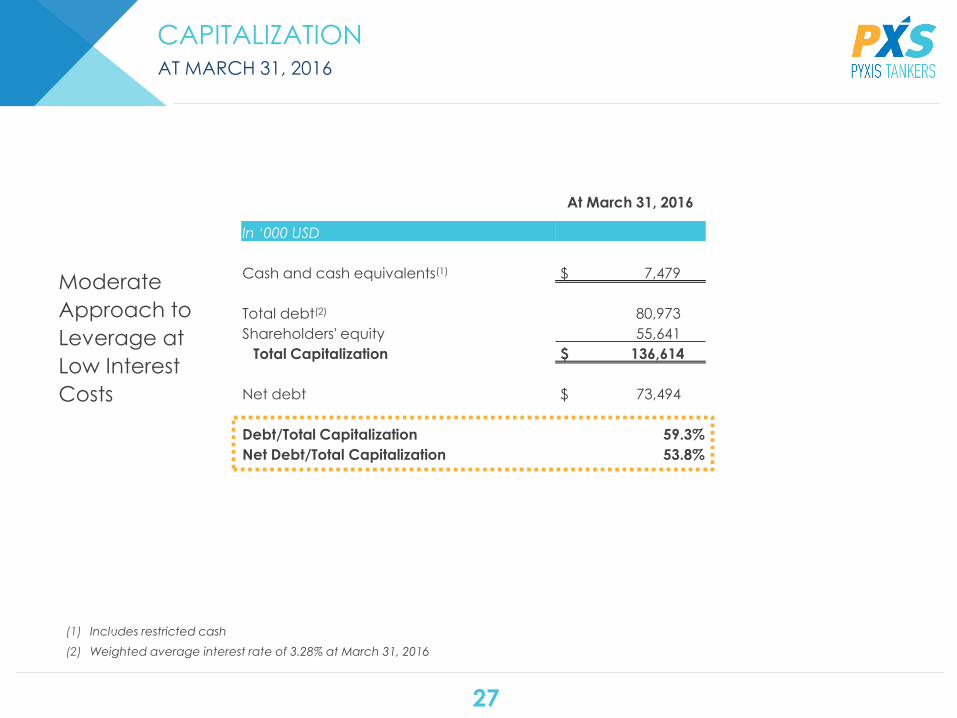
CAPITALIZATIONAT MARCH 31, 2016
At March 31, 2016
In ‘000 USD
Cash and cash equivalents(1) $ 7,479
Total debt(2) 80,973
Shareholders' equity 55,641
Total Capitalization $ 136,614
Net debt $ 73,494
Debt/Total Capitalization 59.3%
Net Debt/Total Capitalization 53.8%
(1) Includes restricted cash
(2) Weighted average interest rate of 3.28% at March 31, 2016
Moderate
Approach to
Leverage at
Low Interest
Costs
28
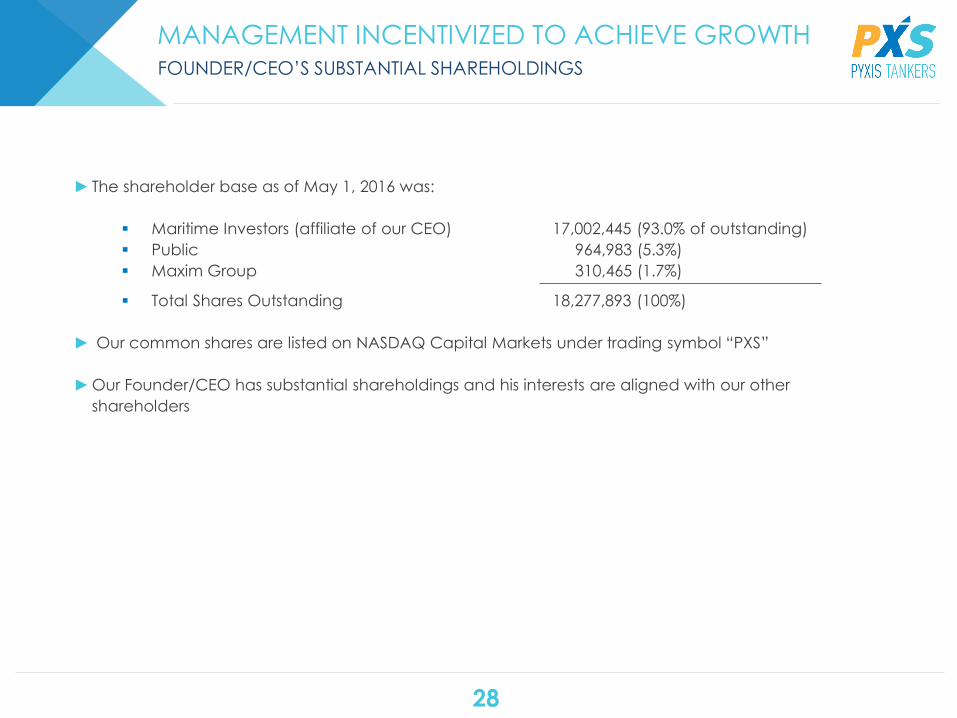
MANAGEMENT INCENTIVIZED TO ACHIEVE GROWTHFOUNDER/CEO’S SUBSTANTIAL SHAREHOLDINGS
► The shareholder base as of May 1, 2016 was:
Maritime Investors (affiliate of our CEO) 17,002,445 (93.0% of outstanding)
Public 964,983 (5.3%)
Maxim Group 310,465 (1.7%)
Total Shares Outstanding 18,277,893 (100%)
► Our common shares are listed on NASDAQ Capital Markets under trading symbol “PXS”
►Our Founder/CEO has substantial shareholdings and his interests are aligned with our other
shareholders
29
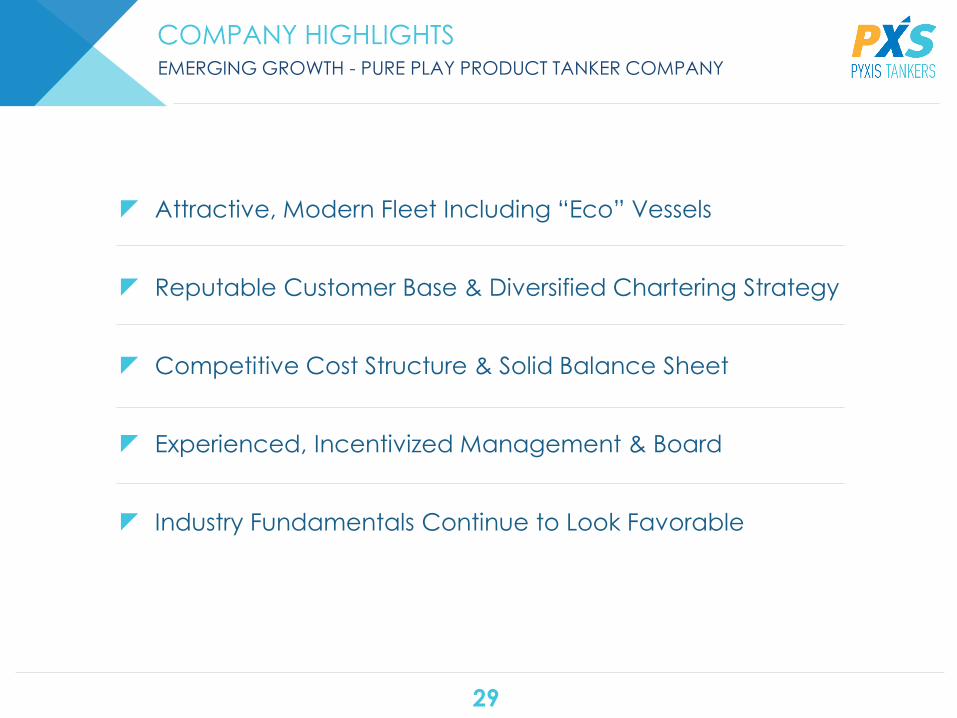
COMPANY HIGHLIGHTSEMERGING GROWTH - PURE PLAY PRODUCT TANKER COMPANY
Competitive Cost Structure & Solid Balance Sheet
Experienced, Incentivized Management & Board
Attractive, Modern Fleet Including “Eco” Vessels
Reputable Customer Base & Diversified Chartering Strategy
Industry Fundamentals Continue to Look Favorable
30
CONTACT
Pyxis Tankers Inc.
K.Karamanli 59
Maroussi 15125, Greece
Email: [email protected]
www.pyxistankers.com
Henry Williams
CFO & Treasurer
Phone: +1 516 455 0106/ +30 210 638 0200
Email: [email protected]
Antonios “Tony” Backos
SVP for Corporate Development, General Counsel and Secretary
Phone: +30 210 638 0180
Email: [email protected]
31
EXHIBIT I | NON-GAAP MEASURES AND DEFINITIONS
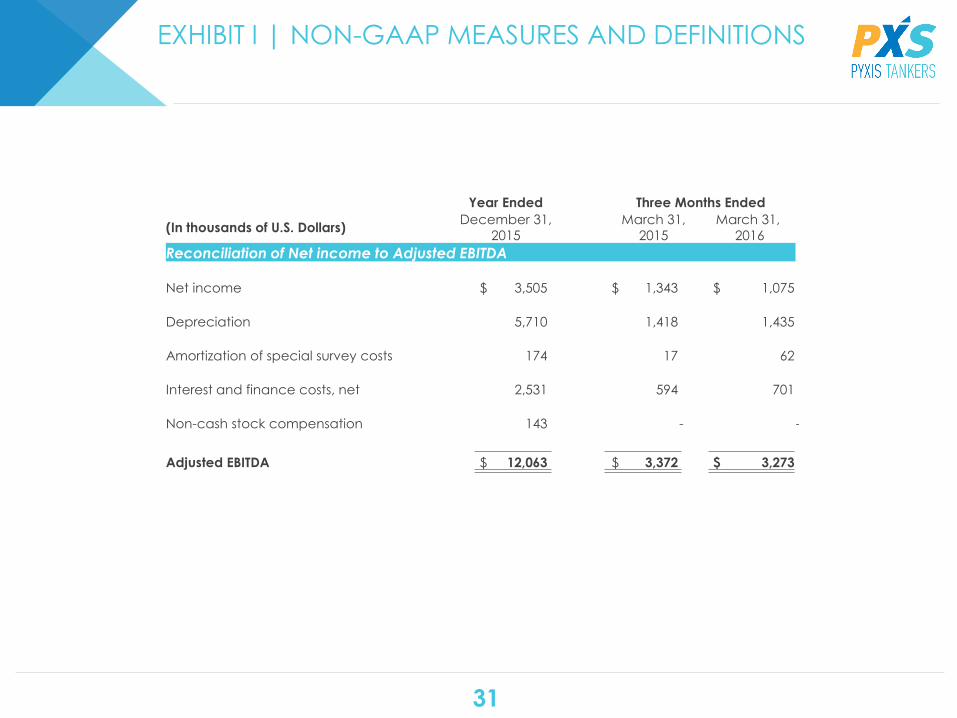
Year Ended Three Months Ended
(In thousands of U.S. Dollars)December 31,
2015
March 31,
2015
March 31,
2016
Reconciliation of Net income to Adjusted EBITDA
Net income $ 3,505 $ 1,343 $ 1,075
Depreciation 5,710 1,418 1,435
Amortization of special survey costs 174 17 62
Interest and finance costs, net 2,531 594 701
Non-cash stock compensation 143 - -
Adjusted EBITDA $ 12,063 $ 3,372 $ 3,273
32
EXHIBIT I | NON-GAAP MEASURES AND DEFINITIONS
Adjusted EBITDA, which is not a recognized measurement under U.S. GAAP, is reconciled above to its nearest GAAP
equivalent. Adjusted EBITDA represents net income before interest, income tax expense, depreciation, amortization, and , if
any, vessel impairment charge and non-cash stock compensation. Adjusted EBITDA is presented as we believe that it
provides investors with a means of evaluating and understanding how our management evaluates operating performance.
This non-GAAP measure should not be considered in isolation from, as substitutes for, or superior to financial measures
prepared in accordance with U.S.GAAP. In addition, this non-GAAP measure does not have a standardized meaning, and is
therefore, unlikely to be comparable to similar measures presented by other companies.
Daily time charter equivalent (“TCE”) is a standard shipping industry performance measure of the average daily revenue
performance of a vessel on a per voyage basis. TCE is not calculated in accordance with U.S. GAAP. We utilize TCE because
we believe it is a meaningful measure to compare period-to-period changes in our performance despite changes in the mix
of charter types (i.e., spot charters, time charters and bareboat charters) under which our vessels may be employed between
the periods. Our management also utilizes TCE to assist them in making decisions regarding employment of the vessels. We
believe that our method of calculating TCE is consistent with industry standards and is determined by dividing voyage
revenues after deducting voyage expenses, including commissions by operating days for the relevant period. Voyage
expenses primarily consist of brokerage commissions, port, canal and fuel costs that are unique to a particular voyage, which
would otherwise be paid by the charterer under a time charter contract.
Vessel operating expenses per day (“Opex”) are our vessel operating expenses for a vessel, which consist primarily of crew
wages and related costs, insurance, lube oils, communications, spares and consumables, tonnage taxes as well as repairs
and maintenance, divided by the days in the applicable period.
We calculate fleet utilization by dividing the number of operating days during a period by the number of available days
during the same period. The shipping industry uses fleet utilization to measure a company’s efficiency in finding suitable
employment for its vessels and minimizing the amount of days that its vessels are off-hire for reasons other than scheduled
repairs or repairs under guarantee, vessel upgrades, special surveys and intermediate dry-dockings or vessel positioning.
Operating days are the number of available days in a period, less the aggregate number of days that our vessels were off-
hire or out of service due to any reason, including technical breakdowns and unforeseen circumstances. Available days are
the number of ownership days in a period, less the aggregate number of days that our vessels were off-hire due to scheduled
repairs or repairs under guarantee, vessel upgrades or special surveys and intermediate dry-dockings and the aggregate
number of days that we spent positioning our vessels during the respective period for such repairs, upgrades and surveys.
Ownership days are the total number of days in a period during which we owned each of the vessels in our fleet.
Continued