Puraflo Peat Fiber Biofilter with Pad Dispersal ... Peat Fiber Biofilter with Pad...
49
Puraflo Peat Fiber Biofilter with Pad Dispersal -Chesapeake Bay Panel -April 27, 2016 ©2016 Anua
Transcript of Puraflo Peat Fiber Biofilter with Pad Dispersal ... Peat Fiber Biofilter with Pad...

Puraflo Peat Fiber Biofilter
with Pad Dispersal
-Chesapeake Bay Panel
-April 27, 2016
©2016 Anua
Who we are…
• Anuasolutions provider
• Clean Water
• On-site
• Decentralized
• Community
• Commercial
• Water reuse
• Capture, treat & use
• Clean Air
• Odor control
What is Peat?
• Partially decomposed organic matter
• Mainly of plant origin
• Remains of roots, stems, leaves, flowers, fruits & seeds
• Accumulates over time
• Anaerobic conditions
• Decomposition is very slow

What is Peat?
Bog Cotton
(Peat Fiber)

Puraflo System Components
Overview
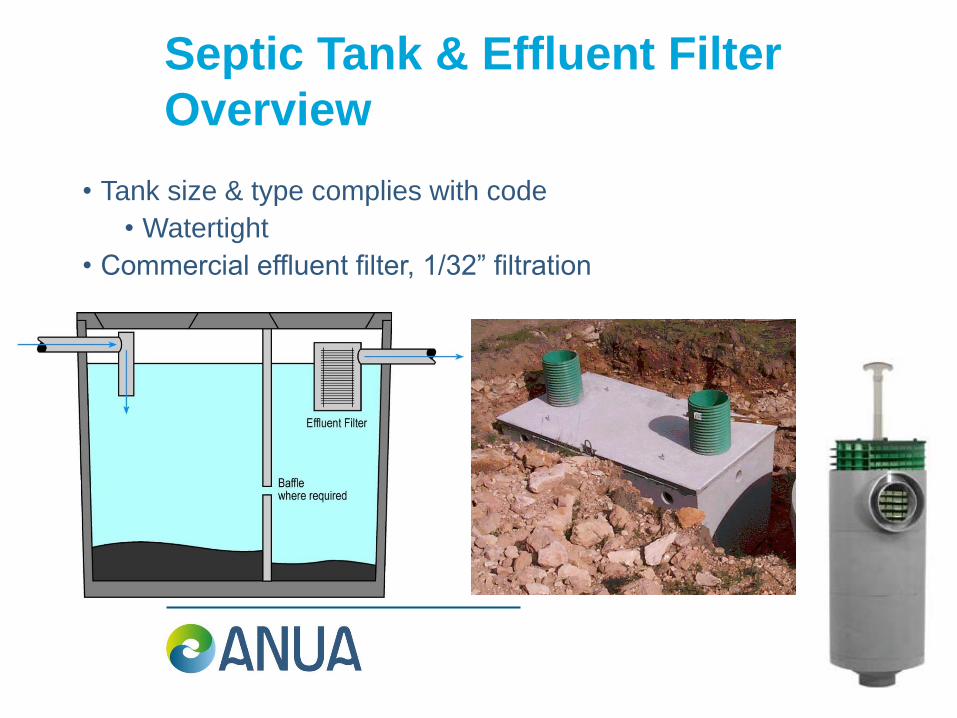
Septic Tank & Effluent Filter
Overview
• Tank size & type complies with code
• Watertight
• Commercial effluent filter, 1/32” filtration
Pump Tank Overview
• Tank size & type complies with code
• Watertight
• Effluent pump
• Timed dosing 12X per day
• Dosing rate
• 7 to 12 gpm per module
• Dose volume
• 5 to 15 gal/dose per module
• No override
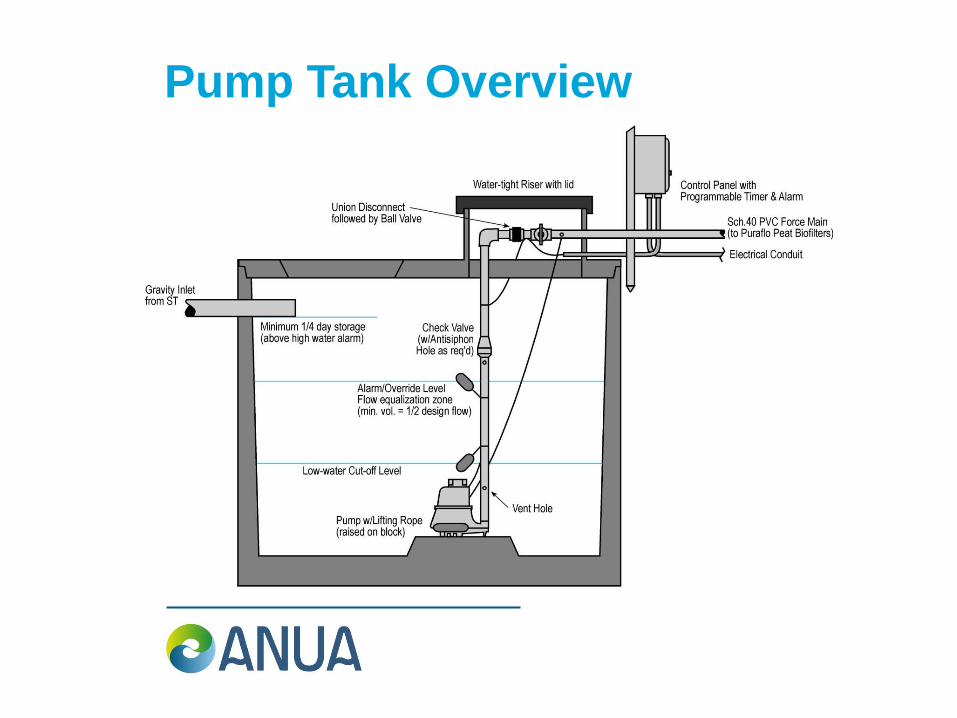
Pump Tank Overview
Puraflo Overview, cont’d
Peat Fiber Overview
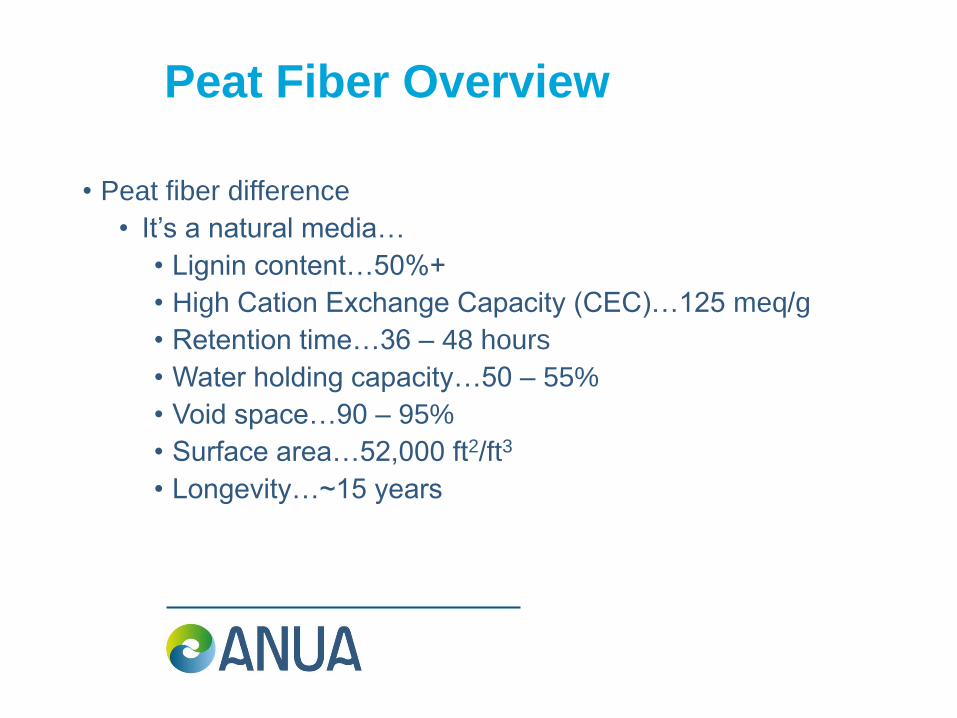
• Peat fiber difference
• It’s a natural media…
• Lignin content…50%+
• High Cation Exchange Capacity (CEC)…125 meq/g
• Retention time…36 – 48 hours
• Water holding capacity…50 – 55%
• Void space…90 – 95%
• Surface area…52,000 ft2/ft3
• Longevity…~15 years
Puraflo Treatment Overview
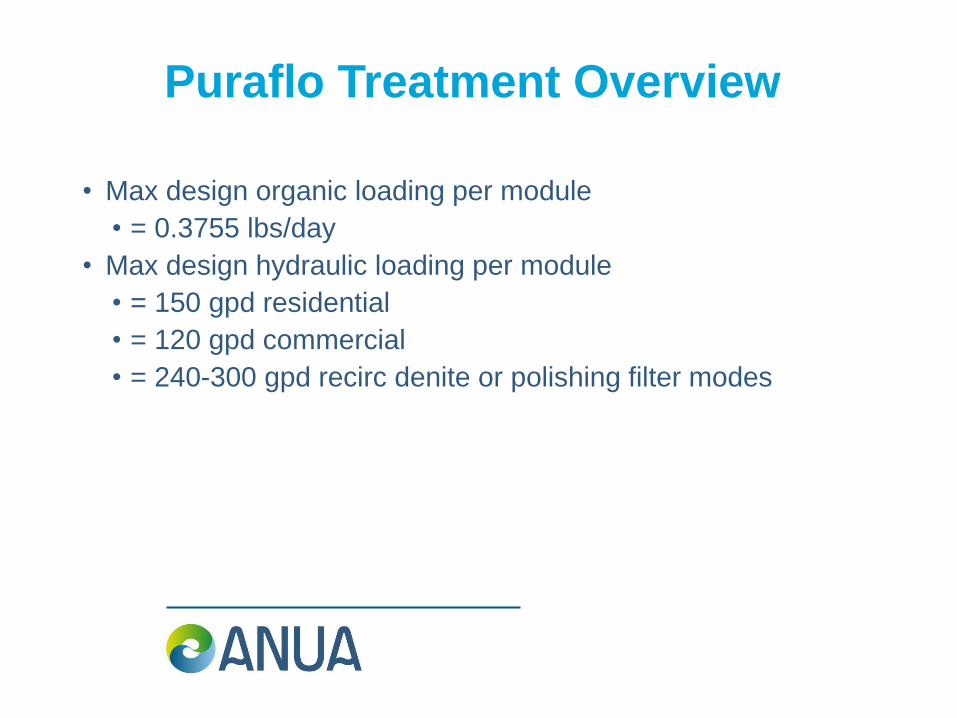
• Max design organic loading per module
• = 0.3755 lbs/day
• Max design hydraulic loading per module
• = 150 gpd residential
• = 120 gpd commercial
• = 240-300 gpd recirc denite or polishing filter modes
Puraflo Treatment Overview
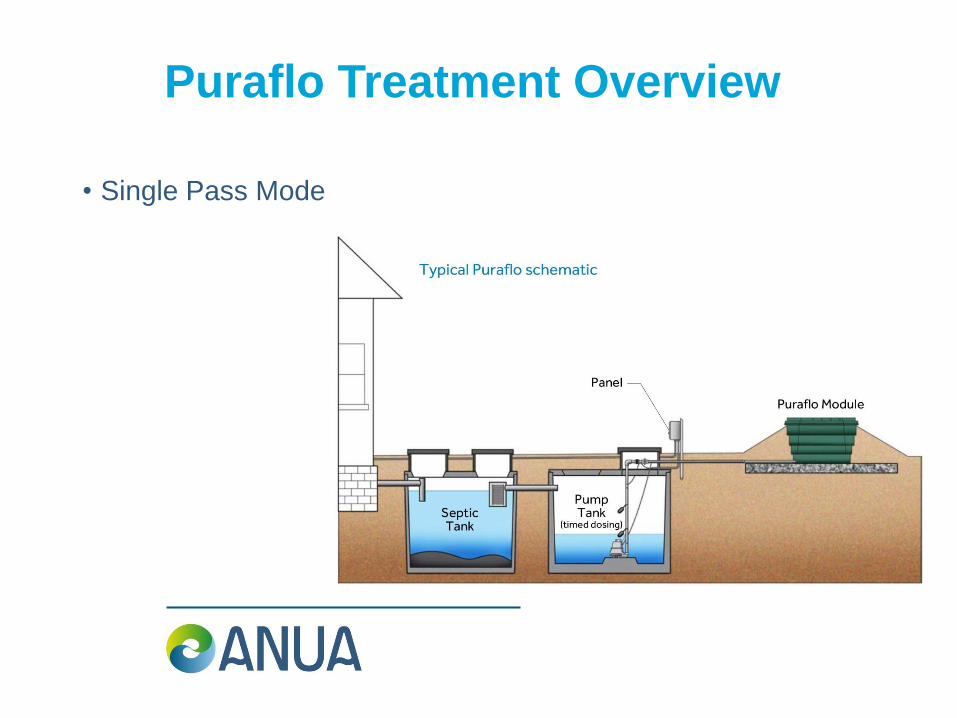
• Single Pass Mode

Puraflo Treatment Overview
• Peat fiber treatment mechanismsPassive process
• Physical - filtration & absorption
• Chemical - adsorption & ion exchange
• Biological - microbial assimilation
• Bulk of treatmentachieved by complex & diverse microfauna
• Higher life forms
Puraflo Treatment Overview
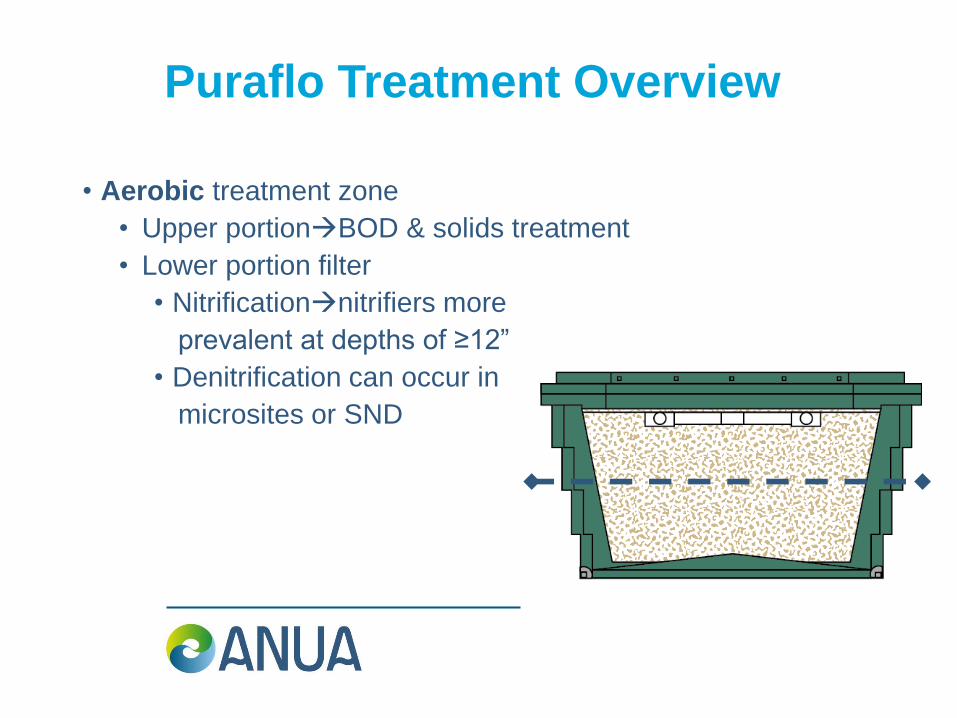
• Aerobic treatment zone
• Upper portionBOD & solids treatment
• Lower portion filter
• Nitrificationnitrifiers more
prevalent at depths of ≥12”
• Denitrification can occur in
microsites or SND
Puraflo Treatment Overview
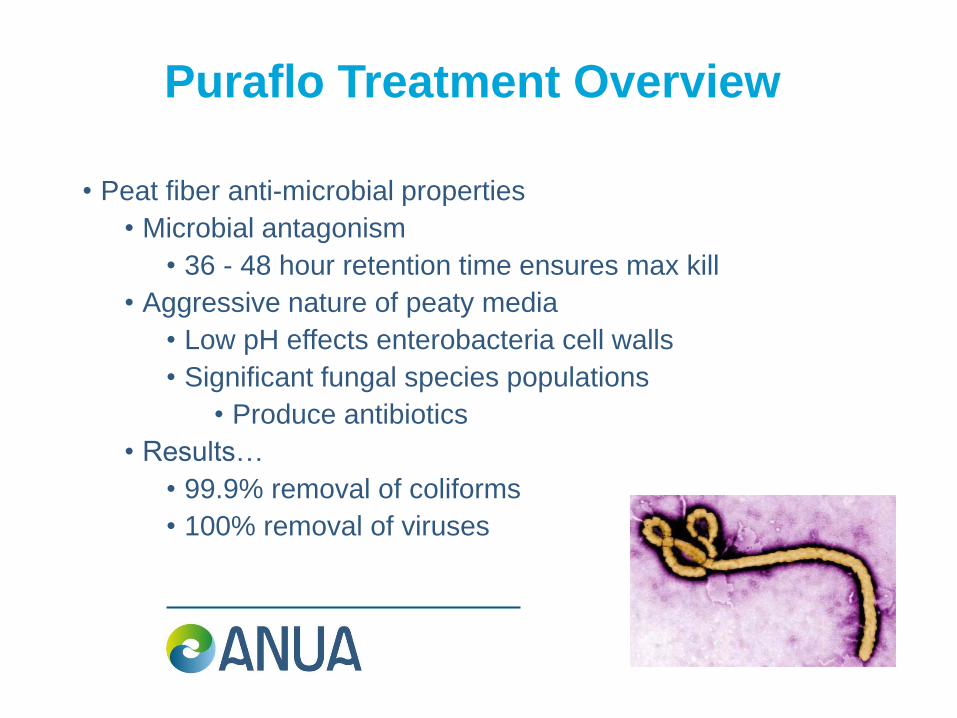
• Peat fiber anti-microbial properties
• Microbial antagonism
• 36 - 48 hour retention time ensures max kill
• Aggressive nature of peaty media
• Low pH effects enterobacteria cell walls
• Significant fungal species populations
• Produce antibiotics
• Results…
• 99.9% removal of coliforms
• 100% removal of viruses
Peat vs. Sand Treatment
• NERCC (Duluth, MN) virus inactivation study
• In-ground peat filter vs. in-ground sand filter
• Filters spiked with MS2 virus
• Removal by peat
• 99.99999% summer, 99.99998% winter
• Time to 90% inactivation
• <1 day
• Removal by sand
• 99.8% summer, 98.7% winter
• Time to 90% inactivation
• 23 days summer, 38 days winter
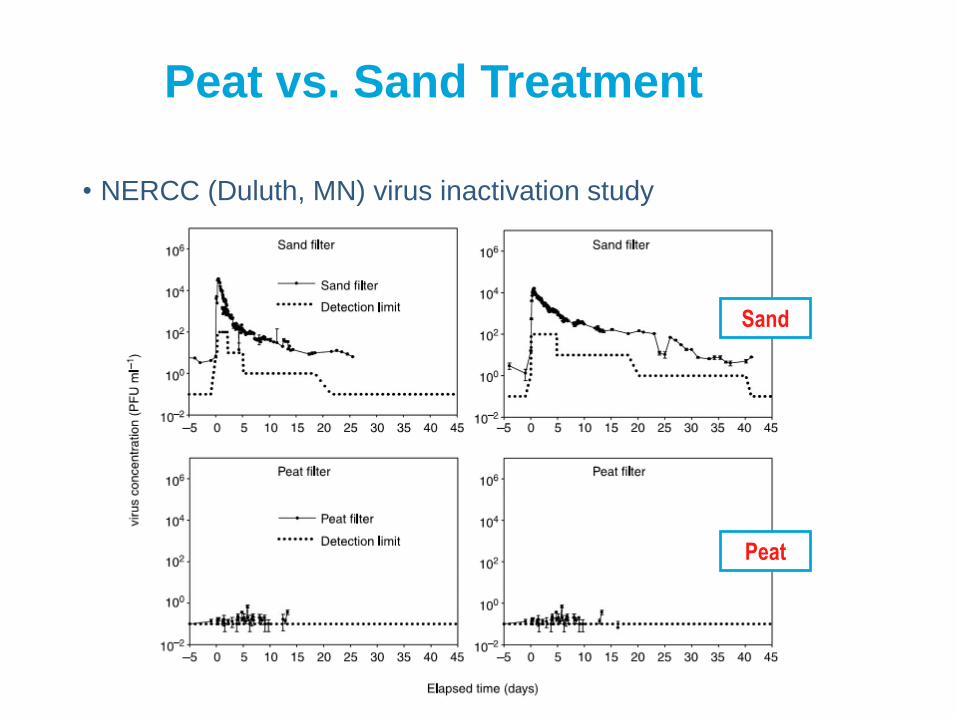
Peat vs. Sand Treatment
• NERCC (Duluth, MN) virus inactivation study
Sand
Peat

Puraflo Treatment Overview

Why is Treatment Reliability
Important?
Soil and drainfield “circuit breaker”
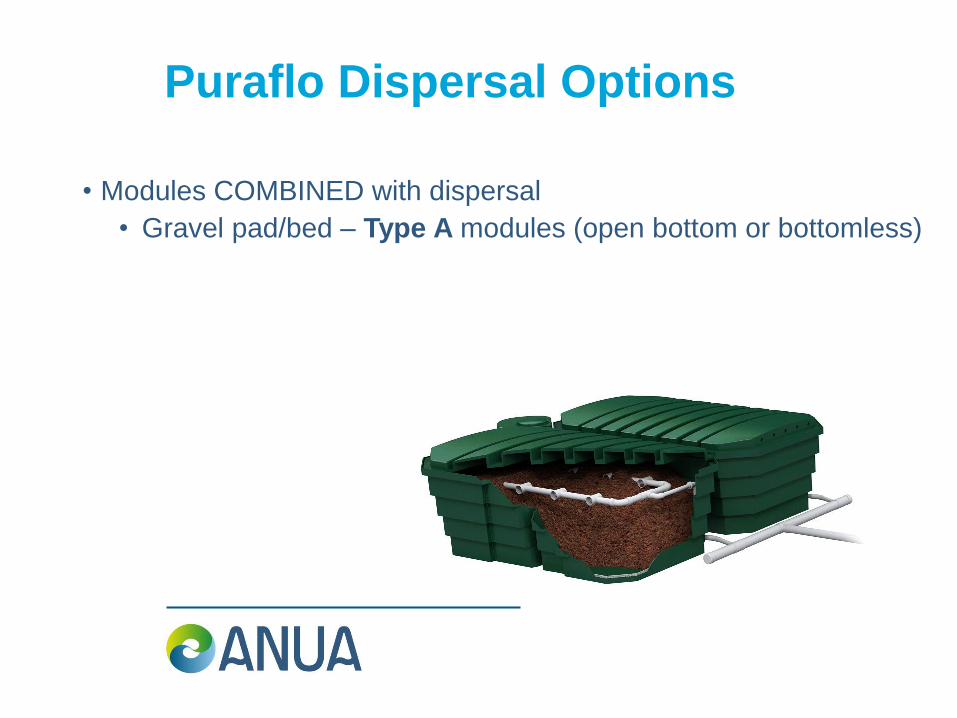
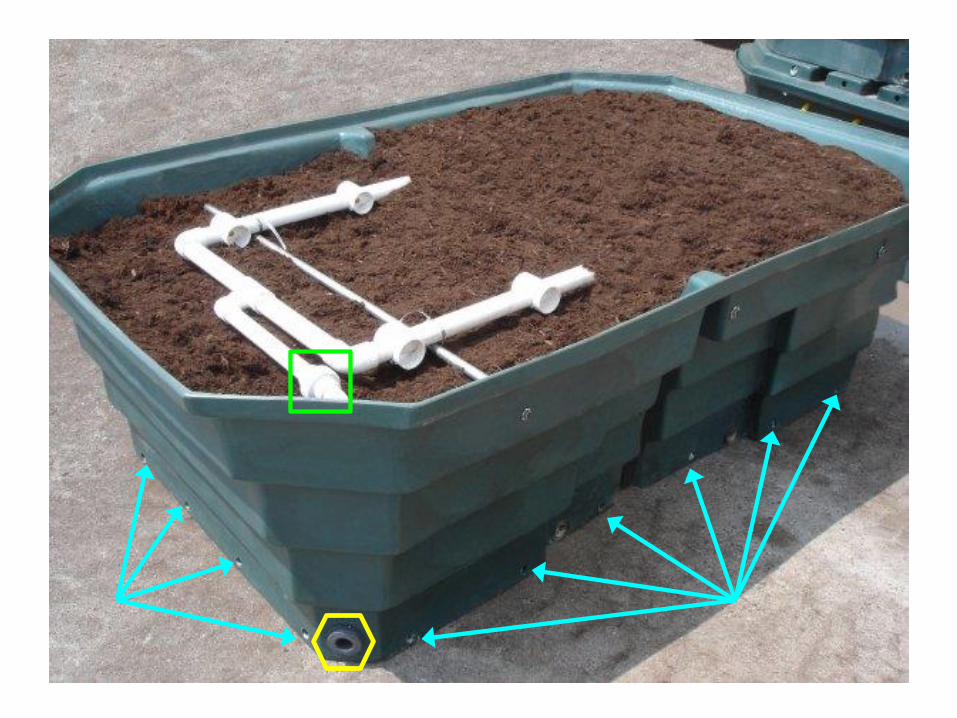
Puraflo Dispersal Options
• Modules COMBINED with dispersal
• Gravel pad/bed – Type A modules (open bottom or bottomless)
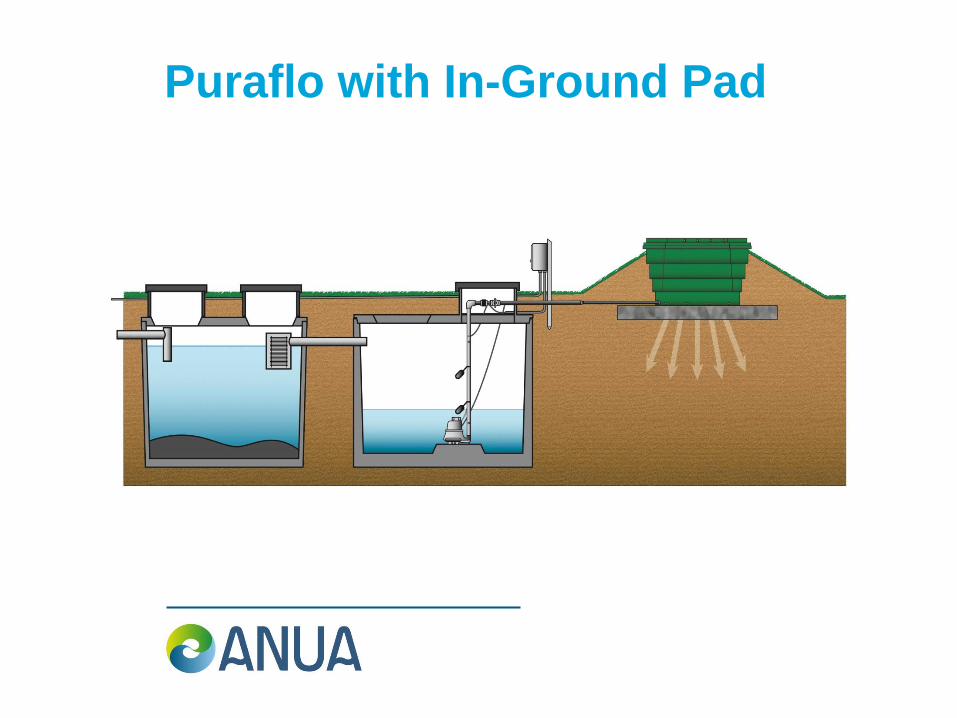
Puraflo with In-Ground Pad
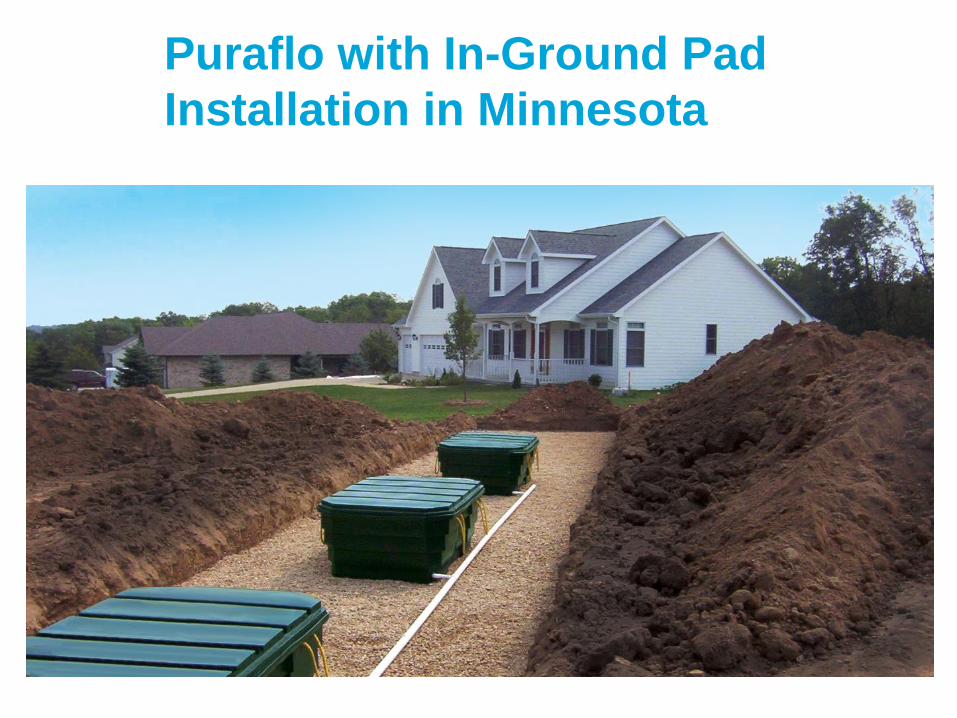
Puraflo with In-Ground Pad
Installation in Minnesota
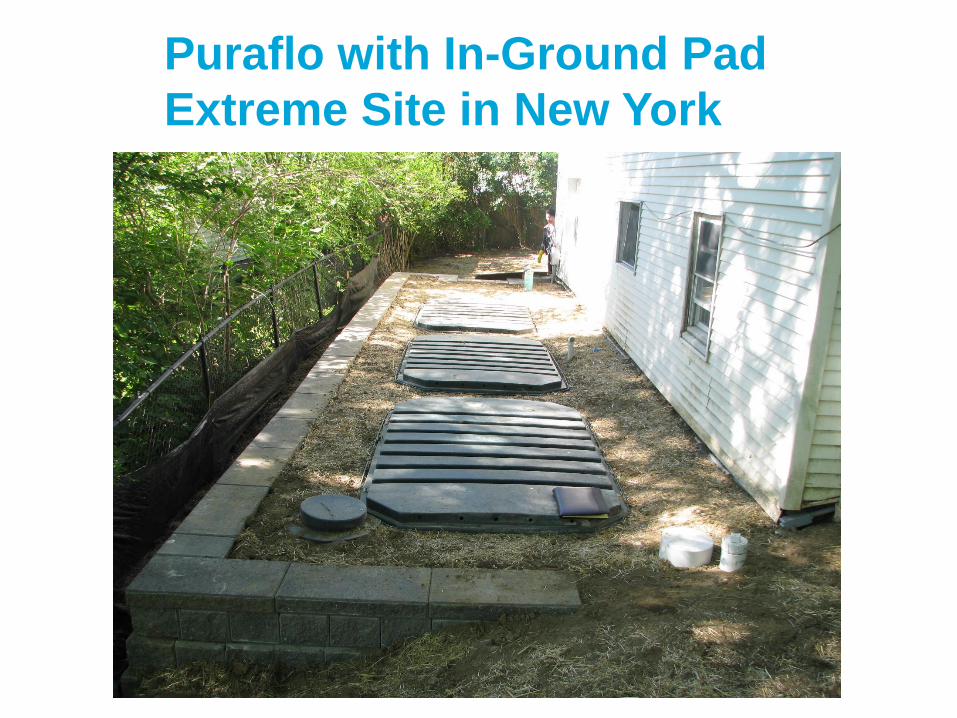
Puraflo with In-Ground Pad
Extreme Site in New York

Puraflo with In-Ground Pad
Extreme Site in Alabama
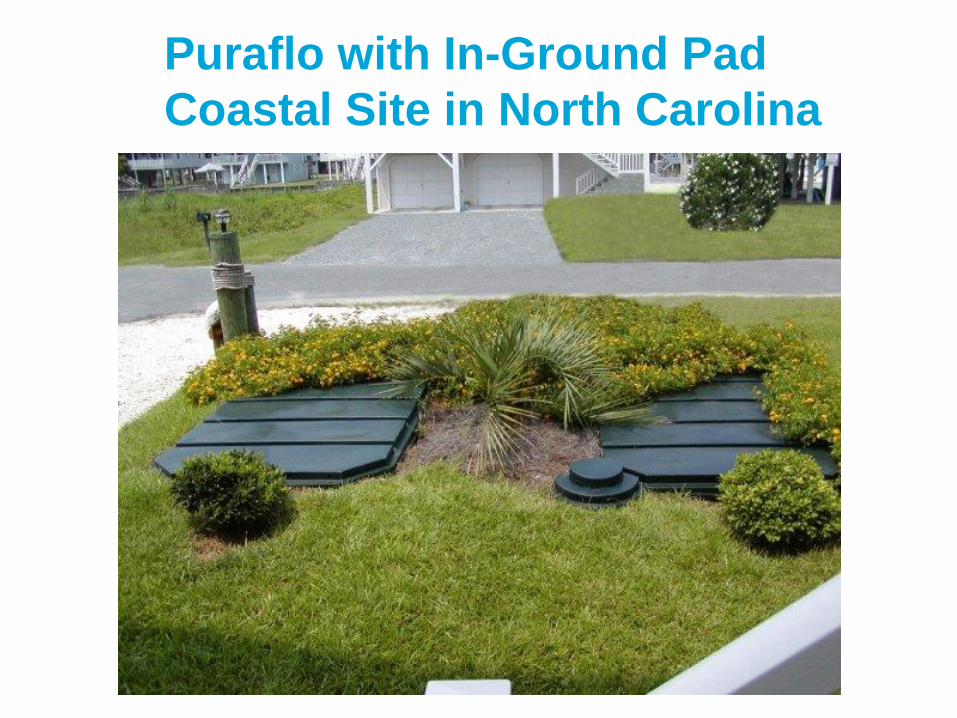
Puraflo with In-Ground Pad
Coastal Site in North Carolina
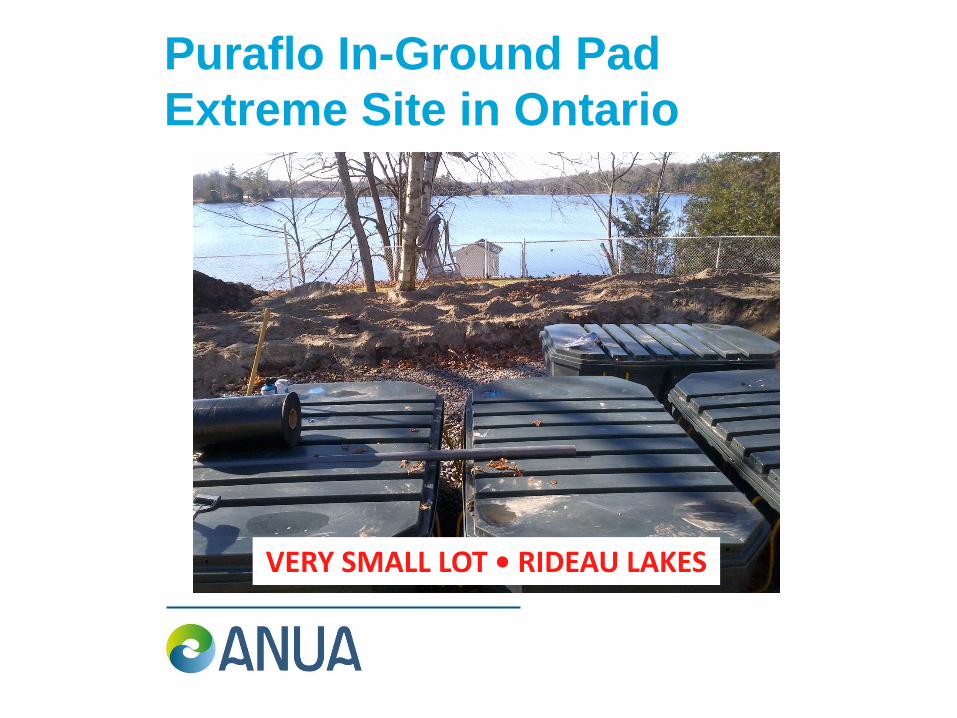
Puraflo In-Ground Pad
Extreme Site in Ontario
VERY SMALL LOT • RIDEAU LAKES

Puraflo with Mounded Pad

Puraflo with Mounded Pad
Difficult Site in New Jersey

Mound vs. Mounded Pad
Ohio Sites Comparison
Puraflo Mounded Pad
(foreground)
Wisconsin Mound
(background)
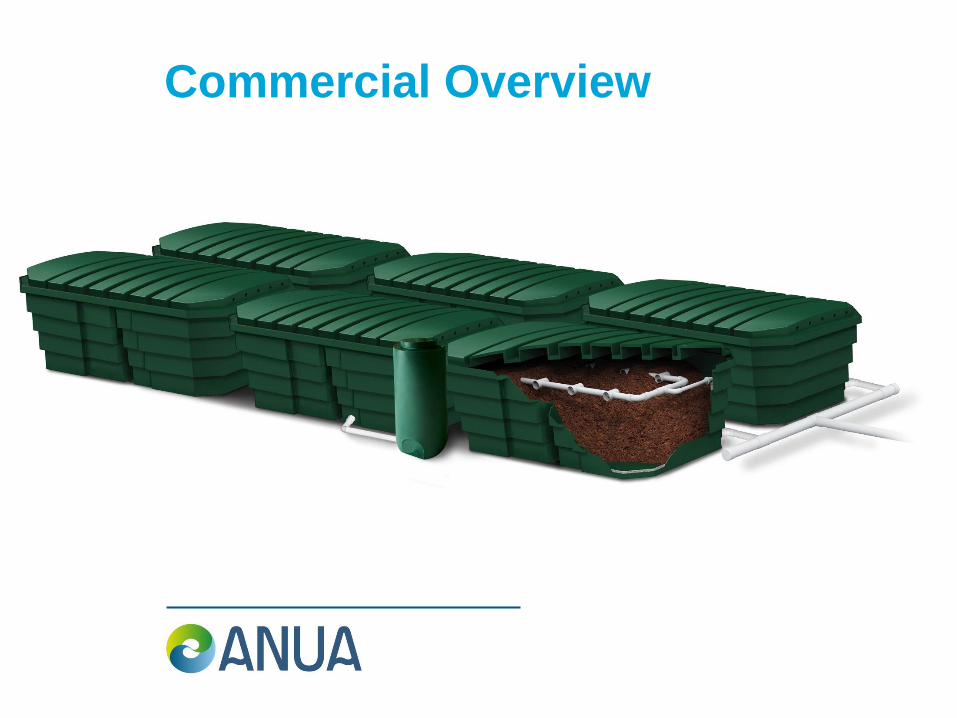
Commercial Overview
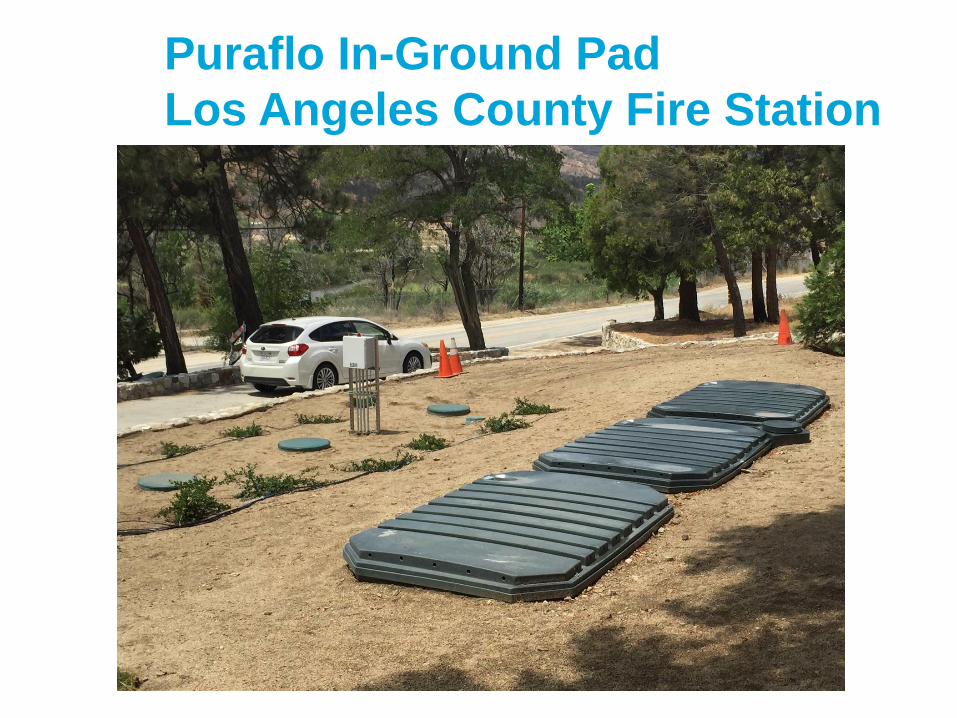
Puraflo In-Ground Pad
Los Angeles County Fire Station

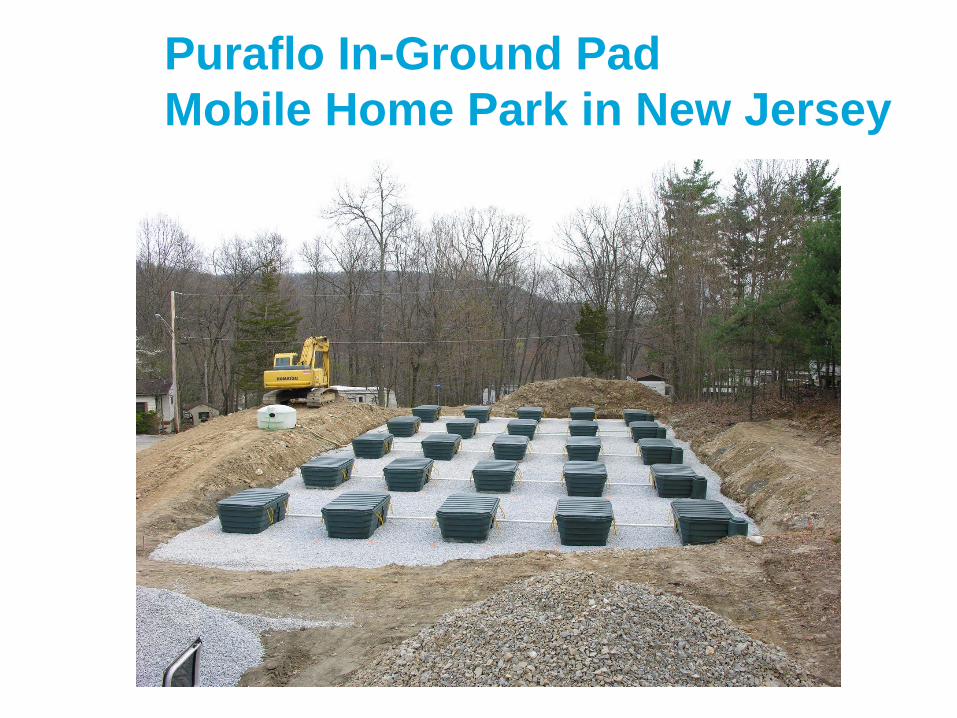
Puraflo In-Ground Pad
Mobile Home Park in New Jersey
• Tall Timbers
• Summer use only
• Vacationers from New Jersey, New York, & Pennsylvania
Puraflo In-Ground Pad
Mobile Home Park in New Jersey

Puraflo In-Ground Pad
Mobile Home Park in New Jersey

Puraflo Mounded Pad
Commercial Site in Ontario

• Quesnel/Caribou Lodge (seasonal)
• Northern Manitoba
Puraflo Mounded Pad
Commercial Site in Manitoba

Puraflo Mounded Pad
Commercial Site in Manitoba
Chesapeake Bay BMP
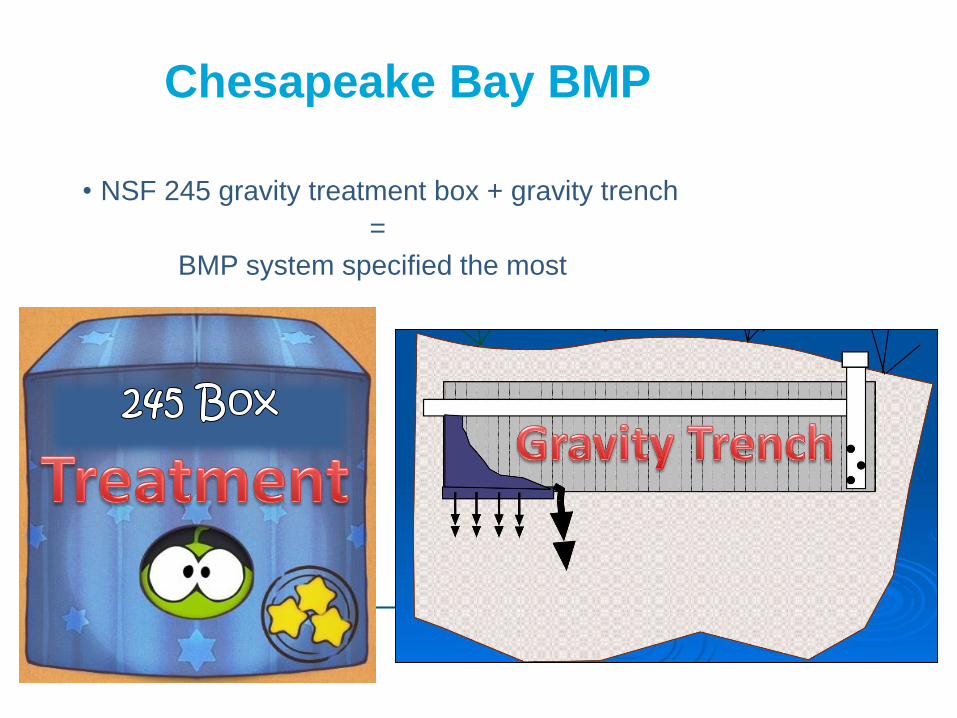
• NSF 245 gravity treatment box + gravity trench
=
BMP system specified the most
Chesapeake Bay BMP
• Puraflo system
• Septic tank
• Recognized treatment for decades
• Flattens peaks of hydraulic & organic load (buffering)
• Timed dose pumping
• Process control
• Allows for correct balance of water, air, time, & food
Chesapeake Bay BMP
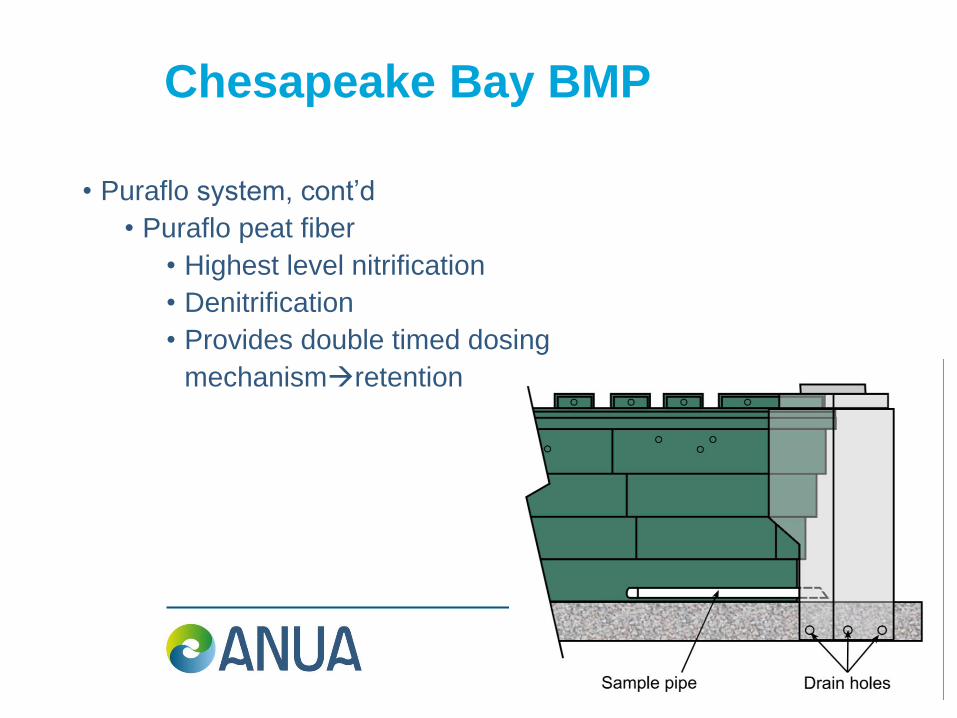
• Puraflo system, cont’d
• Puraflo peat fiber
• Highest level nitrification
• Denitrification
• Provides double timed dosing
mechanismretention
Chesapeake Bay BMP
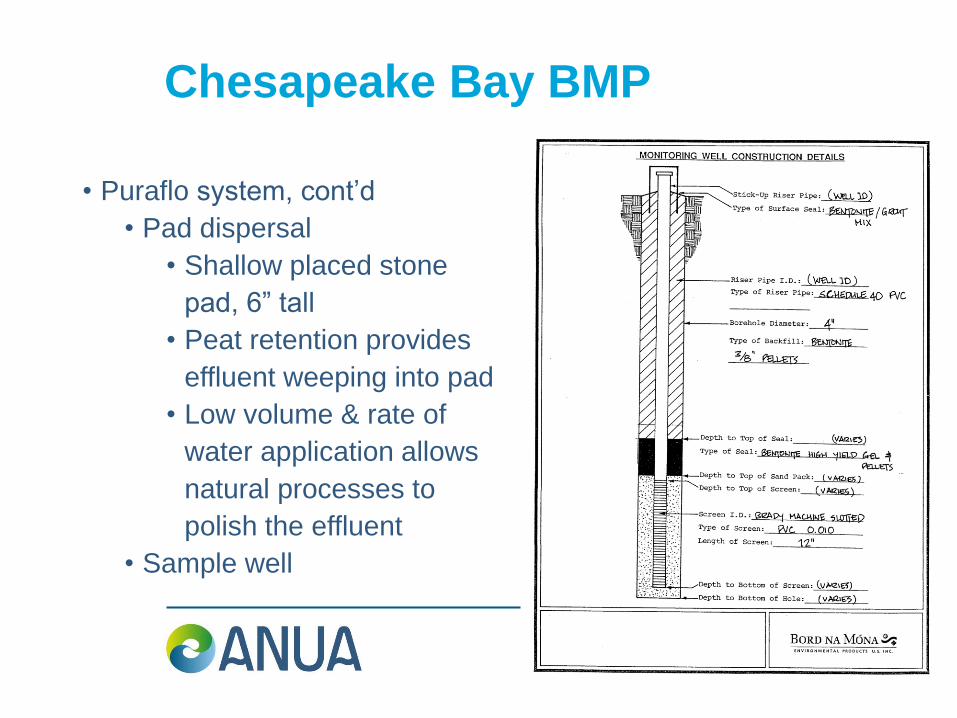
• Puraflo system, cont’d
• Pad dispersal
• Shallow placed stone
pad, 6” tall
• Peat retention provides
effluent weeping into pad
• Low volume & rate of
water application allows
natural processes to
polish the effluent
• Sample well
Chesapeake Bay BMP
• Virginia
• 24 sites monitored & sampled from July 1997 to July 1999
• Sites were in all soil types
• Presented by D. Alexander & A. Jantrania at ASAE in 2001
• Abstract states:
“The data obtained from this study indicated a very high
level of treatment by the filter and no major hydraulic
problems with the effluent dispersal beds that were sized
according to the company’s sizing criteria.”
Chesapeake Bay BMP
Samples
Monthly
Avg (mg/l)
%
Reduction
From PT
%
Reduction
From SC
%
Reduction
From PW
Monthly
Avg PW/DG-
BG (mg/l)
%
Reduction
From PT
%
Reduction
From SC
%
Reduction
From PW
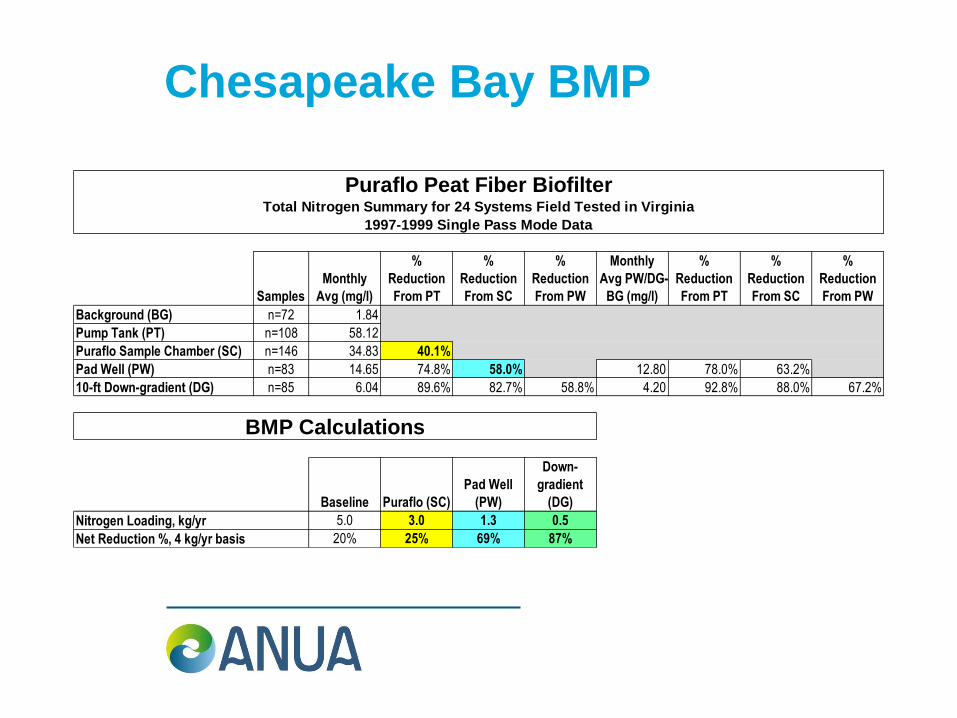
Background (BG) n=72 1.84
Pump Tank (PT) n=108 58.12
Puraflo Sample Chamber (SC) n=146 34.83 40.1%
Pad Well (PW) n=83 14.65 74.8% 58.0% 12.80 78.0% 63.2%
10-ft Down-gradient (DG) n=85 6.04 89.6% 82.7% 58.8% 4.20 92.8% 88.0% 67.2%
Baseline Puraflo (SC)
Pad Well
(PW)
Down-
gradient
(DG)
5.0 3.0 1.3 0.5
20% 25% 69% 87%
BMP Calculations
Nitrogen Loading, kg/yr
Net Reduction %, 4 kg/yr basis
Puraflo Peat Fiber BiofilterTotal Nitrogen Summary for 24 Systems Field Tested in Virginia
1997-1999 Single Pass Mode Data
Chesapeake Bay BMP
Samples
All Avg
(mg/l)
%
Reduction
From PT
%
Reduction
From SC
%
Reduction
From PW
All Avg
PW/DG-BG
(mg/l)
%
Reduction
From PT
%
Reduction
From SC
%
Reduction
From PW
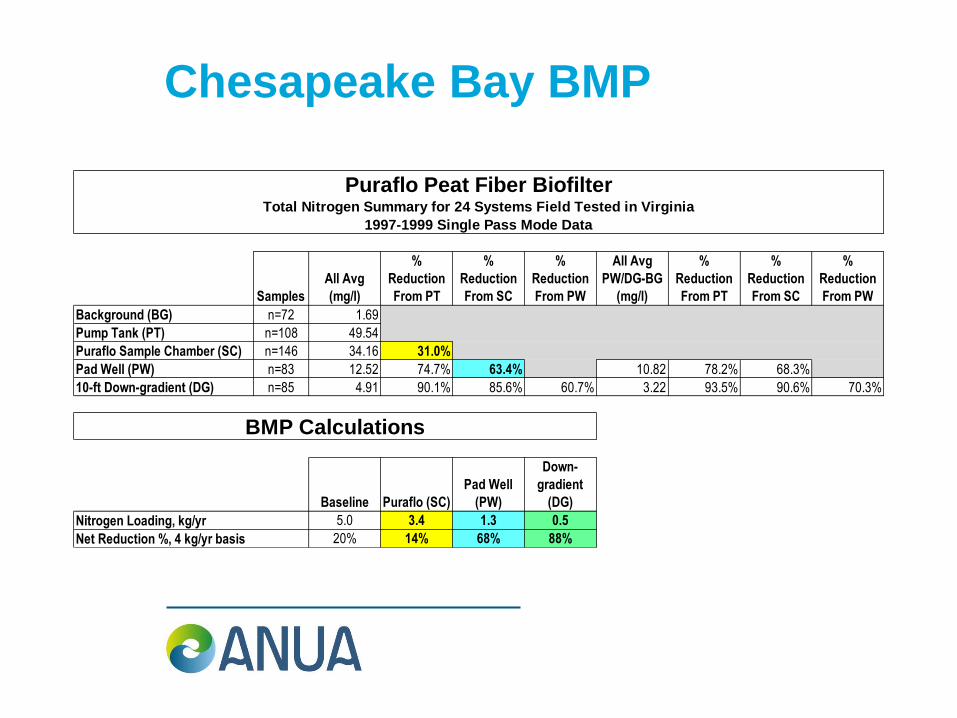
Background (BG) n=72 1.69
Pump Tank (PT) n=108 49.54
Puraflo Sample Chamber (SC) n=146 34.16 31.0%
Pad Well (PW) n=83 12.52 74.7% 63.4% 10.82 78.2% 68.3%
10-ft Down-gradient (DG) n=85 4.91 90.1% 85.6% 60.7% 3.22 93.5% 90.6% 70.3%
Baseline Puraflo (SC)
Pad Well
(PW)
Down-
gradient
(DG)
5.0 3.4 1.3 0.5
20% 14% 68% 88%
BMP Calculations
Nitrogen Loading, kg/yr
Net Reduction %, 4 kg/yr basis
Puraflo Peat Fiber BiofilterTotal Nitrogen Summary for 24 Systems Field Tested in Virginia
1997-1999 Single Pass Mode Data
Chesapeake Bay BMP
• NCSU-CES (Gates County, NC) study
• Presented at ASAE in 2001
• 3rd Party data

Chesapeake Bay BMP
Type A Pad - 3 Sites Avg (mg/l)
%
Reduction
From PT
%
Reduction
From SC
%
Reduction
From PW
Avg PW/DG-
BG (mg/l)
%
Reduction
From PT
%
Reduction
From SC
%
Reduction
From PW
Background (BG) 1.70
Pump Tank (PT) 29.20
Puraflo Sample Chamber (SC) 23.10 20.9%
Pad Well (PW) 7.00 76.0% 69.7% 5.30 81.8% 77.1%
Down-gradient (DG) 3.70 87.3% 84.0% 47.1% 2.00 93.2% 91.3% 62.3%
Puraflo Peat Fiber BiofilterTotal Nitrogen Summary for 4 Systems Field Tested in Gates County, North Carolina*
1997-1999 Single Pass Mode Data
Chesapeake Bay BMP
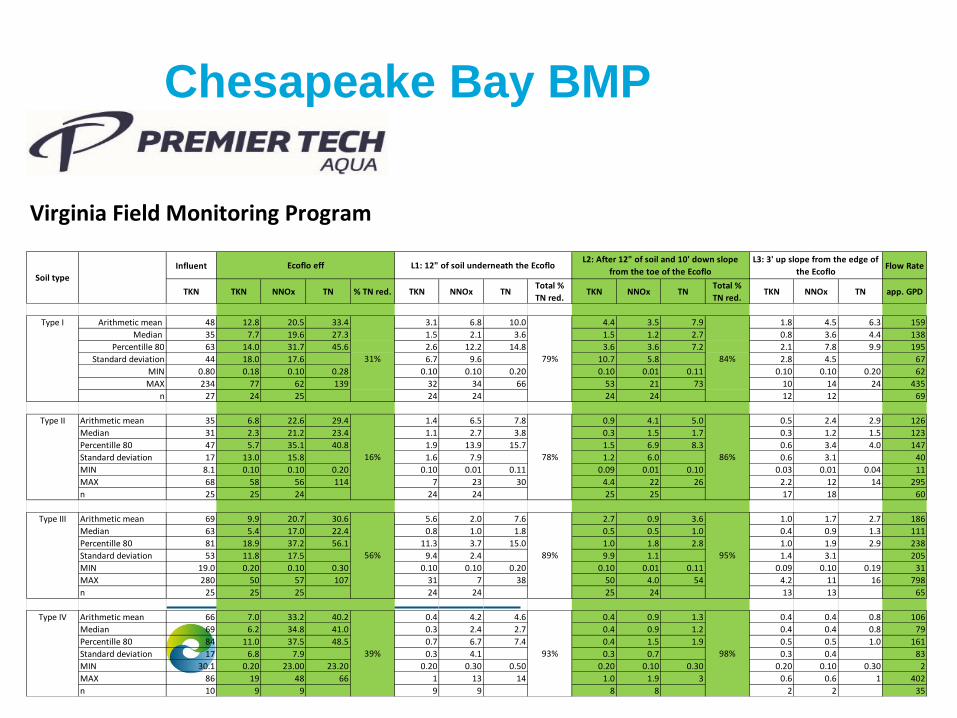
• Virginia
• Premier Tech Aqua Ecoflo sitesVirginia Field Monitoring Program
Influent Flow Rate
TKN TKN NNOx TN % TN red. TKN NNOx TNTotal %
TN red.TKN NNOx TN
Total %
TN red.TKN NNOx TN app. GPD
Arithmetic mean 48 12.8 20.5 33.4 3.1 6.8 10.0 4.4 3.5 7.9 1.8 4.5 6.3 159
Median 35 7.7 19.6 27.3 1.5 2.1 3.6 1.5 1.2 2.7 0.8 3.6 4.4 138
Percentille 80 63 14.0 31.7 45.6 2.6 12.2 14.8 3.6 3.6 7.2 2.1 7.8 9.9 195
Standard deviation 44 18.0 17.6 6.7 9.6 10.7 5.8 2.8 4.5 67
MIN 0.80 0.18 0.10 0.28 0.10 0.10 0.20 0.10 0.01 0.11 0.10 0.10 0.20 62
MAX 234 77 62 139 32 34 66 53 21 73 10 14 24 435
n 27 24 25 24 24 24 24 12 12 69
Arithmetic mean 35 6.8 22.6 29.4 1.4 6.5 7.8 0.9 4.1 5.0 0.5 2.4 2.9 126
Median 31 2.3 21.2 23.4 1.1 2.7 3.8 0.3 1.5 1.7 0.3 1.2 1.5 123
Percentille 80 47 5.7 35.1 40.8 1.9 13.9 15.7 1.5 6.9 8.3 0.6 3.4 4.0 147
Standard deviation 17 13.0 15.8 1.6 7.9 1.2 6.0 0.6 3.1 40
MIN 8.1 0.10 0.10 0.20 0.10 0.01 0.11 0.09 0.01 0.10 0.03 0.01 0.04 11
MAX 68 58 56 114 7 23 30 4.4 22 26 2.2 12 14 295
n 25 25 24 24 24 25 25 17 18 60
Arithmetic mean 69 9.9 20.7 30.6 5.6 2.0 7.6 2.7 0.9 3.6 1.0 1.7 2.7 186
Median 63 5.4 17.0 22.4 0.8 1.0 1.8 0.5 0.5 1.0 0.4 0.9 1.3 111
Percentille 80 81 18.9 37.2 56.1 11.3 3.7 15.0 1.0 1.8 2.8 1.0 1.9 2.9 238
Standard deviation 53 11.8 17.5 9.4 2.4 9.9 1.1 1.4 3.1 205
MIN 19.0 0.20 0.10 0.30 0.10 0.10 0.20 0.10 0.01 0.11 0.09 0.10 0.19 31
MAX 280 50 57 107 31 7 38 50 4.0 54 4.2 11 16 798
n 25 25 25 24 24 25 24 13 13 65
Arithmetic mean 66 7.0 33.2 40.2 0.4 4.2 4.6 0.4 0.9 1.3 0.4 0.4 0.8 106
Median 69 6.2 34.8 41.0 0.3 2.4 2.7 0.4 0.9 1.2 0.4 0.4 0.8 79
Percentille 80 84 11.0 37.5 48.5 0.7 6.7 7.4 0.4 1.5 1.9 0.5 0.5 1.0 161
Standard deviation 17 6.8 7.9 0.3 4.1 0.3 0.7 0.3 0.4 83
MIN 30.1 0.20 23.00 23.20 0.20 0.30 0.50 0.20 0.10 0.30 0.20 0.10 0.30 2
MAX 86 19 48 66 1 13 14 1.0 1.9 3 0.6 0.6 1 402
n 10 9 9 9 9 8 8 2 2 35
56%
39%
L3: 3' up slope from the edge of
the EcofloSoil type
L2: After 12" of soil and 10' down slope
from the toe of the Ecoflo
89%
93%
Ecoflo eff L1: 12" of soil underneath the Ecoflo
84%
86%
95%
98%
79%
78%
Type IV
Type III
Type II
Type I
31%
16%
Chesapeake Bay BMP
• Summary
• Single pass peat biofilters provide 20 – 40%+ TN reduction
• Shallow pad dispersal provides >50% TN reduction
• Field testing verifies what’s already recognized or assumed in
BMP
• BMP TN reduction goal is satisfied
• Treatment process provides effluent by-pass protection & is
fail-safe
• History & longevity of peat biofilters is documented for almost
three decades

Questions?
anuainternational.com