
PSE-Stat-Bul-TADAWUL 37 - pex.ps€¦ · 502.3 322 1,032,411 620,919 06/04/2010 500.72 366...
34
2010 ) 37 ( 2010
-
Upload
truongkiet -
Category
Documents
-
view
218 -
download
0
Transcript of PSE-Stat-Bul-TADAWUL 37 - pex.ps€¦ · 502.3 322 1,032,411 620,919 06/04/2010 500.72 366...

������ 2010
��� )37(
����� 2010

2
������ 2010 ���)37(
������ ����� ����©
����� ������� �� !" #$�%&� !�$� '���()� *�� �+: ������ ��$�- ����.+ ���2010 .��$0%� ��1�2�&� #$%�� )*����( ������ 2010 ���)37 .('.���3 ����.+
!" 4��� 56��$�� ����: ������� ���� �� ��� �� - ������ ������� ��� ��������� ������
���� �����:
�1$� $�����: '.���3 ����.+ 7� 8�$ *�9�� :��� :7� 8�$3.+����
���� ;$�% *��$&� ;$�% #$�����$��� 5�$� ��$% $��� *���� #$���
<�� :970 9 2390999 + <�� :970 2 2403903 + '��+ :970 9 2390998 +
������ ��� :e.com-s-pse@p ������� � !" :e.com-s-www.p

3
������ 2010 ���)37(
���
�# ������� ���� �� ��� �� �� ����� �����# ��� $%������� $����� ��&'�� ��(�" )� *'��� ��",���" ���� -�.�"� ��������/ � / ����01� �� �������� ����/ -2��"���� �3�� 4��" ���� ��� ��������� *�(�!� ��(�" )� �������� '�
��� 5���� ��,"��� ,�� -6� 7�� � �&'� ���� ����8� �� ���� ,��� �3������ �������� '� 9���/ ,��� ��0:� �� 7�"���
� �� ��"���� �� 2� �� ��&�� 4� 3�� �;. �� ������� ����� ����&��� &�0� ������ �� ���� �� <"�# � ��/ =��� <�� ����� ��> ,�: �� ?�; ���� @��# A��0 ���� � B� ���� �!��:��� ��(�" )� ��'��� ��3��� ��.
,�: ,����� �'� D����� �&�� � ��� �"": 6� -������� �&� ���� ���%��� �� ��> ��&'�� ��(�" )� *'��� E;. ,����
&'����� ?�� <�/ ���%)�� �0���� ���'�� �.� / �� ����� ���� ���8� ,����� ��0 # 6� ��"F�3�� 'G� " -&'�� ,�:<�/ ���%/ �3��� ���� $� ����3��� D��- �!��:��� ���� 3�� =��� <�� ���(�" / *'��� ���%� ?�;� ��:# �.# , ��� ���%/
�� *�� ,�: ���� �� �'�*'� ������ ,���� ���# @��# ���3� , 7�"� *'��� ��%�� ?�;� - .
���3� �� ��3� �� ��� �# 0���(�" / *'� � -��������� �(���� >�>�� �� �.��� ���8� ��� >��� ��3�� $�� ,�� � �� ���� ��������� ������)�.
���>4?��� @������ '�1$�

4
������ 2010 ���)37(
5������� ��1�( *2�� ;�?��� ���2� *�A� *2�� $0% *6B ���� C��>����� 2010 5
&'� ���� @��# H:������� 2010 5 1.1 ���� ��'G� @��# 6 2.1 &' ,�: ���� ����� �'�������� 2010 7 3.1 ������ �� ,����� 8 4.1 ,� ��� 4���)� >�� ��@�" / 9
���9� *2�� 5��$%� C��> 10 1.2 &'� ���'�� @��# H:������� 2010 10 2.2 7���!�� ��8� <�8� F�:�� ���'�� /�&�&�# ���8 7�%�!:�� 10 3.2 �� 7���� ��8� <�8� F�:�� ���'��,����� ��0 # ��� 6� 10
D�9� *2�� 5������ 5�C�2�" 11 1.3 &'� ���� 3�� ��@�" /����� 2010 11 2.3 ���� 3�� ��@�" ������ �� <��� ����� &'�� 2010 12
���$� *2�� *����� ��%� ����E� �.�.�� 13 1.4 2&'� ,����� �'� ���3��;J ����� 2010 14 2.4 &'� ,����� �'� ���3������ ����� ��2010 ����� ����� ��2009 15 3.4 �'� ���3������ �� <��� ����� &'�� ����� ��2010 ����� �� *�!�� F!� $�2009 16
'��B� *2�� $0% *6B ���$� *��� ����> F� C��>����� 2010 17 &' ,�: ������ ,���� ���# D�� @��#����� 2010 17
'���� *2�� ���� 5���.� 19 ���� ��:# 19 ����(�� �� � "��� ��.�!��� 22 ������� ���� �� ��� �� �� @�%�8� ������� ��8� ���' 25
��6�� 27 �� � ��)1( &'� ���� ����0)� �'�������� 2010 28 �� � ��)2( ���� ����0�� �'�������� �� <�8� ���8� &'�� 2010 30 �� � ��)3( ������ ���� �� *�!�� ���� ����0)� 2&'�� �'���2008 ���B������ 2010 32 �� � ��)4( �� *�!�� ���� ����0)� 2���� �'���1997 &' <� ����� 2010 333

5
������ 2010 ���)37(
$0% *6B ���� C��> GB.������ 2010:
����� &' ���&� F�3�� 'G� ��M#2010 =��� ���501.72 1���� �� 7�%!:�� � 3�1.45 1��N�� �� 2# � 3�)0.29(% �N�
&' ��M/�;J 2010.
�N�� &N'�� �;. ,�: ��M/ ���� <��# F�3�� 'G� ,0� �� =���511.35 =�N�� ��� ��M/ ���� ���� -� 3�500.72
� 3�.
���PN��� ��N'G� D�N!:�� �N�!�: <�� D�!:��� �;. ��P� ����N��� ����N"�� ?���� ��'G� 4�!�� ,��3� ����:��
����� ������� 4� � 'G� D!:�� 6� )3.82 (% �N�� �N�B�� =���48.85 4� � 'G� D!:�� ?�;� -� 3�����:�� ��N���
)1.01 (% =��� ��� ��B��49.99 ��� �� -� 3� $N!�� ,N��3 ����� ?���� 4� � 'G�0.06 % =�N�� ��� ��M#102.61
����� ����"�� 4� � 'G� ?�;� $!�� -� 3�3.51 % �N�B�� =��� ���60.68 ����N��� 4� � 'G� $!�� ��:# -� 3�
�����2.19 % =��� ��� ��M#24.70 � 3� . Q�� �3� 21 ���0 �� ,����� ����� �� ,�N: ������� ��
�� *�!�� ������ F��:�� 01/04/2010 ���B� ������ F��:��29/04/2010 �&��: �� - ��N� ,19,721,903 7��&N� �N��3�
30,601,760 7��� ,�N: �� �;!� 7�����# 8,314 �7��3.
���N'�� �&N�8 ������ ���3�� �B�� �3� ���� �0 � ����� ���� ���N �� &N'�� ���&� �0����2,436,154,640 �N���# ��
1���� 4�!���0.66 ������ &'�� ��.
�������� �&�8� ���� �B�� �� ��30,601,760 �N���# �� 1���� D�!:���)30.02 (%������ &'�� ��.
,����� 5(��� ���3��<�8� ���8� &'�� ����� ��2010 $N� ����� �� *�!�� F!�2009 ����� �������� �&�8� ��� D!:�# �3�
)24.34 (% �.��N� R�� 6� 81,724,211 7��&N� $N� �N��3�108,015,442 7��&� ,�: ��N��� �N� <N�8� ���8� &'��
2009 �&N�8� ���3� ������� - ��N��� �N%!:�� �N3� �N������� )29.70 (% RNN����165,587,520 $NN� �NNN��3� 7���
235,551,741 �� ,�: ����� �� *�!�� F!�2009 .
������� �������� ���3 ��!�� �3� �����1.96 % �&���� �B�� 6� &' ���&� ������� ����� ��2010 ��� <�/2,436,154,640 ,��3� 7���2,389,257,635 &' ���&� 7�������� ��N��� ��
2009.
*�A� *2�� $0% *6B ���� C��>�����

������ 2010 ���)37(
$0% *6B 5������ 5�$%H�� '��� $%H� C��>����� 2010 Performance of Sector
Indices
Al-Quds Index
Banking Index
Industrial Index
Insurance Index
Investment Index
Services Index
6
�� � �3������ ��'G��� �.# ������ ,�0�� H:�� ���� �� �&�8�� �"�:�� ��'G���
$0% *6B 5������ 5�$%H�� '��� $%H� C��>Performance of Sectors Indices During April 2010
ا���ق Close
ا�����ح Open
Changeا������
��� Point %)(
501.72 503.17 -1.45 -0.29
102.61 102.55 0.06 0.06
����"�� 'G� 60.68 58.62 2.06 3.51
48.85 50.79 -1.94 -3.82
������� 'G� 24.7 24.17 0.53 2.19
����:�� 'G� 49.99 50.5 -0.51 -1.01
1.1 ���� 5�$%H� C��>:
�� � �3������ ��'G��� �.# ������ ,�0�� H:��
ا�%$#�
F�3�� 'G�
?���� 'G�
����"�� 'G�
���P��� 'G�
������� 'G�
����:�� 'G�

7
������ 2010 ���)37(
$0% *6B ���. ����� ��%������� 2010 Daily Market Activity During April 2010
I�$��� ������� 80�A� ��� ������� 80�A� ���()$)��( 5���2� ��� '��� $%H�
Date Volume Value ($) No. of Trans. Al-Quds Index
01/04/2010 661,734 861,194 270 504.84
04/04/2010 1,269,006 1,953,214 421 503.97
05/04/2010 392,202 750,469 302 502.22
06/04/2010 620,919 1,032,411 322 502.3
07/04/2010 549,982 1,326,405 366 500.72
08/04/2010 1,011,839 2,485,205 547 506.06
11/04/2010 657,378 861,003 438 507.98
12/04/2010 974,008 1,712,402 398 506.35
13/04/2010 1,099,766 1,561,524 484 508.25
14/04/2010 641,997 1,035,923 330 510.74
15/04/2010 726,832 1,047,968 351 511.35
18/04/2010 512,827 820,163 268 507.76
19/04/2010 1,177,154 1,488,396 362 505.66
20/04/2010 1,205,058 1,558,112 490 504.58
21/04/2010 573,199 833,590 275 505.58
22/04/2010 552,770 686,180 365 502.07
25/04/2010 840,843 2,225,929 380 506.78

8
������ 2010 ���)37(
26/04/2010 526,664 1,088,013 329 507.88
27/04/2010 618,013 1,409,489 471 506.32
28/04/2010 387,211 959,395 404 504.56
29/04/2010 4,722,501 4,904,775 741 501.72
;����� 19,721,903 30,601,760 8,314 Total
2.1 5�$��)� $�� *�����: 7�":�� ������ ,�0�� ��3� ,�: ������ ���:���� ,����� �� � &'����� ����� ��2010 , ,�:<�8� ���8� &'�� 2010.
$0% *6B 5�$��)� $�� *���������� 2010
E-Trading During April 2010
ا�'& *����� ����"
Total Trading
5�$��)� $�� *����� E-Trading
5�$��)� $�� *����� ����
*����� ����" �� (%) Percentage of E-
Trading (%)
Item
������� 80�A� ��� 19,721,903 4,880,024 30.76 Volume
������� 80�A� ���()���$�> $)��( 30,601,760 7,880,054 28.83 Value ($)
5���2� ��� 8,314 3,622 43.57 No. of Trans.
5�$��)� $�� *����� *6B !�A� ��$A� $�0%� 2010 E-Trading During First Four Months 2010
ا�'& *����� ����"
Total Trading
5�$��)� $�� *����� E-Trading
*����� ���� 5�$��)� $��
*����� ����" �� (%) Percentage of E-
Trading (%)
Item
������� 80�A� ��� 81,724,211 18,887,385 24.53 Volume
������� 80�A� ���()���$�> $)��( 165,587,520 31,166,013 19.42 Value ($)
5���2� ��� 27,039 12,530 46.34 No. of Trans.

9
������ 2010 ���)37(
3.1 *������ ;���&� E�$� 5�C�2�": &' ,�: >���� @��P� �3������ ��'G��� �.8 �":�� ������ ,�0�� ��3������ ��� ��2010
*������ ;���&� E�$� 5�C�2�"
Statistics of Clearing Depository and Settlement Center
���� �����
April 2010
$��K
March 2010
$��L��
Change% Item
� �!��� ����� �� ��� 619 563 9.9 Number of Opened Accounts
� �!��� ����� �� ��� ����0/ 81,931 81,312 0.8 Total of Opened Accounts
���.����� ��� ����0/ 103,723 100,946 2.8 Total Shareholders
�&�. �� ���� �&�8� ��� 4,700,224 4,108,154 14.4 Number of " into Pledge" \Lien shares
�&�. ?� �� ���� �&�8� ��� 883,621 1,461,924 -39.6 Number of "out of Pledge"\Lien Shares
���� ,� ��� ������ ��� 29 20 45.0 Number of Inheritance Transactions
���� �� ��� �&�8� ��� 476,757 121,644 291.9 Volume of Inheritance Transfer Shares
���� �� ��� �&�8� ���� 1,788,912 323,210 453.5 Value of Inheritance Transfer Shares
��(���� ,>����� ������ ��� 37 18 105.6 Number of Family Transfer Transaction
�&�� ,>������ �&�8� ������(�� 3,601,281 414,547 768.7 Volume of Family Transfer Shares
���(�� �&�� ,>������ �&�8� ���� 2,297,498 387,095 493.5 Value of Family Transfer Shares
&' �&'����� 2010 7���!�� �� &N' $� ���3� ������� ��8� ���' ,�� �� � �!��� ,����� ����� ����;J 2010 ����� 9.09%- �3� �.�� ������� ������� &' ,0������ 7���!�� &' $� ���3� ��.��� �&�8� ��� ���;J 2010 �����
14.40% -,��3��� �� D!:�� ����� �&�. ?� �� ���� �&�8� ���39.60% - �N3� T7�N��� �� ��� �&�8� ���� ������� $N!�� �.��� �����291.90% &' $� ���3��;J -������ ?�;���!�� ���� �� ���� �&�8�7���� �&�� � ��N���453.50 ,�N:
������ &'�� $� ���3� ��� �� &'��.

10
������ 2010 ���)37(
$0% 5��$%� C��> GB.������ 2010
�.��� R����� &'�� �;&� �������� ���'�� ��M)� ���# ���3��34 ,"� �� ��'39 �N3� -�3����� �&����M/ $� -�0�� ��'
�&U#14 -�&�&�# ���# �� 7���!�� ��'12 �N&U# ��' ��N�# �3�N�� �� �� -�&�&�# ���# �� 7�%�!:��8 ���N'
=:#.
�'�� =��� <�� &' ,�: �&�&�# ���# �� 7���!�� ��8� ������� 2010 ���# 4�!�� &'�� �;. �&' �3�14 �'� @�0� ��
������<�8� ���"� ��� �� ��'���� ����� �&N� $N!���& �����71.43% �� - ��'�(����� ����"� �� ��� �&N� $N!��&� �����35.71 % ������� ������ �� @�0 �� N��� �N0�� ��N'
�&� $!���& �����8.19%- ����� �� ��% ����� F�3�� ��' ���� $!�� �&��& �����7.91%- @�0� �N���:�� �N����� ��
��'����"�� ������� �� ��� �� N� $N!�� � &�&N�� ��N���6.33%.
&' �&' �3� 7�%�!:�� ��8� F�:�� ���'�� =��� <������� 2010 ���# D�!:��12 �'� �!:��� ���D A�"� �� ��8� ��'�"":��� � �0�� F���� >�� �&N��� �� D!:�� 6� �����)17.00(%- D�!:��� �� E�����P��� ���.8� ���0��� 6�
&�&� D!:��� �����)15.71(%- ?�;� D!:�� ��' �&� �� ���������� ����� )15.28(% �� -�� ��' @�N�&��� ���� N��!��
���� &�&� D!:�#� �����)11.93(%- 7��:# �N��8� ��> �� &�&� D!:�� 6� � �����)8.64(%.

11
������ 2010 ���)37(
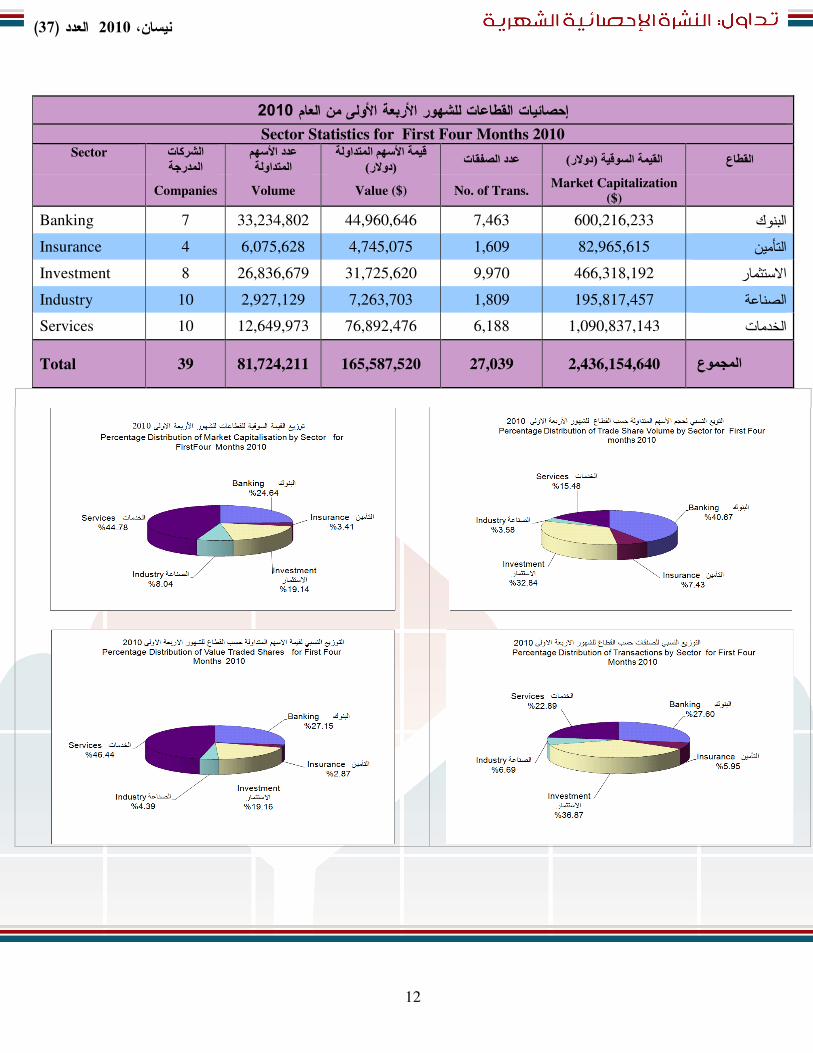
D�9� *2�� 5������ 5�C�2�"
�2�"�C $0% 5������ 5����� 8�� ��2010
Sectors Statistics April 2010 Sector ا�*�آ�ت
� ا�%ر+ ا01/�.د
� ا�%�او� � ا%�3�/01� )دو�ر( ا�%�او�
� .د ا�45�ت%���ع )دو�ر( ا��367� ا� ا�
Companies Volume Value ($) No. of Trans.
Market Capitalization ($)
Banking 7 5,515,244 9,453,631 2,557 600,216,233 ?����
Insurance 4 2,368,058 1,634,178 375 82,965,615 ����P�� Investment 8 8,996,201 10,298,096 3,241 466,318,192 �������
Industry 10 1,188,339 1,469,387 780 195,817,457 ����"��
Services 10 1,654,061 7,746,468 1,361 1,090,837,143 ����:��
Total 39 19,721,903 30,601,760 8,314 2,436,154,640 ا�%9%6ع
12
������ 2010 ���)37(
��1�2�" 5������ 58�� �� !�A� ��$A� $�0%. 2010 Sector Statistics for First Four Months 2010
Sector ا�*�آ�ت� ا�%ر+
ا01/�.د � ا�%�او�
� ا�%�او�� ا%�3�/01 )دو�ر(
� .د ا�45�ت%���ع )دو�ر( ا��367� ا� ا�
Companies Volume Value ($) No. of Trans.
Market Capitalization ($)
Banking 7 33,234,802 44,960,646 7,463 600,216,233 ?����
Insurance 4 6,075,628 4,745,075 1,609 82,965,615 ���P��� Investment 8 26,836,679 31,725,620 9,970 466,318,192 �������
Industry 10 2,927,129 7,263,703 1,809 195,817,457 ����"��
Services 10 12,649,973 76,892,476 6,188 1,090,837,143 ����:��
Total 39 81,724,211 165,587,520 27,039 2,436,154,640 ا�%9%6ع

13
������ 2010 ���)37(
$� *2����� *����� ��%� ����E� �.�.��
&' ���&� �� ��M# �� F�3�� 'G� �# ,����� ������ �� V%�������
2010 =��� ���501.72 � 3�7�%!:�� 1���� �� 1.45 � �N� 2# � 3 1���� )0.29(% <��# F�3�� 'G� ,0� �� -������ &'�� ��M/ ��
=��� ��� ��M/ ����511.35 =�N�� ��� ��M/ ���� <��# � 3� 500.72 � 3�.
&'� ,����� 5(��� ���3������� 2010 &' $��;J 2010 �# ��N��� �� �������� �&�8� ���$!�� �����6.24% R����19,721,903 7��&N�
,��3�18,563,562 �&N�8� �N��3� ��N����� -13�� 2;�� &'�� ,�: &' ,�: ������������� 2010 �N3� �N%!:�� ��N��� )30.02(%
R����30,601,760 $� ���3� 7���43,728,192 &' ,�: 7����;J 2010 .
?�;� D!:�� ��N��� �N������� �&�8� ���3� ����� ,����� )23.35(%
&' ,�: ����� ,����� R�� 6� ����� 2010 ���N 1,457,227 ,��3� 7��� 1,901,226 2;�� &'�� ,�: 7��� 13��.
�0���� ���'�� �&�8 ������ ���3�� �B�� �3� ���� �0 � ����� ����
&' ���&������ 2010 ,���� ��2,436,154,640 ��4�!��� ����0.66% &' ���;J 2010.
&'� ,����� 5(��� ���3������� 2010 &' $������ 2009 �3�$!�� ����� �������� �&�8� ���17.52 %�.��� R�� 6� 19,721,903 ً�����
$� ���3�16,781,178 ����� �� *�!�� F!� ,�: 7��&�2009 ������� - �3� �������� �&�8� ���3��%!:�� ����� )34.20(% R����30,601,760
$� ���3� 7���46,510,476 �� &' ,�:����� ������� 2009
.
������� �������� ���3 3�� ��!�� �����1.96 % �N� �N&���� �B�� 6� &' ���&������ ����� ��2010 ���N <�/2,436,154,640 7���
,��3�2,389,257,635 7��� &' ���&������ ����� ��2009.
,����� 5(��� ���3��<�8� ���8� &'�� ����� ��2010 $N� FN!� ����� �� *�!��2009 ����� �������� �&�8� ��� D!:�# �3�)24.34 (% �.��� R�� 6� 81,724,211 �ً��� $� ���3�108,015,442 ,�: 7��&�
����� �� <�8� ���8� &'�� 2009 �3� �������� �&�8� ���3� ������� -�%!:�� ����� )29.70 (% R����165,587,520 $N� �N��3� 7���
235,551,741 �� ,�: ����� �� *�!�� F!�2009 .
������� �������� ���3 3�� ��!�� �����1.96 % �N� �N&���� �B�� 6� &' ���&������ ����� ��2010 <�/ ���N 2,436,154,640 7���
,��3�2,389,257,635 7��� &' ���&������ ����� ��2009.

14
������ 2010 ���)37(
@$0% *����� ��%� ��$���$��K 2010 ������ 2010 Trading Activity Comparison for March 2010 & April 2010
Period
��� ����0,�����
����&�8� �������� �����&�8� �������� )��(
��3!"�� ���
����� ,����� ���3��&�8� ��������)��(
������ ���3��)��(
F�3�� 'G� *�!��
Number of Trading Sessions
Volume Value ($) No. of Trans. Daily Average Turnover Value
($)
Market Capitalization ($)
Al-Quds Index
March 2010 23 18,563,562 43,728,192 6,508 1,901,226 2,420,244,532 503.17 2010 ;ذار
April 2010 21 19,721,903 30,601,760 8,314 1,457,227 2,436,154,640 501.72 �7ن�� 2010
Change -8.70% 6.24% -30.02% 27.75% -23.35% 0.66% -0.29% ا������ �'7�

15
������ 2010 ���)37(
*����� ��%� ��$��� $0%����� ���200932010 Trading Activity Comparison for April 2009- 2010
Period ����0 ���
,����� ����&�8� 1�������
�����&�8� 1�������)��(
��3!"�� ���
���3� ����� ,������&�8� ��������)��(
������ ���3��)��( F�3�� 'G� *�!��
Number of Trading Sessions
Volume Value ($) No. of Trans. Daily Average Turnover Value
($)
Market Capitalization ($)
Al-Quds Index
April 2009 22 16,781,178 46,510,476 8,151 2,114,113 2,389,257,635 517.70 �7ن�� 2009
April 2010 21 19,721,903 30,601,760 8,314 1,457,227 2,436,154,640 501.72 �7ن�� 2010
Change -4.55% 17.52% -34.20% 2.00% -31.07% 1.96% -3.09% ا������ �'7�

16
������ 2010 ���)37(
*����� ��%� ��$��� !�A� ��$A� $�0%. 2010 ����� 8�� �� #$��� '�� �� Trading Activity Comparison for First Four Months 2010 with the same period 2009
Period
��� ����0,�����
����&�8� ��������
�����&�8� �������� )��(
��3!"�� ���
����� ,����� ���3��&�8� ��������)��(
������ ���3��)��(
F�3�� 'G� ا���4ة
Number of
Trading Sessions
Volume Value ($) No. of Trans.
Daily Average Turnover Value ($)
Market Capitalization
($)
Al-Quds Index
First Four Months 2009 82 108,015,442 235,551,741 36,777 2,872,582 2,389,257,635 517.70 >ا1و� � 2009 ا�*/6ر ا1رب?
First Four Months 2010 84 81,724,211 165,587,520 27,039 1,971,280 2,436,154,640 501.72 >ا1و� � 2010 ا�*/6ر ا1رب?
Change Percentage 2.4% -24.34% -29.70% -26.48% -31.38% 1.96% -3.09% ا������ �'7�

17
������ 2010 ���)37(
�'��B� *2� $0% *6B ���$� *��� ����> F� C��>����� 2010
�&' @��# &' ,�: ������ ,���� ���#����� 2010 7�U �� 7��� � ��&' �3� -10 *�� ���# �3��� �;. ��% �.��N� R�����15 7��� ����� 'G��� ���� �� 7���!�� ��&' �� ��5 'G��� ���� �� 7�%�!:�� 3� ���#.
��8� ����� �������T7���!�� &' ,�: ����� 'G��� ���� ������� 2010 &' $� ���3��;J ��� �3� 13�� 2;��4�!��� N��8� �� A�"��� �������� 6� ��!�� ����� ����� 'G��� ���� 12.93% @�0 -� ���� <��# 6� �� ������� ������ ��4�!�� ����
2"��� 6� ��!�� ����� ����� 'G��� ���� 9.66% ������ �� @�0 ������� ������� ���� �'�� �� 6� ��!�� 'G��� ���� ����� ����� 9.65% &' ��M/ ���;J 13�� 2;��.
����� ������� ��#��8� &' ,�: ����� 'G��� ���� �� 7�%�!:������� ��� �3� D�!:�����8� �� A�"� �� 6N� ������ ���
����� ����� 'G��� ���� �%!:��)5.62 (%<��# 6� �� ������� ������ �� @�0 -13�� 2;�� �;J &' ��M/ �� �N� D�!:�� ���� ����� D!:�� 6� ������� ���� ��U �#)4.52 (% ����� D!:�� 2;�� ����� �� D�!:��� �� E��)3.11(%.
'G��� ���� �� T7���!�� ��8� ����� �������,�: <�8� ���8� &'�� ����� ��2010 ����� ��M/ $� ���3�2009 �3� �3
���������� A�� <��#@��8� $� ���3����8� ������ =:8� ���� ��!�� 6� �� ����� 'G�28.32 % ����M/ �����2009 @�0� �� 6� �� ������� ������ �� 4�!�������� ���� �'�� �� ����� $!�� 2;��25.56 % $!���� ������� 2"��� �����20.20%.
������������ ���� ������8� 7�%�!:��,�: ���8� &'��<�8� �� �����2010 A�"� �� �� �� D�!:��� ��� �3� ��� �������� 2;�� ����� D!:��)3.53(%.

18
������ 2010 ���)37(

19
������ 2010 ���)37(
'���� *2��
���� 5���.�
���� $��B>:
�+ ������ M�$�> ��$% 80�> *���� C��� M�$�" ��(���� ��(�� ����� ��$�- ����.+ ���
=0 �� ������ @���8�2010/04/14 - ���� -Y� �� ������ � 8� ,�&�� ���3� 9��/ ����!�� $��� ,! ��' @�� ��� �� 9��#
�&�&�# ,��������� ���� �� ��� �� �� >� � � �ABRAJ -���� 9��)� �;.,8� ����� ����� ;��2�0�� . ����!��� $��� ,�
����� 1%�� �� # -������� ���� �� ��� ��� 2;�!���� F�(�� -��� �� 9��# ��' *��/ F�0� F�( A(�� ��0�� ��� >�>� ����� % � �� ������ ���'� -���� ��!�� ,���� F# �� �(�. ��� ��� *�� ��� *�������� ��.����� ���'���0���� ��� ���'
�� @�%�8� ������� ��8�����- �� ?��������� ����"��� ���":' ������/ ���! ".
�# �;� ��� �� 9��# ��' ���P� ����� ��1995 ��� �&��.��� ��� R�� �# <�/ ���� ��'�� E;&� ������� *���� �# �� �M���2610 >�� ��3� *���3�� �# �/ -���.���* ��� �� ���P��� ��' �� �� ���.����� *���� $��� V��"� �&����� H��3� <�� ,���� ����
&�0��. �&� �� ��M#ABRAJ =��� ��� <�8� 1���0 ��1.34 � � �� �. ������ 1���� �# �� �� ����# �� . Z��# ,
&' �3� ��'�� ����� Z��# �� ��� ��'�� ��2009 �����56.69 % ����� �� �& ��# ��0� 6� 2009 1���� ��280,280 ���3� ��� ����� �� �& ��# $�2008 �B�� ����185.254 ����# ��.
�NN����� E��$�� 5)��� ���H�"ANNA "��$%. ����� E��$�� $���� ������� P�$�$( $�2� ��$��� 5
����� ��$�- ����.+ ��� �+
��"# >����� ���� ���G� �NN�� ��"ANNA" ������� ���� ������� >����� H":� �������� ������� ��"/ �� ��G����(ISIN) International Securities Identification Number ������� �.�� ->����� �� �0���� ���'�� ��������� �� ���
�� [@����� ������� ����2010/4/1 ->��� �� <�� ,� ��� 4���)� >�� ,�� ���� ���������0�� ��' ,�� �&"�":� . ����2������ >��� ��' ,�� ��12 >����� @��� �� ����� F�8 7������� ���: F��P��&�8� �� -;: ��*�"��� ��'�� ��� ������ �� 4� -
8���'�� ������� *��- �&��� 4�- �&���P� \��� �&���� ��'�� 4� �.

20
������ 2010 ���)37(
���G� �� ������� �;. <�� ," �� ��P�"ANNA "� ���� �&0 ��% -�������� ��������" <�� �� ��� 6� # ������� ���8������� ������� $� 7��'����������� ����G��� �� *��"�� �� -,���� F# �� 4� � �� �"":���� �;. <�� ���� ," ���.# $���
�� ������� ������� >��� ,�'�� A;0 �"���������� 7�"": A��08� ��������� ����. �������G��� ������/ �&� V��� 6� - ]���� A� ����� �� �0���� ��'�� <�� ���G� ������ *�ANNA .�;. ��� ?�; <�� *�� >��� ������ ���� ��'�� ��. 7�"": ��������
��0�: ���# �� �&0��/ �� ,� ��.
���� �(�� *6B �� ����� ��$�- ����.+ ��� �+ ��$��� 5��$%� �� ��$% *�� G�B� ���� E�$� !.� <$�� �������� ���$� $�� ���$��)� :
bSite/English/ListedCompanies.aspx?Tabindex=6e.com/PSEWe-s-http://www.p
�����.�� *��� ��� �.�� �� $%� ���$� ��� $�2� ����� ��$�- ����.+ ���
����� �� �;J &'� -��� ��!�� ,���� �� ��0� �� '� $���� ����� �:G� ������� ���� �� ��� �� ��"#2010 . ��0��� � ���� @%�� 2;�� , ��� �;. <�� ]� 8� ]��:� ,�� �� ��" ���� ��.��� ��' <�/ ������� ���� �� ��� �� , � �� <
���� <�/ �0�:�� ������� A;0 �� �.��� ��� ��!�� ��"���� V��" �� A"� 1�� 1����0�� <�� @�^� ]��:� ���0# . � �'# -�� ������ ����� ���� �� ���� ��.��� <�/ ���� , � �# <�/ 1%�� �� # ����� ������� ���� �� ��� ��� 2;�!���� F�(�
���� ��!�� ����"���� � ���� <�� 7���0�/ F����� . 133 2;�� U ���� ���� ������� ��8� 4� � �� ����� �� ��� <�/ 1%�� �'# ���� ���8� �� ��� ��!�� ��"����D8� <�� *�3���� ]U�� �M *�:8 . ����0�� ��# 5(���� F�G� �� ��'G��� E;. ,0 �# 1%�� ����
H!�� ��% �&�P� ���'� �%���� �;J �� �&��U�� �� ���� ��0���� ���� ��0 ���.# <�/ 7��'� -�.������ �� ,� �� D8� <����� �� ������� ��;�0�� ������������� ���� ������� �����" �.# ����G��� �� �3�� ����" ��� <�� �.
� -�!� �� ���� Y� ��� ����� -������ ����)� ��� �� $���� ������� ��8� �(�&� 2;�!���� F�(�� ��0��� ���%��� -?�; <�/ D���� 2;������� ��>8� ��J >�0�� �(�&�� 1���� 2;�� ���������)� ,���� ���# <�� �������� �.
� E�&'� 2;�� ?� �� ,U �� �&���.# ��0�� ������� ��0��� �%���� -*� ���� ������� �� ��0���� ��0�� ������!� �"�: �� B� �� � ������" �� ��# <�� ����"���� .� ����"���� ��3��� �� ������ �.����� �� ��0��� ������0�:�� �� ��� �����"�� <�.
'� ������ ,���� ���# @��# ������� ���� �� ��� �� @��# , 7��3� ��%� 7��(�" / 7�!�� -��0��� �� '� $���� ����� ,�' 2& ����� �� ��' ������ ����2010 ������� ����� �� �0���� ���'�� ���8� �����:�� �������� 5(��� ��%� H�: �3� <�� ���%� -2009.

21
������ 2010 ���)37(
����� ��$�- ����.+ ��� ���� #$��" '.�� :�B���
��/ F�0� F���� ����� �� �:G� �3��� 2;�� �&����0� ,�: ������� ���� �� ��� ��� ������ �(�&�� ��:��� -����3�� $�8� ������ �&� ������� ������� �� ��� ��'� �&�� ��� -���3� ���� �� F�0��� ���� 6� )�%��3�� ����� ( *�0��� ,������ ��'� � � ��3�
�������.
����� ���� -*��'�� ��� �� _���� >�>�� �� �&���� � / �� �. ���� *��/ F�0� �� �.����� ��'�� 9�: �� @�%�# ���� ������ :#.� -*��)� F�0� F�( -Y� �� ��� � . , �� ����)%� ( ���� �� �����)%� ( �. ����� ,:�� �� ������ ���� <�/ ���%/
� ���� ��� ����� ?��� ���> ����� .���> ���.

22
������ 2010 ���)37(
����1$� 5��.�2��� 8� ����:
$%H�� ��B��� �&� F�3� ����� ���� . 'G��� ������� ���8� �� �N��� �N� �&�8� ���# E�0�� <�/ �'� . 7��>� 7�'G� ��/ ��� -$�� ,�'� ���� @��# H�:�� <�� 'G��� ,���)weighted( N'G� #
�>� �M)un-weighted( �&N�8� ��� ������� ���� �� ������ ���� ;:P� �>��� 'G��� -������� ���� 3� ����� ���� ���� ��� ;:P�� �>��� �M ��# �&� A������ . �� ���� 'G��� ��%��
�&�� � ����� �&�8� ��� �& ��# 2���� �&��� ,��� ,�� ����� H(�": �&� ���'�� .� ��� A��� ��N� �N� �N� F��8� ��� <��� �� � \��� ��� 1���� �� ��:���� ���'�� ���� ������ *��� 'G���
F��8� ���� <�� @��� ��B��� ���� A��� � .
�&�8� ��� <�� ������� �� ��� �&��� �� $� �������� �&�8� ��� ;:P� ��'G��� �� :J 4� ?��.�&� A������.
'��� $%H� �� ������� ���� �� ��� �� ������,# ��'� ����� ��1997 ������ F��3� 7������ 7��� ���� ]� ���8� E;&� ����� E�0��� ��� � �&�8� ���#"F�3�� 'G� ." ���:� 1�� �� �� ��
��� ���� 3�� $��0 <�� ��>� � '� �0�� ���' '� �� ���� ���� �� ������ ����"� ,��� ���0 ��M/ ���# ������ �� -����07/07/1997 �N��� ���N 6� � F��# � 3��
����8� ����100 � 3�.
�� � �� ��:���� ���'�� ���� ���3� *���/ ��� ��� ,� ���&� ��A� <N�� [@�N�� F�N3�� N'G� ������� ���� ���),����� �0 -�������� �&�8� ��� �N��3�� -,��N��� ��N�# ��� -��3!"�� ��� -
�&��� ��� ,��� -������.(
��� ���&� ��2006 V�"�� F�3�� 'G� ���� *���> ��12 ��'
4� Q$2�� *��� '>$ ������ ��&0�� ,�� �� ,0���� ������� ��.����� ��'�� ,�� F#.
4� :����� *��� '>$ @>0����������� ,�� �� 1� A������ �� 2;�� 1� Z"��� ,���� F# ��.
;�+��� *��� '>$ ��������� ,�� �� ���� �� 2;�� 1� A������ ,���� F# �� @>0��.
80�> ������ ��� �&��� ,�� ," � �%3� ��'�� �&� �3� ����>� �. �&N�# *N" �� ����>��� �� 1��"�

23
������ 2010 ���)37(
����� .F# �� *���> �&�# ,�' �� ����>��� ���� ��'�� ,��.
����� 80�A� �. ,��� ����� ��# � �&��� � �� ����� ?�" ��"��� �� �N(�&�� N�� ,N" �� - �N�����< ����>� Z��8� *��/ F�0� � -� ��# ��'�� �33 �� �;/ �&�� # �&�� @>0 $�>� ��'�� . N�<
�&�8� ��� ��3 ��� ]" ��� ��'�� ��!"� ��� � �N�� ������� ��� ��3 ��� ]" ��� ������*>������ �&�8�.
$�R 80�A� �+ ��$�������
��3�� �� ���� �&�8� �. �&� �"�:�� ���'�� A� � �N��� �� �&�&�# 9��) � # ���N�� <��N�� ' 9��)������.
80�A���$��� ��'�� �&�# <��� �0���� ��-������ ���� $��0 ������� ���8� N' �N��� �&��N� ��������9��`� �� A0�< ���� �&� ��>���� ���'���&0��/.
#E����� 80�A� �3 �&���� V��� ���� �&�8� �� �(�7� $���� � ����%/ �&��� A �" �&� ��� �&���� ," � �# ,�� 2������� ������� �&�8� ��� �� ��3��# �� ," �� < ��� ��'�� Z��# �� �����&�# �N� �N��P� ������
�&�3 ��� ," �� ������� ��� ��� ������� �&�8� ��� ,�� ��'�� ��!"� ���.
80�. ��(��� ����� ���� �� ��'�� �&� ��.
80�. ����)� ����� ���8� ���� �� �&�8� ��"/ ��� ��'�� �&� ��.
80�. ��$�+�� ����� �&� A������ �&�8� ��� <�� ���3� ���.����� �3 ���" ,��� ��'�� ���� �� �&��� ����.
#$��� Q��$> 1��/ ���%� ��'�� V� ���" �� E>�0� � ��� ���3����� ������ Z��# �� >0� ���.
����$�� $1��B �3����� ������ (��: �� ������� 1��� ���%� ����� ,�: (��: �� 1��0�� �� ��.
����E��� ���� V%� -*�!�� ���&� �� ������ >���� ��(�� �. ��'�� ,�� F# �":�� ,"8� ����.

24
������ 2010 ���)37(
!.� �1�� 80�� V��� ���"/ �&�8� ����&� A������.
80�� ��$�� *��% )�������� �&�8� ��� ����� *�� ,�:/ �&� A������ �&�8� ���*(100.
80�. ;E��� S�$� ��>��� ���3��� Z��8� / �&�8� ��� �&� A������.
!" ��(��� ����� �������$�+�� )80�.(
�� ��M)�)�&��� ������ ���3��/ ( �&��� ������� ���3��.
$� <��?� 80�� ����M)� <�� ���3� �&��� <�� �(����.
80�� ��$ (%) ) ��>��� Z��8�/�� ��M)�*(100
�1�� !" ��(��� ����� ������ ���3��/V��� ���"
���� !.� �1�� ��� ����
(%) )V��� ���"/���.����� �3 *(100

25
������ 2010 ���)37(
����� ��$�- ����.+ ��� �+ C�?�A� ����� ��$�A� 5��$% ����� ��$�A� ��$% 8�� $���� *�2�6 G�B%> ����� *�2�6
����.+� ��$A������ 5�$��9��6
���� C6� *���
������ ��� 7� 8�$ – Z!�� *��� – 2 c Y� �� ��� A�
H. A)1922(
�: 2987778 02 ]: 2987779 02
�����/ ��� :[email protected] ������/ � !" :www.jopfico.com
����� ��$�- #����� !�$ ���$��
��.�
��� �� # 7� 8�$ – �(����� 4�'– �0�� *���– 1 –
H. A)2030(
�: 2403090 02 ]: 2403091 02
�����/ ��� :[email protected]
������/ � !" :www.united.ps
*�: U! � '.��� ������� $�0�– 6 �: 2393090 09 ]: 2393091 09
6�' ,�&� *>M
,����– �'�� 9�– 4 �: 2833090 08 ]: 2833000 08
$��9��6 <�0�
����� ��$�A��
@$2�� C��2�
) *���T� 81�(
8�� $����(
?������ .� '.��� c ���(�� >����c 2�0��� >����c ,��3�
���8� ��.8� ?����c H. A)143(
�: 5c2386111 09 ]: 2386119 09
�����/ ��� :[email protected]
������/ � !" :www.targetinvest.ps
�� �� ���# �*�.B – �' �� ��
��.;�� 9��� *��� c 1 H. A)691(
�: 2253038 02 ]: 2253037 02
����� ��$�- ������ �2� ���>
Z� � �0�# 7� 8�$ c -���.8� ����� -���.8� ������ 4�'2 H. A)1983(
�: 0/2980421 02 ]: 2987277 02
�����/ ��� :[email protected] ������/ � !" :www.alwatanieh.ps
���� ������ #ER – ,����– ���� *.�3�� ?�� A�
�: 2841517 08 ]: 2841527 08
����� ��$�- ����� ��6� ����
��3��� ,���
'.��� – 4�'����� 2�� – ��� ����0 ����� H. A)1776(
�: 1/2387880 09 – 2333164 09 ]: 2385060 09
�����/ ��� [email protected]: ������/ � !" :www.gsc.ps
$��9��6 80� ����� ��$�A��
��$E $��� ���" �� � 7� 8�$ – ��"����c �&� *��� c ]�: ����
?�� ���0�� H.A )2187(
�: 2965710 02 ]: 2965713 02
�����/ ��� :inv.com-sahem@sahem ������/ � !" :www.sahem-inv.com

26
������ 2010 ���)37(
�!�� �� #
#ER– ,����– ��'�� 4�'
�: 2869330 08 ]: 2869110 08
��.�� �# ��� '��� ��B – �!�� *���– $���� ��� �� ���3�� 4�'
� :2064910 08 ] :2054287 08
5�$��9��6 '�������
��%� �$��
H�"� �(�
#$��� – ��'��– F�3�� 4�' H. A)79(
� :2971729 02 ] :2971727 02
�����/ ��� :[email protected] ������/ � !" :www.lotus-invest.ps
����������� ��$�-
����$+ ���2
]�'�� �� �
#ER
,����– ��:��� �� 4�'– �� ��� ?�� 9� �� ���– 9.
H.A )1213(
� :2886050 08 ] :2886055 08
�����/ ��� :[email protected] ������/ � !" :www.alwasata.ps
F��� �� �
7� 8�$ ,���� 4�' c ���� *��� 1
� :2975371 02 �:/ 6/72955175 02 ] :2975373 02
����� 5�$��9��6 '$��� ���E� E��+ ��> F����
8� 5��
F�3�� 4�'/ � � ��� c ��582 c ?���� *��� ��� ��!�� ����)�c�� �3��� ,��3�
H.A )212(
� :2746560 02 ] :2746570 02
�����/ ��� :[email protected] ������/ � !" :www.nawras.ps
$��9��6 :�$� ��$� ����� ��� ��B ��� ���� �
�0���
Y� �� �� ��� *�����– ����� ?���� *���– 1 H -. A
)1476(
�: 2980240 02 ] :2980249 02

27
������ 2010 ���)37(
��6��

28
������ 2010 ���)37(
���. ����&� ��%�� *6B$0% ����� 2010
Total Monthly Activity for April 2010
Company
���
80�A�
�������
80�A� ���(
�������
)$)��(
���5���2�
��(��� �����
)$)��(
!.�>
$�
!��>
$�
$�
�6R&� �.�� E�$�
��$%�
Volume Value ($) No. of Trans.
Market Capitalization
($)
High Price
Low Price
Closing Price
Currency Symbol
Al- Wataniah Towers
68,205 85,797 61 11,500,000 1.4 1.1 1.15 $ ABRAJ اج ا�������� أ
Arab Concrete Products*
0 0 0 288,575 -- -- 0.31 JD ACPC ت ا�!���ن�#�$��� ���� *ا�%
Arab Hotels 141,655 168,995 19 31,382,223 0.94 0.81 0.89 JD AHC دق��)*� ���� ا��,�+� ا�%
Arab Islamic Bank 159,973 175,812 187 43,545,725 1.14 1.06 1.07 $ AIB -�� ا�!�1 ا�0/م- ا�%
Ahliea Insurance Group
2,266,740 1,396,997 325 19,764,615 0.7 0.58 0.59 $ AIG 2ا���5��6 ا0ه*�� �*$3م�
Alrafah Microfainance Bank
2,128,213 1,859,098 583 26,100,000 0.9 0.85 0.87 $ AMB ��1 ا��=�> �$��ی; ا��:�ری7
ا�@?��ة
Arab Co. for Paints Products
0 0 0 3,131,170 -- -- 1.48 JD APC ه�ن�تB�5 ا���@� ���� ا�%
Arab Investors 20,028 16,047 16 7,999,148 0.6 0.53 0.6 JD ARAB ب��ون ا�%�E$+ا��
The Arab Real Estate Est.
9,480 8,808 12 896,694 0.7 0.64 0.67 JD ARE ���� ا��,�+� ا�%�Fری� ا�%
Palestine Poultry 33,623 82,522 57 31,311,701 1.95 1.47 1.85 JD AZIZA 2�G+*= 2#دوا
Bank Of Palestine 1,602,948 5,940,237 1,160 370,000,000 3.79 3.65 3.7 $ BOP 2�G+*= 1��
Birzeit Pharmaceutical
78,956 435,743 60 63,145,264 4.1 3.7 3.7 JD BPC دوی�H� Iزی���
GLOBALCOM Telecommunications
69,206 64,233 70 8,577,649 0.98 0.9 0.9 $ GCOM ل آ�م �/ت@�0ت���*#
Golden Wheat Mills 22,132 22,584 27 15,655,851 0.75 0.71 0.74 JD GMC -!هPا� Q�F2 ا�R�Gم
Grand Park Hotel & Resorts*
0 0 0 1,598,181 -- -- -- JD HOTEL * رك �*(��دق وا�0$��6م�� Bان�#
Al-I'Timan for Investment & Development*
0 0 0 4,287,728 -- -- 0.76 JD IID ����$ر وا���E$�/� ن��$T0ا*
Palestine Islamic Bank
1,122,435 959,655 472 30,549,924 0.89 0.84 0.85 $ ISBK ���$*� -��G+*)ا�!�1 ا�0/م- ا�
وا�$��ی;
Jerusalem Cigarette 64,791 259,860 96 28,631,871 2.9 2.67 2.9 JD JCC س مBFا� � م.ع.��6ی
Jerusalem Pharmaceutical
18,956 116,852 49 31,734,833 4.52 4.15 4.5 JD JPH ��!Gات ا��WX$+�*� سBFا�
Jerusalem Real Estate Investment
0 0 0 9,000,000 -- -- 0.9 $ JREI %رات ا���E$�/� سBFا�Fری��
Palestine Plastic Industrial
70,000 34,432 51 3,751,762 0.38 0.29 0.38 JD LADAEN 2TاB*2 �@���5ت ا��G+*=

29
������ 2010 ���)37(
AL.Mashriq Insurance
41,200 28,857 6 5,256,000 0.73 0.7 0.73 $ MIC 2ق �*$�م�� ا��:
The National Carton Industry
895,089 499,672 431 3,385,049 0.48 0.29 0.48 JD NCI ت�ن�Yا������ �@���5 ا�
National Insurance 46,593 170,657 39 36,000,000 3.85 3.6 3.6 $ NIC ا�$3م�2 ا������
Nablus Surgical Center
52,740 73,770 17 3,720,147 1 0.83 0.83 JD NSC -@@Z$ا� -Rا� م�آ\ ن��*] ا�6
Palestine Development & Investment Ltd.
5,050,925 6,926,464 1,961 340,000,000 1.43 1.3 1.36 $ PADICO ر��E$�02 �*$���� وا�G+*=)�Yدی��(
Palestine Telecommunication
958,566 6,980,350 850 963,517,117 5.27 5.09 5.19 JD PALTEL ����G+*)ا0ت@�0ت ا�
Palestine Commercial Bank
175,246 134,856 49 23,720,584 0.81 0.74 0.79 $ PCB -��G+*)ا�!�1 ا�$�6ري ا�
Palestin Electric 300,752 320,873 214 57,600,000 1.09 0.96 0.96 $ PEC ء����Y*� ����G+*)ا�
Palestine Investment Bank
170,057 205,506 37 48,800,000 1.22 1.2 1.22 $ PIBC -��G+*)ر ا���E$�01 ا��
Palestine Investment & Development
25,989 37,128 11 7,031,919 1.03 1 1.03 JD PID ر وا0ن��ء��E$�/� ����G+*)ا�
Palestine Industrial Investment
1,364,999 1,704,200 914 22,214,383 0.95 0.79 0.84 JD PIIC -5��@ر ا���E$�/� 2�G+*=
Arab Palestinian Shopping Centers
707 723 3 6,911,141 0.73 0.7 0.7 JD PLAZA اآ\ ا�$+�ق��� ����G+*)ا� ���� ا�%
Palestine Real Estate Investment
133,450 138,597 128 51,385,013 0.77 0.7 0.75 JD PRICO ري�F%ر ا���E$�/� 2�G+*=
AlQuds Bank for Development & Investment
156,372 178,467 69 57,500,000 1.16 1.08 1.15 $ QUDS ر��E$�0س �*$���� واBF1 ا���
Trust International Insurance
13,525 37,667 5 21,945,000 2.8 2.66 2.66 $ TRUST 2ا�%����� �*$�م� I�� ت
Union Construction And Investment
2,400,810 1,475,659 211 24,400,000 0.69 0.61 0.61 $ UCI ر��E$�0��5ر و اa� د�Xا0ت
The Vegetable Oil Industries
4,792 17,723 9 14,781,380 2.67 2.47 2.62 JD VOIC م@�ن7 ا�\ی�ت ا��!�ت��
The Palestinian Company for Distribution
52,750 42,918 115 5,133,991 0.59 0.56 0.56 JD WASSEL ا�(*+����G �*$�زی7 و ا�BZم�ت
ا�*�#+$��
Total 19,721,903 30,601,760 8,314 2,436,154,640 ;�����
*,����� �� ]�� ��'�� �&� *Symbol is suspended

30
������ 2010 ���)37(
����&� ��%��!�A� ��$A� $�0%. 2010
Total Monthly Activity for First Four Months 2010
Company
80�A� ���
�������
80�A� ���(
�������
)$)��(
���5���2�
��(��� �����
)$)��(
!.�>
$�
!��>
$�
$�
�6R&� �.�� E�$�
��$%�
Volume Value ($) No. of Trans.
Market Capitalization
($)
High Price
Low Price
Closing Price
Currency Symbol
Al- Wataniah Towers 68,205 85,797 61 11,500,000 1.4 1.1 1.15 $ ABRAJ اج ا�������� أ
Arab Concrete Products*
0 0 0 288,575 -- -- 0.31 JD ACPC ت ا�!���ن�#�$��� ���� *ا�%
Arab Hotels 897,752 1,153,084 117 31,382,223 1 0.81 0.89 JD AHC دق��)*� ���� ا��,�+� ا�%
Arab Islamic Bank 528,023 596,260 558 43,545,725 1.2 1.06 1.07 $ AIB -�� ا�!�1 ا�b/م- ا�%
Ahliea Insurance Group 5,781,924 3,984,746 1,367 19,764,615 0.84 0.58 0.59 $ AIG 2ه*�� �*$3م�cا���5��6 ا
Alrafah Microfainance Bank
7,180,022 5,927,903 2,435 26,100,000 0.9 0.7 0.87 $ AMB ة���1 ا��=�> �$��ی; ا��:�ری7 ا�@?�
Arab Co. for Paints Products
12,665 22,942 17 3,131,170 1.48 1.1 1.48 JD APC ه�ن�تB�5 ا���@� ���� ا�%
Arab Investors 54,193 44,731 60 7,999,148 0.66 0.53 0.6 JD ARAB ب��ون ا�%�E$+ا��
The Arab Real Estate Est.
76,234 63,678 81 896,694 0.7 0.48 0.67 JD ARE ���� ا��,�+� ا�%�Fری� ا�%
Palestine Poultry 131,835 282,411 125 31,311,701 1.95 1.26 1.85 JD AZIZA 2�G+*= 2#دوا
Bank Of Palestine 4,054,483 14,972,361 2,214 370,000,000 3.8 3.62 3.7 $ BOP 2�G+*= 1��
Birzeit Pharmaceutical 456,804 2,554,826 334 63,145,264 4.25 3.7 3.7 JD BPC دوی�H� Iزی���
GLOBALCOM Telecommunications
614,719 580,617 445 8,577,649 1 0.9 0.9 $ GCOM ل آ�م �/ت@�0ت���*#
Golden Wheat Mills 184,370 195,517 147 15,655,851 0.81 0.71 0.74 JD GMC -!هPا� Q�F2 ا�R�Gم
Grand Park Hotel & Resorts*
0 0 0 1,598,181 -- -- -- JD HOTEL * رك �*(��دق وا�0$��6م�� Bان�#
Al-I'Timan for Investment & Development*
2,000 2,144 0 4,287,728 -- -- 0.76 JD IID ����$ر وا���E$�/� ن��$T0ا*
Palestine Islamic Bank 5,597,569 4,518,576 1,657 30,549,924 0.9 0.67 0.85 $ ISBK ���$*� -��G+*)ا�!�1 ا�0/م- ا�
وا�$��ی;Jerusalem Cigarette 423,489 1,720,597 316 28,631,871 2.93 2.67 2.9 JD JCC س مBFا� � م.ع.��6ی
Jerusalem Pharmaceutical
64,949 396,484 134 31,734,833 4.52 3.85 4.50 JD JPH ��!Gات ا��WX$+�*� سBFا�
Jerusalem Real Estate Investment
1,000 900 1 9,000,000 0.9 0.9 0.9 $ JREI رات ا�%�ری���E$�/� سBFا�
Palestine Plastic Industrial
105,900 49,189 87 3,751,762 0.38 0.28 0.38 JD LADAEN 2TاB*2 �@���5ت ا��G+*=

31
������ 2010 ���)37(
AL.Mashriq Insurance 119,877 82,100 59 5,256,000 0.73 0.57 0.73 $ MIC 2ق �*$�م�� ا��:
The National Carton Industry
1,149,008 603,811 600 3,385,049 0.48 0.28 0.48 JD NCI ت�ن�Yا������ �@���5 ا�
National Insurance 134,219 567,625 163 36,000,000 5.25 3.6 3.6 $ NIC ا�$3م�2 ا������
Nablus Surgical Center 463,100 521,810 113 3,720,147 1.01 0.56 0.83 JD NSC -@@Z$ا� -Rا� م�آ\ ن��*] ا�6
Palestine Development & Investment Ltd.
19,240,154 24,980,217 6,560 340,000,000 1.43 1.17 1.36 $ PADICO ر��E$�02 �*$���� وا�G+*=)�Yدی��(
Palestine Telecommunication
9,303,068 73,249,541 4,072 963,517,117 5.82 5.07 5.19 JD PALTEL ����G+*)ا0ت@�0ت ا�
Palestine Commercial Bank
796,881 601,409 213 23,720,584 0.81 0.7 0.79 $ PCB -��G+*)ا�!�1 ا�$�6ري ا�
Palestin Electric 906,884 971,920 745 57,600,000 1.11 0.96 0.96 $ PEC ء����Y*� ����G+*)ا�
Palestine Investment Bank
14,336,497 17,489,140 157 48,800,000 1.26 1.2 1.22 $ PIBC -��G+*)ر ا���E$�01 ا��
Palestine Investment & Development
104,710 144,469 46 7,031,919 1.03 0.95 1.03 JD PID ر وا0ن��ء��E$�/� ����G+*)ا�
Palestine Industrial Investment
2,981,847 3,401,235 1,948 22,214,383 0.95 0.66 0.84 JD PIIC -5��@ر ا���E$�/� 2�G+*=
Arab Palestinian Shopping Centers
29,757 31,678 34 6,911,141 0.8 0.68 0.7 JD PLAZA اآ\ ا�$+�ق��� ����G+*)ا� ���� ا�%
Palestine Real Estate Investment
579,254 625,846 351 51,385,013 0.82 0.7 0.75 JD PRICO ري�F%ر ا���E$�/� 2�G+*=
AlQuds Bank for Development & Investment
741,327 854,998 229 57,500,000 1.22 1.06 1.15 $ QUDS ر��E$�0س �*$���� واBF1 ا���
Trust International Insurance
39,608 110,604 20 21,945,000 3 2.43 2.66 $ TRUST 2ا�%����� �*$�م� I�� ت
Union Construction And Investment
3,873,521 2,526,077 1,004 24,400,000 0.8 0.61 0.61 $ UCI ر��E$�0��5ر و اa� د�Xا0ت
The Vegetable Oil Industries
398,109 1,437,927 49 14,781,380 2.67 2.09 2.62 JD VOIC م@�ن7 ا�\ی�ت ا��!�ت��
The Palestinian Company for Distribution
290,254 234,350 520 5,133,991 0.6 0.55 0.56 JD WASSEL ا�(*+����G �*$�زی7 و ا�BZم�ت
ا�*�#+$��
Total 81,724,211 165,587,520 27,039 2,436,154,640 ;�����
*,����� �� ]�� ��'�� �&� *Symbol is suspended

32
������ 2010 ���)37(
� ��%� ���9� ����� �� #$��. ���. ����&� @$0%�2008 ���L������ 2010 Monthly Activity from March 2008 to April 2010 Total
ا�%�او�� ا01/�.د ا�*/� � ا�%�او�� ا%�3�/01
)دو�ر(� .د ا�45�ت .د +�7Cت ا��اول%� ا����� ا�*/�ي م$#� ا�س )دو�ر( ا��367�ا�
Month Volume Value ($)
No of Trading Sessions
No. of Trans.
Market Capitalization ($)
Al-Quds Index Monthly Change (%)
20
08
January ���������� 37,354,504 140,035,019 19 19,065 2,737,294,310 596.09 13.05
February ��' 23,558,541 78,328,491 20 13,894 2,748,730,151 599.69 0.60
March �;� 45,734,845 128,773,435 21 14,586 2,958,386,109 655.22 9.92
April ����� 57,136,704 234,391,991 22 24,841 3,186,504,843 714.00 8.97
May ��# 42,806,684 182,778,312 20 14,499 3,143,491,482 696.70 -2.42
June ���> 37,097,216 122,328,548 22 14,954 3,117,505,020 688.58 -1.17
July >�� 13,725,934 47,443,378 22 8,429 3,161,510,540 702.34 2.00
August AJ 15,740,058 44,019,823 21 8,406 2,976,996,370 660.50 -5.96
September ,��# 14,932,240 70,620,183 21 6,969 2,907,247,294 644.84 -2.37
October ,# ��'� 18,807,766 58,908,502 20 10,996 2,467,686,284 538.85 -16.44
November ���� ��'� 19,888,658 40,337,444 21 9,370 2,025,329,088 423.53 -21.40
December 4.28 441.66 2,123,057,098 6,310 15 37,239,085 12,385,657 آ�ن�ن أول
Total 2008 339,168,807 1,185,204,211 244 152,319 2008ا�%9%6ع Annual Growth -16.23
2009
January ���� ���� 9,904,191 30,221,573 19 7,246 2,385,338,224 510.22 15.52
February d�' 50,379,270 66,327,241 20 9,352 2,376,112,218 510.35 0.03
March �;J 30,950,803 92,492,451 21 12,028 2,381,619,894 514.61 0.83
April ����� 16,781,178 46,510,476 22 8,151 2,389,257,635 517.70 0.60
May ��# 11,152,862 28,826,278 21 7,015 2,358,620,155 512.03 -1.10%
June ���> 26,709,441 70,182,318 22 9,667 2,412,088,322 524.85 2.50%
July >�� 11,915,484 19,942,471 21 5,199 2,286,880,391 488.77 -6.87%
August A# 12,001,563 27,936,347 22 6,272 2,333,736,618 498.45 1.98%
September ,��# 26,897,939 32,682,342 18 6,211 2,363,946,922 498.92 0.09%
October ��'�,# 14,850,249 29,981,599 21 7,032 2,391,193,250 500.18 0.25%
November ���� ��'� 8,678,581 21,069,785 18 4,901 2,397,047,671 502.12 0.39%
December ����,# 18,655,812 34,220,518 21 5,764 2,375,366,531 493.00 -1.82%
2010
Total 2009 238,877,373 500,393,398 246 88,838 2009ا�%9%6ع Annual Growth 11.62
January -1.91 502.43 2,409,067,998 5,203 20 20,965,047 10,117,254 آ�ن�ن ث�ن%
February 4.53 525.18 2,501,276,950 7,014 20 70,292,521 33,321,492 ش!�ط%
March ذارh 18,563,562 43,728,192 23 6,508 2,420,244,532 503.17 -4.19%
April 0.29- 501.72 2,436,154,640 8,314 21 30,601,760 19,721,903 ن�+�ن%
*Total 2010 81,724,211 165,587,520 84 27,039 2010ا�%9%6ع * Annual Growth 1.77

33
������ 2010 ���)37(
Till 31/03/2010 �31/03/2010?�ی�
2010 - 1997����ط ا����ي ا������ ����ق ���ة ا
Total Yearly Activity from 1997 to 2010
� ا�7&.د +�7Cت
ا��اول ا01/�.د
� ا�%�او� � ا�%�او�� ا%�3�/01
)دو�ر( .د ا�45�ت
Hل ا��6ما�%? ا01/��?د
� ا�%�او�
Hل ا��6ما�%? �%� ا01/��
�ا�%�او� )دو�ر(
ا�%?ل ا��6مH �?د
ا�45�ت
�%� ا��367�ا� )دو�ر(
م$#� ا�س آ%�
ب��ر�Jه6 12/31
ا����� ا�7&6ي �H م$#�
(%) ا�س
Year No. of
Trading Sessions
Volume Value ($) No. of Trans
Daily Average
Turnover Volume
Daily Average
Turnover Value ($)
Daily Average
Turnover Trans.
Market Capitalization
($)
Al - Quds Index
Al - Quds Index Yearly
Growth (%)
1997 66 10,000,276 25,158,471 1,957 151,519 381,189 30 529,057,368 139.13 ----
1998 100 16,782,498 68,642,344 7,639 167,825 686,423 76 587,876,243 154.98 11.39
1999 146 68,892,607 150,243,919 10,625 471,867 1,029,068 73 848,935,775 236.76 52.77
2000 211 93,351,075 188,982,443 20,143 442,422 895,651 95 766,018,025 207.62 -12.31
2001 161 33,456,535 74,528,351 8,205 207,805 462,909 51 722,631,785 195.00 -6.08
2002 100 18,666,938 45,084,654 4,579 186,669 450,847 46 576,593,466 151.16 -22.48
2003 223 40,350,788 58,326,445 10,552 180,945 261,554 47 650,468,928 179.81 18.95
2004 244 103,642,845 200,556,709 27,296 424,766 821,954 112 1,096,525,380 277.56 54.36
2005 246 369,567,295 2,096,178,223 166,807 1,502,306 8,521,050 678 4,457,227,305 1128.59 306.61
2006 238 222,689,351 1,067,367,951 150,592 935,670 4,484,739 633 2,728,811,088 605.00 -46.39
2007 248 299,422,814 813,469,091 157,300 1,207,350 3,280,117 634 2,474,679018 527.26 -12.85
2008 244 339,168,807 1,185,204,211 152,319 036,390,1 4,857,394 624 2,123,057,098 441.66 -16.23
2009 246 238,877,373 500,393,398 88,838 971,046 2,034,119 361 2,375,366,531 493.00 11.62
2010* 84 81,724,211 165,587,520 27,039 972,907 1,971,280 321 2,436,154,640 501.72 1.77
Total 833,891 6,639,723,730 1,936,593,413 2,557 ا�%9%6ع
���B�30/04/2010 Till 30/04/2010

34
������ 2010 ���)37(
4NNNNNNN����
7����:��� �������� ��# ���3� ���� ��� ��N"�:��� ,N�� �N�2��"���� �3�� 4��" ���������. ��N ���� 2PN� AN �
�" / ������� *'��� @��M)�@ �!�� ����' �&��%�� �� =:# � ��3� �� ,��1�� ����.
�N�� �N&� ��/ �&����� <�� ��&'�� *'��� E;. ���:��� $0'� AM��*�(�!�� �����.