Prospects on the Substitution of Natural Gas for Coal in China2015/11/2 2 3 1.1 Natural gas demand...
19
CNPC Economics &Technology Research Institute 中国石油经济技术研究院 CNPC Prospects on the Substitution of Natural Gas for Coal in China The 9 th IEEJ-CNPC Oil Market Workshop CNPC Economics & Technology Research Institute Nov. 3 rd , 2015 Wang Haibo 1. Challenges and Opportunities of Natural Gas Market in China 2. Experiences of Developed Countries 3. Market Potential of Coal-to-Gas Switch in China 4. Summary and Suggestions Content 2 31 IEEJ:November 2015, All Rights Reserved.
Transcript of Prospects on the Substitution of Natural Gas for Coal in China2015/11/2 2 3 1.1 Natural gas demand...

2015/11/2
1
CNPC Economics &Technology Research Institute
中国石油经济技术研究院
CNPC
Prospects on the Substitution of
Natural Gas for Coal in China
The 9th IEEJ-CNPC Oil Market Workshop
CNPC Economics & Technology Research Institute
Nov. 3rd, 2015
Wang Haibo
1. Challenges and Opportunities of Natural
Gas Market in China
2. Experiences of Developed Countries
3. Market Potential of Coal-to-Gas Switch in
China
4. Summary and Suggestions
Content
2
31
IEEJ:November 2015, All Rights Reserved.

2015/11/2
2
3
1.1 Natural gas demand growth slowed down
From 2000 to 2013, China’s natural gas market has been rapidly growing, with
natural gas consumption increasing by 16.1%/year, from 24.5 bcm to 170.5 bcm.
Driven by economic slowdown, price reform, mild weather and the penetration of
alternative energy sources, demand growth rate declined to 8.6% year on year in 2014
and further declined to 2.5% for the first 9 months in 2015.
China’s monthly natural gas consumption and growth rate 2013-2015
-10%
0%
10%
20%
30%
40%
0
5
10
15
20
25
1 2 3 4 5 6 7 8 9 10 11 12 1 2 3 4 5 6 7 8 9 10 11 12 1 2 3 4 5 6 7 8 9
2013 2014 2015
Gro
wth
rat
e(%
)
Nat
ural
gas
con
sum
ptio
n (b
cm)
gas consumption growth rate
4
1.2 Surplus of gas supply
China’s gas demand in 2015 is expected to be 192 bcm, 10 bcm lower than
supply, and nearly 40 bcm lower than the goal of 12th Five-Year-Plan.
With many long term contracts coming online in the next few years, at least
15 bcm annual incremental demand is needed to absorb the excess resource.
Long term contracts coming online in the next few years
Buyer Resource Volume(mtpa)
Period(yr)
Contract year
Delivery start year
CNOOC
TOTAL Portfolio 1 11 2014 2014
BG QCLNG 3.6 20 2010 2014
BG combined resources 5 20 2012 2015
CNPCShell Gorgon 2 20 2008 2016
ExxonMobil Gorgon 2.25 20 2009 2016
Sinopec
PNG LNG 2 20 2009 2014
APLNG 4.3 20 2011 2015
APLNG 3.3 20 2011 2016
32
IEEJ:November 2015, All Rights Reserved.

2015/11/2
3
5
1.3 Natural gas price remains high
From July 2014 to September 2015, city gate price of existing gas in
Shanghai increased by 18%, from 2.44 RMB/m3 to 2.88 RMB/m3, while the
prices of coal and oil dropped sharply.
The domestic natural gas price comes close to LPG and fuel oil, and is
three times higher than coal.
Price of China’s coal, gas and oil 7/2013 -9/2015
0
30
60
90
120
0
200
400
600
800
Jul-13 Oct-13 Jan-14 Apr-14 Jul-14 Oct-14 Jan-15 Apr-15 Jul-15
Cru
de o
il($/
b)
Coa
l Pric
e (
RM
B/t)
Qinhuangdao power fine coal(Q5500)closing price Brent spot
6
1.4 Infrastructure is falling behind
By the end of 2014, China’s total natural gas pipeline length amounted to
435, 000 km, including 65, 000 km of transmission pipelines.
With a similar geographical size, the transmission and distribution natural
gas pipeline lengths in the United States are 7.7 and 5.4 times of in China.
By 2014, there are 11 gas storage facilities in China, with total capacity 4.3
bcm, only around 2.4 % of total gas consumption, far below world’s average.
Population (100millions)
Area(10, 000
km2)
Transmission pipeline (10, 000 km)
Distributionpipeline (10,
000 km)
Transmission pipeline intensity
(km/10, 000 km2)
Distribution pipeline intensity
(km/10, 000 km2)
China 13.7 963 6.5 37 67.5 415
US 3.1 960 50 200 521 2083
France 0.66 55 3.8 20 691 3636
The pipeline networks of China, United States and France
33
IEEJ:November 2015, All Rights Reserved.

2015/11/2
4
7
1.5 Huge market potential
China’s per capita natural gas consumption was 135 m3 in 2014 and natural
gas penetration in total primary energy consumption is only 6%, while the world
averages were 467 m3 and 23.7%.
China’s natural gas market development is still in relative early stage. 1.4
billion population would mean 650 bcm natural gas demand, if calculated with
world average consumption level.Natural gas consumption per capita and share in primary energy consumption
0%
10%
20%
30%
40%
50%
60%
0
500
1000
1500
2000
2500
3000
%m3
Natural gas consumption per capita Natural gas consumption in primary energy consumption
8
1.6 Opportunities from environmental protection
China’s energy mix has caused serious air pollution. As the major carbon
emitter in the world, China has also promised to limit its carbon emissions.
Before the technical breakthrough of new and renewable energy, natural
gas will be the most viable bridging fuel.
34
IEEJ:November 2015, All Rights Reserved.

2015/11/2
5
9
1.7 Coal-to-gas switch is the main direction
Natural gas has been growing as an alternative fuel in China.
While the demand of natural gas in traditional industries and transportation
sector is expected to be weak, the market takes a positive view on the demand
in coal-to-gas switch.
Natural gas
Fuel oil
Coal
LPG
ElectricityDiesel
Gasoline
Methanol
10
China’s coal consumption intensity
1.8 Coastal China will be the target region
Beijing-Tianjin-Hebei-Shandong Region, Yangtze River Delta and Peral River Delta
are coal demand centers with extreme environmental protection pressure.
The emission level in where coal power plants concentrated is 5 times of national
average, leaving potentials for gas power development.China’s hazy weather days in 2013
35
IEEJ:November 2015, All Rights Reserved.
2015/11/2
6
1. Challenges and Opportunities of Natural
Gas Market in China
2. Experiences of Developed Countries
3. Market Potential of Coal-to-Gas Switch in
China
4. Summary and Suggestions
Content
11
12
2.1 Environmental regulation is the key
US EPA carries out several policies to control the pollutions in industrial
sector in the past two decades.
Mercury and Air Toxis Standards(Hg etc.)
Aug 2012Struck down
2004
2014
2015
Preparation Draft rule Final rule
2000 2005 2010 2015
Clean Air Market program(NOX, SO2)
Regional Haze Program(PM, NOX, SO2)
Cooling Water intake structure
Coal Combustion Residuals(CCRs)CO2 Existing Source Performance Standard(CO2)CO2 Standards for New Modified and reconstructed Power Plant(CO2)
NAAQS for fine particle pollution(PM)NAAQS for ozone(Ozone)
1995
2012
1995 2003 2011
1999 2004 2006 2012
2001 2004 2006 2015
2009 2014
2012 2015
2015
2005
2015
Source:EPA
2000
36
IEEJ:November 2015, All Rights Reserved.

2015/11/2
7
13
2.1 Environmental regulation is the key
In the single year 2002, 54 GW capacity was added into gas power
generation fleet. Gas power capacity reached to 425 GW in 2013, representing
42% in US total power capacity.
In December 2000, EPA Published Utility Air Toxics Determination and started paving the way forMercury and Air Toxis Standards (MATS)
In 1995, Acid Rain Program launched and later developed to the first national cap-and-trade program
In April 1999, EPA announced Regional Haze Program
In December 2003, EPAissued Clean Air Interstate Rule.
In December 2008, EPA issued final rule ofCoal Combustion Residuals
In July 2004 EPA revised Regional Haze Program and required target units to equip with Best Available Retrofit Technology(BART); later in 2005, inspired by Clean Air Market program, Cap and trade scheme is introduced into the Haze program as a supplemental option for compliance.
Source:EIA, EPA
0
10
20
30
40
50
60
1995 1996 1997 1998 1999 2000 2001 2002 2003 2004 2005 2006 2007 2008 2009 2010
GW
US power capacity additions and major environmental regulation progress 1995-2010
Wind OilOthers NuclearNatural gas HydroCoal
14
2.2 Gas power is cost competitive
US:According to 2001 data, driven by lower capital cost and operation and
maintenance (O&M) cost, gas power generation was more competitive than coal, amid
bearing higher fuel cost.
UK:Similar to US, gas power is more competitive than coal in UK owning to
combined cycle power generation technology advancement and more favorable lead time.
0
0.005
0.01
0.015
0.02
0.025
0.03
0.035
0.04
0.045
0.05
Coal Gas CC
1999
$/k
Wh
2005 LCOE of new build coal and gas power plants projected by EIA in 2001
Fuel O&M Capital
0
0.02
0.04
0.06
0.08
0.1
0.12
Coal Gas CC
2013
pou
nds/
kWh
2019 LCOE of new build coal and gas power plants projected by DECC in 2013
Fuel O&M Capital
Source:EIA, DECC
37
IEEJ:November 2015, All Rights Reserved.

2015/11/2
8
15
2.3 Wholesale power price reflects the cost of gas power
US:As an example of New England, the average variable cost of gas
power generation has been slightly lower than the wholesale price in the last
decade, and became even lower than coal after the shale gale.
Source:EIA, CNPC ETRI
0
200
400
600
800
1000
1200
-
0.010
0.020
0.030
0.040
0.050
0.060
0.070
0.080
0.090
0.100
2003 2004 2005 2006 2007 2008 2009 2010 2011 2012 2013
2012
cen
ts/m
mBt
u
2012
$/k
Wh
Variable costs of power generation and wholesale tariff--US New England region
Coal price deliverd to power plants Natural gas price delivered to power plantsVariable cost of coal power generation Variable cost of gas power generationWholesale tariff
16
2.4 The price of natural gas for power generation is lower than for other sectors
US:Residential customers bear the highest cost, with natural gas price two
times higher than power generation and industrialcustomers.
Europe:UK and Finland share the same situation with US.
China:Residential customers enjoy the lowest natural gas price.
4.50
12.08 13.38
17.10
4.30
11.10 9.28
12.87 11.39
22.12
18.51
11.70
0
5
10
15
20
25
美国 英国 芬兰 江苏南京
美元
/MM
Btu
工业 发电 民用
US natural gas prices by sector 1997-2014 Natural gas prices of US, UK, Finland and China(Jiangsu Nanjing) in 2013
0
2
4
6
8
10
12
14
16
1996
1997
1998
1999
2000
2001
2002
2003
2004
2005
2006
2007
2008
2009
2010
2011
2012
2013
$/Tc
f
Residential Commercial IndustrialTransportation Power generation
Source:EIA
US UK Finland Nanjing
38
IEEJ:November 2015, All Rights Reserved.

2015/11/2
9
0
200
400
600
800
1,000
1,200
Mill
ion
shor
t ton
s
Power generation Industrial-others Industrial-CHP Industrial-coking Commercial Residential Transportation17
2.5 Coal demand concentrates on power generation
Coal consumption was evenly distributed among sectors in 1950s, before coal was
gradually replaced by gas in residential, commercial, industrial sectors.
Coal consumption in power sector has steadily increased, currently accounting for
90% in total coal consumption.
US coal consumption by sector 1949-2014
Driving factors of declining coal use in power sector since 2007:1. Power demand slowdown2. Increasing competition from natural gas due to favorable fuel cost3. The penetration of renewables4. Tightening environmental policies
Source: EIA
18
2.5 Coal demand concentrates on power generation
Similar to the US, the share of coal consumption of power sector in UK’s
coal consumption increased to 80% by 2014 from 20% in early 1950s, while
coking use accounts for 13% and others account for the rest.
UK coal consumption by sectors 1949-2014
0
50
100
150
200
250
1949
1951
1953
1955
1957
1959
1961
1963
1965
1967
1969
1971
1973
1975
1977
1979
1981
1983
1985
1987
1989
1991
1993
1995
1997
1999
2001
2003
2005
2007
2009
2011
2013
Mill
ion
tons
Others Power generation Industrial-others Industrial-gas Industrial-coking Residential and commericial Transportation
Source: DECC
39
IEEJ:November 2015, All Rights Reserved.
2015/11/2
10
1. Challenges and Opportunities of Natural
Gas Market in China
2. Experiences of Developed Countries
3. Market Potential of Coal-to-Gas Switch in
China
4. Summary and Suggestions
Content
19
20
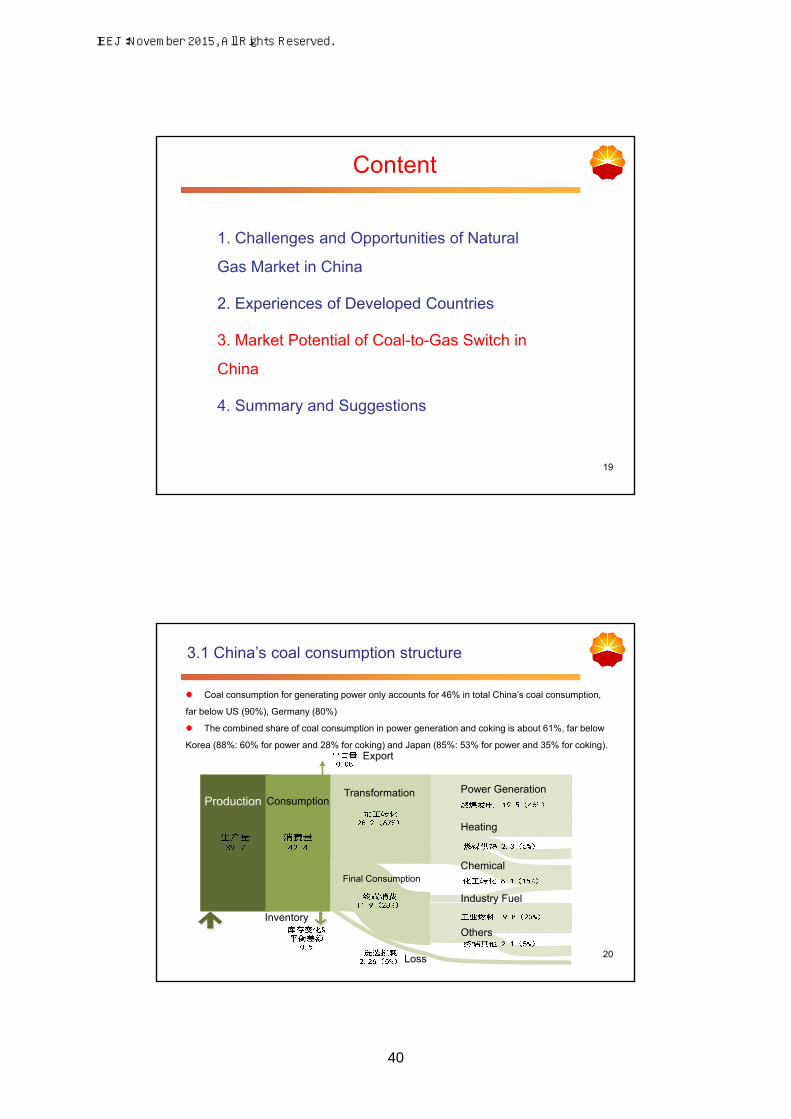
3.1 China’s coal consumption structure
Coal consumption for generating power only accounts for 46% in total China’s coal consumption,
far below US (90%), Germany (80%)
The combined share of coal consumption in power generation and coking is about 61%, far below
Korea (88%: 60% for power and 28% for coking) and Japan (85%: 53% for power and 35% for coking).
Production ConsumptionTransformation
Final Consumption
Power Generation
Heating
Chemical
Industry Fuel
Others
Loss
Inventory
Export
40
IEEJ:November 2015, All Rights Reserved.

2015/11/2
11
21
3.2 Defining key regions of coal-to-gas switch
We classified 30s provinces into three groups based on the initiatives of controlling air
pollution and future coal capacity expansion plan. Key regions of coal-to-gas displacement
(also including provincial capitals and
major municipalities in the other regions)
Major resource exporting provinces
Others
Region Issue date
Program name
National 2013-Sep National Action Plan for the Control of Air Pollution
BJ-TJ-HB2013-Sep Implementing Rule for the Control of Air Pollution
2014-Jul Treatment Scheme for the Control of Air Pollution of Key Industry
Beijing2013-Sep Clean Air Action Plan for 2013-2017
2013-Aug Limit Coal Use and Promote Clean Energy Working Plan for 2013-2017
2015-MaySpecial Working Plan on Displacing Distributive Coal Use, Transforming
Coal Boilers and Emission Control for Vehicles
Tianjin
2015-Jan Rule for Prevention and Control of Air Pollution
2013-Sep Action Plan for Prevention and Control of Air Pollution
2015 Working Plan for Cleaner Distributive Coal Use
2015 Working Plan for Transforming Coal Boilers
Hebei2013-Sep Proposed Implement Plan for the Control of Air Pollution
2015-Mar Implementing Scheme for the Control of Coal Boilers
Shandong 2013-Sep Plan for the Prevention and Control of Air Pollution 2013-2020
Shanxi 2013-Feb Measure for the Control of Air Pollution 2013-2020
Shanghai 2013-Oct Clean Air Action Plan for 2013-2017
Jiangsu2014-Jun Implementing Scheme for the Control of Air Pollution
2014-SepImplementing Scheme for Improving Efficiency, Controlling Emissions and
Limiting Coal Use for 2014-2015
Zhejiang 2013-Dec Action Plan for the Control of Air Pollution for 2013-2017
Guangdong 2014-Feb Action Scheme for the Control of Air Pollution for 2014-2017
Chongqing 2014-Jan Proposed Action Plan for the Prevention and Control of Air Pollution
Anhui 2014-Mar Implementing Scheme for the Control of Air Pollution
InnerMongolia 2014-May Proposed Action Plan for the Prevention and Control of Air Pollution
Fujian 2014-Jan Implementing Rule for the Control of Air Pollution
22
3.3 Coal-to-gas switch in power sector—natural gas’s low penetration in power sector
By 2014, China’s gas-fired power capacity amounted to 55.7 GW, accounting for 4.1% in overall
power capacity; in the same year, gas-fired penetration in overall power generation was 2.1% (118
TWh), much lower than the global average of 20%.
In 2014, Gas used for power generation only accounted for 15% in total China’s gas
consumption, much lower than US (30.4%), UK (23.8%), Germany (36%), Korea (44%).
2014 China power capacity by fuel type (GW) 2014 China power generation by fuel type(TWh)
Source:China Electricity Council, 2014 Power Industry Operation Brief, Wu, Jingru Power Industry Outlook 2015-2030
Hydro,
301.83, 22%
Coal, 825.24,
61%
Gas, 55.67,
4%
Nuclear,
19.88, 1%
Wind connect
to grid, 95.81,
7%
Solar connect
to grid, 26.52,
2%
Others,
35.24, 3%
Hydro,
1066.1, 19%
Coal and
others,
4055.9, 73%
Gas, 118.3,
2%
Nuclear,
126.2, 2%
Wind connect
to grid, 156.3,
3%
Solar connect
to grid, 23.1,
1%
41
IEEJ:November 2015, All Rights Reserved.

2015/11/2
12
23
3.3 Coal-to-gas switch in power sector—the versatility of gas-fired power
High efficiency:gas unit heat rate is generally 10% higher than coal units,
while the efficiency of gas-fired distributed energy system could reach 70%.
Meet peaking load:Gas units are most favorable for meeting peaking load
due to the flexibility and ability to run infrequently for short periods.
Less pollution:Compared with regular coal units, the emissions of soot,
SO2, NOx, CO2 is much lower for gas units.
UnitKey region emission
standards for coal unit(Special)
Regular coal unit
“Ultra low emission”Coal unit
Emissionstandards
for gas unitsGas unit
Soot mg/NM3 20 14.9 3.6 5 3.1
SO2 mg/NM3 50 84.7 16.8 35 0
NOx mg/NM3 100 80.6 31.8 50 32.2
CO2 g/KWh - 750-1090 750-1090 - 416
Comparison between gas and coal on air pollutants emission
Note:Data of regular coal unit is from Zhejiang Lanxi plant, “Ultra low emission” coal unit is from Zhejiang Jiaxing plant, gas unit is from Guangdong Zhujiang plant.
24
3.3 Coal-to-gas switch in power sector—gas-fired power is not cost competitive
Wholesale tariff for gas-fired generating units is higher than coal, hydro and
wind (with feed-in-tariff).
Grid companies feel reluctant to purchase gas-fired power under the current
pricing mechanism.
Price Ratio between Gas and Coal 2011-2015
Note: price information is derived from a Zhejiang gas power plant with direct sale and circum-Bohai-Sea steam coal price
Grid Purchase Electricity Price by Fuel 2014
1.1 1.3
1.9
2.5
3.1
0.0
0.5
1.0
1.5
2.0
2.5
3.0
3.5
0
0.5
1
1.5
2
2.5
3
3.5
2011 2012 2013 2014 2015
Yua
n/cu
bic
met
ers
Gas for 9F Gas for 9E Power Coal Ratio
0.42 0.29
0.57
0.76
0.46
1.08
0.85
-5%
0%
5%
10%
15%
20%
0
0.2
0.4
0.6
0.8
1
1.2
Yua
n/K
Wh
Grid purchase price growth rate
42
IEEJ:November 2015, All Rights Reserved.

2015/11/2
13
25
3.3 Coal-to-gas switch in power sector—gas-fired power is not cost competitive
As lacking of core technology, China’s gas power plants still have to heavily
rely foreign gas turbine producers on meeting maintenance and upgrade need.
The fixed maintenance cost of gas unit is around 0.03 RMB/kWh,
accounting for around 4% in overall generation cost.
The LCOE costs of conventional combined cycle unit between US and China
2014 market shares of gas turbine business-by capacity
GE
51%Siemens
23%
Mitsubishi
13%
Alston
7%
Ansaldo
3%Others
3%
Source: Caixin Media
0.000
0.020
0.040
0.060
0.080
0.100
0.120
0.140
US China
2013
$/k
Wh
Fuel O&M Capital
Source: EIA, CNPC ETRI
Note:”Others” includes ex-construction preparation, management fees, emergency plan fees etc.Source:EIA, CNPC ETRI
The capital cost per power generation for gas unit is around 90% of coal unit
in China, compared with 30% in US.
For the equipment purchase and installation portion of total capital cost,
China’s gas unit is slightly higher than coal unit, while US’s gas unit is only
1/3 of coal unit.
3.3 Coal-to-gas switch in power sector—gas-fired power is not cost competitive
26
0
500
1000
1500
2000
2500
3000
3500
Coal unit-supercritical Combined Cycle-conventional
$/KW
United States
Others Construction Equipment purchase and installation
0
100
200
300
400
500
600
Coal unit-supercritical Combined Cycle-conventional
China
Others Construction Equipment purchase and installation
43
IEEJ:November 2015, All Rights Reserved.

2015/11/2
14
27
3.3 Coal-to-gas switch in power sector—small coal units are the targets for displacement
In 2014, NDRC, MEP and NEA jointly issued “the Action Plan for Upgrades
and Retrofits of Coal-fired Power Plants”, aiming to control air pollutant
emissions and improve efficiency of coal power fleet. The target units are coal-
fired generating units with capacity under 300 MW.
China’s thermal power capacity
0.6-10 million kw10-20 million kw20-30 million kw>30 million kw
28
3.4 Coal-to-gas switch in power sector—gas is cleaner
Compared with coal, using gas as energy fuel generally provides 10% more efficiency for
industrial boilers, furnaces or CHP units and in turn provides better performance in emission control.
Fuel type
Fuel receivedbased on low heat
content
Boiler rated evaporating capacity (D, t/h)or rated thermal power (Q, MW)
(kJ/kg)6≤D≤20 or4.2≤Q≤14
D>20 or Q>14
Boiler heat efficiency (%)Targetvalue
Limitedvalue
Targetvalue
Limitedvalue
Bituminite coal
14400<Qnet.v.ar<17700
82 76 83 78
Bituminite coal
17700<Qnet.v.ar<21000
85 79 86 81
Bituminite coal
Qnet.v.ar>21000 87 81 87 82
Leancoal
Qnet.v.ar>17700 84 78 85 80
Lignitouscoal
Qnet.v.ar>11500 85 79 86 81
Fuel type
Fuel receivedbased on low heat
content
Boiler rated evaporating capacity (D, t/h)or rated thermal power (Q, MW)
(kJ/kg) D≤2 or Q≤1.4 D>2 or Q>1.4Boiler heat efficiency (%)
Target Limited Target Limited
GasDepends on
actual test value92 88 94 90
Indicators on heat efficiency between gas and coal boilers
Source: Supervision and Management Regulations of BoilerTechnology (TSG G0002-2010)
The standards for air pollutants emission
between gas and coal boilers (Mg/m3)
PollutantExistingboilers
New buildboilers
Special
Coal Gas Coal Gas Coal Gas
PM 80 30 50 20 30 20
SO2 400 100 300 50 200 50
NOx 400 400 300 200 200 150
Hg 0.05 0.05 0.05
Blackness ofexhaustion
≤1 ≤1 ≤1Ringelmanemittance
NoteStart from10/1/2015
Start from7/1/2014
For regions only
Source: The Standards for Air Pollutants Emission of Boilers (GB 13271-2014)
44
IEEJ:November 2015, All Rights Reserved.

2015/11/2
15
29
3.4 Coal-to-gas switch for distributive coal consumption—supportive policies
According to the National Action Plan for the Control of Air Pollution: small coal
boilers will be eliminated gradually; all the coal-to-gas switch plans for boilers, industrial
furnace and self-contained power plants will be completed by 2017.
Followings are a few action plans issued by provincial governments
Hebei
•By 2017, shut down 4, 125coal boilers amid 3, 111 of them (11, 024t) will switch to other fuels and at the sametime promote centralizedheating.
•For coal units beyond heating supply network, natural gas , electricity andrenewables will be forced to use.
•The coal boilers serving for government bodies will be “vanguards”.
Zhejiang(2013—2017)
•By 2015, coal boilers with capacity under 10t/hr will be either replaced or shut down in prefecture-level city, while the benchmark for other cities is 6t/hr.•By 2017, all industrial parks will be equipped with centralized heating amid getting rid of all distributivecoal boilers. The distributive coal boilers beyond heat supply network will be forced to use electricity or renewables.
Jiangsu
•By 2017, the following actions on distributive coal units will be completed:
•Within heating supply network—shut down;
•beyond heating supply network but within gas supply network--coal-to-gas displacement
•beyond gas supply network—units with capacity under 10t/hr will be forced to use electricity or renewables
•CHP is the only allowed type of coal units to be builtin urban area.
Guangdong(2014—2017)
•By 2015, the centralized heating will amount to 30% in total heating .
•By 2017, all the industrial parks and the Pearl River Delta industrial cluster district will realize centralized heating, total to 80% in overall province heating supply
30
3.4 Coal-to-gas switch for distributive coal consumption—using gas also saves money
The cost of natural gas and coal is almost same if considering the costly parts of
utilizing coal, including transportation, processing, man power, occupied area and
pollutant control practices.
Take a factory in Zhejiang for example, the price ratio of gas over coal is 3:1 if only
considering the heat contribution per unit energy consumed while the compound cost
ratio declines to 1.2:1.
Index Unit Coal boiler Gas boiler
Capital cost 10, 000 RMB 60 52
Coal consumption 2, 280 t(Bituminite coal)
780 mcf(Natural gas)
Fuel cost 10, 000RMB/yr 200 293
Electricity expense
10, 000RMB/yr 39 7.2
Water expense 10, 000RMB/yr - -
Manpower 10, 000RMB/yr 18 8.4
Pollutant control 10, 000RMB/yr 3.9 0.1
Operation cost 10, 000RMB/yr 260.9 308.7
Economic indicators ex/post-displacement Production index ex/post-displacement
Index Coal boiler Gas boiler
Electricity consumption 540 MWh 100 Mwh
Occupied area 400 m2 50 m2
Work force 5 2
Ambient environment DIRTY TIDY
Pollutants CO2, SO2, Nox, soot CO2
Steam parameter Fairly stable Very stable
O&M work Huge Limited
45
IEEJ:November 2015, All Rights Reserved.
2015/11/2
16
31
3.4 Coal-to-gas switch for distributed coal consumption——focus on coal boilers displacement
The number of China’s industrial coal boilers totaled at around 540, 000 amid more
than 70% with capacity over 10t/h and 53% locating at Eastern China.
Required by the National Action Plan for the Control of Air Pollution, unless otherwise
noted, all the coal boilers of prefecture-level cities with capacity under 10t/h will be
displaced and new build coal boilers with capacity under 20t/h are prohibited by 2017.
The coal boilers with capacity under 10t/h are restricted in the rest urban and rural areas.
China’s industrial coal boilers by capacity China’s regional distributive coal use by application (10,000t)
0 2000 4000 6000 8000
10000 12000 14000 16000 18000 20000
北京
天津
河北
山西
山东
上海
江苏
浙江
广东
重庆
内蒙
古河
南陕
西青
海新
疆甘
肃湖
北四
川辽
宁吉
林湖
南安
徽宁
夏广
西福
建江
西贵
州黑
龙江
海南
云南
万吨
供热 工业散烧 其他
0
20
40
60
80
100
120
Number boilers Capacity Coalconsumption
over 35t
20t to 35t
10t to 20t
6t to 10t
under 6t
32
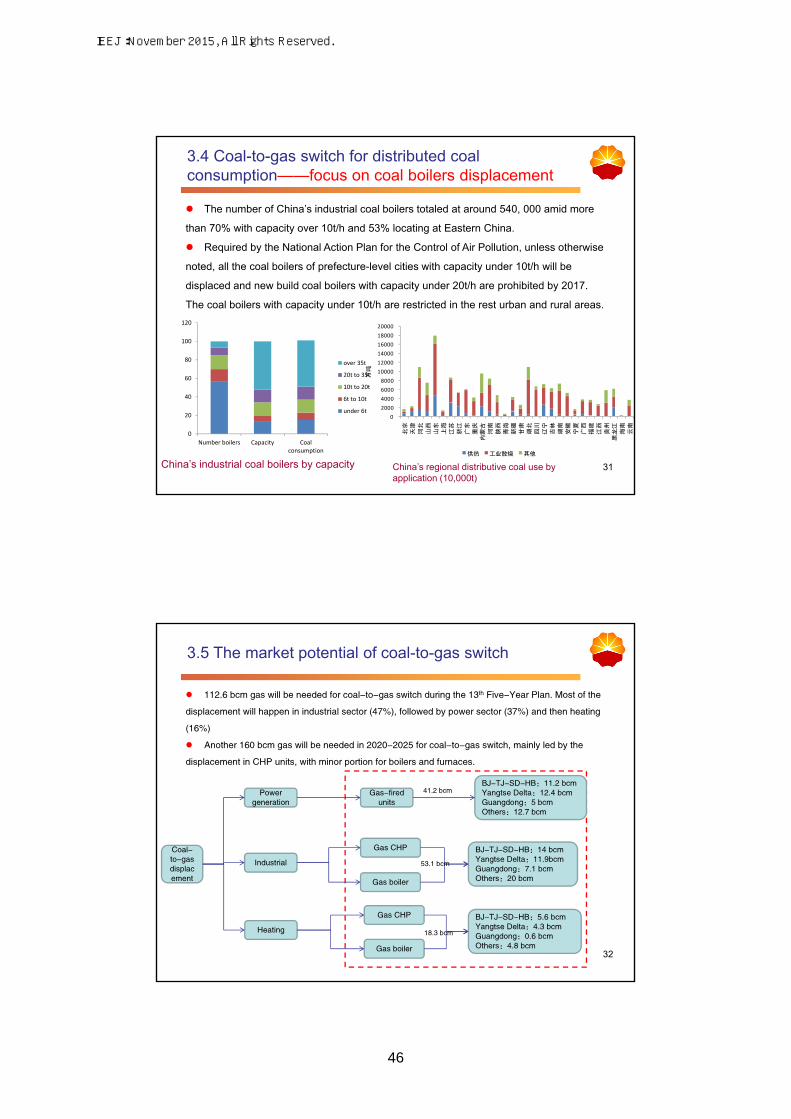
3.5 The market potential of coal-to-gas switch
112.6 bcm gas will be needed for coal-to-gas switch during the 13th Five-Year Plan. Most of the
displacement will happen in industrial sector (47%), followed by power sector (37%) and then heating
(16%)
Another 160 bcm gas will be needed in 2020-2025 for coal-to-gas switch, mainly led by the
displacement in CHP units, with minor portion for boilers and furnaces.
Coal-to-gas displacement
Power generation
Industrial
Heating
Gas-fired units
BJ-TJ-SD-HB:11.2 bcmYangtse Delta:12.4 bcmGuangdong:5 bcmOthers:12.7 bcm
41.2 bcm
Gas CHP
Gas boiler
BJ-TJ-SD-HB:14 bcmYangtse Delta:11.9bcmGuangdong:7.1 bcmOthers:20 bcm
Gas CHP
Gas boiler
BJ-TJ-SD-HB:5.6 bcmYangtse Delta:4.3 bcmGuangdong:0.6 bcmOthers:4.8 bcm
53.1 bcm
18.3 bcm
46
IEEJ:November 2015, All Rights Reserved.

2015/11/2
17
33
3.6 Coal-to-gas switch in power sector——overcapacity of coal industry
China’s coal consumption and production decreased by 4.6% and 4.3% in
Q1-3/2015, over 80% of the total coal companies are not profitable.
The profits of 90 top coal companies shrinked to 0.97 billion RMB from 42.7
billion RMB of last year’s same period.
Situation of Closed Coal Mine in China 4,947 coal mines are
closed currently in China,
representing 48% in total,
including 3,346 of them
have been closed for more
than one year.
34
3.6 Coal-to-gas switch in power sector——overcapacity in power market
5, 520 TWh electricity was consumed by China in 2014, while the average utilization
hours of power plants dropped to the lowest level since 1978.
By the end of 2014, China’s total power capacity reached 1.36 TW (For all
generating units above 6 MW). With another 173 GW capacity under construction and
around 100 GW capacity in schedule, the market may see more surplus power capacity
in the near future.
China electricity consumption and y-o-y growth rate 2000-2014
0%
2%
4%
6%
8%
10%
12%
14%
16%
18%
0
1
2
3
4
5
6
(%
)
1000
TW
h
Electricity consumption
Growth rate
47
IEEJ:November 2015, All Rights Reserved.

2015/11/2
18
1. Challenges and Opportunities of Natural
Gas Market in China
2. Experiences of Developed Countries
3. Market Potential of Coal-to-Gas Switch in
China
4. Summary and Suggestions
Content
35
36
4.1 Opportunities and challenges coexist
China’s natural gas market is facing challenges from economic slowdown,
imperfect pricing mechanism and insufficient infrastructures.
However, there are still huge market potentials for China’s natural gas, while
substituting coal is the major direction.
191
269
327 381
25 47
108
202
298
375
454
213
334
431
541
2000 2005 2010 2015 2020 2025 2030
Low BAU High
Natural Gas Demand of China (bcm)
48
IEEJ:November 2015, All Rights Reserved.

2015/11/2
19
37
4.2 Suggestions
Pricing mechanism: cross-subsidization and price inversion; price adjustment period; gas trading hub. Electric power market: gas linked pricing mechanism, peakload price mechanism. Pipeline system: supervision; reduce intermediate links; direct sale model; measured and trade by heat value.
Market Reform
Environmental
Protection
Industrial Policy
Make stricter emission standards and environmental policies.
Encourage replacing coal by natural gas, set up ‘coal free area' in the cities.
Impose carbon tax or environmental tax on energy utilization.
Cooperation between gas and electric power enterprises. R&D, grasp the key technology of Gas turbine. Fiscal and taxation policy to support infrastructure investment. Guidance for coal industry upgrade, especially for resource-based cities.
Thanks!
49
IEEJ:November 2015, All Rights Reserved.
Contact:[email protected]