
Propagating Data Policies - A User Study
23
Propagating Data Policies A User Study 1 Enrico Daga (The Open University, UK) Mathieu d’Aquin (Insight Centre, NUI Galway, Ireland) Enrico Motta (The Open University, UK) KCAP2017 The 9th Interna4onal Conference on Knowledge Capture December 4th6th, 2017Aus4n, Texas, United States
-
Upload
enrico-daga -
Category
Data & Analytics
-
view
138 -
download
0
Transcript of Propagating Data Policies - A User Study

Propagating Data PoliciesA User Study
1
Enrico Daga (The Open University, UK)Mathieu d’Aquin (Insight Centre, NUI Galway, Ireland)Enrico Motta (The Open University, UK)
K-‐CAP2017 The 9th Interna4onal Conference on Knowledge Capture December 4th-‐6th, 2017Aus4n, Texas, United States

City Data Hubs
2
Smart Bins to make garbage collec2on more efficient
Monitor parking spaces to support ci2zens’ mobility
Observe busyness of places to be=er tune services
Forecast car accidents to improve drivers’ awareness
MK:Smart is an integrated innova4on and support programme leveraging large-‐scale city data to drive growth in Milton Keynes (UK).
hPps://datahub.mksmart.org
Delivery
Onboarding
Processing
Acquisi4onData Hub
It is a loop!
Feedback: @enridaga

Policy PropagationIn City Data Hubs publisher, processor and consumer are different.
3
How to support data managers on making aware developers about the policies an output might derive from the data sources?
Feedback: @enridaga

4
Policy Propagation
propagates(duty:attribution,processed into) …
has(dataset1,permission:DerivativeWorks) has(dataset1,duty:attribution) …
ODRL -‐ License and Terms of Use
Datanode -‐ Process
Policy Propaga=on Rules
Focus on the knowledge components:policies and processes
has(output, duty:attribution) has(output, permission:commercialise) …
has(X,P) ⋀ propagates(P,R) ⋀ relation(R,X,Y) → has(Y,P)
These are the policies derived from
the sources!
Feedback: @enridaga

Previous work
5
Data flow descriptions “Describing semantic web applications through relations between data nodes”, Technical Report, 2015Rules acquisition and management “Propagation of policies in rich data flows”, K-Cap, 2015. Policy knowledge acquisition “A Bottom-Up Approach for Licences Classification and Selection”, LeDA-SWAn, 2015. Process knowledge acquisition “An incremental learning method to support the annotation of workflows with data-to-data relations”, EKAW, 2016. Applicability in an end-to-end scenario “Addressing exploitability of smart city data”, IEEE ISC2, 2016. Efficiency of the reasoner “Reasoning with Data Flows and Policy Propagation Rules”, Semantic Web Journal, Special Issue to appear 2017?

Objective
To evaluate the system accuracy and utility:• Are the assumptions made about the needed components the correct
ones?• To what extent a system supporting such a task can be accurate?
When it is not, are there any fundamental reasons?• How difficult is the task? Is this support needed?
6Feedback: @enridaga

User Study DesignA Data Hub manager to take decisions about policy propagation• having the same knowledge used by the system. • 10 participants selected among researchers and PhD students
having data analysis skills• No legal expertise: developers and data managers don’t have that.• Working in pairs: required to develop an agreement.• 5 teams: MAPI, ILAN, CAAN, ALPA, NIFR• Real data sources (MK Data Hub), licences (RDF Licence Database),
and processes (Rapid Miner files found on GitHub.com)• 5 data journeys designed by mapping data sources and processes
in a narrative: SCRAPE, FOOD, CLOUD, AVG, CLEAN• Distributed in a latin square: a team for 2 journeys and a journey for
2 teams; at most 1 shared journey between teams.
7Feedback: @enridaga

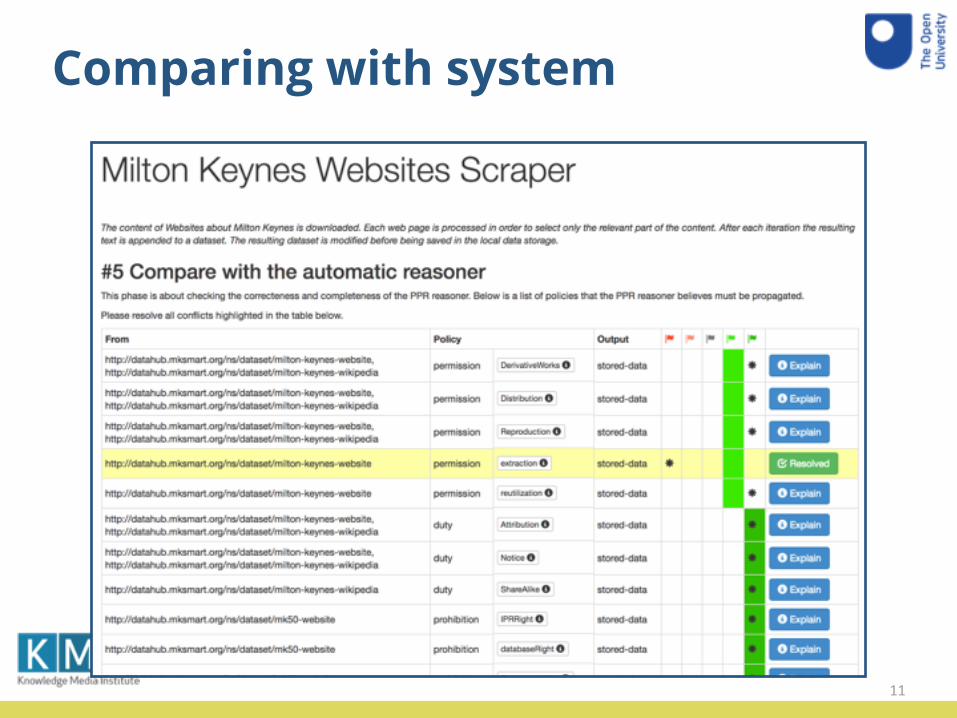
User Study DesignWe developed a tool to assist participants in a data journey:1. Understand the process (on Rapid Miner)2. Understand the input datasets (from the MK Data Hub)3. Understand the input policies (from the RDF Licence Database)4. Decide what policies shall propagate to the output (1-5 Likert scale)5. Compare with the automatic reasoner and explain differences
8Feedback: @enridaga

Understand a data journey
9
222 CHAPTER 6. EVALUATION IN THE CONTEXT OF A SMART CITY DATA HUB
Table 6.1: Data Journeys (a,b).
(a) SCRAPE
SCRAPE Milton Keynes Websites Scraper.The content of Websites about Milton Keynes is downloaded. Each web page is processed in orderto select only the relevant part of the content. After each iteration the resulting text is appended to adataset. The resulting dataset is modified before being saved in the local data storage.
Datasets Milton Keynes Council Website (UK OGL 2.0), MK50 Website (All rights reserved),Wikipedia pages about Milton Keynes (CC-By-SA 3.0)
Policies Permissions: reutilization, Reproduction, Distribution, DerivativeWorks. Prohi-bitions: Distribution, IPRRight, Reproduction, DerivativeWorks, databaseRight,reutilization, extraction, CommercialUse. Duties: Notice, ShareAlike, Attribution.
Process https://github.com/mtrebi/SentimentAnalyzer/tree/
master/process/scraper.rmp
Teams ILAN , MAPI
(b) FOOD
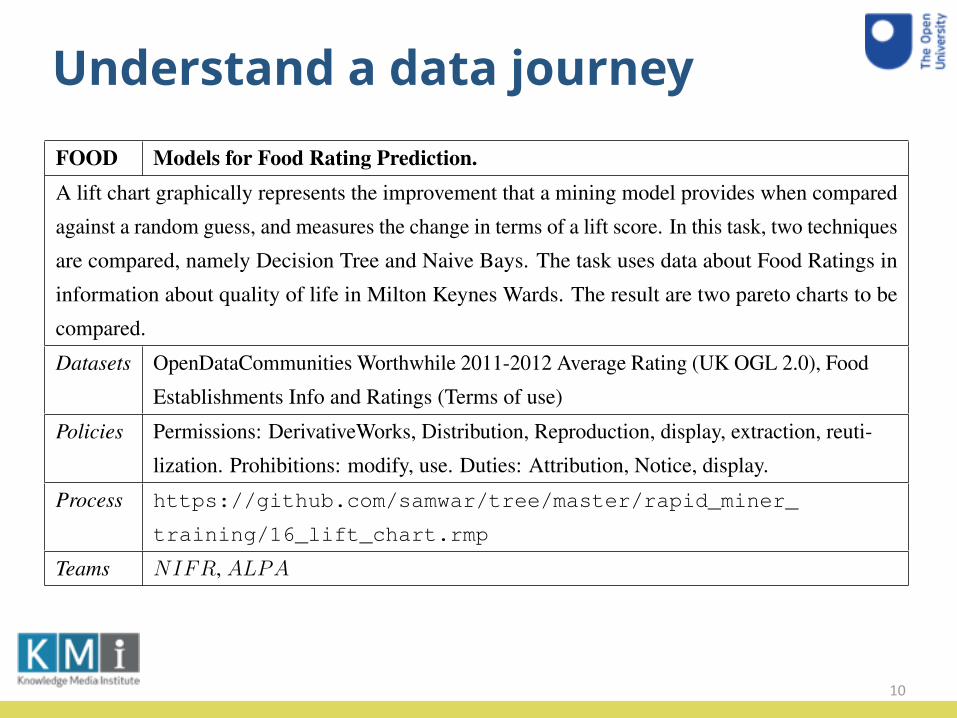
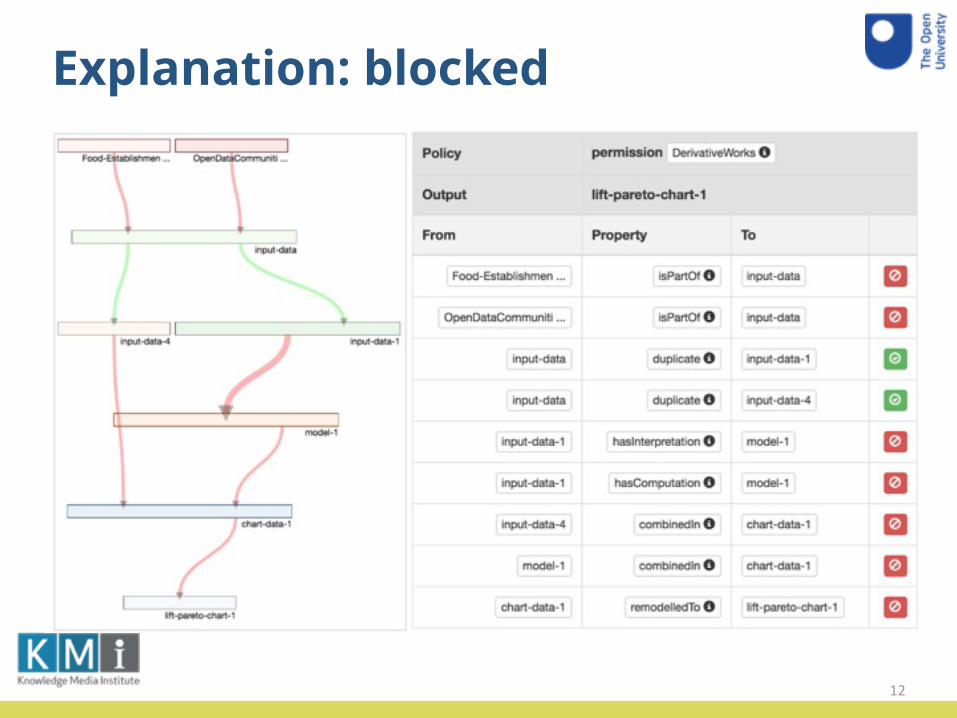
FOOD Models for Food Rating Prediction.A lift chart graphically represents the improvement that a mining model provides when comparedagainst a random guess, and measures the change in terms of a lift score. In this task, two techniquesare compared, namely Decision Tree and Naive Bays. The task uses data about Food Ratings ininformation about quality of life in Milton Keynes Wards. The result are two pareto charts to becompared.
Datasets OpenDataCommunities Worthwhile 2011-2012 Average Rating (UK OGL 2.0), FoodEstablishments Info and Ratings (Terms of use)
Policies Permissions: DerivativeWorks, Distribution, Reproduction, display, extraction, reuti-lization. Prohibitions: modify, use. Duties: Attribution, Notice, display.
Process https://github.com/samwar/tree/master/rapid_miner_
training/16_lift_chart.rmp
Teams NIFR, ALPA
Understand a data journey
10
222 CHAPTER 6. EVALUATION IN THE CONTEXT OF A SMART CITY DATA HUB
Table 6.1: Data Journeys (a,b).
(a) SCRAPE
SCRAPE Milton Keynes Websites Scraper.The content of Websites about Milton Keynes is downloaded. Each web page is processed in orderto select only the relevant part of the content. After each iteration the resulting text is appended to adataset. The resulting dataset is modified before being saved in the local data storage.
Datasets Milton Keynes Council Website (UK OGL 2.0), MK50 Website (All rights reserved),Wikipedia pages about Milton Keynes (CC-By-SA 3.0)
Policies Permissions: reutilization, Reproduction, Distribution, DerivativeWorks. Prohi-bitions: Distribution, IPRRight, Reproduction, DerivativeWorks, databaseRight,reutilization, extraction, CommercialUse. Duties: Notice, ShareAlike, Attribution.
Process https://github.com/mtrebi/SentimentAnalyzer/tree/
master/process/scraper.rmp
Teams ILAN , MAPI
(b) FOOD
FOOD Models for Food Rating Prediction.A lift chart graphically represents the improvement that a mining model provides when comparedagainst a random guess, and measures the change in terms of a lift score. In this task, two techniquesare compared, namely Decision Tree and Naive Bays. The task uses data about Food Ratings ininformation about quality of life in Milton Keynes Wards. The result are two pareto charts to becompared.
Datasets OpenDataCommunities Worthwhile 2011-2012 Average Rating (UK OGL 2.0), FoodEstablishments Info and Ratings (Terms of use)
Policies Permissions: DerivativeWorks, Distribution, Reproduction, display, extraction, reuti-lization. Prohibitions: modify, use. Duties: Attribution, Notice, display.
Process https://github.com/samwar/tree/master/rapid_miner_
training/16_lift_chart.rmp
Teams NIFR, ALPA
Comparing with system
11
Explanation: blocked
12

Explanation: propagated
13
K-CAP 2017, (Submitted, 2017), Austin, Texas USA E. Daga et al.
defined as the assessment of the policies associated withthe data resulting from the computation of diverse datasetsimplemented within a City Data Hub [4]. Indeed, assessinghow the policies associated with the sensed data will bepropagated to the results of a data processing pipeline isan important problem. Data consumers might need to checkwhich original sources of the data need to be acknowledgedbecause of an attribution requirement, and even whether theform of exposure or re-distribution they employ is allowedaccording to the policies attached to each individual pieceof data they might obtain from the Data Hub. Researchon policy models and reasoning focuses on the problem oflicence compatibility and composition [2, 9]. However, rea-soning on policy propagation is a necessary preliminary stepto any policy validation or consistency check. In our workwe reuse models developed within the Open Digital RightsLanguage1 (ODRL) research community (for example [12]).A discussion on ODRL action dependencies and how theya↵ect the policy semantics is included in [13]. Nonetheless, tothe best of our knowledge, the first attempt to analyse howpolicies can propagate in manipulation processes is the onepresented in one of our earlier papers [6]. In [6] we introduced
Figure 1: Explanation: propagation trace.
the notion of Policy Propagation Rule (PPR) in order tosolve the task of automatically deciding what policies associ-ated to a data source need to be enforced to the output of aprocess in which that data source is involved. PPRs establisha fundamental connection between a policy - a permission,prohibition or duty - and a semantic relation between twodata objects, expressed with the Datanode ontology [7]. Thus,
1ODRL W3C Community Group: https://www.w3.org/community/odrl/
it is possible to derive that a certain policy of the sourceneeds to be enforced on the target [5]. The Datanode Ontol-ogy [7] allows us to model a data manipulation scenario as anetwork of data objects, making it possible to reason uponthe relations between those data objects and to apply PPRs.However, in our earlier work we focused on the feasibility ofthe approach in terms of knowledge acquisition and manage-ment [6], scalability of the reasoner [5], and applicability inan end-to-end user scenario [4]. In this paper, we go a stepfurther by performing a user experiment in order to evaluatethe feasibility of policy propagation as a solvable problemand the hypotheses behind the development of the system,by relying both on quantitative and qualitative data analysismethods, particularly the Grounded Theory (GT) approach2,in a comparison between the automatic process and a manualone performed by people with the typical skillet found indata consumers, processors and publishers who would becarrying out this task in a realistic context.
3 THE SYSTEM AT A GLANCEThe role of the PP Reasoner is to support users in the assess-ment of the impact of input data policies on the exploitationof the output data of processes and workflows. Consider thecase where Food rating data released by a trusted authorityunder a licence that prohibits distribution is used alongsidepublic data about city roads in order to assess the best Ma-chine Learning approach, among several options, to employfor the prediction of good quality restaurants. This task wouldproduce two types of outputs: (a) a set of datasets aboutroads labelled with the expected food quality rating; and (b)a set of datasets including details about the performance ofeach one of the algorithms tested. While the prohibition ofdistribution should be taken into account when using theformer datasets, the same constraint would not apply to thelatter.
The system is designed to work with a set of referenceknowledge bases:
• Data Catalogue. Provides Datasets general metadata,including the link to the associated policy set (licence,Terms and Conditions, and so forth).
• Licence Catalogue. Includes the set of licences repre-sented using the ODRL Ontology3.
• Process Catalogue. Defines the set of processes repre-sented using the Datanode Ontology4.
• Policy Propagation Rules (PPRs). A rule base, devel-oped and managed as described in [6]. Rules have theform of a connection between an atomic policy and arelation that is supposed to propagate it. For instance,propagates(dn:cleanedInto, odrl:permission
cc:DerivativeWorks) instructs the reasoner topropagate odrl:permission cc:DerivativeWorks
whenever a data item is dn:cleanedInto another, sothat the cleaned item would also have the given policy.
2https://en.wikipedia.org/wiki/Grounded theory3ODRL Version 2.1 Ontology: http://www.w3.org/ns/odrl/2/ODRL214Datanode Ontology: http://purl.org/datanode/ns/

Explaining differences
14

Analysis
• Accuracy analysis. To evaluate the system (agreement with users)• Teams agree the system is right• Teams agree the system is not right
• Eg: the knowledge base needs to be improved (e.g. rules)• Teams disagree: we don’t know whether the system is right!
• Thematic analysis. Focusing on the disagreements between users• From explanations given in the last phase• From discussions during the study (reaching agreement)• Grounded Theory Approach
• Questionnaire. To assess the value to users after the study experience.
15Feedback: @enridaga
Questionnaire
16
Questionnaire
17
Propagating Data Policies: a User Study K-CAP 2017, (Submitted, 2017), Austin, Texas USA
Table 1: Data Journeys.
SCRAPE Milton Keynes Websites Scraper.Websites about Milton Keynes are scraped, and indexed locally.Datasets Milton Keynes Council Website (UK OGL 2.0), MK50
Website (All rights reserved), Wikipedia pages aboutMilton Keynes (CC-By-SA 3.0)
Policies Permissions: reutilization, Reproduction, Distribution,DerivativeWorks. Prohibitions: Distribution, IPRRight,Reproduction, DerivativeWorks, databaseRight, reuti-lization, extraction, CommercialUse. Duties: Notice,ShareAlike, Attribution.
Process https://github.com/mtrebi/SentimentAnalyzer/tree/master/process/scraper.rmp
Teams ILAN , MAPI
FOOD Models for Food Rating Prediction.Two Machine Learning techniques are compared. The process uses dataabout Food Ratings and statistics about quality of life in MK wardsand generates a lift chart and performance vectors.Datasets OpenDataCommunities Worthwhile 2011-2012 Average
Rating (UK OGL 2.0), Food Establishments Info andRatings (Terms of use)
Policies Permissions: DerivativeWorks, Distribution, Reproduc-tion, display, extraction, reutilization. Prohibitions:modify, use. Duties: Attribution, Notice, display.
Process https://github.com/samwar/tree/master/rapid minertraining/16 lift chart.rmp
Teams NIFR, ALPA
CLOUD A tag cloud from microblog posts.Twitter posts about Milton Keynes are collected and processed in orderto obtain a clean vector of words, associated with an occurrence score.Datasets Twitter Feed #miltonkeynes (Terms of use)Policies Permissions: copy, display. Prohibitions: give, license,
sell, transfer. Duties: attribute.Process https://github.com/jccgit/RM-Textmining-Pubmed/
tree/master/Pubmed.rmpTeams CAAN , ALPA
AVG Moving average of sensors’ records.Calculation of a moving average and plotting from sensor records.Dataset Samsung Sensor Data (Terms of use)Policies Permissions: aggregate, anonymize, archive, derive, in-
dex, read, use. Prohibitions: CommercialUse, distribute,give, grantUse, move, sell, transfer. Duties: anonymize.
Process https://github.com/billcary/Rapid Miner/tree/master/chapter03/MovingAveragePlotter.rmp
Teams NIFR, MAPI
CLEAN Sensor data cleaning workflow.The process performs a number of cleaning operations on sensorsstreams linked with postcodes in order to obtain a dataset ready foranalysis.Datasets Postcode Locations (UK OGL 2.0), Netatmo Weather
Station - 52.022166, -0.806386, Netatmo Weather Sta-tion - 52.002429770568, -0.79804807820062 (Terms ofuse)
Policies Permissions: CommercialUse, DerivativeWorks, Distri-bution, Reproduction, display, extraction, reutilization,use. Prohibition: Distribution, give, grantUse, license,transfer. Duties: Attribution, Notice, inform, obtain-Consent.
Process https://github.com/MartinSchmitzDo/RapidMinerDataCleaner/processes/clean.rmp
Teams CAAN , ILAN
borderline cases selected from the quantitative results. Tothis aim, we transcribed the notes and conversations occurredduring the experiment from the audio recordings and thetool. From these data we derived a set of general themesabout fundamental issues on policy propagation, adopting amethod that is akin to Grounded Theory (GT). We illustratesome exemplary cases and present the extracted themes inthe discussion Section 7.
5 USER’S FEEDBACKBefore analysing the data journeys and how the decisions ofthe users relate to the behaviour of our system it is worthshowing the feedback received after the study was conducted,
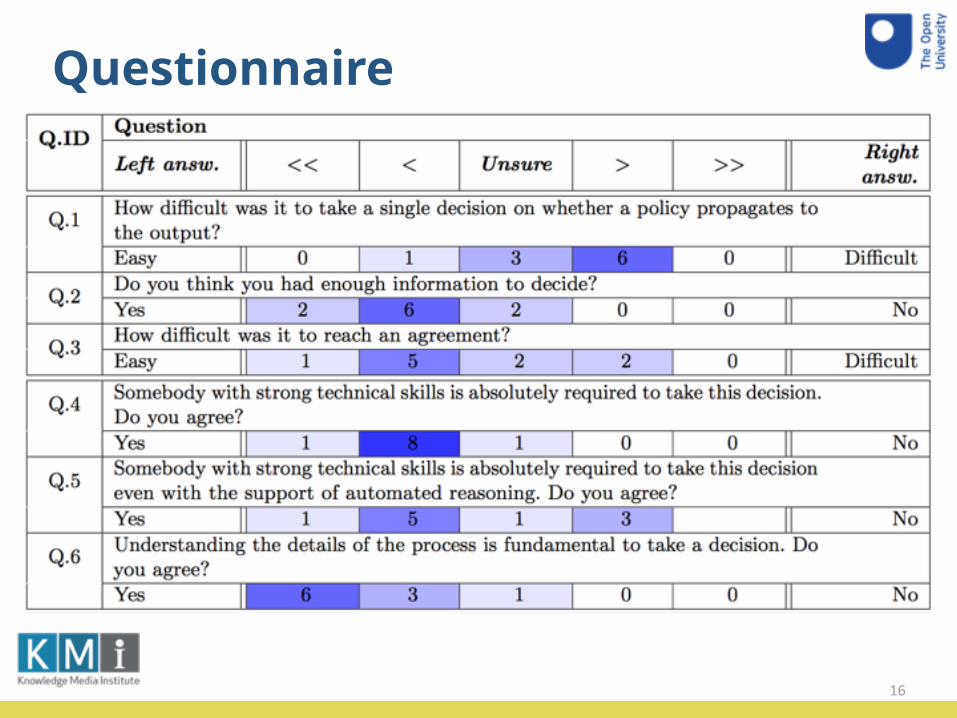
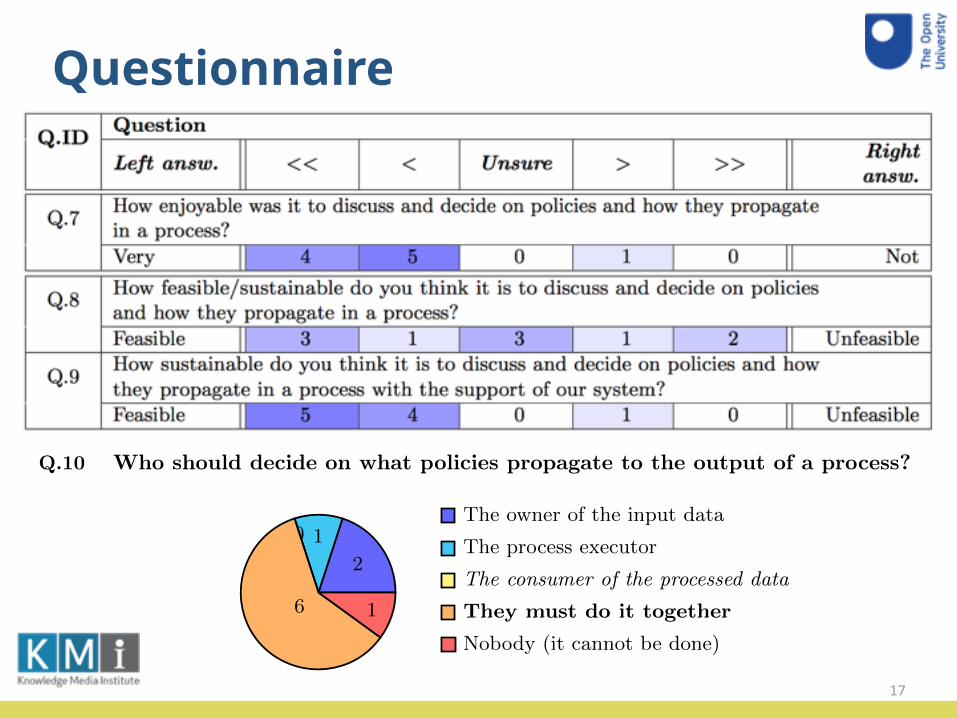
collected through a questionnaire. In the questionnaire, weposed some questions about the problem of policy propa-gation to assess the value of the system to the user. Thequestionnaire was completed by the study participants in-dividually. Table 2 summarises the nine closed-ended likertquestions (Q.1� 9), while Figure 3 shows the result of thesingle-choice question (Q.10). The majority of the partic-
Table 2: User’s feedback. The shading of the cells
reflect the distribution of the answers.
Q.ID
Question
Left answ. << < Unsure > >>Right
answ.
Q.1How di�cult was it to take a single decision on whether a policy propagates tothe output?Easy 0 1 3 6 0 Di�cult
Q.2Do you think you had enough information to decide?Yes 2 6 2 0 0 No
Q.3How di�cult was it to reach an agreement?Easy 1 5 2 2 0 Di�cult
Q.4Somebody with strong technical skills is absolutely required to take this decision.Do you agree?Yes 1 8 1 0 0 No
Q.5Somebody with strong technical skills is absolutely required to take this decisioneven with the support of automated reasoning. Do you agree?Yes 1 5 1 3 No
Q.6Understanding the details of the process is fundamental to take a decision. Doyou agree?Yes 6 3 1 0 0 No
Q.7How enjoyable was it to discuss and decide on policies and how they propagatein a process?Very 4 5 0 1 0 Not
Q.8How feasible/sustainable do you think it is to discuss and decide on policiesand how they propagate in a process?Feasible 3 1 3 1 2 Unfeasible
Q.9How sustainable do you think it is to discuss and decide on policies and howthey propagate in a process with the support of our system?Feasible 5 4 0 1 0 Unfeasible
2
10
6 1
The owner of the input data
The process executor
The consumer of the processed data
They must do it together
Nobody (it cannot be done)
Figure 3: Q10. Who should decide on what policies
propagate to the output of a process?
ipants of our study believe that the task can be a di�cultone (Q.1). However, the knowledge provided was adequatefor making an informed decision (Q.2). Deciding whether apolicy propagates is possible, even if not always trivial (Q.3).Users agree on considering policy propagation a problemthat cannot be solved without understanding the details ofthe data manipulation process (Q.6), therefore someone withstrong technical skills needs to be involved (Q.4, Q.5). Theobjective of Q.7 was to check whether users were positivelyinvoved in the study, assuming that an unengaged personwould not put enough e↵ort on expressing his opinion andtaking thorough decisions. Questions Q.8 focused on the sus-tainability of the task. Users feedback on this matter wasspread. Our hypothesis is that two data journeys are probablynot enough to understand how much this task could scale ina real setting. However, our system can e↵ectively support
Q.10 Who should decide on what policies propagate to the output of a process?

Accuracy analysis
18
D Number of policies of data sources / Number of decisions
T_avg Agreement with system, average of the T1 and T2
T12 Agreement between T1 and T2
T_12+ Agreement on certain answers
T_1+,T_2+ Amount of certain answers
Permissions
K-CAP 2017, (Submitted, 2017), Austin, Texas USA E. Daga et al.
Table 3: Data Journeys: System decisions
Journey Propagated Permissions Prohibitions Duties
SCRAPE 15/16 4/5 8/8 3/3FOOD 8/22 0/12 4/4 4/6CLOUD 5/7 0/2 4/4 1/1AVG 8/15 0/7 7/7 1/1CLEAN 9/17 0/8 5/5 4/4
Tot 39/77 4/34 28/28 13/15
the user on taking a decision (Q.1, Q.9). This feedback showsthat policy propagation is a di�cult problem, although itcan be solved with the right knowledge models. Therefore, atool supporting this task has good value for users. The lastquestion (Q.10) was meant to understand whether the DataHub manager could actually decide on policy propagation. Itturns out that most of the users think he/she cannot solvethe issue alone, but he/she should involve the data ownerand the process executor in this task. This conclusion reflectssome of the issues raised during the study, that are discussedin Section 7.
6 ACCURACY ANALYSISIn this Section we show how the decisions made by the userscompare to the system. The decisions taken by the systemare summarized in Table 3. For example, the SCRAPE datajourney required to check 16 policies and the system decidedto propagate 15 of them: 4 of the 5 permissions and all theprohibitions and duties. Tables 4a-4h summarize the resultsof our study in a quantitative way. The values are shownin two sets including the full numbers and the computedratio, considering all the decisions (Tables 4a and 4b), andthen split in permissions (Tables 4c and 4d), prohibitions(Tables 4e and 4f), and duties (Tables 4g and 4h). The valuesare first shown for each one of the user study (data journeyof each team), aggregated for each data journey (averageof both teams) and then as totals considering the decisionsfrom all data journeys (at the bottom). The data journeysrequired from seven to twenty-two policies to be analysedfor a total of seventy-seven decisions. Table 4a shows thenumber of decisions for each data journey (column D) andhow much the teams agreed with the system (T
avg
being theaverage value of the teams on the same data journey).
The agreement with the system is good, distributed dif-ferently across the data journeys and the teams, with anaverage ratio of 0.8. Moreover, this result is supported bythe high agreement rate between the two teams (T
avg
= 0.7).We observe that in more than half of the cases the decisionswere made with the same degree of confidence (T12+=0.6),and that in 70% of the cases users made a sharp decisionabout whether a policy would propagate or not (T1+/T2+
total average is 0.6). Inspecting the table we see that thedata journeys showing a lower agreement are FOOD/T1,AV G/T2 and CLEAN/T2. We will discuss these in the nextSection. The low scores on CLOUD/T12+ and CLOUD/T2+
only show a di↵erence in the degree of confidence of thedecisions, that is not especially relevant in this global view,
Table 4: Agreement analysis.
D: total number of decisions; T1, T2: agreement between sys-
tem and each team; Tavg: average agreement between teams
and system; T12: agreement between teams; T12+ agreement
between teams (only Certainly Yes/Absolutely No answers);
T1+, T2+: amount of Certainly Yes/Absolutely No answers.
Tables on the left indicate totals, while the ones on the right
show the related ratios.
(a) All decisions (totals)
Journey D T1 T2 Tavg
T12 T12+ T1+ T2+
SCRAPE 16 15 13 14 14 11 11 14FOOD 22 14 18 16 14 8 20 12CLOUD 7 5 7 6 5 1 5 2AVG 15 15 8 11.5 8 8 15 15CLEAN 17 12 9 10.5 14 3 13 6
All 77 58 55 31 56.5
(b) (ratios)
T1 T2 Tavg
T12 T12+ T1+ T2+
0.9 0.8 0.9 0.9 0.8 0.7 0.90.6 0.8 0.7 0.6 0.6 0.9 0.50.7 1 0.9 0.7 0.2 0.7 0.31 0.5 0.8 0.5 1 1 10.7 0.5 0.6 0.8 0.2 0.8 0.4
0.8 0.7 0.6 0.7
(c) Permissions (totals)
Journey D T1 T2 Tavg
T12 T12+ T1+ T2+
SCRAPE 5 4 2 3 3 0 0 3FOOD 12 12 12 12 12 6 12 6CLOUD 2 0 2 1 0 0 0 1AVG 7 7 0 3.5 0 0 7 7CLEAN 8 3 0 1.5 5 2 4 5
All 34 21 20 8 22.5
(d) (ratios)
T1 T2 Tavg
T12 T12+ T1+ T2+
0.8 0.4 0.6 0.6 0 0 0.61 1 1 1 0.5 1 0.50 1 0.5 0 N.A. 0 0.51 0 0.5 0 N.A. 1 10.4 0 0.2 0.6 0.4 0.5 0.6
0.6 0.6 0.4 0.7
(e) Prohibitions (totals)
Journey D T1 T2 Tavg
T12 T12+ T1+ T2+
SCRAPE 8 8 8 8 8 8 8 8FOOD 4 0 2 1 2 2 4 2CLOUD 4 4 4 4 4 0 4 0AVG 7 7 7 7 7 7 7 7CLEAN 5 5 5 5 5 0 5 0
All 28 25 26 17 22.5
(f) (ratios)
T1 T2 Tavg
T12 T12+ T1+ T2+
1 1 1 1 1 1 10 0.5 0.3 0.5 1 1 0.51 1 1 1 0 1 01 1 1 1 1 1 11 1 1 1 0 1 0
0.9 0.9 0.7 0.8
(g) Duties (totals)
Journey D T1 T2 Tavg
T12 T12+ T1+ T2+
SCRAPE 3 3 3 3 3 3 3 3FOOD 6 2 4 3 0 0 4 4CLOUD 1 1 1 1 1 1 1 1AVG 1 1 1 1 1 1 1 1CLEAN 4 4 4 4 4 1 4 1
All 15 12 9 6 11.5
(h) (ratios)
T1 T2 Tavg
T12 T12+ T1+ T2+
1 1 1 1 1 1 10.3 0.7 0.5 0 N.A. 0.7 0.71 1 1 1 1 1 11 1 1 1 1 1 11 1 1 1 0.3 1 0.3
0.8 0.6 0.7 0.8
altough this aspect will be discussed when looking at specificclasses of policies.
Tables 4c and 4d only show results involving policies oftype permission. The average agreement between the systemand the users considering all the decisions is 0.6. Particularly,the SCRAPE data journey for T2 shows a low agreement(0.6), also reflected in the number of common sharp decisions(0.4). This is a low score compared with the agreement ratioof prohibitions (0.9) and duties (0.8) that can be observed inTables 4f and 4h. It is su�cient to consider at this stage how itwas much easier to take decisions on prohibitions and duties,while permissions where a greater source of discussions anddisagreements with the system. Moreover, decisions aboutprohibitions and duties appeared to be sharper than theones about permissions, as both the agreement between theteams (T12) and the choices with strong confidence (T1+,T2+)received higher scores. However, on both types of policies thesource of disagreement is on the FOOD data journey. Weshowed that this is the case (8̃0% agreement). We complementthis data with a statistical analysis based on the Cohens kappacoe�cient (CKC), that takes into account the possibility of
Prohibitions
K-CAP 2017, (Submitted, 2017), Austin, Texas USA E. Daga et al.
Table 3: Data Journeys: System decisions
Journey Propagated Permissions Prohibitions Duties
SCRAPE 15/16 4/5 8/8 3/3FOOD 8/22 0/12 4/4 4/6CLOUD 5/7 0/2 4/4 1/1AVG 8/15 0/7 7/7 1/1CLEAN 9/17 0/8 5/5 4/4
Tot 39/77 4/34 28/28 13/15
the user on taking a decision (Q.1, Q.9). This feedback showsthat policy propagation is a di�cult problem, although itcan be solved with the right knowledge models. Therefore, atool supporting this task has good value for users. The lastquestion (Q.10) was meant to understand whether the DataHub manager could actually decide on policy propagation. Itturns out that most of the users think he/she cannot solvethe issue alone, but he/she should involve the data ownerand the process executor in this task. This conclusion reflectssome of the issues raised during the study, that are discussedin Section 7.
6 ACCURACY ANALYSISIn this Section we show how the decisions made by the userscompare to the system. The decisions taken by the systemare summarized in Table 3. For example, the SCRAPE datajourney required to check 16 policies and the system decidedto propagate 15 of them: 4 of the 5 permissions and all theprohibitions and duties. Tables 4a-4h summarize the resultsof our study in a quantitative way. The values are shownin two sets including the full numbers and the computedratio, considering all the decisions (Tables 4a and 4b), andthen split in permissions (Tables 4c and 4d), prohibitions(Tables 4e and 4f), and duties (Tables 4g and 4h). The valuesare first shown for each one of the user study (data journeyof each team), aggregated for each data journey (averageof both teams) and then as totals considering the decisionsfrom all data journeys (at the bottom). The data journeysrequired from seven to twenty-two policies to be analysedfor a total of seventy-seven decisions. Table 4a shows thenumber of decisions for each data journey (column D) andhow much the teams agreed with the system (T
avg
being theaverage value of the teams on the same data journey).
The agreement with the system is good, distributed dif-ferently across the data journeys and the teams, with anaverage ratio of 0.8. Moreover, this result is supported bythe high agreement rate between the two teams (T
avg
= 0.7).We observe that in more than half of the cases the decisionswere made with the same degree of confidence (T12+=0.6),and that in 70% of the cases users made a sharp decisionabout whether a policy would propagate or not (T1+/T2+
total average is 0.6). Inspecting the table we see that thedata journeys showing a lower agreement are FOOD/T1,AV G/T2 and CLEAN/T2. We will discuss these in the nextSection. The low scores on CLOUD/T12+ and CLOUD/T2+
only show a di↵erence in the degree of confidence of thedecisions, that is not especially relevant in this global view,
Table 4: Agreement analysis.
D: total number of decisions; T1, T2: agreement between sys-
tem and each team; Tavg: average agreement between teams
and system; T12: agreement between teams; T12+ agreement
between teams (only Certainly Yes/Absolutely No answers);
T1+, T2+: amount of Certainly Yes/Absolutely No answers.
Tables on the left indicate totals, while the ones on the right
show the related ratios.
(a) All decisions (totals)
Journey D T1 T2 Tavg
T12 T12+ T1+ T2+
SCRAPE 16 15 13 14 14 11 11 14FOOD 22 14 18 16 14 8 20 12CLOUD 7 5 7 6 5 1 5 2AVG 15 15 8 11.5 8 8 15 15CLEAN 17 12 9 10.5 14 3 13 6
All 77 58 55 31 56.5
(b) (ratios)
T1 T2 Tavg
T12 T12+ T1+ T2+
0.9 0.8 0.9 0.9 0.8 0.7 0.90.6 0.8 0.7 0.6 0.6 0.9 0.50.7 1 0.9 0.7 0.2 0.7 0.31 0.5 0.8 0.5 1 1 10.7 0.5 0.6 0.8 0.2 0.8 0.4
0.8 0.7 0.6 0.7
(c) Permissions (totals)
Journey D T1 T2 Tavg
T12 T12+ T1+ T2+
SCRAPE 5 4 2 3 3 0 0 3FOOD 12 12 12 12 12 6 12 6CLOUD 2 0 2 1 0 0 0 1AVG 7 7 0 3.5 0 0 7 7CLEAN 8 3 0 1.5 5 2 4 5
All 34 21 20 8 22.5
(d) (ratios)
T1 T2 Tavg
T12 T12+ T1+ T2+
0.8 0.4 0.6 0.6 0 0 0.61 1 1 1 0.5 1 0.50 1 0.5 0 N.A. 0 0.51 0 0.5 0 N.A. 1 10.4 0 0.2 0.6 0.4 0.5 0.6
0.6 0.6 0.4 0.7
(e) Prohibitions (totals)
Journey D T1 T2 Tavg
T12 T12+ T1+ T2+
SCRAPE 8 8 8 8 8 8 8 8FOOD 4 0 2 1 2 2 4 2CLOUD 4 4 4 4 4 0 4 0AVG 7 7 7 7 7 7 7 7CLEAN 5 5 5 5 5 0 5 0
All 28 25 26 17 22.5
(f) (ratios)
T1 T2 Tavg
T12 T12+ T1+ T2+
1 1 1 1 1 1 10 0.5 0.3 0.5 1 1 0.51 1 1 1 0 1 01 1 1 1 1 1 11 1 1 1 0 1 0
0.9 0.9 0.7 0.8
(g) Duties (totals)
Journey D T1 T2 Tavg
T12 T12+ T1+ T2+
SCRAPE 3 3 3 3 3 3 3 3FOOD 6 2 4 3 0 0 4 4CLOUD 1 1 1 1 1 1 1 1AVG 1 1 1 1 1 1 1 1CLEAN 4 4 4 4 4 1 4 1
All 15 12 9 6 11.5
(h) (ratios)
T1 T2 Tavg
T12 T12+ T1+ T2+
1 1 1 1 1 1 10.3 0.7 0.5 0 N.A. 0.7 0.71 1 1 1 1 1 11 1 1 1 1 1 11 1 1 1 0.3 1 0.3
0.8 0.6 0.7 0.8
altough this aspect will be discussed when looking at specificclasses of policies.
Tables 4c and 4d only show results involving policies oftype permission. The average agreement between the systemand the users considering all the decisions is 0.6. Particularly,the SCRAPE data journey for T2 shows a low agreement(0.6), also reflected in the number of common sharp decisions(0.4). This is a low score compared with the agreement ratioof prohibitions (0.9) and duties (0.8) that can be observed inTables 4f and 4h. It is su�cient to consider at this stage how itwas much easier to take decisions on prohibitions and duties,while permissions where a greater source of discussions anddisagreements with the system. Moreover, decisions aboutprohibitions and duties appeared to be sharper than theones about permissions, as both the agreement between theteams (T12) and the choices with strong confidence (T1+,T2+)received higher scores. However, on both types of policies thesource of disagreement is on the FOOD data journey. Weshowed that this is the case (8̃0% agreement). We complementthis data with a statistical analysis based on the Cohens kappacoe�cient (CKC), that takes into account the possibility of
Duties
K-CAP 2017, (Submitted, 2017), Austin, Texas USA E. Daga et al.
Table 3: Data Journeys: System decisions
Journey Propagated Permissions Prohibitions Duties
SCRAPE 15/16 4/5 8/8 3/3FOOD 8/22 0/12 4/4 4/6CLOUD 5/7 0/2 4/4 1/1AVG 8/15 0/7 7/7 1/1CLEAN 9/17 0/8 5/5 4/4
Tot 39/77 4/34 28/28 13/15
the user on taking a decision (Q.1, Q.9). This feedback showsthat policy propagation is a di�cult problem, although itcan be solved with the right knowledge models. Therefore, atool supporting this task has good value for users. The lastquestion (Q.10) was meant to understand whether the DataHub manager could actually decide on policy propagation. Itturns out that most of the users think he/she cannot solvethe issue alone, but he/she should involve the data ownerand the process executor in this task. This conclusion reflectssome of the issues raised during the study, that are discussedin Section 7.
6 ACCURACY ANALYSISIn this Section we show how the decisions made by the userscompare to the system. The decisions taken by the systemare summarized in Table 3. For example, the SCRAPE datajourney required to check 16 policies and the system decidedto propagate 15 of them: 4 of the 5 permissions and all theprohibitions and duties. Tables 4a-4h summarize the resultsof our study in a quantitative way. The values are shownin two sets including the full numbers and the computedratio, considering all the decisions (Tables 4a and 4b), andthen split in permissions (Tables 4c and 4d), prohibitions(Tables 4e and 4f), and duties (Tables 4g and 4h). The valuesare first shown for each one of the user study (data journeyof each team), aggregated for each data journey (averageof both teams) and then as totals considering the decisionsfrom all data journeys (at the bottom). The data journeysrequired from seven to twenty-two policies to be analysedfor a total of seventy-seven decisions. Table 4a shows thenumber of decisions for each data journey (column D) andhow much the teams agreed with the system (T
avg
being theaverage value of the teams on the same data journey).
The agreement with the system is good, distributed dif-ferently across the data journeys and the teams, with anaverage ratio of 0.8. Moreover, this result is supported bythe high agreement rate between the two teams (T
avg
= 0.7).We observe that in more than half of the cases the decisionswere made with the same degree of confidence (T12+=0.6),and that in 70% of the cases users made a sharp decisionabout whether a policy would propagate or not (T1+/T2+
total average is 0.6). Inspecting the table we see that thedata journeys showing a lower agreement are FOOD/T1,AV G/T2 and CLEAN/T2. We will discuss these in the nextSection. The low scores on CLOUD/T12+ and CLOUD/T2+
only show a di↵erence in the degree of confidence of thedecisions, that is not especially relevant in this global view,
Table 4: Agreement analysis.
D: total number of decisions; T1, T2: agreement between sys-
tem and each team; Tavg: average agreement between teams
and system; T12: agreement between teams; T12+ agreement
between teams (only Certainly Yes/Absolutely No answers);
T1+, T2+: amount of Certainly Yes/Absolutely No answers.
Tables on the left indicate totals, while the ones on the right
show the related ratios.
(a) All decisions (totals)
Journey D T1 T2 Tavg
T12 T12+ T1+ T2+
SCRAPE 16 15 13 14 14 11 11 14FOOD 22 14 18 16 14 8 20 12CLOUD 7 5 7 6 5 1 5 2AVG 15 15 8 11.5 8 8 15 15CLEAN 17 12 9 10.5 14 3 13 6
All 77 58 55 31 56.5
(b) (ratios)
T1 T2 Tavg
T12 T12+ T1+ T2+
0.9 0.8 0.9 0.9 0.8 0.7 0.90.6 0.8 0.7 0.6 0.6 0.9 0.50.7 1 0.9 0.7 0.2 0.7 0.31 0.5 0.8 0.5 1 1 10.7 0.5 0.6 0.8 0.2 0.8 0.4
0.8 0.7 0.6 0.7
(c) Permissions (totals)
Journey D T1 T2 Tavg
T12 T12+ T1+ T2+
SCRAPE 5 4 2 3 3 0 0 3FOOD 12 12 12 12 12 6 12 6CLOUD 2 0 2 1 0 0 0 1AVG 7 7 0 3.5 0 0 7 7CLEAN 8 3 0 1.5 5 2 4 5
All 34 21 20 8 22.5
(d) (ratios)
T1 T2 Tavg
T12 T12+ T1+ T2+
0.8 0.4 0.6 0.6 0 0 0.61 1 1 1 0.5 1 0.50 1 0.5 0 N.A. 0 0.51 0 0.5 0 N.A. 1 10.4 0 0.2 0.6 0.4 0.5 0.6
0.6 0.6 0.4 0.7
(e) Prohibitions (totals)
Journey D T1 T2 Tavg
T12 T12+ T1+ T2+
SCRAPE 8 8 8 8 8 8 8 8FOOD 4 0 2 1 2 2 4 2CLOUD 4 4 4 4 4 0 4 0AVG 7 7 7 7 7 7 7 7CLEAN 5 5 5 5 5 0 5 0
All 28 25 26 17 22.5
(f) (ratios)
T1 T2 Tavg
T12 T12+ T1+ T2+
1 1 1 1 1 1 10 0.5 0.3 0.5 1 1 0.51 1 1 1 0 1 01 1 1 1 1 1 11 1 1 1 0 1 0
0.9 0.9 0.7 0.8
(g) Duties (totals)
Journey D T1 T2 Tavg
T12 T12+ T1+ T2+
SCRAPE 3 3 3 3 3 3 3 3FOOD 6 2 4 3 0 0 4 4CLOUD 1 1 1 1 1 1 1 1AVG 1 1 1 1 1 1 1 1CLEAN 4 4 4 4 4 1 4 1
All 15 12 9 6 11.5
(h) (ratios)
T1 T2 Tavg
T12 T12+ T1+ T2+
1 1 1 1 1 1 10.3 0.7 0.5 0 N.A. 0.7 0.71 1 1 1 1 1 11 1 1 1 1 1 11 1 1 1 0.3 1 0.3
0.8 0.6 0.7 0.8
altough this aspect will be discussed when looking at specificclasses of policies.
Tables 4c and 4d only show results involving policies oftype permission. The average agreement between the systemand the users considering all the decisions is 0.6. Particularly,the SCRAPE data journey for T2 shows a low agreement(0.6), also reflected in the number of common sharp decisions(0.4). This is a low score compared with the agreement ratioof prohibitions (0.9) and duties (0.8) that can be observed inTables 4f and 4h. It is su�cient to consider at this stage how itwas much easier to take decisions on prohibitions and duties,while permissions where a greater source of discussions anddisagreements with the system. Moreover, decisions aboutprohibitions and duties appeared to be sharper than theones about permissions, as both the agreement between theteams (T12) and the choices with strong confidence (T1+,T2+)received higher scores. However, on both types of policies thesource of disagreement is on the FOOD data journey. Weshowed that this is the case (8̃0% agreement). We complementthis data with a statistical analysis based on the Cohens kappacoe�cient (CKC), that takes into account the possibility of
All policies
Feedback: @enridaga
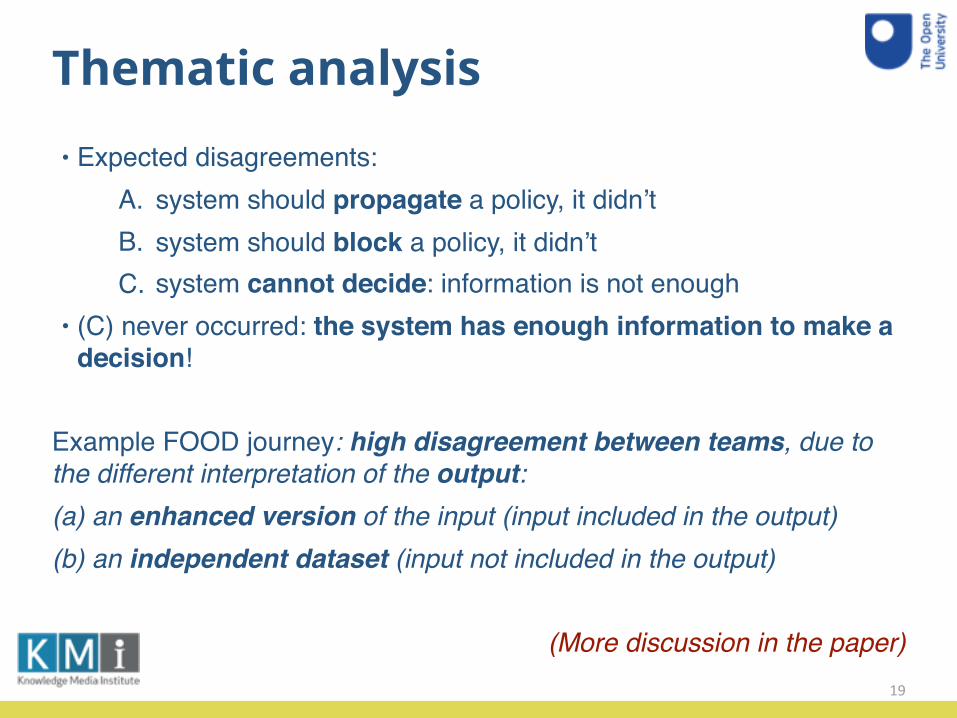
Thematic analysis• Expected disagreements:
A. system should propagate a policy, it didn’tB. system should block a policy, it didn’tC. system cannot decide: information is not enough
• (C) never occurred: the system has enough information to make a decision!
Example FOOD journey: high disagreement between teams, due to the different interpretation of the output:(a) an enhanced version of the input (input included in the output)(b) an independent dataset (input not included in the output)
(More discussion in the paper)19

Thematic analysis• Incomplete knowledge: rules missing or wrong, data flows
inaccurate, …• Data reverse engineering: recurring theme (e.g. FOOD)• Content-dependent decisions: current experiments assumed
reasoning at design time, although it is also possible to reason on execution traces
• Dependant policies: permission:modify implies permission:use - but we haven’t considered that
• The Legal Knowledge: users commented on the lack of legal expertise. – a support tool is useful– a legal framework on top of the components is theoretically
possible, although unlikely in the short term …
20

Conclusions• The system is accurate as developers/ data managers can be
• variance between the teams similar to the ones between each team and system (Cohen’s kappa coefficient)
• The task is perceived as difficult, although not impossible, and the system is therefore of good value for users
• The assumption behind the system is correct: there is a fundamental correspondence between the possible data-to-data relations and the way policies are propagated• (and reuse does not necessarily imply derivation)
21Feedback: @enridaga

Future work• How to consider the rights of the stakeholders other then data
publishers (e.g. process designer?)• How to assess consistency of processes wrt policies• Policy and process knowledge must be accurate and reflect the
relevant data-to-data relations. How can we assure that?
Challenge: “They must do it together”• Need for shared knowledge about “data actions”, from jargon to
consensus (remodelling, refactoring, extraction, …)• Negotiation of policies between data providers, processors and
consumers - also a non-technical challenge
22