PROJECT REPORT 18-05 - Matís · project report 18-05 ... sensory evaluation, ... appendix a: shelf...
59
PROJECT REPORT 18-05 Ása Þorkelsdóttir Kolbrún Sveinsdóttir Kristín A. Þórarinsdóttir Soffía Vala Tryggvadóttir Emilía Martinsdóttir Rósa Jónsdóttir Páll Gunnar Pálsson AUGUST 2005 Shelf life of chilled radio-frequency and conventionally heated cod and salmon fillets Radio-Frequency Heating Technology for Minimally Processed Fish Products; RF-Fish EU project number: QLK1-CT-2001-01788
Transcript of PROJECT REPORT 18-05 - Matís · project report 18-05 ... sensory evaluation, ... appendix a: shelf...

PROJECT REPORT18-05
Ása ÞorkelsdóttirKolbrún SveinsdóttirKristín A. ÞórarinsdóttirSoffía Vala TryggvadóttirEmilía MartinsdóttirRósa JónsdóttirPáll Gunnar Pálsson
AUGUST 2005
Shelf life of chilled radio-frequency and conventionally heated
cod and salmon fillets
Radio-Frequency Heating Technology for Minimally Processed Fish Products; RF-Fish
EU project number: QLK1-CT-2001-01788

Titill / Title Shelf life of chilled radio-frequency and conventionally heated cod and salmon fillets
Höfundar / Authors Ása Þorkelsdóttir, Kolbrún Sveinsdóttir, Kristín A. Þórarinsdóttir, Soffía Vala Tryggvadótti, Emilía Martinsdóttir, Rósa Jónsdóttir, Páll Gunnar Pálsson
Skýrsla Rf /IFL report 18-05 Útgáfudagur / Date: 18-08-05 Verknr. / project no. 1530 Styrktaraðilar / funding:
EU-Commission: Radio-Frequency Heating Technology for Minimally Processed Fish Products; RF-Fish. EU project number: QLK1-CT-2001-01788
Ágrip á íslensku:
Skýrsla þessi er samantekt fimm tilrauna í verkefninu "Radio-Frequency Heating Technology for Minimally Processed Fish Products" árin 2004 og 2005. Fjórar geymsluþolstilraunir voru framkvæmdar á soðnum, vakúmpökkuðum, laxa og þorskbitum sem voru RF (radio frequency)-hitaðir og hitaðir við hefðbundna þrýstisuðu (conventional autoclave) við 75°C og 95°C og geymdir við 3°C. Ferskleiki og áferð voru metin með skynmati og mæld var áferð með tæki, vatnsheldni og þránun. Í fimmtu tilrauninni var soðinn þorskur í lauksósu metinn m.t.t geymsluþols af skynmatshópum í Noregi og á Íslandi. Samanburður á forsuðuaðferðum og hitunar hitastigi leiddi í ljós svipaða breytingu á ferskleikaeinkennum. Eftir um tvær vikur var farið að greinast aukabragð/óbragð af þorskinum sem var hitaður við 75°C og var ekki munur eftir forhitunaraðferðum. Áferðin var safaríkari, meyrari og flögukenndari í RF hituðum þorski. Eftir tuttugu daga geymslu var súrt bragð og þráabragð farið að greinast í báðum laxahópum. RF laxinn var flögukenndari og meyrari en lax úr hefðbundinni hitun. Ekki náðist lengra geymsluþol með hærra hitastigi (95°C)í forsuðu. Hærra hitastig hafði verri áhrif á áferð og var mjög erfitt að mæla og meta áferðina. Fiskur forhitaður við 75°C var safaríkari og meyrari og flögukenndari þ.e hélt betur lögun sinni en fiskur hitaður við 95°C. Af þessu er dregin sú ályktun að RF hitaður fiskur hafi sambærilegt geymsluþol og hefðbundinn forsoðinn fiskur. Þorskur í lauksósu var af sæmilegum gæðum fyrstu þrjár vikur kæligeymslu, en báðir skynmatshópar voru sammála um að eftir það voru gæðin ekki ásættanleg.
Lykilorð á íslensku: RF hitun, þorskur, lax, geymsluþol, kæligeymsla, skynmat, áferð, vatnsheldni
Summary in English:
This report is a part of the EU-project "Radio-Frequency Heating Technology for Minimally Processed Fish Products" and combines five studies carried out in 2004 and 2005. Four quality and shelf life studies were performed on vacuum packed cod and salmon loins that had been RF (radio frequency) and CON (conventional autoclave) heated at 75 and 95°C and stored at 3°C. Freshness and texture was evaluated with sensory evaluation, texture was measured with texture analyser, water holding capacity and rancidity was measured. In the fifth experiment conventionally autoclave heated cod in green onion sauce was evaluated by sensory panels in Norway and Iceland. Comparison of different heat treatments and temperature during heating showed similar changing in freshness evaluation. After 2 weeks, off-flavour was detected of the cod heated at 75°C and no difference was detected by heat treatment. The texture of RF heated cod was more juicy, tender and flaky. Sour and rancid flavour was detected in both salmon sample groups after 20 days of storage. The RF heated salmon was more flaky and softer compared to the CON heated salmon. Longer shelf life was not obtained by higher temperature (95°C) during pre-heating, and influenced the texture negatively and it became more difficult to evaluate and measure the texture. Fish pre-heated at 75°C was more juicy, tender and flaky and retained its form better compared to fish pre-heated at 95°C. It was concluded that RF heated fish has comparable shelf life to conventionally autoclave heated fish. Cod in green onion sauce was of reasonable quality the first three weeks of chilled storage, but both sensory panels agreed that after that the quality was not acceptable.
English keywords: Radio-frequency heating, cod, salmon, shelf life, chilled storage, sensory evaluation, texture, water holding capacity
© Copyright Rannsóknastofnun fiskiðnaðarins / Icelandic Fisheries Laboratories

Shelf life of chilled cod and salmon fillets after radio-
frequency and conventional heating Radio-Frequency Heating Technology for Minimally Processed Fish Products; RF-Fish.
EU project number: QLK1-CT-2001-01788

Titill / Title Shelf life of chilled radio-frequency and conventionally heated cod and salmon fillets
Höfundar / Authors Ása Þorkelsdóttir, Kolbrún Sveinsdóttir, Kristín A. Þórarinsdóttir, Soffía Vala Tryggvadótti, Emilía Martinsdóttir, Rósa Jónsdóttir, Páll Gunnar Pálsson
Skýrsla Rf /IFL report 18-05 Útgáfudagur / Date: 18-08-05 Verknr. / project no. 1530 QLK1-CT-2001-01788
Styrktaraðilar / funding:
EU-Commission: Radio-Frequency Heating Technology for Minimally Processed Fish Products; RF-Fish. EU project number: QLK1-CT-2001-01788
Ágrip á íslensku:
Skýrsla þessi er samantekt fimm tilrauna í verkefninu "Radio-Frequency Heating Technology for Minimally Processed Fish Products" árin 2004 og 2005. Fjórar geymsluþolstilraunir voru framkvæmdar á soðnum, vakúmpökkuðum, laxa og þorskbitum sem voru RF (radio frequency)-hitaðir og hitaðir við hefðbundna þrýstisuðu (conventional autoclave) við 75°C og 95°C og geymdir við 3°C. Ferskleiki og áferð voru metin með skynmati og mæld var áferð með tæki, vatnsheldni og þránun. Í fimmtu tilrauninni var soðinn þorskur í lauksósu metinn m.t.t geymsluþols af skynmatshópum í Noregi og á Íslandi. Samanburður á forsuðuaðferðum og hitastigi við hitun leiddi í ljós svipaða breytingu á ferskleikaeinkennum. Eftir um tvær vikur var farið að greinast aukabragð/óbragð af þorskinum sem var hitaður við 75°C og var ekki munur eftir forhitunaraðferðum. Áferðin var safaríkari, meyrari og flögukenndari í RF hituðum þorski. Eftir tuttugu daga geymslu var súrt bragð og þráabragð farið að greinast í báðum laxahópum. RF laxinn var flögukenndari og meyrari en lax úr hefðbundinni hitun. Ekki náðist lengra geymsluþol með hærra hitastigi (95°C) í forsuðu. Hærra hitastig hafði verri áhrif á áferð og var mjög erfitt að mæla og meta áferðina. Fiskur forhitaður við 75°C var safaríkari og meyrari og flögukenndari þ.e hélt betur lögun sinni en fiskur hitaður við 95°C. Af þessu er dregin sú ályktun að RF hitaður fiskur hafi sambærilegt geymsluþol og hefðbundinn forsoðinn fiskur. Þorskur í lauksósu var af sæmilegum gæðum fyrstu þrjár vikur kæligeymslu, en báðir skynmatshópar voru sammála um að eftir það voru gæðin ekki ásættanleg.
Lykilorð á íslensku: RF hitun, þorskur, lax, geymsluþol, kæligeymsla, skynmat, áferð, vatnsheldni
Summary in English:
This report is a part of the EU-project "Radio-Frequency Heating Technology for Minimally Processed Fish Products" and combines five studies carried out in 2004 and 2005. Four quality and shelf life studies were performed on vacuum packed cod and salmon loins that had been RF (radio frequency) and CON (conventional autoclave) heated at 75 and 95°C and stored at 3°C. Freshness and texture was evaluated with sensory evaluation, texture was measured with texture analyser, water holding capacity and rancidity was measured. In the fifth experiment conventionally autoclave heated cod in green onion sauce was evaluated by sensory panels in Norway and Iceland. Comparison of different heat treatments and temperature during heating showed similar changes in freshness attributes. After 2 weeks, off-flavour was detected in the cod heated at 75°C and no difference was found between samples from different heat treatment. The texture of RF heated cod was more juicy, tender and flaky. Sour and rancid flavour was detected in both salmon sample groups after 20 days of storage. The RF heated salmon was more flaky and softer compared to the CON heated salmon. Longer shelf life was not obtained by higher temperature (95°C) during pre-heating, and influenced the texture negatively and it became more difficult to evaluate and measure the texture. Fish pre-heated at 75°C was more juicy, tender and flaky and retained its form better compared to fish pre-heated at 95°C. It was concluded that RF heated fish has comparable shelf life to conventionally autoclave heated fish. Cod in green onion sauce was of reasonable quality the first three weeks of chilled storage, but both sensory panels agreed that thereafter the quality was not acceptable.
English keywords: Radio-frequency heating, cod, salmon, shelf life, chilled storage, sensory evaluation, texture, water holding capacity
© Copyright Rannsóknastofnun fiskiðnaðarins / Icelandic Fisheries Laboratories

1. INTRODUCTION......................................................................................................... 1
2. MATERIAL & METHODS......................................................................................... 4 Sample preparation..................................................................................................... 4 Microbial counts......................................................................................................... 5 Sensory evaluation of raw material -cod.................................................................... 5 Sensory evaluation of re-heated and cooked fillets.................................................... 5 Texture measurements ............................................................................................... 6 Cook-out..................................................................................................................... 7 Water holding capacity (WHC) ................................................................................. 8 Water content, fat content and pH.............................................................................. 8 Peroxide value ............................................................................................................ 8 Thiobarbituric reactive substances (TBARS) ............................................................ 9 Formaldehyde (FA) content ....................................................................................... 9 Data analysis .............................................................................................................. 9
3. RESULTS AND DISCUSSION ................................................................................ 10
EXPERIMENT 3; SHELF LIFE OF CONVENTIONALLY (CON) AND
RADIO-FREQUENCY (RF) HEATED AT 75°C COD STORED AT 3°C.......... 10
Microbial counts....................................................................................................... 10 Sensory evaluation of raw material.......................................................................... 10 Sensory evaluation ................................................................................................... 10 Instrumental texture measurements.......................................................................... 13 Water content and pH............................................................................................... 15 Cook-out and water holding capacity (WHC) ......................................................... 16 Thiobarbituric reactive substances (TBARS) .......................................................... 16
EXPERIMENT 4; SHELF LIFE OF CONVENTIONALLY (CON) AND
RADIO-FREQUENCY (RF) HEATED AT 75°C SALMON STORED AT 3°C . 17
Microbial counts....................................................................................................... 17 Sensory evaluation ................................................................................................... 17 Instrumental texture measurement ........................................................................... 19 Water content, fat content and pH............................................................................ 20 Cook-out and water holding capacity (WHC) ......................................................... 22 Peroxide value (PV) and thiobarbituric reactive substances (TBARS) ................... 22
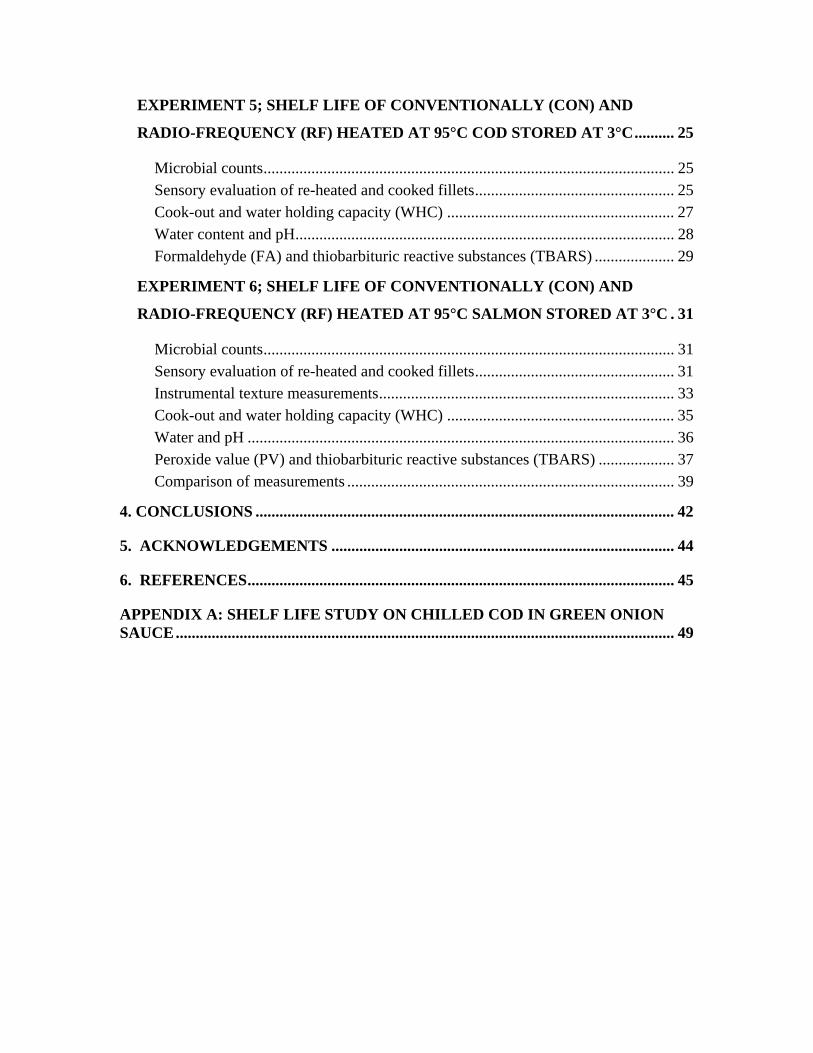
EXPERIMENT 5; SHELF LIFE OF CONVENTIONALLY (CON) AND
RADIO-FREQUENCY (RF) HEATED AT 95°C COD STORED AT 3°C.......... 25
Microbial counts....................................................................................................... 25 Sensory evaluation of re-heated and cooked fillets.................................................. 25 Cook-out and water holding capacity (WHC) ......................................................... 27 Water content and pH............................................................................................... 28 Formaldehyde (FA) and thiobarbituric reactive substances (TBARS) .................... 29
EXPERIMENT 6; SHELF LIFE OF CONVENTIONALLY (CON) AND
RADIO-FREQUENCY (RF) HEATED AT 95°C SALMON STORED AT 3°C . 31
Microbial counts....................................................................................................... 31 Sensory evaluation of re-heated and cooked fillets.................................................. 31 Instrumental texture measurements.......................................................................... 33 Cook-out and water holding capacity (WHC) ......................................................... 35 Water and pH ........................................................................................................... 36 Peroxide value (PV) and thiobarbituric reactive substances (TBARS) ................... 37 Comparison of measurements .................................................................................. 39
4. CONCLUSIONS ......................................................................................................... 42
5. ACKNOWLEDGEMENTS ...................................................................................... 44
6. REFERENCES........................................................................................................... 45
APPENDIX A: SHELF LIFE STUDY ON CHILLED COD IN GREEN ONION SAUCE............................................................................................................................. 49
4

1. INTRODUCTION
The following experiment was done as a part of the EU project "Radio-Frequency
Heating Technology for Minimally Processed Fish Products" (EU project number:
QLK1-CT-2001-01788).
Previous reports of this project describe different comparisons of quality measures and
products of interest to the project.
In the first part of this project a comparison of quality measurements of fresh and thawed
cod fillets was done and showed that sensory analysis, texture measurements and
measurement of water holding capacity in addition to microbial counts were all methods
that gave valuable information about the quality (Sveinsdottir et al, 2003a).
In the second part of the project four different treatments of cod and salmon fillets were
compared; fresh packed, frozen, radio-frequency heated and conventionally heated fillets.
In this comparison fresh and frozen/thawed samples were cooked and compared to re-
heated samples of radio-frequency heated and conventionally heated fillets. The
comparison showed that fresh and frozen/thawed samples received higher freshness
scores. Rancid flavour was detected in the re-heated salmon fillets and liquid formation
was observed in the re-heated samples (Thorkelsdottir et al, 2004).
The next step in the project was performing shelf life studies of the heated products (cod
and salmon), during frozen and chilled storage.
Shelf life studies of pre-heated (radio-frequency and conventionally heated) and raw
frozen (individually quick frozen (IQF)) cod and salmon stored at -24°C showed that the
products were still acceptable after 9 (cod) and 8 (salmon) months of frozen storage. The
pre-heated products differed from the IQF products as the IQF products were flakier and
had less water holding capacity compared to pre-heated samples (RF and CON), and the
preheated samples were softer (Thorkelsdottir et al, 2005).
1

Shelf life of fresh fish is short, 9 days for cod fillets stored in ice (Magnússon and
Martinsdóttir, 1995) but 15 days for whole cod stored in ice (Martinsdottir, 2001) and 20
days for whole salmon stored in ice (Sveinsdottir et al, 2003b). According to information
from fish processing companies (HB-Grandi, Akranes, Iceland), storage time of fresh
packed cod fillets is often regarded to be 4-7 days.
Pre-cooked products are well known and pre-cooking may be used to extend shelf life.
Processing methods, storage conditions such as temperature and packaging material are
important factors in keeping the shelf life as long as possible. However, odour, flavour,
appearance and texture will be affected by the heat treatment, resulting in reduced quality
despite a prolonged shelf life.
The temperature during heat treatment is known to affect the prolonged shelf life. In a
shelf life study of sous vide salmon (Conzález-Fandos et.al, 2005) fish processed at 65°C
had shelf life about 21 days when stored at 2°C, which was extended up to 45 days when
the product was processed at 90°C.
Expected storage time of pre-cooked cod produced at Fjordkokken are 33 days kept at 0-
4°C but 26 days for pre-cooked salmon products kept at 0-4°C.
This report describes the shelf life studies of chilled preheated products. It combines four
studies of the year 2004 and 2005. The main objective of the studies was to compare
different treatments (Radio-Frequency Heating Technology (RF) used to heat fish loins at
two different temperatures and conventionally heated (CON) used to heat fish loins at
two different temperatures) of cod and salmon loins packed in vacuum and observe and
determine shelf life and quality of those products when stored at 3°C.
The four experiments were the following:
Experiment 3; Shelf life of conventionally (CON) and Radio-Frequency (RF) heated at
75°C cod stored at 3°C.
Experiment 4; Shelf life of conventionally (CON) and Radio-Frequency (RF) heated at
75°C salmon stored at 3°C.
Experiment 5; Shelf life of conventionally (CON) and Radio-Frequency (RF) heated at
95°C cod stored at 3°C.
2

Experiment 6; Shelf life of conventionally (CON) and Radio-Frequency (RF) heated at
95°C salmon stored at 3°C.
The aim was to estimate maximum shelf life and evaluate quality of those products by
using measurements of sensory evaluation, texture measurement with Texture Analyser,
Water Holding Capacity (WHC), cook-out %, pH and Thiobarbituric reactive substances
(TBARS) content. In addition Formaldehyde (FA) was measured in cod and Peroxide
value in salmon.
In addition to the four Experiments mentioned above, a study was carried out to compare
the sensory evaluation of two different sensory panels (at the Icelandic Fisheries
Laboratories and Fjordkokken) of ready made conventionally heated cod loins in green-
onion sauce (see Appendix 1).
3

2. MATERIAL & METHODS
Sample preparation
Cod (Gadus morhua):
Raw material was collected by the fish processing company HB-Grandi (Akranes,
Iceland) in May 2004 (Experiment 3) and April 2005 (Experiment 5). After catch, the cod
was stored whole in ice for 2-3 days until it was filleted, deskinned and trimmed, loin
parts (140±10g) were cut from the fillets, packed in vacuum packs as in previous trials
(Sveinsdottir and others, 2003a) and stored at 0-1°C.
The day of packing, the cod samples were packed with ice mats in polystyrene boxes. A
part of the raw material was transported to IFL (Icelandic Fisheries Laboratories,
Reykjavik, Iceland) for quality check of raw material. Other samples were transported to
NORCONSERV (Stavanger, Norway) for conventional heating and to Fraunhofen IVV
(Freising, Germany) for RF heating. The samples were heated 4 days after packing and
stored at 0-1°C until transported to IFL (Icelandic Fisheries Laboratories, Reykjavik,
Iceland), in polystyrene boxes with ice mats. The samples were stored at 3°C until
analysed. At the same day as samples were heated in Norway and Germany, raw material
was heated at IFL and evaluated as the beginning of the shelf life study.
Salmon (Salmo salar):
Raw material was collected by FK (Fjordkjokken AS, Varhaug, Norway) in August 2004
(Experiment 4) and April 2005 (Experiment 6). Loin parts (140±10g) were cut from the
fillets, packed in vacuum pack as in previous trials (Sveinsdottir and others, 2003a) and
stored at 0-1°C.
The day of packing, the salmon samples were packed with ice mats in polystyrene boxes.
A part of the raw material was transported to IFL for quality check of raw material. Other
samples were transported to NORCONSERV for conventional heating and to Fraunhofen
IVV for RF-heating. The samples were heated 4 days after packing and stored at 0-1°C
until transported to IFL, in polystyrene boxes with ice mats. The samples were stored at
3°C until analysed. At the same day as samples were heated in Norway and Germany,
raw material was heated at IFL and evaluated as the beginning of the shelf life study.
4

Microbial counts
For each sample a 150 g piece of fillet was placed in a filter stomacher bag (from
Bagsystem Line, Breveté, France) and 150 g of phosphate buffer added. The bag was
placed in the stomacher and blended for 2 min. Then a 1/10 dilution was done: From the
filtered section of the bag 22 ml (equals 11 g fish) were pipetted into a new filter bag and
88 g buffer added. Total plate counts were done on Plate Count Agar with 0.5% NaCl by
the spread plate technique. First, 1 ml was divided onto 3 plates (1/10). Then tenfold
dilution was made as needed. Plates were incubated at 22°C for 3 days. For Bacillus
spore counts, 10 ml of the 1/10 mixture were heated at 75°C for 30 min. The pour-plate
technique was used and the same agar as above. Plates were incubated at 35°C for 2 days.
Sensory evaluation of raw material -cod
Sensory evaluation of raw material was done by the Quality Index Method (QIM) on the
whole cod. The QIM scheme lists quality attributes for appearance/texture, eyes, gills,
flesh and blood, and descriptions of how they change with storage time. Scores were
given for each quality attribute according to the descriptions, ranging from 0-3. Very
fresh fish normally receives scores close to 0 with scores increasing with storage time.
The scores given for all the quality attributes are added to give the Quality Index, which
increases linearly with storage time in ice. The sensory evaluation of each attribute was
conducted according to Martinsdottir and others (2001). Two QIM experts from IFL
evaluated 10 whole cod from the batch used for Experiment 3 at HB-Grandi.
Sensory evaluation of re-heated and cooked fillets
The sensory evaluation of freshness of cooked cod was done using the Torry scheme
giving scores from 10 (very fresh) to 3 (Shewan and others 1953). In addition, the
Quantitative Descriptive Analysis (QDA) method (introduced by Stone and Sidel (1985))
was used to assess the cooked samples. The method assumes detailed description of a
product, such as odour, flavour, appearance and texture. However, in this project the
focus was only on texture for cod and therefore an unstructured scale (0-100 %) was used
for a list of words describing texture.
5

Cooked and re-heated salmon fillets were evaluated by the QDA method (introduced by
Stone and Sidel (1985)). Unstructured scale (0-100 %) was used on a list of words of
seventeen attributes describing odour, flavour and texture of cooked salmon. Attributes
were both positive and negative to evaluate the freshness of samples.
Twelve panellists of the Icelandic Fisheries Laboratories sensory panel participated in the
sensory evaluation of the cooked cod. They were all trained according to international
standards (ISO 1993); including detection and recognition of tastes and odours, training
in the use of scales, and in the development and use of descriptors. The members of the
panel were familiar with the Torry and QDA method and experienced in sensory analysis
of cod.
The samples were heated at 95-100°C in a pre-warmed oven (Convostherm, Convostar,
Germany) with air circulation and steam for 9 minutes in the vacuum packs. Core
temperature in samples was 4°C when put into the oven and around 70°C after heating.
Four samples were collect from each loin. The size of each sample was ca. 1-2 cm in
width, and 4-6 cm in length. The samples were placed in aluminium boxes (5 cm in width
x 8 cm in length x 4 cm in height) and closed with plastic covers before served for the
sensory panel. Each sample was coded with a composite of 3 numbers that did not
indicate the storage time or any other information. Each panellist evaluated 3 samples in
each session and each sample was evaluated in duplicate.
All sample observations were conducted according to international standards (ISO 1988).
Texture measurements
Texture of cooked samples was measured using the Texture Profile Analysis test (TPA).
Five cooked loins of cod and salmon were measured from each treatment. The texture
analyser used was the TA.XT2i Stable Micro Systems (Stable Micro Systems Ltd.,
Godalming, England).
The force - time curve was analysed to determine three various texture parameters:
Hardness: The maximum force (N) at certain adjusted deformation. Cohesiveness:
6
Amount (%) of displacement before the sample brakes (strength of inner bonds).
Resilience: The capability (%) of a strained body to recover after deformation caused by
compressive stress.
The SMS probe and setting for the TPA test were: Aluminium Compression plate, 100
diameters (P/100). Pre test speed 2,0 mm/s; speed in sample 0,8 mm/s. Strain (distance)
80%. Load Cell Capacity (kg) 25. During a TPA test the sample was compressed two
times in a reciprocating motion that was supposed to imitate the action of the jaw.
The samples were cooked in the vacuum packs in a steam oven (95-100°C) for 9 minutes
and put on ice, and stored in 2°C refrigerator for minimum 2 hours before measured. Two
to three cm of the top (neck part) of each fish sample (loin) were removed, then three 2.5-
cm slices were cut across the fillet and each slice cut into 2.5-cm cube (sample size 2.5 *
2.5 cm). All fish pieces and prepared samples were stored on plastic film on ice until
measured. The reported TPA force for each fillet (loin) was the average value of 3-4
measurements.
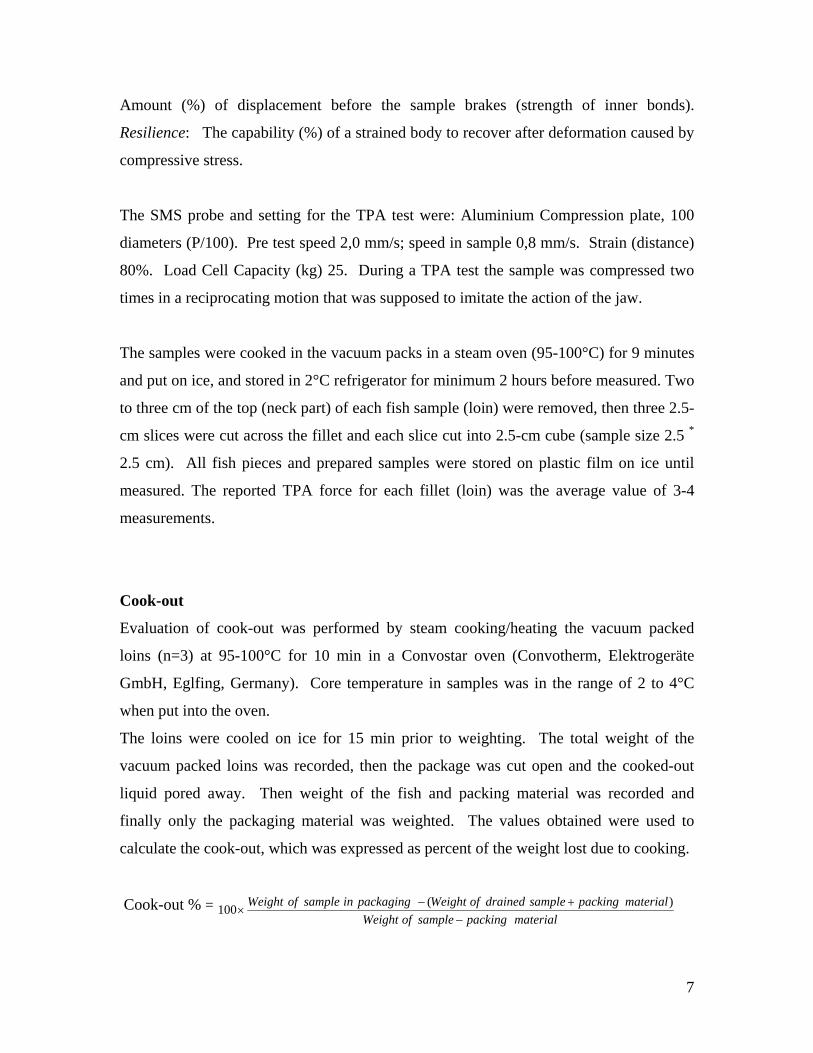
Cook-out
Evaluation of cook-out was performed by steam cooking/heating the vacuum packed
loins (n=3) at 95-100°C for 10 min in a Convostar oven (Convotherm, Elektrogeräte
GmbH, Eglfing, Germany). Core temperature in samples was in the range of 2 to 4°C
when put into the oven.
The loins were cooled on ice for 15 min prior to weighting. The total weight of the
vacuum packed loins was recorded, then the package was cut open and the cooked-out
liquid pored away. Then weight of the fish and packing material was recorded and
finally only the packaging material was weighted. The values obtained were used to
calculate the cook-out, which was expressed as percent of the weight lost due to cooking.
Cook-out % = materialpackingsampleofWeight
materialpackingsampledrainedofWeightpackaginginsampleofWeight−
+−×
)(100
7
Water holding capacity (WHC)
The analysis of WHC was based on method described by Børresen (1980) but was
modified by reducing the speed from 1500 g`s to 500x g`s. Cooked samples (n=3) were
stirred with a spatula to homogenise the sample. Approximately 2 g of the muscle were
weighted accurately into a test tube with known weight and centrifuged (SS-34 rotor;
Sorvall RC-5B, Du Pont, Delaware, USA) at 530g for 5 min; with temperature
maintained at 2 to 5 °C. Two parallels were used for each sample. After centrifugation,
the total weight of each test tube and sample was recorded and used to calculate sample
weight after centrifugation. WHC was calculated as percentage remaining water of initial
water in sample:
WHC (%) = (v1-Δr)/(100-Δr)* 100%
v1 = % water in sample before centrifugation
v1 = (Weight before drying-Weight after drying) / (Weight before drying) * 100%
Δr= Weight before centrifugation - Weight after centrifugation / (Weight before centrifugation) * 100%
Water content, fat content and pH
Water content (g/100g) was calculated as the loss in weight, after drying at 105 °C for 4 h
(ISO 1983). Fat content was determined by the AOCS Soxhlet method Ba 3-38 (AOCS,
1998) using petroleum ether (Bp. 40-60 °C) for extraction. The pH was measured before
WHC-analysis by inserting a combination electrode (SE 104, Mettler Toledo GmbH,
Greifensee, Switzerland) directly into the samples. The electrode was connected to a
portable pH meter (Portamess 913 pH, Knick, Berlin, Germany).
Peroxide value
Extraction of lipids was carried out by chloroform/methanol extraction system based on
the method of by Bligh and Dyer (1959) with some modifications (Hanson and Olley,
1963) and with butylated hydroxytoluene (BHT) admixed into all solvents (50-100
mg/L). The following determinations on the lipid fraction were performed after
evaporation (Büchi, Switzerland) at 37 °C under vacuum. Peroxide value (meq/kg lipid)
8
of the extracted lipids was measured by iodometric titration according to AOAC official
method 965.33 (AOAC, 1990).
Thiobarbituric reactive substances (TBARS)
TBARS were determined by a modified version (Sørensen & Jørgensen 1996) of the
extraction method described by Vyncke (1970, 1975) with few modifications. The
sample size was reduced to 15 g and homogenized with 30 mL of 7.5% trichloroacetic
acid solution containing 0.1% of both propyl gallate and EDTA. The absorbance of
samples and standards were measured at 530 nm. TBARS, expressed as µmol
malondialdehyde per kilogram of sample (µmol MDA/kg), was calculated using
malondialdehyd-bis-(diethyl acetate) as standard.
Formaldehyde (FA) content
Samples were prepared with addition of phosphoric acid and distillation of formaldehyde
and then react with cromotropicacid. Absorbance were measured at 530 nm. (Z.Anal.
Chem. 1937).
Data analysis
Statistical analysis was performed by Microsoft Excel 8.00 (Microsoft Inc, Redmond,
USA) and NCSS 2000 (NCSS, Utah, USA). Student’s t-test, ANOVA and Duncan’s test
were performed to analyse if the samples were statistically different. Multivariate
comparison of the different attributes measured was carried out in the statistical
programme Unscrambler ®, Version 6.1 (CAMO, Trondheim, Norway), with principal
component analysis (PCA). Before the analysis, variables were scaled. Each element in
the matrix was multiplied with the inverse of the standard deviation of the corresponding
variable if the variables had different ranges. By doing this, each variable has the same
variance. The significance level was p < 0.05.
9

3. RESULTS AND DISCUSSION
The following chapter describes the results of experiments 3, 4, 5 and 6.
EXPERIMENT 3; SHELF LIFE OF CONVENTIONALLY (CON) AND RADIO-
FREQUENCY (RF) HEATED AT 75°C COD STORED AT 3°C
Microbial counts
Total viable counts are shown in table 1. The values were within the limits of good
quality of raw material defined in the project (Palsson et al 2005).
Table 1. Microbial counts (Total plate counts at 22°C) cfu/g.
Days after precooking Sample TVC
Raw material 15300 day 6 CON <10 day 6 RF 140 day 14 CON EST<10 day 14 RF EST 40 day 18 CON EST<10 day 18 RF EST 40
Sensory evaluation of raw material
At the processing day average QI for 10 evaluated cod was 0.9 and within the limits of
acceptable freshness in this project i.e. QI<4. Temperature in evaluated fish was -0.2°C-
0.9°C and after packing of fish loin parts the temperature was -0.8°C.
Sensory evaluation
At the same day as the heating process was performed in Norway and Germany, 3 days
after packing of the raw material, samples were cooked at IFL and evaluated. The
samples are named and called storage day 0 in the shelf life experiment. RF and CON
10
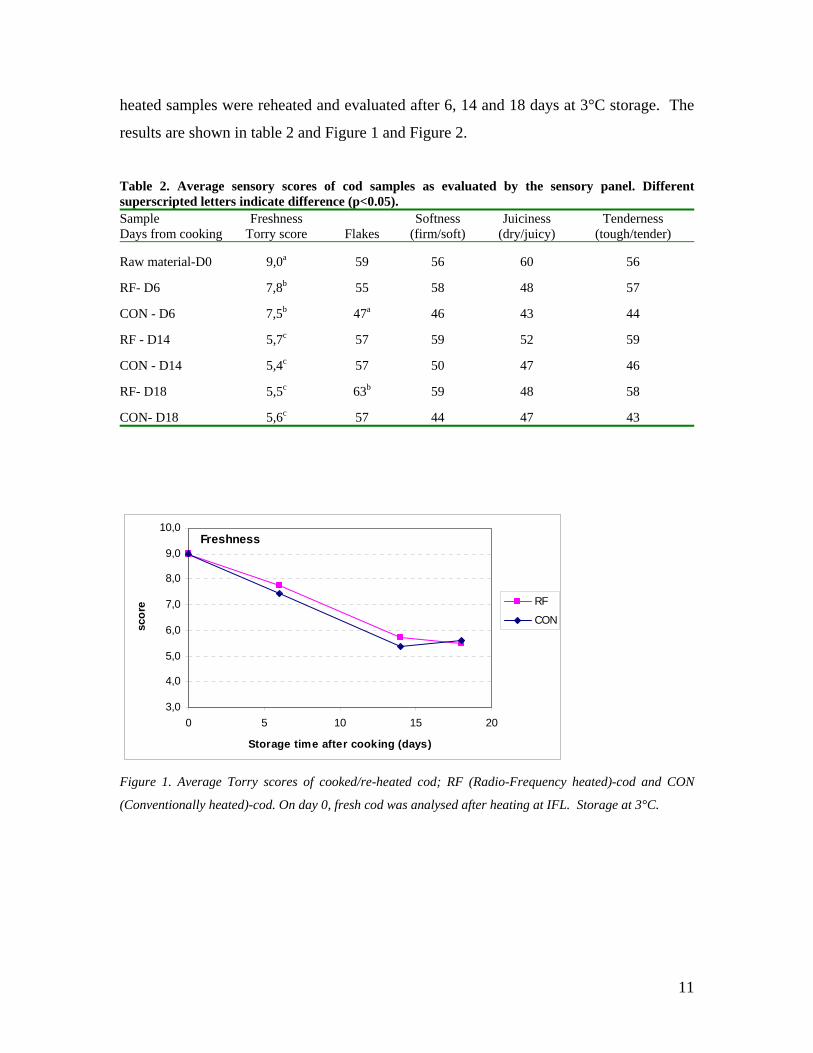
heated samples were reheated and evaluated after 6, 14 and 18 days at 3°C storage. The
results are shown in table 2 and Figure 1 and Figure 2.
Table 2. Average sensory scores of cod samples as evaluated by the sensory panel. Different superscripted letters indicate difference (p<0.05). Sample Days from cooking
Freshness Torry score Flakes
Softness (firm/soft)
Juiciness (dry/juicy)
Tenderness (tough/tender)
Raw material-D0 9,0a 59 56 60 56
RF- D6 7,8b 55 58 48 57
CON - D6 7,5b 47a 46 43 44
RF - D14 5,7c 57 59 52 59
CON - D14 5,4c 57 50 47 46
RF- D18 5,5c 63b 59 48 58
CON- D18 5,6c 57 44 47 43
Freshness
3,0
4,0
5,0
6,0
7,0
8,0
9,0
10,0
0 5 10 15 20
Storage time after cooking (days)
scor
e RF
CON
Figure 1. Average Torry scores of cooked/re-heated cod; RF (Radio-Frequency heated)-cod and CON
(Conventionally heated)-cod. On day 0, fresh cod was analysed after heating at IFL. Storage at 3°C.
11

Flakes
0
20
40
60
80
100
0 5 10 15 20
Storage time (days)
QD
A s
core
RFCON
Softness
0
20
40
60
80
100
0 5 10 15 20
Storage time (days)
QD
A s
core
RFCON
Juiciness
0
20
40
60
80
100
0 5 10 15 20
Storage time (days)
QD
A s
core
RFCON
Tenderness
0
20
40
60
80
100
0 5 10 15 20
Storage time (days)
QD
A s
core
RFCON
Figure 2. Average QDA (texture) scores of cooked/re-heated cod; RF (Radio-Frequency heated)-cod and
CON (Conventionally heated)-cod. On day 0, fresh cod was analysed after heating at IFL. Storage at 3°C.
Freshness decreased significantly with the storage time until storage day 14. Then the
average freshness scores were around 5.5 which is considered as the limits for shelf life
as evaluated with the Torry freshness score sheet by IFL. Samples were evaluated similar
at day 18. At each sampling day RF and CON samples were not different with regard to
freshness. RF samples were slightly softer and more tender than CON, though not
statistically significant. Flakiness, juiciness, softness and tenderness were not affected by
storage time.
The loss of freshness was faster than expected at the beginning of the trial and comments
from the sensory panel indicated that some off flavour affected the freshness analysis.
This off flavour might have been warmed over flavour (WOF), which can occur in re-
heated meat and fish after short chilled storage. The formation of WOF has been studied
for meat and meat products, but very little for fish. WOF is described as spoilage odour
which can remind of cardboard, paint or rancidity (Vega and Brewer 1994; Love 1988).
12

Meat rich in poly unsaturated fat acids (PUFA) is more likely to contain WOF according
to Cross et al (1987) who showed that the speed of WOF formation in the following
products was correlated to their PUFA content: fish > chicken > pork > beef > lamb.
Some research have shown that cooking prevents enzymatic activity resulting in
prolonged shelf life compared to the shelf life of fresh fish (Refsgaard et al 1998;
Refsgaard et al 2000). However, more research indicate enhanced oxidation after cooking
because of ruptured cell membranes, denatured membrane proteins and increased
accessibility for e.g. oxygen, iron and other rancidity catalysts to fat acids (Mielche and
Bertelsen 1994).
Research on heating or cooking of fish has shown different effects on rancidity (Hardy
1980; Undeland et al 1998). Undeland et al (1998) showed that pre-cooking inactivated
enzymes that catalysed rancidity in minced herring. However, the activity of rancidity
blockers was reduced and in general heat stimulating catalysing of rancidity increased.
It could not be overruled that the off flavour might also have been from the packaging
material used for the cod, the plastic bag each loin was packed and cooked in. The off-
flavour could have been due to edge overheating and too much thermal stress on
packaging film. Available information on the film used was described in a previous
report by Sveinsdottir et al (2003a) and the sealing range for the plastic material should
have been in the range of 115-155°C.
Due to this, some analysis of oxidation was added and packing material was changed in
the forthcoming experiments.
Instrumental texture measurements
The measured average values for hardness of cooked cod are shown in Figure 3, the
values for cohesiveness and resilience of the same samples are shown in Figure 4 and
Figure 5 respectively. RF and CON samples were different on the sixth day of storage
and the fourteenth day with regard to hardness, but no differences were found for
cohesiveness. Resilience was higher in CON heated samples compared with RF heated
samples but the difference was only significant at the fourteenth day of storage.
13

0
50
100
150
200
250
0 6 14 18
Storage time (days)
Har
dnes
s (N
ewto
n)
RFCON
Figure 3. Hardness measurement of cooked/re-heated cod; RF (Radio-Frequency heated)-cod and CON
(Conventionally heated)-cod. On day 0, fresh cod was analysed after heating at IFL. Storage at 3°C.
0
5
10
15
20
25
30
35
40
0 6 14 18Storage time (days)
Coh
esiv
enes
s (%
)
RF
CON
Figure 4. Cohesiveness of cooked/re-heated cod; RF (Radio-Frequency heated)-cod and CON
(Conventionally heated)-cod. Calculated values with standard deviation from the time–force curve of TPA
measurement. On day 0, fresh cod was analysed after heating at IFL. Storage at 3°C.
14

0
2
4
6
8
10
12
14
16
0 6 14 18
Storage time (days)
Res
ilenc
e (%
)Rf
CON
Figure 5. Resilience of cooked/re-heated cod; RF (Radio-Frequency heated)-cod and CON
(Conventionally heated)-cod. Calculated resilience (%) values with standard deviation from the time–force
curve of TPA measurement. On day 0, fresh cod was analysed after heating at IFL. Storage at 3°C.
Water content and pH
The water content of fresh heated cod was 76.9 ± 0.6% and pH 6.58 ± 0.01. The water
content of the CON samples was lower (74.2-75.1%) than of RF samples (76.6 – 77.4%)
but effects of storage time were not significant. Effects of heat treatment and time were
similar for pH, it was lower (6.48-6.64) in CON than in RF heated samples (6.64-6.74)
but the variation with time was low (Figure 6).
62
64
66
68
70
72
74
76
78
80
0 5 10 15 20
Storage time (days)
Wat
er (%
)
6,2
6,4
6,6
6,8
7,0
7,2
7,4
7,6
7,8
8,0
pH
CON-WaterRF-WaterCON - pHRF - pH
Figure 6. Water content (%) and of cooked/re-heated cod (n=3); RF (Radio-Frequency heated)-cod and
CON (Conventionally heated)-cod. On day 0, fresh cod was analysed after heating at IFL. Storage at 3°C.
15
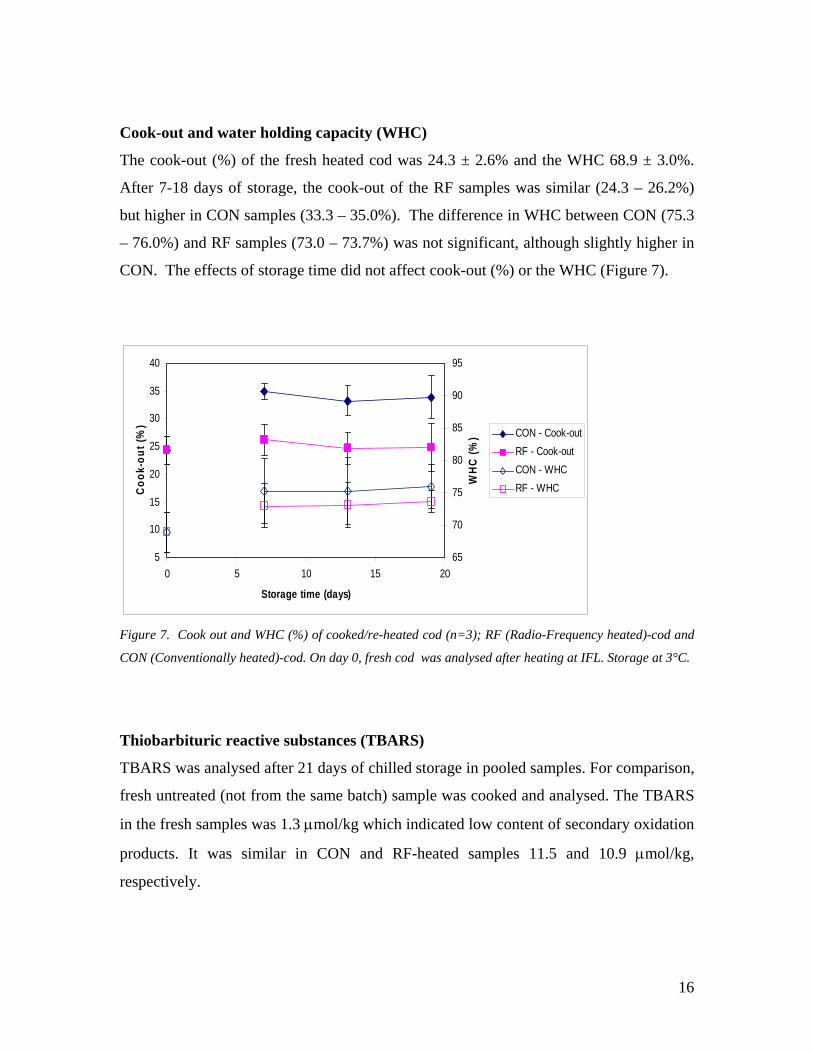
Cook-out and water holding capacity (WHC)
The cook-out (%) of the fresh heated cod was 24.3 ± 2.6% and the WHC 68.9 ± 3.0%.
After 7-18 days of storage, the cook-out of the RF samples was similar (24.3 – 26.2%)
but higher in CON samples (33.3 – 35.0%). The difference in WHC between CON (75.3
– 76.0%) and RF samples (73.0 – 73.7%) was not significant, although slightly higher in
CON. The effects of storage time did not affect cook-out (%) or the WHC (Figure 7).
5
10
15
20
25
30
35
40
0 5 10 15 20
Storage time (days)
Coo
k-ou
t (%
)
65
70
75
80
85
90
95
WH
C (%
) CON - Cook-outRF - Cook-outCON - WHCRF - WHC
Figure 7. Cook out and WHC (%) of cooked/re-heated cod (n=3); RF (Radio-Frequency heated)-cod and
CON (Conventionally heated)-cod. On day 0, fresh cod was analysed after heating at IFL. Storage at 3°C.
Thiobarbituric reactive substances (TBARS)
TBARS was analysed after 21 days of chilled storage in pooled samples. For comparison,
fresh untreated (not from the same batch) sample was cooked and analysed. The TBARS
in the fresh samples was 1.3 μmol/kg which indicated low content of secondary oxidation
products. It was similar in CON and RF-heated samples 11.5 and 10.9 μmol/kg,
respectively.
16

EXPERIMENT 4; SHELF LIFE OF CONVENTIONALLY (CON) AND RADIO-
FREQUENCY (RF) HEATED AT 75°C SALMON STORED AT 3°C
Microbial counts
Total viable counts are shown in table 3. The TVC of the raw material was within the
limits of good quality of raw material defined in the project (Palsson et al 2005). The
TVC of the precooked products was very low, indicating that the heat treatments were
sufficient.
Table 3. Microbial counts (Total plate counts at 22°C) cfu/g.
Days after precooking Sample TVC Raw material 16000 day 7 CON EST<10 day 7 RF EST 10 day 14 CON EST 70 day 14 RF EST<10 day 20 CON 100 day 20 RF EST <10
Sensory evaluation
Samples were evaluated with sensory evaluation after seven, fourteen and twenty days of
storage at 3°C. The results are shown in table 4 and Figure 8. Table 4. Average sensory scores of salmon samples as evaluated by the sensory panel. Different superscripted letters indicate difference (p<0.05). CON; conventionally heated, RF; radio-frequency heated, RM; raw material heated at IFL, D=days in storage at 3°C, o = odour, f = flavour.
Sample char
acte
ristic
(o)
seaw
eed-
sea
(o)
liver
-oil
(o)
earth
y (o
)
sour
(o)
ranc
id (o
)
flake
s
softn
ess
juic
ines
s
tend
erne
ss
char
acte
ristic
(f)
met
al (f
)
oil (
f)
swee
t (f)
earth
y (f
)
sour
(f)
ranc
id (f
)
RM 61 38 26 27 6b 4b 52 61 62 65 62 34 36 26 37 7b 5b
RF D07 53 29 21 29 7b 16b 50 55 53 62 61 31 39 22 27 4b 13b
CON D07 47 21 22 32 6b 13b 44 61 58 65 58 29 36 23 27 3b 12b
RF D14 46 29 31 35 11 10b 46 49 48 60 50 33 37 32 30 14 16b
CON D14 46 26 25 31 4b 9b 53 64 52 67 54 27 37 15 38 5b 17b
RF D20 48 27 23 35 19a 33a 57 54 51 57 49 36 35 25 35 19a 32a
19bCON D20 51 20 29 36 10 11b 52 63 56 62 50 17 43 17 43 12
17

o do ur C ON salmo n
0
20
40
60
80
100
0 5 10 15 20 25storage time (days)
QD
A sc
ore
characterist ic (o)seaweed-sea (o)liver-oil (o)earthy (o)sour (o)rancid (o)
texture C ON salmo n
0
20
40
60
80
100
0 5 10 15 20 25storage time (days)
QD
A sc
ore
Flakessoftnessjuicinesstenderness
texture R F salmo n
0
20
40
60
80
100
0 5 10 15 20 25storage time (days)
QD
A sc
ore
Flakessoftnessjuicinesstenderness
f lavo ur C ON salmo n
0
20
40
60
80
100
0 5 10 15 20 25storage time (days)
QD
A sc
ore
characterist ic (f)metal (f )oil (f )sweet (f )earthy (f)sour (f )rancid (f)
f lavo ur R F salmo n
0
20
40
60
80
100
0 5 10 15 20 25storage time (days)
QD
A sc
ore
characterist ic (f )metal (f )oil (f )sweet (f )earthy (f)sour (f )rancid (f)
o do ur R F salmo n
0
20
40
60
80
100
0 5 10 15 20 25storage time (days)
QD
A sc
ore
characterist ic (o)seaweed-sea (o)liver-oil (o)earthy (o)sour (o)rancid (o)
Figure 8. Average QDA (texture) scores of cooked/re-heated salmon; RF (Radio-Frequency heated)-
salmon and CON (Conventionally heated)-salmon. On day 0, fresh salmon was analysed after heating at
IFL. Storage at 3°C
There was no significant difference between RF and CON samples first fourteen days of
storage. Higher scores were observed for rancid odour and flavour in reheated samples
compared to the raw material cooked at IFL, similar as in previous experiments 2003
(Thorkelsdottir et al, 2004). After twenty days of storage RF heated samples had
significantly higher intensity of sour and rancid odour and flavour compared to samples
at other sampling days including CON heated samples at day 20. Texture did not change
significantly during the storage.
18

Instrumental texture measurement
Measured average values for hardness, cohesiveness and resilience are shown in Figure 9,
10 and 11 respectively. All these parameters were higher in the reheated salmon samples
than measured in the raw material, samples cooked at IFL. On the seventh day of storage
hardness and resilience were higher in RF heated samples than CON heated samples. At
the end of the shelf life there was samples were not significantly different in the
measured texture parameters.
0
50
100
150
200
250
1 7 20Storage time (days)
Har
dnes
s (N
ewto
n)
RFCON
Figure 9. Hardness measurement of cooked/re-heated salmon; RF (Radio-Frequency heated)-salmon and
CON (Conventionally heated)-salmon. On day 1 fresh cod was analysed after heating at IFL. Storage at
3°C.
19

0
5
10
15
20
25
30
1 7 20
Storage time (days)
Coh
esiv
enes
s (%
)RF
CON
Figure 10. Cohesiveness of cooked/re-heated salmon; RF (Radio-Frequency heated)-salmon and CON
(Conventionally heated)-salmon. On day 1, fresh cod was analysed after heating at IFL. Storage at 3°C.
0
2
4
6
8
10
12
14
1 7 20
Storage time (days)
Res
ilien
ce (%
)
RFCON
Figure 11. Resilience of cooked/re-heated salmon; RF (Radio-Frequency heated)-salmon and CON
(Conventionally heated)-salmon. On day 1, fresh cod was analysed after heating at IFL. Storage at 3°C.
Water content, fat content and pH
The water content of CON and RF-heated salmon samples (63.6 and 65.5%) on day 7
was higher than in fresh heated samples (60.6%). The water content was higher in the
20

RF-heated samples than in CON-heated samples during the whole period. Effects of time
during chilled storage of heated samples were only significant between day 7 and 20.
Changes in fat content were in converse to water content as expected and it was higher in
CON than RF-heated samples. Values obtained were lower than in the fresh heated
samples but remained similar during storage from 7 to 20 days (Figure 12).
The pH in fresh heated samples was 6.30 ± 0.02. It was higher in RF-heated samples
than in CON-heated samples, but the difference was only about 0.1. The variation with
time was not significant (Table 5).
60
62
64
66
68
70
72
74
76
78
0 5 10 15 20
Storage time (days)
Wat
er (%
)
0
2
4
6
8
10
12
14
16
18
Fat (
%)
CON-WaterRF-WaterCON-FatRF-Fat
Figure 12. Water and fat content (%) of cooked/re-heated salmon (n=3); RF (Radio-Frequency heated)-
salmon and CON (Conventionally heated)-salmon. On day 0, fresh cod was analysed after heating at IFL.
Storage at 3°C.
Table 5. pH of precooked samples (n=3) which were reheated after 7-20 days at 3°C (RF =Radio-Frequency heated and CON = Conventionally heated). On day 0, fresh salmon was analysed after heating at IFL Storage (days) 7 13 20 CON 6,32 ± 0.01 6,28 ± 0.04 6,27± 0.01 RF 6,38 ± 0.05 6,33 ± 0.02 6,40 ± 0.06
21

Cook-out and water holding capacity (WHC)
Cook-out (%) was lower in the fresh salmon (9.7 ± 1.2%) than in CON (17.1-17.6%) and
RF-heated samples after 7 to 20 days of chilled storage (12.4-17.8%). It was similar in
CON-heated samples during the whole storage period but decreased slightly in RF-heated
samples (Figure 13). On the latest sampling day, the difference between RF and CON
heated samples was significant.
WHC (%) was higher in the RF-heated (64.6-68.5%) samples than in CON (58.3-62.7%)
samples. Higher cooking loss in the RF and CON samples may partly explain higher
WHC than in the fresh heated salmon (50.6 ± 7.4%) since more of the loosely bound
water was lost during cooking and therefore the remaining water was likely to be more
firmly bound in the muscle.
5
10
15
20
25
30
35
0 5 10 15 20
Storage time (days)
Coo
k-ou
t (%
)
40
45
50
55
60
65
70
75
WHC
(%) CON - Cook-out
RF - Cook-outCON - WHCRF - WHC
Figure 13. Cook out and WHC of cooked/re-heated salmon (n=3); RF (Radio-Frequency heated)-salmon
and CON (Conventionally heated)-salmon. On day 0, fresh cod was analysed after heating at IFL. Storage
at 3°C.
Peroxide value (PV) and thiobarbituric reactive substances (TBARS)
The PV in fresh heated salmon was 8.8 meq/kg but slightly higher in CON and RF
samples on day 7, of 9.5 meq/kg and 9.4 meq/kg respectively. From day 7 to 14 it
increased in RF-samples but decreased rapidly from day 14 to 20 in both CON and RF-
22

heated samples, to 2.9 and 5 meq/kg respectively (Figure 14). The values for the fresh
salmon indicated that oxidation had started in the raw material. As an example for fresh
salmon it can be mentioned that Fagan et al (1998) found that PV in fresh salmon was 1.6
meq/kg.
The TBARS in fresh salmon after cooking was 42.6 μmol/kg. After 7 days of chilled
storage, the TBARS of the CON-heated samples (37.0 μmol/kg) was higher than of RF-
heated salmon (27.7 μmol/kg). TBARS decreased continuously in CON during storage
and the final value after 20 days was 30.1 μmol/kg. The TBARS in RF heated samples
decreased only slightly from day 7 to day 13 (27.7 and 26.1 μmol/kg respectively). After
that TBARS increased to a final value of 30.3 μmol/kg which was similar to the TBARS
in the CON heated sample on day 20 (Figure 14).
Peroxide values have been used to estimate the initial products of lipid oxidation and
TBARS to evaluate secondary products. It is known that PV may decrease after certain
time and that the secondary products are not end-products of lipid oxidation and may
react further with other components of the fish (Auburg 1993) which may lead to
decreasing TBARS. What makes the interpretation of PV and TBARS difficult, is that
these factors in our trial were analysed in cooked samples and may as such only function
as reference values for later studies since little experience has been gained with cooked
fish.
It is known that the extent of lipid oxidation may increase after cooking. The process
probably disrupts the muscle membrane system, thereby exposing the lipid components
to oxygen and other reaction catalysts such as iron (Hardy 1980, Flick et al. 1992,
Mielche & Bertelsen 1994, Undeland et al. 1998). However, the way of cooking affects
changes in the lipids during cooking and some studies have shown that oxidation
products remained similar or changed only slightly ( Al-saghir et al 2004, Regulska-IIow
and IIow 2002). It has also been hypothesed that high levels of natural antioxidants in
red flesh fishes of the Salmonidae family may prevent degradation of polyunsaturated
fatty acids during heat treatment (Gladyshev et al 2005).
23

25
30
35
40
45
50
55
0 5 10 15 20
Storage time (days)
TBAR
S (u
mol
/kg)
0
2
4
6
8
10
12
Pero
xide
val
ue (m
eq/k
g)
CON - TBARSRF -TBARSCON - PVRF - PV
Figure 14. TBARS and PV of cooked/re-heated salmon (pooled samples (n=3); RF (Radio-Frequency
heated)-salmon and CON (Conventionally heated)-salmon. On day 0, fresh cod was analysed only after
heating at IFL. Storage at 3°C.
24

EXPERIMENT 5; SHELF LIFE OF CONVENTIONALLY (CON) AND RADIO-
FREQUENCY (RF) HEATED AT 95°C COD STORED AT 3°C
Because of failure in packaging of cod samples, which was detected during RF heating
process of the samples, the produced amount of samples was reduced. Because of this it
was not possible to carry out all planned measurements.
Microbial counts
Total viable counts are shown in table 6. The values in raw material were within the
limits of good quality, defined in the project. At the 21st storage day, TVC was 550 in RF
heated samples. In other heated samples TVC was estimated 30 or lower.
Table 6. Microbial counts (Total plate counts at 22°C) cfu/g.
Days after precooking Cod sample TVC Raw material 11000 day 7 CON est 20 day 7 RF est<10 day 21 CON est 30 day 21 RF 550
Sensory evaluation of re-heated and cooked fillets
Fresh cod (raw material) was cooked at IFL and evaluated as storage day 0 in the shelf
life study. RF and CON heated samples were reheated and evaluated after 7 and 21 days
after storage at 3°C. The results are shown in table 7 and Figure 15 and Figure 16.
Table 7. Average sensory scores of cod samples as evaluated by the sensory panel. Different superscripted letters indicate difference (p<0.05). RM (fresh sample cooked at IFL), RF (Radio-Frequency heated, CON (Conventionally heated).
Sample Freshness Torry score
Flakes
Softness (firm/ soft)
Juiciness (dry/ juicy)
Tenderness (tough/ tender)
RM95 8,6a 58a 56ac 51ac 53b
CON 95 d7 6,9b 31b 67ab 44 51b
RF 95 d7 7,2b 55a 74b 49c 70a
CON 95 D21 5,4c 45 46c 34b 37b
RF 95 D21 5,7c 47 50c 41 47b
25
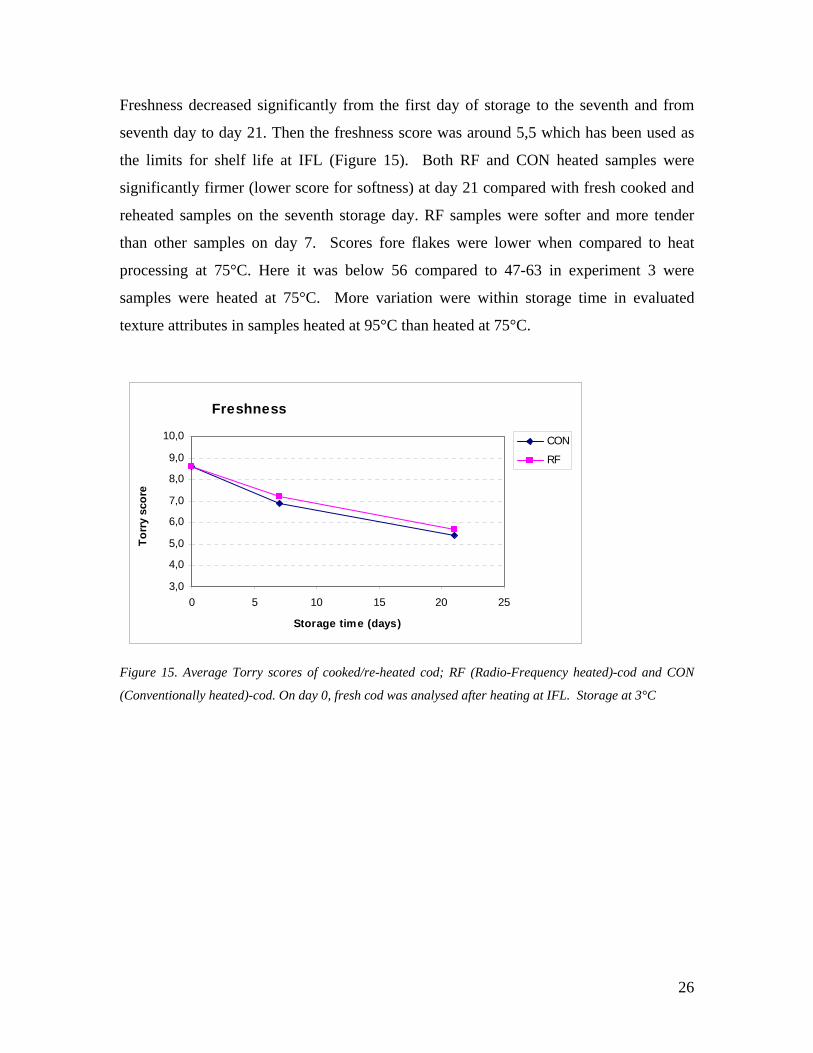
Freshness decreased significantly from the first day of storage to the seventh and from
seventh day to day 21. Then the freshness score was around 5,5 which has been used as
the limits for shelf life at IFL (Figure 15). Both RF and CON heated samples were
significantly firmer (lower score for softness) at day 21 compared with fresh cooked and
reheated samples on the seventh storage day. RF samples were softer and more tender
than other samples on day 7. Scores fore flakes were lower when compared to heat
processing at 75°C. Here it was below 56 compared to 47-63 in experiment 3 were
samples were heated at 75°C. More variation were within storage time in evaluated
texture attributes in samples heated at 95°C than heated at 75°C.
Freshness
3,0
4,0
5,0
6,0
7,0
8,0
9,0
10,0
0 5 10 15 20 25
Storage time (days)
Torr
y sc
ore
CON
RF
Figure 15. Average Torry scores of cooked/re-heated cod; RF (Radio-Frequency heated)-cod and CON
(Conventionally heated)-cod. On day 0, fresh cod was analysed after heating at IFL. Storage at 3°C
26

Flakes
0,0
20,0
40,0
60,0
80,0
100,0
0 5 10 15 20 25Storage time (days)
QD
A s
core
CON
RF
Softness
0,0
20,0
40,0
60,0
80,0
100,0
0 5 10 15 20 25
Storage time (days)
QD
A s
core
CON
RF
Juiciness
0,0
20,0
40,0
60,0
80,0
100,0
0 5 10 15 20 25
Storage time (days)
QD
A s
core
CON
RF
Tenderness
0,0
20,0
40,0
60,0
80,0
100,0
0 5 10 15 20 25Storage time (days)
QD
A s
core
CON
RF
Figure 16. Average QDA (texture) scores of cooked/re-heated cod; RF (Radio-Frequency heated)-cod and
CON (Conventionally heated)-cod. On day 0, fresh cod was analysed after heating at IFL Storage at 3°C.
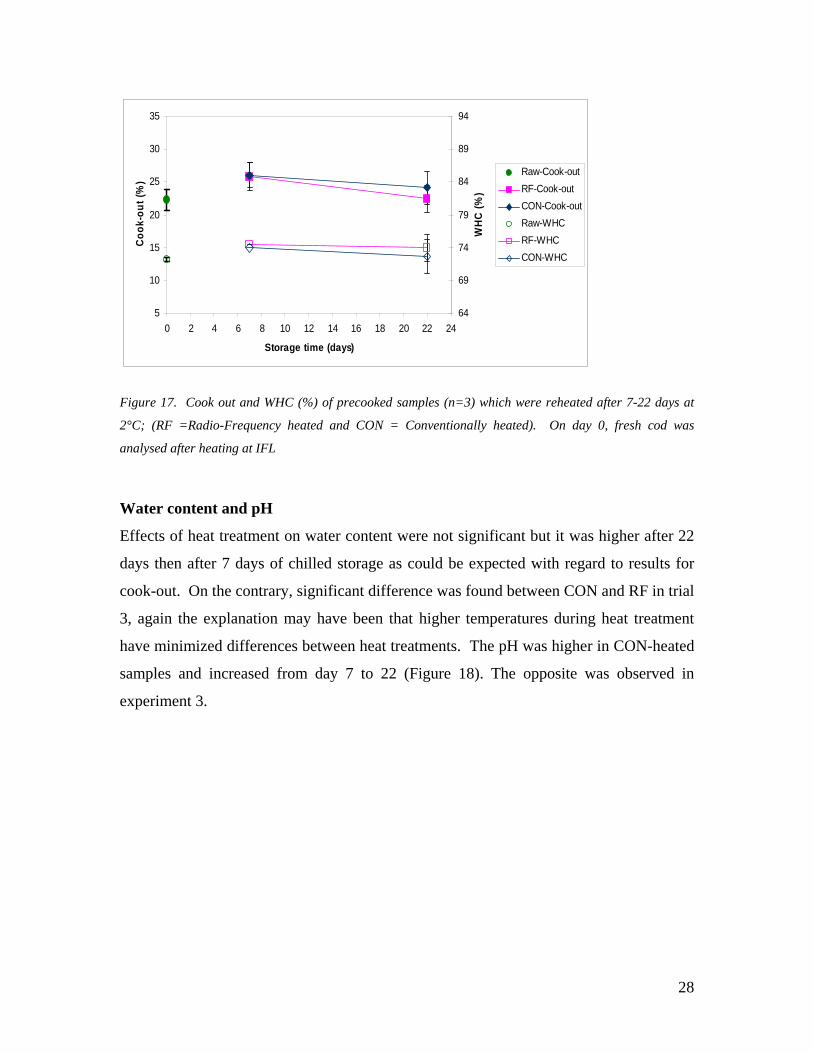
Cook-out and water holding capacity (WHC)
Cook-out in cod samples was not significantly affected by type of heat treatment but
lower after 22 days of storage compared to 7 days. However, in previous trial
(experiment 3) with storage of chilled samples it was observed that cook-out was higher
in CON than RF-heated samples. Higher temperature during heat treatment in both
categories may have resulted in less difference but the condition of the raw material may
also be a factor worth considering. WHC was neither affected by heat treatment or time
which confirmed results in experiment 3 (Figure 17).
27
5
10
15
20
25
30
35
0 2 4 6 8 10 12 14 16 18 20 22 24
Storage time (days)
Cook
-out
(%)
64
69
74
79
84
89
94
WHC
(%)
Raw-Cook-outRF-Cook-outCON-Cook-outRaw-WHCRF-WHCCON-WHC
Figure 17. Cook out and WHC (%) of precooked samples (n=3) which were reheated after 7-22 days at
2°C; (RF =Radio-Frequency heated and CON = Conventionally heated). On day 0, fresh cod was
analysed after heating at IFL
Water content and pH
Effects of heat treatment on water content were not significant but it was higher after 22
days then after 7 days of chilled storage as could be expected with regard to results for
cook-out. On the contrary, significant difference was found between CON and RF in trial
3, again the explanation may have been that higher temperatures during heat treatment
have minimized differences between heat treatments. The pH was higher in CON-heated
samples and increased from day 7 to 22 (Figure 18). The opposite was observed in
experiment 3.
28

64
66
68
70
72
74
76
78
80
82
0 2 4 6 8 10 12 14 16 18 20 22 24
Storage time (days)
Wat
er (%
)
6,2
6,4
6,6
6,8
7,0
7,2
7,4
7,6
7,8
8,0
pH
Raw-WaterRF-WaterCON-WaterRaw-pHRF-pHCON-pH
Figure 18. Water and pH of precooked samples (n=3) which were reheated after 7-22 days at 2°C; (RF
=Radio-Frequency heated and CON = Conventionally heated). On day 0, fresh cod was analysed after
heating at IFL
Formaldehyde (FA) and thiobarbituric reactive substances (TBARS)
The formaldehyde content was 208.7 ± 115 μg/g in fresh single cooked samples on day 0
but 15.3 and 13.2 μg/g on day 7 in RF and CON reheated samples respectively. The
value obtained for the fresh fish was low but the variation between individuals was high.
The limit value of formaldehyde for human consumption has been reported to be 75
mg/kg in raw fish. Values of less than 10 mg/kg indicate that frozen products are of good
quality (Rehbein 1987).
The TBARS was 1.1 ± 0.3 μmol/kg in fresh cod but increased with storage time in both
RF and CON heated samples. After 7 days of chilled storage the values were 3.8 and 3.6
μmol/kg but 5.1 and 8.1 μmol/kg after 22 days for RF and CON heated samples,
respectively (Figure 19). The results were different from the ones obtained in trial 3,
where the TBARS of both groups was higher (10.9 and 11.5 μmol/kg) and more similar
than in this trial. Values observed in our trial remained well below the limit for TBARS
in raw cod of 19 μmol/kg (Connell, 1975).
29

0
1
2
3
4
56
7
8
9
10
0 2 4 6 8 10 12 14 16 18 20 22 24
Storage time (days)
TBA
RS
(um
ol/k
g)
Raw -TBARS
RF-TBARS
CON-TBARS
Figure 19. TBARS of precooked samples (pooled samples (n=3)) which were reheated after 7-22 days at
2°C; (RF =Radio-Frequency heated and CON = Conventionally heated). On day 0, fresh cod was
analysed after heating at IFL.
30
EXPERIMENT 6; SHELF LIFE OF CONVENTIONALLY (CON) AND RADIO-
FREQUENCY (RF) HEATED AT 95°C SALMON STORED AT 3°C
Microbial counts
Total viable counts are shown in table 8. The TVC of the raw material was much higher
than of the raw material used in experiment 4. However the number was within the limits
defined for good quality in this project (Palsson et al 2005). The TVC measured in the
pre-heated products was very low, indicating that the heat treatments were sufficient.
Table 8. Microbial counts (Total plate counts at 22°C) cfu/g.
Days after precooking Sample TVC Raw material 100000 day 6 RF est<10 day 6 CON est<10 day 20 RF est<10 day 20 CON est<10 day 28 RF est<10 day 28 CON est.10
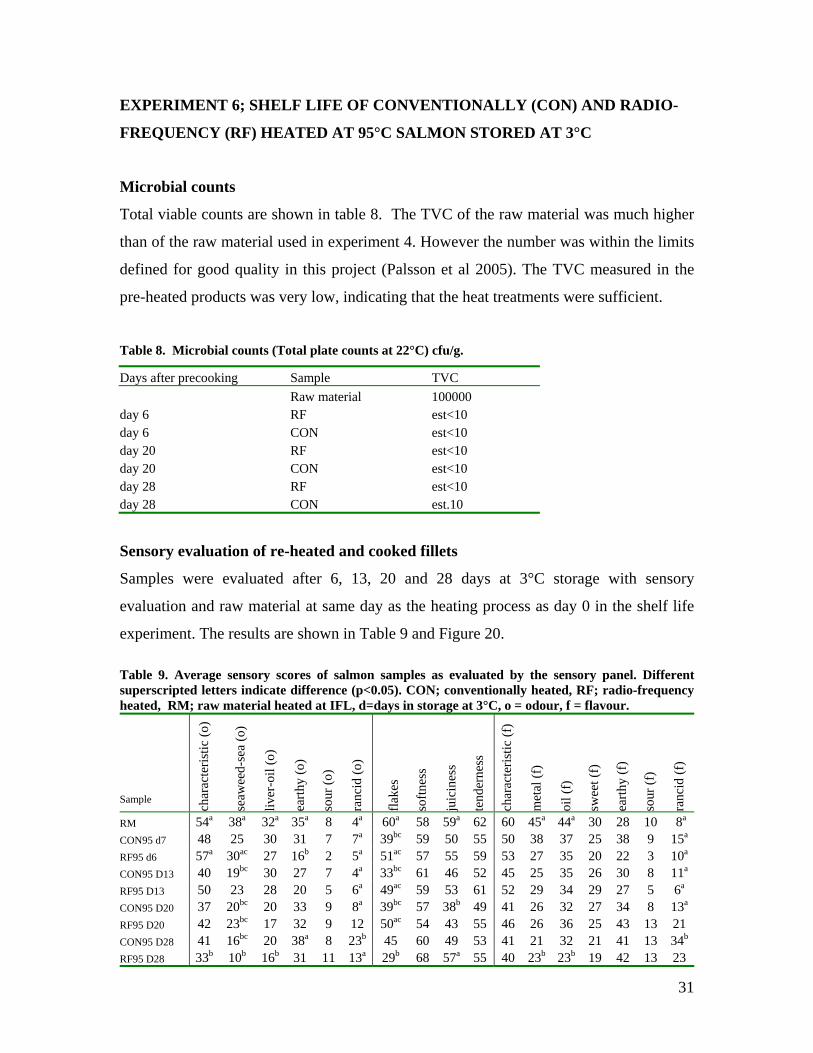
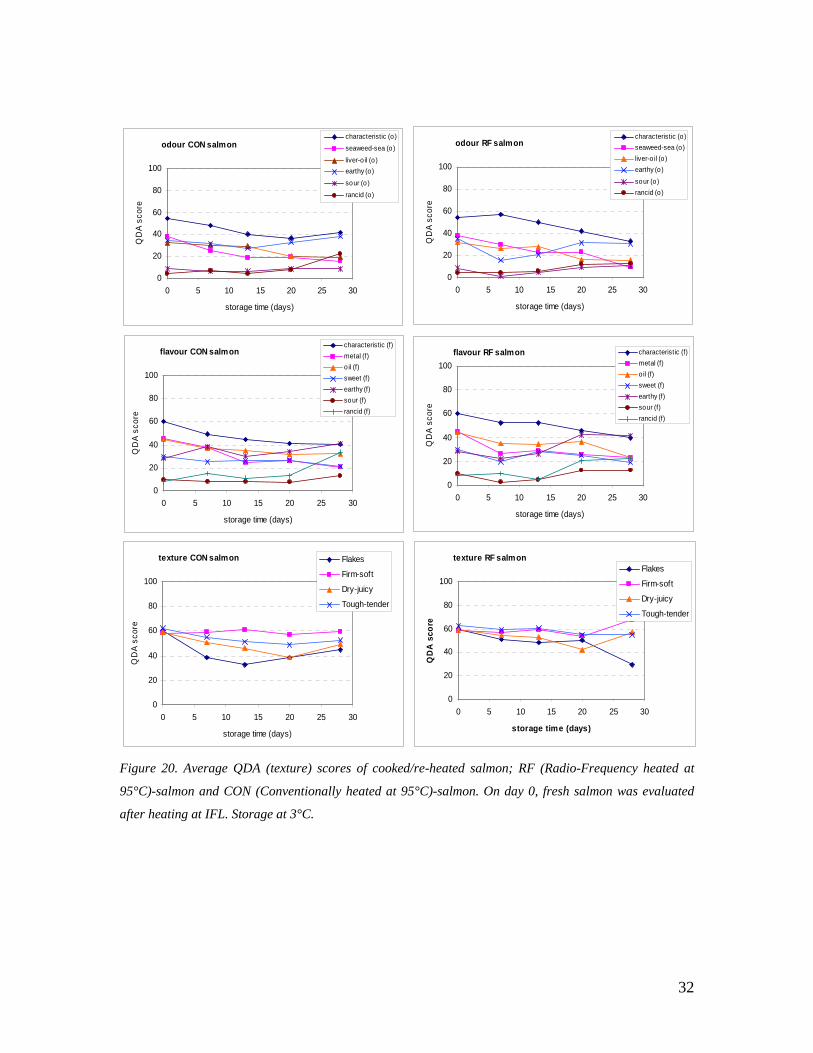
Sensory evaluation of re-heated and cooked fillets
Samples were evaluated after 6, 13, 20 and 28 days at 3°C storage with sensory
evaluation and raw material at same day as the heating process as day 0 in the shelf life
experiment. The results are shown in Table 9 and Figure 20. Table 9. Average sensory scores of salmon samples as evaluated by the sensory panel. Different superscripted letters indicate difference (p<0.05). CON; conventionally heated, RF; radio-frequency heated, RM; raw material heated at IFL, d=days in storage at 3°C, o = odour, f = flavour.
Sample char
acte
ristic
(o)
seaw
eed-
sea
(o)
liver
-oil
(o)
earth
y (o
)
sour
(o)
ranc
id (o
)
flake
s
softn
ess
juic
ines
s
tend
erne
ss
char
acte
ristic
(f)
met
al (f
)
oil (
f)
swee
t (f)
earth
y (f
)
sour
(f)
ranc
id (f
)
RM 54a 38a 32a 35a 8 4a 60a 58 59a 62 60 45a 44a 30 28 10 8a
CON95 d7 48 25 30 31 7 7a 39bc 59 50 55 50 38 37 25 38 9 15a
RF95 d6 57a 30ac 27 16b 2 5a 51ac 57 55 59 53 27 35 20 22 3 10a
CON95 D13 40 19bc 30 27 7 4a 33bc 61 46 52 45 25 35 26 30 8 11a
RF95 D13 50 23 28 20 5 6a 49ac 59 53 61 52 29 34 29 27 5 6a
CON95 D20 37 20bc 20 33 9 8a 39bc 57 38b 49 41 26 32 27 34 8 13a
RF95 D20 42 23bc 17 32 9 12 50ac 54 43 55 46 26 36 25 43 13 21 CON95 D28 41 16bc 20 38a 8 23b 45 60 49 53 41 21 32 21 41 13 34b
RF95 D28 33b 10b 16b 31 11 13a 29b 68 57a 55 40 23b 23b 19 42 13 23
31
odour CON salmon
0
20
40
60
80
100
0 5 10 15 20 25 30
storage time (days)
QD
A sc
ore
characteristic (o)seaweed-sea (o)
liver-o il (o)earthy (o)
sour (o)rancid (o)
odour RF salmon
0
20
40
60
80
100
0 5 10 15 20 25 30
storage time (days)
QD
A sc
ore
characteristic (o)seaweed-sea (o)liver-o il (o)earthy (o)sour (o)rancid (o)
flavour CON salmon
0
20
40
60
80
100
0 5 10 15 20 25 30
storage time (days)
QD
A sc
ore
characteristic (f)metal (f)o il (f)sweet (f)earthy (f)sour (f)rancid (f)
flavour RF salmon
0
20
40
60
80
100
0 5 10 15 20 25 30
storage time (days)
QD
A sc
ore
characteristic (f)metal (f)o il (f)sweet (f)earthy (f)sour (f)rancid (f)
texture CON salmon
0
20
40
60
80
100
0 5 10 15 20 25 30
storage time (days)
QD
A sc
ore
Flakes
Firm-soft
Dry-juicy
Tough-tender
texture RF salmon
0
20
40
60
80
100
0 5 10 15 20 25 30
storage time (days)
QD
A s
core
Flakes
Firm-soft
Dry-juicy
Tough-tender
Figure 20. Average QDA (texture) scores of cooked/re-heated salmon; RF (Radio-Frequency heated at
95°C)-salmon and CON (Conventionally heated at 95°C)-salmon. On day 0, fresh salmon was evaluated
after heating at IFL. Storage at 3°C.
32

Minor changes in sensory quality were observed during the first two weeks of chilled
storage. Seaweed-sea odour had reduced significantly in CON heated samples after
thirteen days. After twenty days seaweed-sea odour had reduced in both groups and
rancid flavour increased in the RF samples. At storage day 28, CON samples were more
rancid compared to RF samples. Texture did not change much during the storage time
however it was significantly different in flakes with highest score in raw material and
lowest in RF sample at day 28 (Table 9).
Compared to the shelf life experiment after 75°C intensity of rancid flavour was higher in
samples heated at 75°C than samples heated at 95°C on day 20. On day 28 both sample
groups had intensity score of rancid flavour higher than 20. Therefore it could not be
stated that higher temperature in precooking prolongs the shelf life.
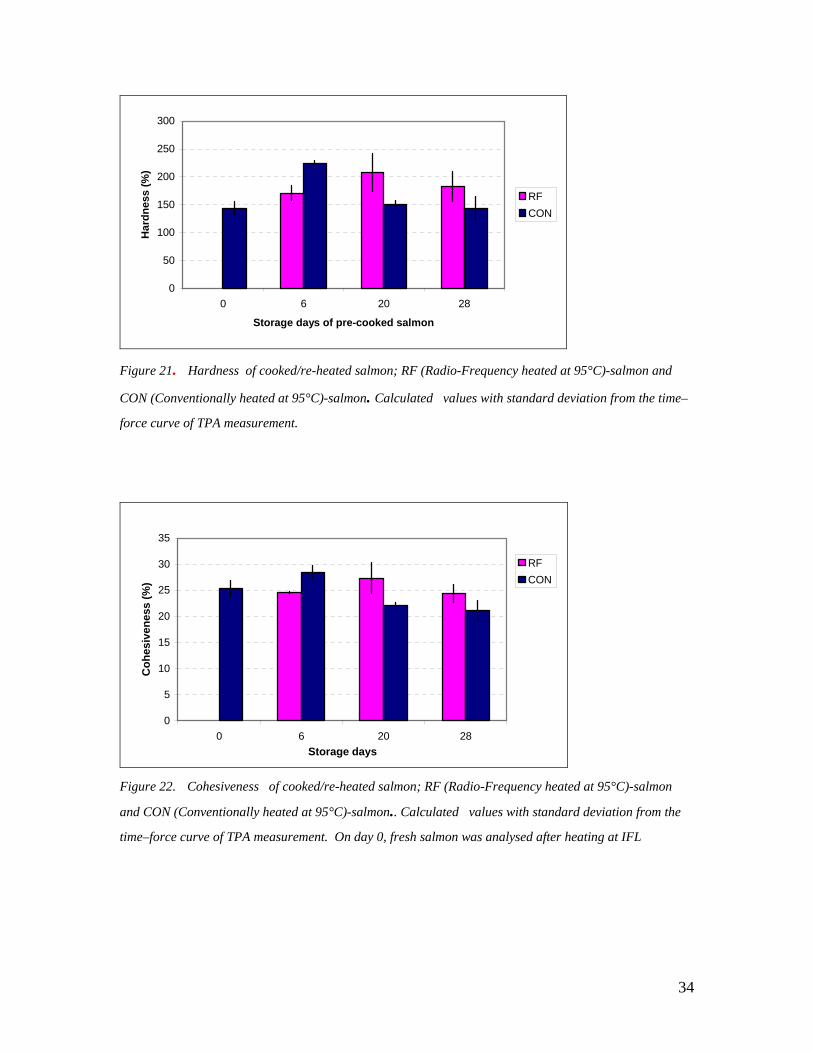
Instrumental texture measurements
Measured average values for hardness, cohesiveness and resilience are shown in Figure
21, 22 and 23 respectively. The RF heated samples had significantly more hardness than
the CON heated samples at the sampling points of 20 and 28 days. This was not seen in
the hardness values at day 20 when salmon was cooked at 75°C, but there the hardness
for RF and CON is almost the same. This could possibly indicate that the 95°C RF
heated samples become firmer with storage than the 75°C heated samples. The
cohesiveness was significantly higher for the RF heated samples than the CON heated
samples at the sampling point of 20 days. At the sixth day of storage the CON heated
samples were significantly more resilient than the RF heated samples. However in
sampling day 28 are the RF heated samples significantly more resilient than the CON
heated samples. As mentioned before there was a lot of difficulty problems with the
cooked salmon samples. It was difficult to cut them into sample sizes for the instrument
and when compressed the samples tended to slide apart. The sampling preparation and
measuring process was still more difficult for the 95 °C cooked salmon than the salmon
that was cooked at 75 C. The fish structure keeps better when heated at lower
temperature.
33
0
50
100
150
200
250
300
0 6 20 28
Storage days of pre-cooked salmon
Har
dnes
s (%
)
RFCON
Figure 21. Hardness of cooked/re-heated salmon; RF (Radio-Frequency heated at 95°C)-salmon and
CON (Conventionally heated at 95°C)-salmon. Calculated values with standard deviation from the time–
force curve of TPA measurement.
0
5
10
15
20
25
30
35
0 6 20 28Storage days
Coh
esiv
enes
s (%
)
RFCON
Figure 22. Cohesiveness of cooked/re-heated salmon; RF (Radio-Frequency heated at 95°C)-salmon
and CON (Conventionally heated at 95°C)-salmon.. Calculated values with standard deviation from the
time–force curve of TPA measurement. On day 0, fresh salmon was analysed after heating at IFL
34

0
2
4
6
8
10
12
14
16
0 6 20 28Storage days
Res
ilien
ce (%
)RFCON
Figure 23. Resilience of cooked/re-heated salmon; RF (Radio-Frequency heated at 95°C)-salmon and
CON (Conventionally heated at 95°C)-salmon. Calculated resilience (%) values with standard deviation
from the time–force curve of TPA measurement. On day 0, fresh salmon was analysed after heating at IFL
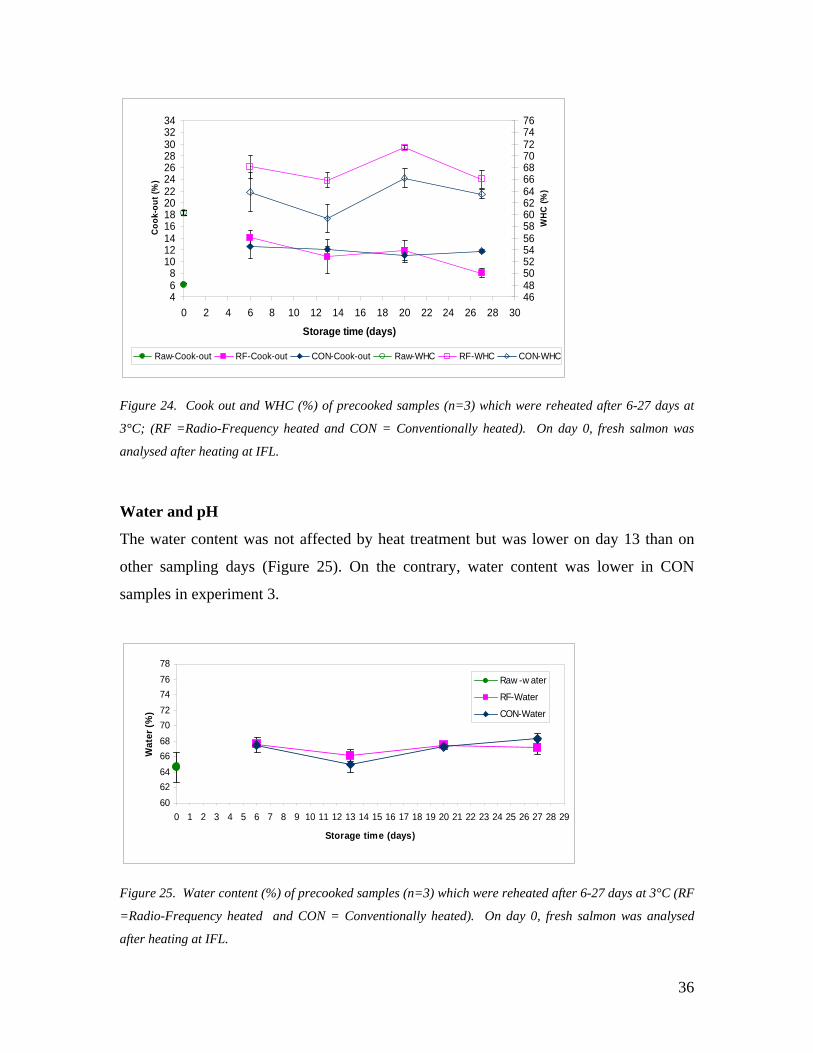
Cook-out and water holding capacity (WHC)
Cook-out (%) was lower in the fresh salmon (6.1 ± 0.2%) than in CON (11.1-12.5%) and
RF-heated samples (8.0-14.0%). It tended to decrease with storage time, more in RF-
heated samples than in CON-heated samples (Figure 24). On the latest sampling day, the
difference between RF and CON heated samples was significant.
WHC (%) was lower in the CON (59.3-66.1%) than in RF-heated (65.8-71.4%) samples.
It tended to decrease with time except that samples on day 20 had higher WHC than on
other sampling days.
35
468
10121416182022242628303234
0 2 4 6 8 10 12 14 16 18 20 22 24 26 28 30
Storage time (days)
Coo
k-ou
t (%
)
46485052545658606264666870727476
WH
C (%
)
Raw-Cook-out RF-Cook-out CON-Cook-out Raw-WHC RF-WHC CON-WHC
Figure 24. Cook out and WHC (%) of precooked samples (n=3) which were reheated after 6-27 days at
3°C; (RF =Radio-Frequency heated and CON = Conventionally heated). On day 0, fresh salmon was
analysed after heating at IFL.
Water and pH
The water content was not affected by heat treatment but was lower on day 13 than on
other sampling days (Figure 25). On the contrary, water content was lower in CON
samples in experiment 3.
60626466687072747678
0 1 2 3 4 5 6 7 8 9 10 11 12 13 14 15 16 17 18 19 20 21 22 23 24 25 26 27 28 29
Storage time (days)
Wat
er (%
)
Raw -w ater
RF-Water
CON-Water
Figure 25. Water content (%) of precooked samples (n=3) which were reheated after 6-27 days at 3°C (RF
=Radio-Frequency heated and CON = Conventionally heated). On day 0, fresh salmon was analysed
after heating at IFL.
36

The pH in fresh heated samples was 6.28 ± 0.03. It was not affected by heat treatment or
time, although pH in samples on day 13 was slightly higher than on other sampling days
(Table 1).
Table 10. pH of precooked samples (n=3) which were reheated after 6-27 days at 3°C (RF =Radio-Frequency heated and CON = Conventionally heated). On day0, fresh salmon was analysed after heating at IFL.
6 13 20 27 RF-pH 6.27 ± 0.02 6.33 ± 0.02 6.30 ± 0.03 6.27 ± 0.04 CON-pH 6.30 ± 0.03 6.34 ± 0.03 6.30 ± 0.01 6.30 ± 0.01
Peroxide value (PV) and thiobarbituric reactive substances (TBARS)
The PV in fresh heated salmon was 5.6 meq/kg. It was lower in CON on day 6 and 13,
3.1 meq/kg and 2.5 meq/kg, respectively but increased to 6.6 and 7.0 meq/kg on day 20
and 27 respectively. Peroxide values of RF-heated samples were higher on day 6 (7.4
meq/kg) and 13 (4.4 meq/kg) but slightly lower on day 20 and 27 (5.8 meq/kg for both
days). The PV tended to increased with time for CON-heated samples but the opposite
was observed in experiment 3.
The TBARS of the fresh salmon after cooking was 17.7 μmol/kg which indicated that
oxidation had started and rancidity could be expected. After 6 days of chilled storage, the
TBARS of the CON-heated samples (7.9 μmol/kg) was lower than of RF-heated salmon
(16.4 μmol/kg). It maintained higher in RF heated samples although only slight
differences were observed on the final day, 12.4 vs. 13.3 μmol/kg in RF heated samples.
The highest values were observed after 20 days of storage but after 27 days of storage the
values obtained were similar or slightly lower than on day 13 (Figure 26).
37

7
12
17
22
27
32
37
0 1 2 3 4 5 6 7 8 9 10 11 12 13 14 15 16 17 18 19 20 21 22 23 24 25 26 27 28 29
Storage time (days)
TBA
RS
(um
ol/k
g)
-4
-2
0
2
4
6
8
Per
oxid
e va
lue
(meq
/kg)
Raw-TBARS RF-TBARS CON-TBARS Raw-PV RF-PV CON-PV
Figure 26. TBARS and PV of precooked samples (n=3, pooled on day 6-27) which were reheated after 6-
27 days at 3°C (RF =Radio-Frequency heated and CON = Conventionally heated). On day 0, fresh
salmon was analysed after heating at IFL.
38

Comparison of measurements
Results from all methods were averaged over sample groups and compared in a PCA plot
for cod (Figure 27) and salmon (Figure 28) to compare methods and effects of
temperature during heat treatments.
75°C
95°C RF-cod
CON-cod
Figure 27. Scores and loadings (Bi-plot) of all measured parameters and sample groups, PC1 vs. PC2.;
raw material, RF (Radio-Frequency heated)-cod and CON (Conventionally heated)-cod after chilled
storage at 3°C
The first PC axis in the bi-plot (Figure 27) mostly appears to explain differences between
cod samples due to storage time, freshness (Torry freshness score), to the left and
TBARS to the right. Variation with regard to texture is also included in the difference
between samples along the first PC. Textural parameters account for most of the variation
between the samples along PC2.
Cod heated at 75°C appears to be different from cod heated at 95°C as the samples are
separated in the bi-plot along the PC2 axis. The cod heated at 75°C appeared to be more
juicy, tender and flaky compared to the 95°C heated cod.
39

Figure 27 also shows that there appears to be some differences between the RF and CON
heated samples. Most RF-heated samples, along with the cooked raw material for both 75
and 95°C experiments, are located in the left side of the plot and the CON-heated samples
to the right. According to this it appears that the re-heated RF-heated samples are more
alike cooked raw material used, with more juicy, flaky, tender and soft texture, while the
CON-heated samples have somewhat more WHC and higher values of TBARS.
The measurements gave various information about the samples. As might have been
expected, samples that had more juicy texture were opposite to samples with high cook-
out on the PC1 axis. Samples with high freshness scores were also more juicy, flaky, soft
and tender and opposite to instrumental texture parameters on both axes, which might be
expected, as hardness and resilience might be regarded as the opposite of soft and tender.
75°C
95°C
Figure 28. Scores and loadings (Bi-plot) of all measured parameters and sample groups, PC1 vs. PC2.;
raw material, RF (Radio-Frequency heated)-salmon and CON (Conventionally heated)-salmon after
chilled storage at 3°C
Similar trend was observed for the salmon samples in Figure 28 as for the cod samples in
Figure 27, in that the first PC axis appears to show differences between samples with
regard to freshness, but the second PC axis is more related to texture. Also, the salmon 40

pre-cooked at 75°C is different from the salmon pre-cooked at 95°C. The 75°C salmon is
located in the lower side along with the cooked raw material used for both experiments,
but the 95°C salmon is in the higher side of the plot. The 75°C salmon appeared to be
more flaky and tender, while the 95°C salmon was measured with more resilience and
more hard texture. The 95°C group appeared to be more to the right, with more samples
described with sensory spoilage descriptors such as sour odour and flavour.
41

4. CONCLUSIONS
The quality and shelf life of cod and salmon, pre-heated with two different heating
processes at two different temperature, and stored at 3°C was studied.
In freshness evaluation of reheated cod samples there was no significant different by heat
treatments (RF vs CON) neither at 75°C nor at 95 °C samples. Off flavours was detected
after fourteen days of cod samples pre-heated at 75°C.
After twenty days of storage, intensity of rancid flavour in pre-heated salmon was above
acceptable limit. Therefore shelf life could not be estimated longer than that twenty days
of storage after both 75°C or 95°C pre-heating treatments.
Texture of both cod and salmon samples was not affected by storage time. Higher
temperature (95°C) during pre-heating influenced the texture negatively and it became
more difficult to evaluate and measure the texture. Fish pre-heated at 75°C was more
juicy, tender and flaky and retained its form better compared to fish pre-heated at 95°C.
Sensory evaluation of salmon using the Quantitative Descriptive Analysis gave valuable
information about odour, flavour and texture of the salmon products with storage time
and if there were differences between products. For cod, only the Torry freshness score
sheet was used and some additional descriptors for texture. Even though the Torry
freshness score sheet has been used frequently for fresh and thawed cod, it only gives
information about freshness in general, which it also did here. However, some more
detailed information about odour and flavour would have been useful and could have
given more valuable information about the detected off-odour and flavour of the cod.
Overall, the results indicate that radio-frequency heated cod and salmon are of
comparable shelf life and/or better quality compared to conventionally autoclave heated
cod and salmon both during frozen and chilled storage. However, it must be mentioned
that the shelf life studies with the radio-frequency heated fish were on a product
generated with not fully developed equipment for radio-frequency heated fish. That is to
say, the production process and packaging process had not been fully developed and the
42
quality and shelf life studies can only give quality indications about the final product,
produced during a real product production.
It is clear that shelf life is not only influenced by the production technique used to heat
the product. Other factors are of high importance, such as the raw material used, the fish
species which may react differently to the process, the production process, the packing
material and storage temperature.
43

5. ACKNOWLEDGEMENTS
This work was carried out at the Icelandic Fisheries Laboratories (IFL) as a part of an
ongoing EU project "Radio-Frequency Heating Technology for Minimally Processed
Fish Products" (EU project number: QLK1-CT-2001-01788). The authors would like to
thank the staff of the fish processing company HB-Grandi HF. Special thanks to the
sensory panel at IFL and the staff carrying out chemical and microbiological
measurements. R
44

6. REFERENCES
Al-Saghir, S., Thurner, K., Wagner, K. H., Frisch, G., Luf, W., Razzazi-Fazeli, E., and Elmadfa, I. (2004). Effects of different cooking procedures on lipid quality and cholesterol oxidation of farmed salmon fish (Salmo salar). Journal of Agricultural and Food Chemistry 52, 5290-5296.
AOAC (1990). "Official Method 965.33 (Peroxide Value)," 15th/Ed. Association of
Official Analytical Chemists, Arlington, Virginia. AOCS (1998). American Oil Chemists' Society. In: , D. Firestone, Editor, Official
Methods and Recommended Practices of the American Oil Chemists' Society (5th ed.), American Oil Chemists Society, Champaign, IL, USA.
Auburg SP. (1993). Review: interaction of malondialdehyde with biological molecules-
new trends about reactivity and significance, International Journal of Food Science and Technology 28, pp. 323–335.
Bligh EG, Dyer WJ (1959). A rapid method of total lipid extraction and purification.
Canadian Journal of Biochemistry and Physiology 37, 911-917. Børresen T. (1980). Nyutviklete metoder for bestemmelse av vannbindingsevne,
saltvannbindingsevne og koketap i fiskemuskel. Rapport no 663. 1-7-2. 36 pp. Fiskeriteknologisk Forskningsinstitutt, Trondheim, Norway.
González-Fandos E, Villarino-Rodríguez A, García-Linares MC, García-Arias MT,
García-Fernández MC. (2005). Microbiological safety and sensory characteristics of salmon slices processed by the sous vide method. Food Control, 77-85.
Connell JJ. (1975). Control of fish quality. Farnham, Surrey UK: Fishing News (Books)
Ltd (as cited by Ruiz-Capillas and Moral 2001. Food Research International 34, 441-447)
Cross H R, Leu R, Miller M F. 1987. Scope of warmed-over flavor and its importance to
the meat industry. In Warmed-Over Flavor of Meat, A J St Angelo, M E Bailey, Eds. Academic Press, Inc New York.
Fagan JD, Gormley TR, Mhuircheartaigh MU. (2003). Effect of freeze-chilling, in comparison with fresh, chilling and freezing, on some quality parameters of raw whiting, mackerel and salmon portions Lebensm.-Wiss. u.-Technol. 36, 647–655
Flick GJ, Hong G P, Knobl GM. (1992). Lipid oxidation of seafood during storage. Ed A
J St Angelo. Í Lipid oxidation in food. ACS Symposium Series 500, pp183-207. Gladyshev MI, Sushchik NN, Gubanedko GA, Demirchieva SM, Kalachova GS. (2005).
Food Chemistry. In press.
45
Hanson SWF, Olley J. (1963). Application of the Bligh and Dyer method of lipid
extraction to tissue homogenates. Journal of Biochemistry 89, 101-102. Hardy R. (1980). Fish lipids. Part 2. In: Advances in Fish Science and Technology. J J
Connell (Ed). Fishing News Books Ltd. Farnham, Surrey, England, pp 103-111. ISO (1983). Determination of moisture and other volatile matter content, 6496. The
International Organization for Standardization. Genf, Switzerland: The International Organization for Standardization.
ISO (1988). Sensory analysis - general guidance for the design of test rooms, 8589. Genf,
Switzerland: The International Organization for Standardization. ISO (1993). Sensory analysis - general guidance for the selection, training and
monitoring of assessors. Part 1: Selected assessors, 8586-1. Genf, Switzerland: The International Organization for Standardization.
Love J. (1988). Sensory analysis of warmed-over flavor in meat. Food Technol 42, 140-
143.
Magnússon H, Martinsdóttir E. (1995). Storage Quality of Fresh and Frozen-thawed Fish in Ice. Journal of Food Science, 60 (2), 273-278
Martinsdottir E, Sveinsdottir K, Luten JB, Schelvis-Smit R, Hyldig, G. (2001). Reference
manual for the fish sector: Sensory Evaluation of Fish Freshness. QIM Eurofish. P.O.Box 68, 1970 AB IJmuiden, The Netherlands.
Mielche MM, Bertelsen G. (1994). Approaches to the prevention of warmed-over
flavour. Trends Food Sci Technol 5, 322-927. Palsson PG, Martinsdottir E, Sveinsdottir K, Thorkelsdottir A, Tryggvadottir SV,
Magnusson H, Thorarinsdottir KA, Helgason J, Calmon E. (2005). Contribution to product specification. Project report no 16-05. Icelandic Fisheries Laboratories, Reykjavik, Iceland.
Rebein H. (1987). Determination of formaldehyde content in fishery products. Zeitschrift
für Lebensmittel- Untersuchung und –Forschung, 292-298. Refsgaard HHF, Brockhoff PB, Jensen B. (1998). Sensory and chemical changes in
farmed Atlantic salmon (Salmo salar) during frozen storage. J Agric Food Chem 46, 3473-3479.
Refsgaard HHF, Brockhoff PB, Jensen B. (2000). Free polyunsaturated fatty acids cause
taste deterioration of salmon during frozen storage. J Agric Food Chem 48, 3280-3285.
46

Regulska-Iiow, B., and Iiow, R. (2002). Comparison of the effects of microwave cooking and conventional cooking methods on the composition of fatty acids and fat quality indicators in herring. Nahrung-Food 46, 383-388.
Sørensen G, Jørgensen SS. (1996). A critical examination of some experimental
variables in the –thiobarbituric acid (TBA) test of lipid oxidation in meat products. Zeitschrift für Lebensmittel- Untersuchung und –Forschung, 202, 205-210.
Shewan JM, Macintosh RG, Tucker CG, Ehrenberg ASC. (1953). The development of a
numerical scoring system for the sensory assessment of the spoilage of wet white fish stored in ice. J. Sci. Food and Agric., 4 June 1953, p. 283-298.
Stone H, Sidel JL. (1985). Sensory evaluation practices. Academic Press, Inc. Orlando,
Florida. 311p. Sveinsdottir K, Hjalmarsson GH, Tryggvadottir SV, Martinsdottir E, Þorskelsdottir A,
Palsson PG. (2003a). Comparison of Quality Measurements of Fresh and Thawed Cod Fillets. Project Report 05-03, Icelandic Fisheries Laboratories, Reykjavik, Iceland.
Sveinsdottir K, Hyldig G, Martinsdottir E, Jørgensen B, Kristbergsson K. (2003b).
Quality Index Method (QIM) scheme developed for farmed Atlantic salmon. Food Quality and Preference 14, 237-245
Thorskelsdottir A , Sveinsdottir K, Tryggvadottir SV, Thorarinsdottir KA, Martinsdottir
E, Palsson, PG. (2004). Comparison of four different treatments of cod and salmon fillets: fresh, frozen, radio-frequency heated and conventionally heated. Project Report 02-04, Icelandic Fisheries Laboratories, Reykjavik, Iceland.
Thorkelsdottir A, Sveinsdottir K, Thorarinsdottir KA, Tryggvadottir SV, Martinsdottir E,
Palsson PG (2005). Shelf life of chilled cod and salmon fillets after radio-frequency and convetional heating. Project Report 17-05, Icelandic Fisheries Laboratories, Reykjavik, Iceland.
Undeland I, Ekstrand B, Lingnert H. (1998). Lipid Oxidation in Minced Herring (Clupea
harengus) during Frozen Storage. Effect of Washing and Precooking. J Agric Food Chem 46, 2319-2328.
Vega JD, Brewer MS (1994). Detectable odor threesholds of selected lipid oxidation
compounds at various temperatures in a gelatin model system. J. Food Lipids. 1(3):229-245.
Vyncke W. (1970). Direct determination of the hiobarbituric acid value in trichloroacetic
acid extrracts of fish as a measure of oxidative rancidity. Fette, Seifen, Anstrichmittel, 77, 239–240.
47

Vyncke W. (1975). Evaluation of the direct thiobarbituric acid extraction method for
determining oxidative rancidity in mackerel (Scomber scombrus L.). Fette, Seifen, Anstrichmittel, 77, 239–240.
Z. Anal. Chem. (1937). Zeitschrift fur Analytische Chemie 110, 22.
48

APPENDIX A: SHELF LIFE STUDY ON CHILLED COD IN GREEN ONION
SAUCE
Introduction
In October/November 2004, pre-cooked cod (conventionally and radio-frequency heated)
was evaluated by the Icelandic Fisheries Laboratories (IFL) sensory panel. The results
showed that the cod had reached the limits for acceptability (end of shelf life) after 13
days of chilled storage at 3°C.
This was very different from the given shelf life of pre-cooked cod products produced
and sold by Fjordkökken. According to the sensory panel at Fjordkökken, chilled pre-
cooked cod products had a shelf life of at least 28 days.
The explanation for those different results may be due to that at Fjordkökken, the whole
product was evaluated, but the sensory panel at IFL evaluated the pre-cooked cod
samples without any additives or trimmings. In addition, the raw material may have been
different.
Because of those different results regarding the determination of maximum shelf life, it
was decided to carry out and additional experiment in the RF-project. The aim was to
make the two panels evaluate the same product (cod in green onion sauce), produced at
Fjordkökken and compare the evaluation of freshness quality.
Materials and Methods
Cod in green onion sauce
Cod (deskinned, pieces of fillets without bones) in green onion sauce, produced at
Fjordkökken. The ingredients in the sauce were green onion, milk, water, salt and flour.
Cod fillets were thawed in a chilled chamber for 2 days. Around 140 g of thawed cod
pieces were packed together with green onion sauce (135g) and heated in plastic bags in
boiling water for 5 min at 95°C. Each pack weighed around 275g.
After production, samples for evaluation by the sensory panel at Fjordkökken were stored
at 3-4°C at Fjordkökken, and samples for evaluation by the sensory panel at IFL were
transported (packed in polystyrene boxes with ice mats) by flight to IFL and stored at 3-
4°C.
49

Samples were evaluated 4 times during 4 weeks (8, 12, 19 and 26 days after heat
treatment at Fjordkökken).
Sensory evaluation
The product was evaluated on same days by the two panels.
The method used by the IFL panel was a 5 point grading scale from 5 (very good) to 1
(unacceptable) for freshness and intensity scale for spoilage odour and flavour from 0
(none) to 4 (very much spoilage odour/flavour) (Table 1 and 2 show the scales used by
the IFL sensory panel). Nine to ten panellists participated in the sensory evaluated each
time and samples were evaluated in duplicates (coded with random digit numbers that did
not indicate the storage time or any information about the product). The panel was not
trained specifically for the evaluation of this product, but were all very experienced in
sensory evaluation of cod, and were familiar and trained in using the scales used in the
test.
The method used by the Fjordkökken panel (2 expert panellists) was also a 5 point
grading scale from 5 (right quality), 4 (satisfied quality), 3 (should be changed to better),
2 and 1 (poor quality).
The parameters evaluated at Fjordkökken were as follows:
• Appearance; light, thick with a green appearance from the onion, no skin and
bone and should be 1 whole piece of fish, will accept 2 pieces
• Texture; very little chewing resistance, sauce should be thick and smooth
• Flavour: Fish should have a clean good fish taste, sauce should taste of fish
bouillon, green onion and salt
The sensory evaluation was carried out the usual way at Fjordkökken; two panellists
participated in the sensory evaluation, with expert knowledge of the product.
50

Table 1. Freshness score sheet used by the IFL panel to evaluate the freshness of cod in green onion
sauce.
Description Score
Very good Watery, metallic, sweet, meaty, characteristic for the species 5
Good Sweet, less characteristic 4
Acceptable Neutral 3
Questionable A little sour, hint of off-flavour 2
Unacceptable Sour, bitter, TMA, off-flavour 1
Table 2. Intensity scale used by the IFL panel to evaluate spoilage characteristics of cod in green
onion sauce.
Score Description
0 None detectable
1/2
1 Hint
2 Little
3 Obvious
4 Very much
Data analysis
The samples were compared in NCSS 2000 (NCSS, Utah, US), with one way ANOVA,
multiple comparison was done using Duncans´ test. Significance level was set at 95%.
Results and discussion
Figure 1 shows the results from the IFL sensory panel.
51

Freshness score
12345
0 7 14 21 28
storage time (days)
scor
e
Spoilage score
01234
0 7 14 21 28
storage time (days)
scor
e
a) b) Figure 1. Average freshness (a) and spoilage (b) scores for cod in green onion sauce, based on the sensory evaluation of the IFL sensory panel.
No significant difference was found between the samples with regard to freshness or
spoilage odour/flavour. The freshness of all samples was around 3 (neutral) during the
storage time, and spoilage odour/flavour was scored around 1 to 2 through the storage
time (hint to little spoilage odour/flavour). Around half of the panellists commented on
frozen storage odour/flavour and tough texture in all sessions, which may have
influenced the freshness and spoilage scores. In the last sessions the panellists also
commented on discolouration, green colour of the cod. Therefore, the products might be
considered to be at the limits of acceptable quality after 26 days of chilled storage.
The results from the Fjordkökken sensory panel showed that the quality was very good
the first 3 weeks of storage (freshness score = 5) for all evaluated attributes, which was
not in accordance with the IFL panel. However, the Fjordkökken panel results during the
4th week were not different from the results of the IFL panel, scoring appearance = 3,
texture = 4 and taste = 4, also detecting green discolouration of cod.
Conclusions
The results from the IFL sensory panel indicated that the raw material used in the product
“cod in green onion sauce” was not of high freshness quality. The average freshness
score indicated that the quality was only “acceptable” from week 1 and until week 4, with
remarks on tough texture and frozen storage odours and flavours. The description of the
raw material used in the product showed the raw material had been frozen before product
production. Therefore are the result from the IFL sensory panels evaluation of the product
52

not surprising with regard to comments on frozen storage odour/flavour and tough
texture. However the incongruity between the panels may be caused by the fact that the
freshness scales used to evaluate the product were quite different with regard to
descriptions, including hedonic descriptions in the scale used by the Fjordkökken sensory
panel. Also, it could be that the quality of the raw material used may be the standard raw
material quality used by Fjordkökken and therefore evaluated as “right quality”. Even
though the cod in the product had frozen storage odours and flavours and tough texture, it
is still acceptable quality for this particular product as it is not exactly spoilage.
Based on the results, 26 days might be considered as maximum storage time for the
chilled product “cod in green onion sauce”, mainly due to discolouration of the cod.
53