Preview of “mod dbms monitoring.ppt” - Técnico Lisboa ... Consumer-Producer Chain of a DBMS’s...
11
Administração e Optimização de Bases de Dados 2012/2013 Performance Monitoring Bruno Martins DEI@Técnico e DMIR@INESC-ID Performance Monitoring Goals ! Monitoring should check that the performance-influencing database parameters are correctly set and if they are not, it should point to where the problems are ! Alternatively, one can sit and wait for the usersʼ complaints Monitoring preventive method OR Correct problems when detected reactive method
Transcript of Preview of “mod dbms monitoring.ppt” - Técnico Lisboa ... Consumer-Producer Chain of a DBMS’s...

Administração e Optimização de Bases de Dados 2012/2013
Performance Monitoring
Bruno Martins DEI@Técnico e DMIR@INESC-ID
Performance Monitoring Goals !! Monitoring should check that
the performance-influencing ! database parameters are
correctly set and if they are not, it should point to where the problems are !
! Alternatively, one can sit and wait for the usersʼ complaints
!
Monitoring !preventive method !
OR !
Correct problems when detected ! reactive
method !

How to monitor a DBMS? !! By extracting relevant performance ! indicators, (counters, metrics, and details
of internal DBMSʼs activities) !
! By comparing the obtained values of these indicators against ideal values !! But… there are many indicators! !
Recurrent Patterns of Problems !
! An overloading high-level ! consumer
!" Ex: query accessing too many rows
!! A poorly parameterized subsystem
! " Ex: disk subsystem that stores tables, indexes, logging in a single disk
!! An overloaded primary resource ! " Ex: CPU busy because non-DB
processes are using it at the same time
!

A Consumer-Producer Chain of a DBMS’s Resources ! High Level
!sql commands ! Consumers
!
PARSER !OPTIMIZER
!
Intermediate !
DISK !SYBSYSTEM
!
probing spots ! for
indicators !
EXECUTION !SUBSYSTEM
LOCKING ! SUBSYSTEM
!
CACHE LOGGING MANAGER SUBSYSTEM !
Resources/ Consumers !
MEMORY CPU !
DISK/ CONTROLLER !
Primary !NETWORK Resources
!
A Systematic Approach to !Monitoring !Extract indicators to answer the following questions !
! Question 1: Are critical ! queries being served in
!the most efficient manner? !! Question 2: Are DBMS
! subsystems making optimal use of resources? !! Question 3: Are there
! enough primary resources available and are they configured adequately, given the current and expected workload? !
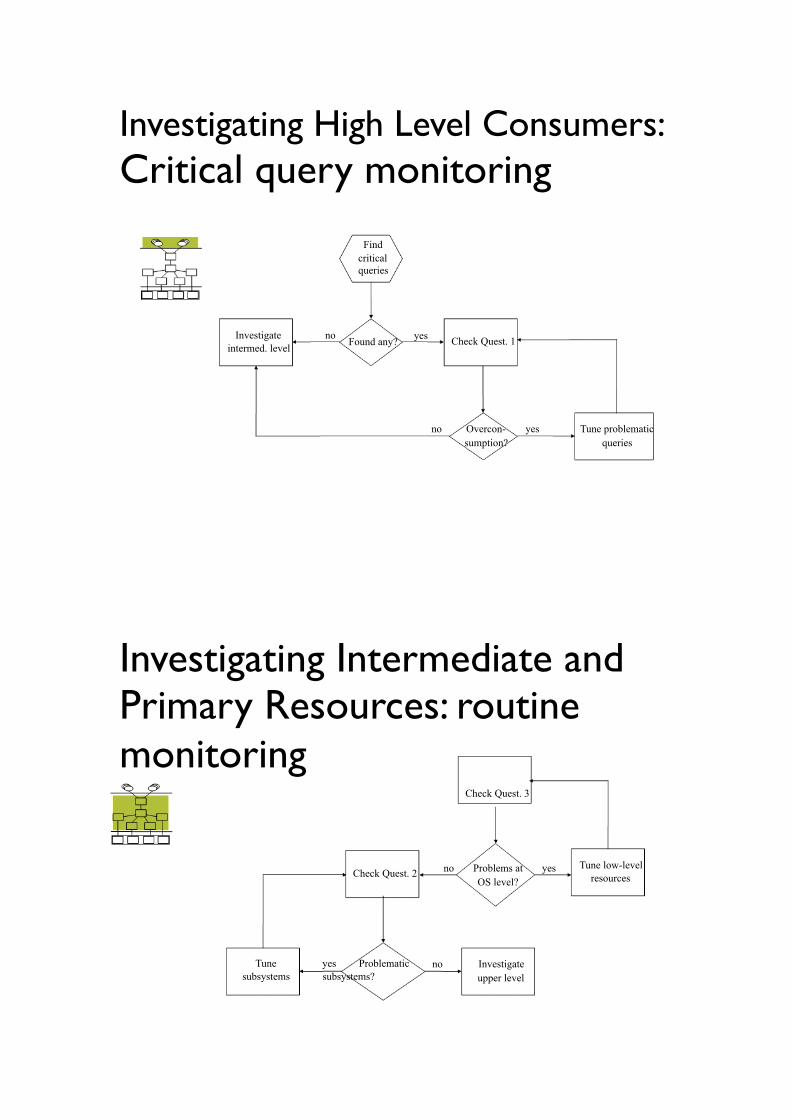
Investigating High Level Consumers: !Critical query monitoring !
Find !critical
queries !
Investigate no intermed. level !
Found any? !
yes ! Check Quest. 1
!
no Overcon- ! sumption?
!
yes Tune problematic ! queries
!
Investigating Intermediate and Primary Resources: routine !monitoring ! Check Quest. 3
!
Check Quest. 2 !
Tune yes Problematic subsystems subsystems? !
no Problems at yes ! OS level?
!
no Investigate ! upper level
!
Tune low-level resources
!

Tools used to gather information !
! Event monitors !
! Query plan explainers
! Performance monitors
!
Investigating High Level Consumers ! ! Answer question 1:
! “Are critical queries being served in the most efficient manner?” !
1. !2. !3. !
Identify the critical queries Analyze their access plans Profile their execution !

Query profiling indicators !! Duration information involves 3 indicators: ! " Elapsed time for the query: time it took to process it as
perceived by the user !" CPU time: time the CPU was actually used to process the
query !" Wait time: time the query was not processing and waiting
for a resource to become available !
! Resource consumption information includes: ! " (I/O) Physical and logical reads/writes
!" (Locking) Maximum nbr locks held, nbr lock escalations, nbr deadlocks/timeouts, total time spent waiting for locks
!" (SQL activity) Nb sorts and temporary area usage: gives an idea of the time spent in expensive overhead activity
!
Two common scenarios !1.
!
2. !
Elapsed query time close to CPU time, wait time negligible. Consumption fair: reasonable nb pages being accesses, most of them are logical accesses; nb locks low or inexistent and no deadlocks or lock escalations; if there were sorts, they !didnʼt augment the nb of logical/physical reads/writes
! Access plan is executed in the best way possible; if the rest ! of the chain is balanced, this is the best performance the
system can deliver for this query !
Noticeable discrepancy between elapsed and CPU time, wait time fills the gap. So there must be a problem in !resource consumption: contention (probably waiting for locks) or poorly performing resource (ex. if area allocated for sorting is small, additional I/O). !" To distinguish between contention and physical resource
consumption problem, run the query in isolation !
Investigating Primary Resources ! •
Answer question 3: “Are there enough primary resources available for a DBMS to consume?”
•
Primary resources: CPU, disk/controllers, memory, and network •
Analyze specific OS-level indicators to discover bottlenecks. •
A system-level performance monitor is the right tool here
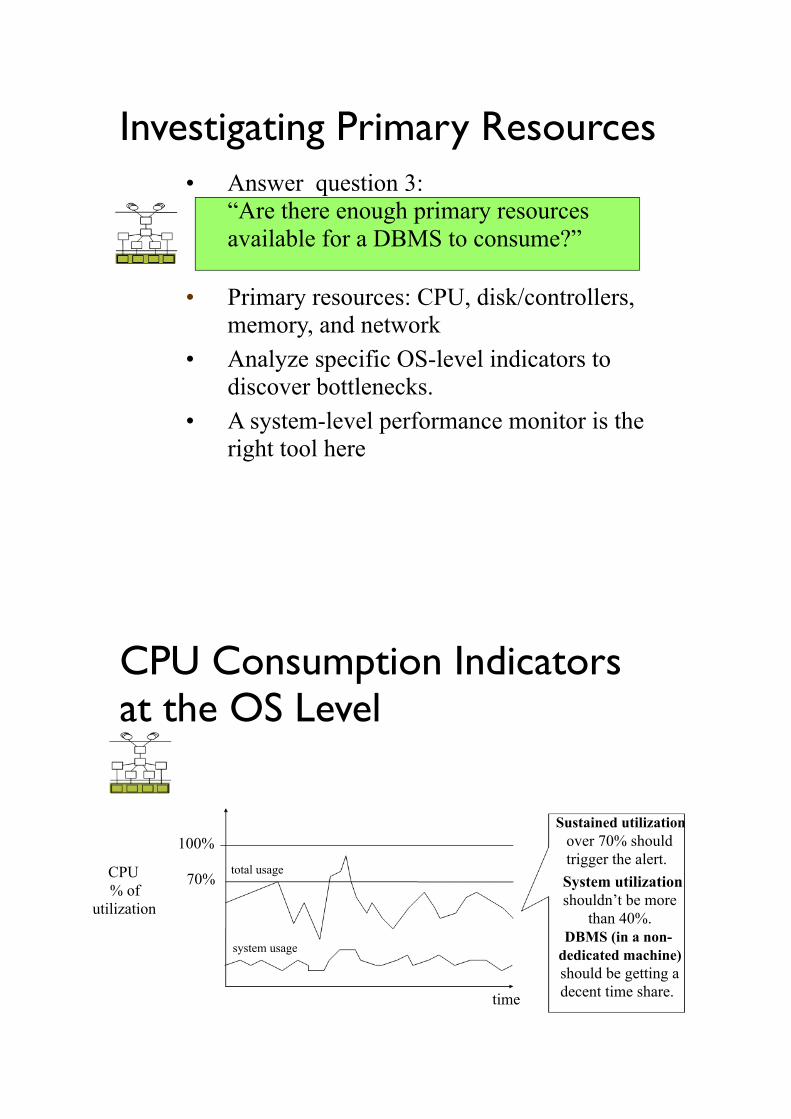
CPU Consumption Indicators at the OS Level !
Sustained utilization !
CPU % of
utilization !
100% !
70% !
total usage !
system usage !
time !
over 70% should trigger the alert. !System utilization !shouldn’t be more
than 40%. !DBMS (in a non-
dedicated machine) !should be getting a decent time share. !
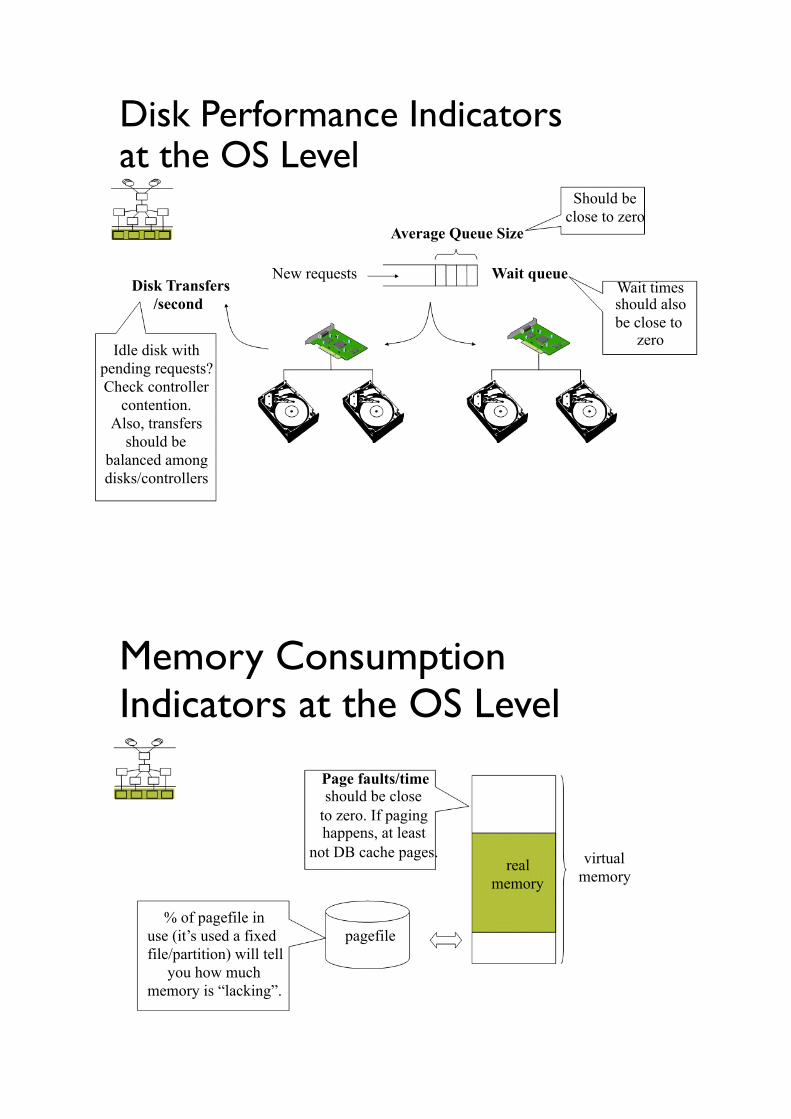
Disk Performance Indicators at the OS Level ! Should be
!close to zero !Average Queue Size
!
Disk Transfers /second
!
Idle disk with pending requests? !Check controller
contention. ! Also, transfers
should be !balanced among
disks/controllers !
New requests Wait queue ! Wait times
should also be close to
zero !
Memory Consumption !Indicators at the OS Level !
Page faults/time !should be close to zero. If paging
happens, at least
% of pagefile in use (it’s used a fixed file/partition) will tell ! you how much memory is “lacking”. !
not DB cache pages. real
! memory !
pagefile !
virtual memory !

Investigating Intermediate Resources/Consumers ! •
Answer question 2: “Are subsystems making optimal use of resources?”
•
Main subsystems: Cache Manager, Disk subsystem, Lock subsystem, and Log/Recovery subsystem •
Extract and analyze relevant perf. indicators •
A Performance Monitor is usually useful, but sometimes specific tools apply !
Cache Manager Performance !Indicators !
Table scan !
readpage() !
If page is not in the cache, readpage
(logical) generate an actual IO (physical). !Ratio of readpages that
did not generate !physical IO (cache hit !ration) should be 90% !Cache Pick
!Manager victim
!strategy Data Pages !
Free Page slots !
or more !
Pages are regularly saved to disk to make ! free space.
!Page reads/ writes
!# of free slots should
always be > 0 !

Disk Manager Performance !Indicators ! rows
!
page !
Storage !Hierarchy extent
!(simplified) !
file !
disk !
Row displacement: should kept under 5% of rows
!
Free space fragmentation: pages with few space should ! not be in the free list
!Data fragmentation: ideally files that store DB objects
(table, index) should be in one or few contiguous extents (<5) !
File position: should balance workload evenly among all disks !
Lock Manager Perf. Indicators !
Lock !request !
Object Lock Type !
Lock List !
Locks !pending list
!
TXN ID !
Lock wait time for a transaction should be a
small fraction of the whole ! transaction time.
!Number of locks on wait !should be a small fraction of the number of locks on ! the lock list, under 20% !
Deadlocks and timeouts ! should be virtually
!inexistent or extremely low (no more than 1% of the transactions) !

Logging Subsystem Performance Indicators !! Log is used by every transaction that alters, inserts
or deletes data !! Well tuned logging subsystem should write log
records at a pace that doesnʼt slow active transactions
!! Indicatores to measure: ! " Number of log waits to confirm that the disks storing the log
files are keeping pace with the transaction workload - should be zero
!" Nb of log expansions or log archives due to lack of space - if bigger than zero indicates a configuration problem
!" Log cache-hit ratio to check whether the size of the log buffer is adequate
!
Conclusion !
! Monitoring a DBMSʼs performance can be done in a systematic way ! " The consumption chain helps distinguishing
problems’ causes from their symptoms !" Existing tools help extracting relevant performance indicators !" The three questions guide the whole monitoring process !