Potential carbon emissions dominated by carbon …...3 Maximum CH 4 rate refers to the peak CH 4...
28
SUPPLEMENTARY INFORMATION DOI: 10.1038/NCLIMATE3054 NATURE CLIMATE CHANGE | www.nature.com/natureclimatechange 1 Christina Schädel 1* , Martin K.F. Bader 2 , Edward A.G. Schuur 1 , Christina Biasi 3 , Rosvel Bracho 4,5 , Petr Čapek 6 , Sarah De Baets 7 , Kateřina Diáková 6 , Jessica Ernakovich 8 , Cristian Estop-Aragones 7,9 , David E. Graham 10 , Iain P. Hartley 7 , Colleen M. Iversen 11 , Evan Kane 12 , Christian Knoblauch 13 , Massimo Lupascu 14 , Pertti J. Martikainen 3 , Susan Natali 15 , Richard J. Norby 11 , Jonathan A. O’Donnell 16 , Taniya Roy Chowdhury 10 , Hana Šantrůčková 6 , Gaius Shaver 17 , Victoria L. Sloan 11 , Claire C. Treat 18 , Merritt R. Turetsky 19 , Mark P. Waldrop 20 , Kimberly P. Wickland 21 1 Center for Ecosystem Science and Society, Northern Arizona University, Flagstaff, AZ, USA 2 New Zealand Forest Research Institute, Rotorua, New Zealand 3 Department of Environmental and Biological Sciences, University of Eastern Finland, Kuopio, Finland 4 Department of Biology, University of Florida, Gainesville, FL, USA 5 School of Forest Resources and Conservation, University of Florida, Gainesville, FL, USA 6 University of South Bohemia, Faculty of Science, Ceske Budejovice, Czech Republic 7 Geography, College of Life and Environmental Sciences, University of Exeter, Exeter, UK 8 CSIRO Agriculture, Adelaide, Australia 9 Department of Renewable Resources, University of Alberta, Edmonton, AB, Canada 10 Biosciences Division, Oak Ridge National Laboratory, Oak Ridge, TN, USA 11 Environmental Sciences Division and Climate Change Science Institute, Oak Ridge National Laboratory, Oak Ridge, TN, USA 12 School of Forest Resources and Environmental Science, Michigan Technological University, Houghton, MI, USA 13 Institute of Soil Science, Universität Hamburg, Hamburg, Germany 14 Department of Geography, National University of Singapore, Singapore 15 Woods Hole Research Center, Falmouth, MA, USA 16 Arctic Network, National Park Service, Anchorage, AK, USA 17 The Ecosystem Center, Marine Biological Laboratory, Woods Hole, MA, USA 18 Institute of Northern Engineering, University of Alaska Fairbanks, Fairbanks, AK, USA 19 Department of Integrative Biology, University of Guelph, Guelph, Ontario, Canada 20 US Geological Survey, Menlo Park, CA, USA 21 US Geological Survey, Boulder, CO, USA Correspondence: [email protected] Potential carbon emissions dominated by carbon dioxide from thawed permafrost soils © 2016 Macmillan Publishers Limited. All rights reserved.
Transcript of Potential carbon emissions dominated by carbon …...3 Maximum CH 4 rate refers to the peak CH 4...

SUPPLEMENTARY INFORMATIONDOI: 10.1038/NCLIMATE3054
NATURE CLIMATE CHANGE | www.nature.com/natureclimatechange 1
1
Potential carbon emissions dominated by carbon dioxide from thawed
permafrost soils
Christina Schädel1*, Martin K.F. Bader2, Edward A.G. Schuur1, Christina Biasi3, Rosvel Bracho4,5, Petr
Čapek6, Sarah De Baets7, Kateřina Diáková6, Jessica Ernakovich8, Cristian Estop-Aragones7,9, David E.
Graham10, Iain P. Hartley7, Colleen M. Iversen11, Evan Kane12, Christian Knoblauch13, Massimo Lupascu14,
Pertti J. Martikainen3, Susan Natali15, Richard J. Norby11, Jonathan A. O’Donnell16, Taniya Roy
Chowdhury10, Hana Šantrůčková6, Gaius Shaver17, Victoria L. Sloan11, Claire C. Treat18, Merritt R.
Turetsky19, Mark P. Waldrop20, Kimberly P. Wickland21
1Center for Ecosystem Science and Society, Northern Arizona University, Flagstaff, AZ, USA 2New Zealand Forest Research Institute, Rotorua, New Zealand 3Department of Environmental and Biological Sciences, University of Eastern Finland, Kuopio, Finland 4Department of Biology, University of Florida, Gainesville, FL, USA 5School of Forest Resources and Conservation, University of Florida, Gainesville, FL, USA 6University of South Bohemia, Faculty of Science, Ceske Budejovice, Czech Republic 7Geography, College of Life and Environmental Sciences, University of Exeter, Exeter, UK 8CSIRO Agriculture, Adelaide, Australia 9Department of Renewable Resources, University of Alberta, Edmonton, AB, Canada 10Biosciences Division, Oak Ridge National Laboratory, Oak Ridge, TN, USA
11Environmental Sciences Division and Climate Change Science Institute, Oak Ridge National Laboratory, Oak Ridge,
TN, USA 12 School of Forest Resources and Environmental Science, Michigan Technological University, Houghton, MI, USA 13Institute of Soil Science, Universität Hamburg, Hamburg, Germany 14Department of Geography, National University of Singapore, Singapore 15Woods Hole Research Center, Falmouth, MA, USA 16Arctic Network, National Park Service, Anchorage, AK, USA 17The Ecosystem Center, Marine Biological Laboratory, Woods Hole, MA, USA 18Institute of Northern Engineering, University of Alaska Fairbanks, Fairbanks, AK, USA 19Department of Integrative Biology, University of Guelph, Guelph, Ontario, Canada 20US Geological Survey, Menlo Park, CA, USA 21US Geological Survey, Boulder, CO, USA
Correspondence: [email protected]
Potential carbon emissions dominated by carbon dioxide from thawed permafrost soils
© 2016 Macmillan Publishers Limited. All rights reserved.

2
Additional Results
Besides calculating the effect of a 10 °C increase in incubation temperature on total C release (sum of
CO2-C and CH4-C), we also calculated the effect of increasing temperature on total C release when
accounting for the higher GWP of CH4, which resulted in an almost identical increase in C release of 2.06
(Table S5).
Additionally, we looked at the effect of a 10 °C increase in incubation temperature on CH4-C
release alone (anaerobic studies only). Over all studies the CH4-C release was 4.26 times higher with a 10
°C increase in temperature and no effects of ecosystem, soil type or permafrost condition were found
(Fig. S1, Table S6, Table S12). Given that CH4 accounts for a small portion of the total C release under
anaerobic incubation conditions the overall ratio of C release with a 10 °C increase in incubation
temperature did not differ for aerobic or anaerobic incubation conditions.
Sensitivity analysis
We performed a sensitivity analysis that uses three different datasets to show that our conclusions
about the low contribution of CH4-C to total anaerobic C emissions from the given incubation studies are
robust. We performed the aerobic to anaerobic meta-analyses using the following three different
datasets:
a) The original dataset that includes all samples and studies as reported in the main text
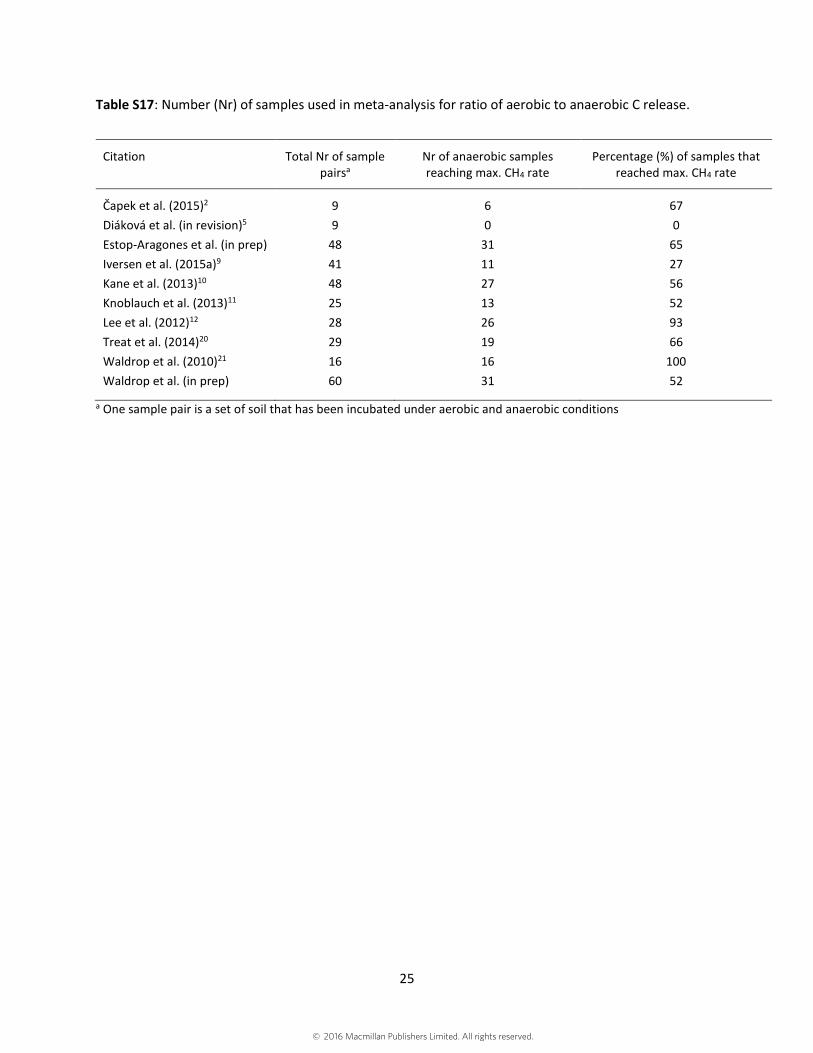
b) Only those studies were included for which more than 60% of the samples had reached
maximum CH4 rate during the incubation (see Table 17)
c) Only those samples from individual incubation studies were included that had reached
maximum CH4 rate during the incubation (includes samples from all studies except for Diáková
et al. (in revision). The difference to b) is that individual samples were explicitly excluded rather
than studies, which are collections of individual samples.
© 2016 Macmillan Publishers Limited. All rights reserved.

3
Maximum CH4 rate refers to the peak CH4 rate and was determined based on daily rates over time. Table
18 shows the results from all three meta-analyses. The overall mean estimate (ratio of soil C release
under aerobic versus anaerobic incubation conditions) is for a) 3.39 (95% CI from 2.22 to 5.18), for b)
3.65 (95% CI from 1.91 to 6.98) and for c) 3.81 (95% CI from 2.53 to 5.73) when using total C (sum of
CO2-C + CH4-C). When also accounting for the higher Global Warming Potential of CH4 (as CO2-C
equivalent) the overall mean estimate for a) is 2.3 (95% CI from 1.55 to 3.4), for b) 2.7 (95% CI from 1.62
to 4.49), and for c) 2.26 (95% CI from 1.44 to 3.54).
In addition, we have also calculated the contribution of CH4-C to total anaerobic C release using the
three different datasets. On average the contribution of CH4-C to total C is for a) 5.73% (95% CI from
2.74 to 8.73), for b) 5.59 (95% CI from -1.97 to 13.16), and for c) 7.5% (95% CI from 3.83 to 16.84;
Supplementary Figure S2). Ecosystem and Temperature are only significant moderators for the original
analysis, which includes all samples and studies. This sensitivity analysis shows that for all three datasets
C release under anaerobic conditions is dominated by anaerobic CO2.
© 2016 Macmillan Publishers Limited. All rights reserved.

4
Figure S1| Ratio of CH4-C release with a 10° C increase in temperature. Studies are split into different ecosystems, soil types and permafrost conditions (numbers in brackets represent number of observations for each subgroup). The arrow indicates that the confidence interval (CI) is wider than the space.
© 2016 Macmillan Publishers Limited. All rights reserved.

5
Figure S2| Contribution of CH4-C to total anaerobic C release for the three datasets used in the sensitivity analysis. Black squares represent boreal forest, dark circles peatland and light grey triangles tundra ecosystems. Symbols represent observations from different observations and error bars show standard deviation within an observation. Figure S2a is the same as Fig. 3 in the main text. In a) lines represent the average predicted relationship between CH4-C contributions to total anaerobic C release and incubation temperature for the three given ecosystems. For b) and c) neither ecosystem nor temperature were significant moderators. For a) mean over all observations = 5.73% (95% CI 2.74, to 8.73); for b) mean of all observations = 5.59 (95% CI -1.97 to 13.16); for c) mean over all observations = 7.5% (95% CI 3.83 to 16.84).
Incubation Temperature (°C)
-5 0 5 10 15 20 25
CH
4-C
con
tribu
tion
to to
tal
anae
robi
c C
rele
ase
(%)
0
20
40
60
80
100
TundraPeatlandBoreal Forest
a. All samples and studies
© 2016 Macmillan Publishers Limited. All rights reserved.

6
Incubation Temperature (°C)
-5 0 5 10 15 20 25
CH
4-C
con
tribu
tion
to to
tal
anae
robi
c C
rele
ase
(%)
0
20
40
60
80
100
TundraPeatlandBoreal Forest
b. Studies with >60% of samples reaching maximum CH4 rate
Incubation Temperature (°C)
-5 0 5 10 15 20 25
CH
4-C
con
tribu
tion
to to
tal
anae
robi
c C
rele
ase
(%)
0
20
40
60
80
100
TundraPeatlandBoreal Forest
c. Only samples included that reached maximum CH4 rate
© 2016 Macmillan Publishers Limited. All rights reserved.

7
Table S1| Study details with treatment, incubation temperature used in the meta-analysis, ecosystem, permafrost, soil type, and incubation length.
aTreatment: T = temperature, Ae/An=aerobic and anaerobic bEcosystem: boreal=boreal forest, peat=peatland, tundra=tundra cPermafrost: al=active layer, no= no permafrost, p=permafrost layer dSoil type: min=mineral (% C<20), org=organic (% C>20) eData extracted from publication, for all other studies we used raw data fBoth Iversen et al. 2015 datasets fall under the same data citation but are independent data sets gTwelve samples were incubated at 4 °C and 8 °C and eight samples were incubated at 4 °C and 10 °C
hAnaerobic incubations were performed at -0.5°C and 20°C, for aerobic incubations we used 4°C and 20°C iAnaerobic incubations lasted 110 days (peatland), aerobic incubations lasted either 110 (peatland) or 230 days (boreal forest)
Citation Treatmenta Used incubation temperatures (°C)
Ecosystemb Permafrostc Soil typed Incubation length (days)
Bracho et al. (2016)1 T 15, 25 tundra al, p min, org 365 Čapek et al. (2015)2 T + Ae/An 4, 20 tundra al min 133 Dai et al. (2002)3 T 4, 25 tundra al, p min, org 120 De Baets et al. (in revision)4 T 7, 17 tundra al, p min, org 469 Diáková et al. (in revision)5 T + Ae/An 4, 20 peat, tundra al min, org 162 Dutta et al. (2006)6 T 5, 15 boreal, tundra al, p min 390 Ernakovich et al. (2014)7 T 1, 15 tundra p min, org 91 Estop-Aragones et al. (in prep) T + Ae/An 5, 15 boreal, peat al, p min, org 110, 230i
Hobbie et al. (2002e)8 T 4, 15 tundra al org 216 Iversen et al. (2015af)9 T + Ae/An 2,12 tundra al min, org 28 Iversen et al. (2015bf) T 4,12 tundra al min, org 28 Kane et al. (2013)10 Ae/An 22 peat al org 38 Knoblauch et al. (2013)11 Ae/An 4 tundra p min 1242 Lee et al. (2012)12 Ae/An 15 boreal, tundra al, p min, org 493 Lavoie et al. (2011)13 T 5, 15 boreal, tundra al, no min, org 1086 Nadelhoffer et al. (1991e)14 T 3, 15 tundra al min, org 91 Neff & Hooper (2002e)15 T 10, 30 tundra al org 352 O’Donnell et al. (2009)16 T 2, 20 boreal al org 48 Oelbermann et al. (2008e)17 T 14, 21 tundra al min, org 84 Roy Chowdhury et al. (2015)18 T 4,8 (10g) tundra al, p min, org 60 Shaver et al. (2006)19 T 7, 15 tundra al org 465 Treat et al. (2014)20 T + Ae/An -0.5h, 4, 20 peat al, p min, org 27 Waldrop et al. (2010)21 Ae/An 5 boreal al, p min, org 40 Waldrop et al. (in prep) T + Ae/An 5, 21 boreal, peat al, p min, org 355 Wickland & Neff (2008e)22 T 10, 20 boreal al, no org 57
© 2016 Macmillan Publishers Limited. All rights reserved.

8
Table S2 | Effect size estimates (yi, log ratio of the means) and corresponding variance (vi) used for meta-analysis of the effect of a 10 °C increase in incubation temperature on total C release (CO2-C+CH4-C) and on total CO2-C equivalent release by accounting for the Global Warming Potential of CO2 (GWP=1) and CH4 (GWP=34)23. Ecosystem, permafrost, soil type and oxygen are moderators used for multilevel meta-analysis. Nr is the number of observations per citation.
Citation Ecosystema Permafrostb Soil typec Oxygend Total C CO2-C equivalent Nr
yi vi yi vi
Bracho et al. (2016)1 tundra al org Ae 0.457 0.096 0.457 0.096 3 Bracho et al. (2016) tundra p org Ae 0.741 0.170 0.741 0.170 3 Bracho et al. (2016) tundra p min Ae 0.710 0.036 0.710 0.036 3 Čapek et al. (2015)2 tundra al min Ae 0.986 0.807 0.986 0.807 2 Čapek et al. (2015) tundra al min An 0.807 0.240 0.993 0.210 2 Dai et al. (2002)3 tundra al min Ae 0.562 0.115 0.562 0.115 1 De Baets et al. (in revision)4 tundra al org Ae 0.820 0.003 0.820 0.003 3 De Baets et al. (in revision) tundra p org Ae 1.252 0.092 1.252 0.092 3 De Baets et al. (in revision) tundra p min Ae 1.464 0.212 1.464 0.212 3 Diáková et al. (in revision)5 peat al org Ae 1.072 0.956 1.072 0.956 1 Dutta et al. (2006)6 tundra p min Ae 0.173 0.056 0.173 0.056 3 Dutta et al. (2006) boreal al min Ae 0.583 0.165 0.583 0.165 3 Dutta et al. (2006) boreal p min Ae 0.272 0.040 0.272 0.04 3 Ernakovich et al. (2014)7 tundra p min Ae 0.880 0.035 0.880 0.035 2 Ernakovich et al. (2014) tundra p min An 0.653 0.423 0.726 0.505 2 Estop-Aragones et al. (in prep) peat al org Ae 1.136 0.180 1.136 0.180 8 Estop-Aragones et al. (in prep) peat al org An 0.724 0.197 0.778 0.785 8 Estop-Aragones et al. (in prep) peat p org Ae 1.121 0.064 1.121 0.064 8 Estop-Aragones et al. (in prep) peat p org An 0.774 0.070 0.783 0.069 8 Estop-Aragones et al. (in prep) boreal al org Ae 0.917 0.088 0.917 0.088 8 Estop-Aragones et al. (in prep) boreal al min Ae 1.040 0.102 1.040 0.102 8 Estop-Aragones et al. (in prep) boreal p org Ae 1.013 0.378 1.013 0.378 8 Estop-Aragones et al. (in prep) boreal p min Ae 0.991 0.126 0.991 0.126 8 Hobbie et al. (2002)8 tundra al org Ae 1.549 0.306 1.549 0.306 1 Iversen et al. (2015a)9 tundra al org Ae 1.121 0.271 1.121 0.271 4 Iversen et al. (2015a) tundra al org An 0.581 0.305 1.204 0.315 4 Iversen et al. (2015a) tundra al min Ae 0.940 0.033 0.940 0.033 4 Iversen et al. (2015a) tundra al min An 0.599 0.010 0.688 0.013 4 Iversen et al. (2015b) tundra al org Ae 0.917 0.123 0.917 0.123 2 Iversen et al. (2015b) tundra al min Ae 0.925 0.038 0.925 0.038 2 Lavoie et al. (2011)13 tundra al org Ae 0.334 0.115 0.334 0.115 4 Lavoie et al. (2011) tundra al min Ae 0.627 0.026 0.627 0.026 4 Lavoie et al. (2011) boreal no org Ae 0.714 0.126 0.714 0.126 4 Lavoie et al. (2011) boreal no min Ae 0.646 0.062 0.646 0.062 4
© 2016 Macmillan Publishers Limited. All rights reserved.

9
Nadelhoffer et al. (1991)14 tundra al org Ae 0.447 0.128 0.447 0.128 2 Nadelhoffer et al. (1991) tundra al min Ae 0.426 0.203 0.426 0.203 2 Neff & Hooper (2002)15 tundra al org Ae 0.383 0.067 0.383 0.067 1 O’Donnell et al. (2009)16 boreal al org Ae 1.060 0.043 1.060 0.043 1 Oelbermann et al. (2008)17 tundra al org Ae 0.980 0.082 0.980 0.082 2 Oelbermann et al. (2008) tundra al min Ae 1.296 0.780 1.296 0.780 2 Roy Chowdhury et al. (2015)18 tundra al org An 0.936 0.494 1.549 0.617 1 Shaver et al. (2006)19 tundra al org Ae 0.594 0.119 0.594 0.119 1 Treat et al. (2014)20 peat al org Ae 0.969 0.036 0.969 0.036 5 Treat et al. (2014) peat al org An 0.820 0.024 0.886 0.017 5 Treat et al. (2014) peat p org Ae 0.690 0.020 0.690 0.020 5 Treat et al. (2014) peat p org An 0.520 0.054 0.529 0.050 5 Treat et al. (2014) peat p min Ae 0.821 0.082 0.821 0.082 5 Waldrop et al. (in prep) peat al org Ae 0.812 0.055 0.812 0.055 6 Waldrop et al. (in prep) peat al org An 0.617 0.126 0.848 0.050 6 Waldrop et al. (in prep) boreal al min Ae 0.579 0.161 0.579 0.161 6 Waldrop et al. (in prep) boreal al min An 0.475 0.290 0.483 0.294 6 Waldrop et al. (in prep) boreal p min Ae 0.293 0.052 0.293 0.052 6 Waldrop et al. (in prep) boreal p min An 0.456 0.187 0.456 0.187 6 Wickland & Neff (2008)22 boreal al org Ae 0.500 0.000 0.500 0.000 1
aEcosystem: boreal = boreal forest, peat=peatland, tundra=tundra bPermafrost: al=active layer, no= no permafrost, p=permafrost layer cSoil type: min=mineral (% C<20), org=organic (% C>20) dOxygen: Ae=aerobic incubation, An=anaerobic incubation
© 2016 Macmillan Publishers Limited. All rights reserved.

10
Table S3 | Effect size estimates (yi, log ratio of the means) and corresponding variance (vi) used for meta-analysis of the effect of a 10 °C increase in incubation temperature on CH4-C release. Ecosystem, permafrost, and soil type are moderators used for meta-analysis with mixed effects models. Nr is the number of observations per citation.
Citation Ecosystema Permafrostb Soil typec yi vi Nr
Čapek et al. (2015)2 tundra al min 3.142 1.117 1 Ernakovich et al. (2014)7 tundra p min 0.735 0.5155 1 Estop-Aragones et al. (in prep.) peat al org 0.811 1.3675 2 Estop-Aragones et al. (in prep.) peat p org 1.159 0.0841 2 Iversen et al. (2015a)9 tundra al org 2.296 0.3361 2 Iversen et al. (2015a) tundra al min 1.492 0.6506 2 Roy-Chowdhury et al. (2015)18 tundra al org 1.832 0.757 1 Treat et al. (2014)20 peat al org 2.168 0.3172 2 Treat et al. (2014) peat p org 1.131 0.7972 2 Waldrop (in prep.) peat al org 1.006 0.0793 2 Waldrop (in prep.) boreal al min 2.128 1.2665 2
aEcosystem: boreal = boreal, peat=peat, tundra=tundra bPermafrost: al=active layer, p=permafrost layer cSoil type: min=mineral (% C<20), org=organic (% C>20)
© 2016 Macmillan Publishers Limited. All rights reserved.

11
Table S4 | Effect size estimates (yi, log ratio of the means) and corresponding variance (vi) used for meta-analysis of aerobic to anaerobic total C release (CO2-C+CH4-C) and total CO2-C equivalent release. Ecosystem, permafrost, soil type and temperature are moderators used for meta-analysis with mixed effects models. Nr is the number of observations per citation.
Citation Ecosystema Permafrostb Soil typec Tempd Total C CO2-C equivalent Nr
yi vi yi vi
Čapek et al. (2015)2 tundra al min 4 0.411 0.574 0.397 0.575 3 Čapek et al. (2015) tundra al min 12 0.884 0.456 0.607 0.558 3 Čapek et al. (2015) tundra al min 20 0.636 0.543 0.165 0.511 3 Diáková et al. (in revision)4 peat al org 4 0.259 1.093 0.259 1.093 3 Diáková et al. (in revision) peat al org 12 0.915 1.041 0.915 1.041 3 Diáková et al. (in revision) peat al org 20 1.016 0.551 1.015 0.551 3 Estop-Aragones et al. (in prep.) peat al org 5 1.477 0.168 0.552 0.447 4 Estop-Aragones et al. (in prep.) peat al org 15 1.884 0.206 0.896 0.490 4 Estop-Aragones et al. (in prep.) peat p org 5 1.468 0.080 1.447 0.079 4 Estop-Aragones et al. (in prep.) peat p org 15 1.815 0.054 1.785 0.054 4 Iversen et al. (2015a)9 tundra al org 2 0.391 0.289 0.302 0.289 4 Iversen et al. (2015a) tundra al org 12 1.302 0.130 0.860 0.143 4 Iversen et al. (2015a) tundra al min 2 0.184 0.038 0.156 0.035 4 Iversen et al. (2015a) tundra al min 12 0.526 0.029 0.430 0.030 4 Kane et al. (2013e)10 peat al org 22 -0.700 0.008 -2.480 0.012 1 Knoblauch et al. (2013)11 tundra p min 4 1.387 0.016 -0.071 0.041 1 Lee et al. (2012)12 boreal p min 15 1.622 0.072 1.596 0.069 4 Lee et al. (2012) tundra al org 15 2.401 0.045 1.575 0.068 4 Lee et al. (2012) tundra p org 15 1.539 0.579 -0.298 0.727 4 Lee et al. (2012) tundra p min 15 1.966 0.076 1.291 0.078 4 Treat et al. (2014)20 peat al org -0.5 -0.102 0.157 -0.109 0.156 4 Treat et al. (2014) peat al org 20 0.615 0.025 0.495 0.025 4 Treat et al. (2014) peat p org -0.5 -0.326 0.099 -0.339 0.100 4 Treat et al. (2014) peat p org 20 0.546 0.018 0.519 0.018 4 Waldrop et al. (2010)21 boreal al org 5 1.487 0.164 0.566 0.394 4 Waldrop et al. (2010) boreal al min 5 1.189 0.211 1.004 0.139 4 Waldrop et al. (2010) boreal p org 5 1.940 0.056 1.605 0.048 4 Waldrop et al. (2010) boreal p min 5 1.870 0.205 1.264 0.196 4 Waldrop et al. (in prep.) boreal al min 5 1.142 0.244 1.140 0.244 6 Waldrop et al. (in prep.) boreal al min 21 1.251 0.113 1.226 0.118 6 Waldrop et al. (in prep.) boreal p min 5 1.775 0.082 1.774 0.082 6 Waldrop et al. (in prep.) boreal p min 21 0.983 0.396 0.935 0.381 6 Waldrop et al. (in prep.) peat al org 5 1.981 0.087 1.191 0.042 6 Waldrop et al. (in prep.) peat al org 21 2.214 0.123 0.973 0.146 6
aEcosystem: boreal = boreal forest, peat=peatland, tundra=tundra bPermafrost: al=active layer, p=permafrost layer
© 2016 Macmillan Publishers Limited. All rights reserved.

12
cSoil type: min=mineral (% C<20), org=organic (% C>20) dTemp= incubation temperature eKane et al. 2013 not included in final analysis, considered influential study
© 2016 Macmillan Publishers Limited. All rights reserved.

13
Table S5|Summary of the results of a meta-analysis of the effect of a 10°C increase in incubation temperature on total C release (CO2-C + CH4-C) and total C release as CO2-C equivalent. See Material and methods for detailed description of the response metric and the meta-analysis performed. N is the number of observations per ecosystem, soil type or permafrost.
Total C Total CO2-C equivalent
N Estimate 95% CI Estimate 95% CI lower upper lower upper Ecosystem Boreal Forest 14 1.88 1.5 2.37 1.88 1.5 2.37 Tundra 28 2.05 1.84 2.28 2.1 1.89 2.33 Peatland 12 2.23 1.95 2.55 2.29 2.02 2.6
Soil Type Mineral 24 1.98 1.71 2.28 2.02 1.74 2.34 Organic 30 2.09 1.85 2.37 2.14 1.89 2.43
Permafrost No Permafrost 2 1.95 1.31 2.91 1.95 1.31 2.91 Permafrost 17 2.03 1.57 2.62 2.03 1.58 2.62 Active layer 35 2.07 1.87 2.3 2.13 1.91 2.37
Overall mean 54 2.02 1.82 2.24 2.06 1.86 2.29
a Sampling sites from the discontinuous permafrost zone where permafrost was not present20
© 2016 Macmillan Publishers Limited. All rights reserved.

14
Table S6 | Summary of the results of a meta-analysis of the effect of a 10°C increase in incubation temperature on CH4-C from anaerobic incubations. N is the number of observations per ecosystem, soil type or permafrost. See Material and methods for detailed description of the response metric and meta-analysis performed
CH4-C
N Estimate 95% CI
lower upper Ecosystem Peatland 5 3.29 2.3 4.72 Tundra 5 6.16 2.97 12.81 Boreal Forest 1 8.4 0.93 76.25
Soil Type Organic 7 5.25 1.93 14.29 Mineral 4 4.18 2.58 6.78
Permafrost* Permafrost 3 3.01 1.82 4.99 Active layer 8 5.62 3.14 10.07
Overall mean 11 4.26 2.84 6.38
* Samples from anaerobic incubations only represented active layer and permafrost
© 2016 Macmillan Publishers Limited. All rights reserved.

15
Table S7 | Summary of the results of a meta-analysis of the ratio of aerobic to anaerobic incubation conditions on total C release (CO2-C + CH4-C) and on total C release as CO2-C equivalent by accounting for the GWP of CO2 (GWP=1) and CH4 (GWP=3423). See Material and methods for detailed description of the response metric and meta-analysis. N is the number of observations per ecosystem, soil type or permafrost. Numbers in light grey are estimates and 95% CI for analyses when Kane et al. (201310) is included.
Total C Total CO2-C equivalent
N Estimate 95% CI Estimate 95% CI lower upper lower upper Ecosystem Tundra 11 3.32 1.57 7.03 1.68 0.9 3.12 Peatland 13 3.46 1.54 7.77 2.48 1.4 4.41 Boreal Forest 9 5.0 3.99 6.27 4.17 3.34 5.21
Soil Type Mineral 14 3.34 2.11 5.28 2.18 1.27 3.72 Organic 19 4.23 2.44 7.34 2.63 1.79 3.87
Permafrost Active layer 21 3.29 1.99 5.45 2.2 1.56 3.09 Permafrost 12 4.15 2.53 6.8 2.76 1.53 4.95
Overall mean 33 3.39 2.22 5.18 2.3 1.55 3.4
Overall mean with Kane et al. 20138
34 2.77 1.63 4.7 1.61 0.77 3.39
© 2016 Macmillan Publishers Limited. All rights reserved.

16
Table S8 |Multiple regression results for logit transformed ratio of CH4-C to total anaerobic C release.
Coefficients Estimate SE DF t value P value
Intercept -5.20 1.64 20 -3.18 <0.01 Peatland 0.91 1.43 20 0.63 0.53 Boreal Forest -4.53 1.18 20 -3.84 <0.01 Temperature 0.12 0.03 20 3.61 <0.01
© 2016 Macmillan Publishers Limited. All rights reserved.

17
Table S9| Information on the amount of heterogeneity in each meta-analysis. All final models were fitted with restricted maximum likelihood.
Meta-Analysis
Temperature, total C (CO2-C + CH4-C) Q-test Q(df = 53) = 98.306, p-val < 0 .001 tau2 0.025
Temperature, CO2-C equivalent Q-test Q(df = 53) = 106.108, p-val < 0.001 tau2 0.026
Temperature, CH4-C Q-test Q(df = 10) = 11.395, p-val = 0.328 tau2 0.096
Ae/Anaerobic, total C (CO2-C + CH4-C) Q-test Q(df = 32) = 206.373, p-val < 0.001 tau2 0.409
Ae/Anaerobic, CO2-C equivalent Q-test Q(df = 32) = 142.343, p-val < .001 tau2 0.334
© 2016 Macmillan Publishers Limited. All rights reserved.

18
Table S10 | Models, their corresponding Akaike Information Criterion corrected for finite sample sizes (AICc), and Akaike weights for meta-analysis of the effect of a 10 °C increase in temperature on total C release (CO2-C + CH4-C). Bolded model is the final model. yi=effect size estimate, soiltype = soil type, water.treat = oxygen availability, permafrost = permafrost, ecosystem = ecosystem, doi = day of incubation
Model AICc Akaike weights
yi ~ 1 27.72 0.19 yi ~ 1 + water.treat 28.36 0.14 yi ~ 1 + doi 29.07 0.1 yi ~ 1 + water.treat + doi 29.24 0.09 yi ~ 1 + soiltype 29.72 0.07 yi ~ 1 + ecosystem + water.treat 30.26 0.05 yi ~ 1 + ecosystem 30.39 0.05 yi ~ 1 + soiltype + water.treat 30.5 0.05 yi ~ 1 + soiltype + doi 31.3 0.03 yi ~ 1 + soiltype + water.treat + doi 31.62 0.03 yi ~ 1 + ecosystem + water.treat + doi 31.74 0.03 yi ~ 1 + permafrost 32.01 0.02 yi ~ 1 + ecosystem + doi 32.32 0.02 yi ~ 1 + permafrost + water.treat 32.66 0.02 yi ~ 1 + ecosystem + soiltype 32.79 0.02 yi ~ 1 + ecosystem + soiltype + water.treat 32.89 0.01 yi ~ 1 + permafrost + doi 33.29 0.01 yi ~ 1 + permafrost + water.treat + doi 33.35 0.01 yi ~ 1 + ecosystem + permafrost + water.treat 34.37 0.01 yi ~ 1 + permafrost + soiltype 34.39 0.01 yi ~ 1 + ecosystem + soiltype + water.treat + doi 34.51 0.01 yi ~ 1 + ecosystem + permafrost 34.66 0.01 yi ~ 1 + ecosystem + soiltype + doi 34.87 0.01 yi ~ 1 + ecosystem + permafrost + water.treat + doi 35.15 0 yi ~ 1 + permafrost + soiltype + water.treat 35.21 0 yi ~ 1 + permafrost + soiltype + doi 35.88 0 yi ~ 1 + permafrost + soiltype + water.treat + doi 36.11 0 yi ~ 1 + ecosystem + permafrost + doi 36.27 0 yi ~ 1 + ecosystem + permafrost + soiltype + water.treat 37.19 0 yi ~ 1 + ecosystem + permafrost + soiltype 37.42 0 yi ~ 1 + ecosystem + permafrost + soiltype + water.treat + doi 38.07 0 yi ~ 1 + ecosystem + permafrost + soiltype + doi 39.16 0
© 2016 Macmillan Publishers Limited. All rights reserved.

19
Table S11 |Models, their corresponding Akaike Information Criterion corrected for finite sample sizes (AICc), and Akaike weights for weighted meta-analysis of the effect of a 10 °C increase in temperature on total C release calculated as CO2-C equivalent. Bolded model is the final model. yi = effect size, soiltype = soil type, water.treat = oxygen availability, permafrost =permafrost, ecosystem = ecosystem, doi = day of incubation
Model AICc Akaike weights
yi ~ 1 30.18 0.2 yi ~ 1 + doi 31.09 0.13 yi ~ 1 + ecosystem 31.53 0.1 yi ~ 1 + soiltype 31.92 0.08 yi ~ 1 + water.treat 32.51 0.06 yi ~ 1 + ecosystem + doi 33.1 0.05 yi ~ 1 + soiltype + doi 33.12 0.05 yi ~ 1 + water.treat + doi 33.46 0.04 yi ~ 1 + permafrost 33.73 0.03 yi ~ 1 + ecosystem + water.treat 33.82 0.03 yi ~ 1 + ecosystem + soiltype 33.91 0.03 yi ~ 1 + soiltype + water.treat 34.35 0.03 yi ~ 1 + permafrost + doi 34.49 0.02 yi ~ 1 + ecosystem + permafrost 34.97 0.02 yi ~ 1 + ecosystem + water.treat + doi 35.32 0.02 yi ~ 1 + soiltype + water.treat + doi 35.59 0.01 yi ~ 1 + ecosystem + soiltype + doi 35.63 0.01 yi ~ 1 + ecosystem + permafrost + doi 35.91 0.01 yi ~ 1 + permafrost + soiltype 36.06 0.01 yi ~ 1 + permafrost + water.treat 36.23 0.01 yi ~ 1 + ecosystem + soiltype + water.treat 36.36 0.01 yi ~ 1 + permafrost + water.treat + doi 36.95 0.01 yi ~ 1 + permafrost + soiltype + doi 37.06 0.01 yi ~ 1 + ecosystem + permafrost + water.treat 37.25 0.01 yi ~ 1 + ecosystem + permafrost + soiltype 37.74 0 yi ~ 1 + ecosystem + permafrost + water.treat + doi 37.91 0 yi ~ 1 + ecosystem + soiltype + water.treat + doi 38.01 0 yi ~ 1 + permafrost + soiltype + water.treat 38.67 0 yi ~ 1 + ecosystem + permafrost + soiltype + doi 38.79 0 yi ~ 1 + permafrost + soiltype + water.treat + doi 39.64 0 yi ~ 1 + ecosystem + permafrost + soiltype + water.treat 40.11 0 yi ~ 1 + ecosystem + permafrost + soiltype + water.treat + doi 40.87 0
© 2016 Macmillan Publishers Limited. All rights reserved.

20
Table S12 | Models, their corresponding Akaike Information Criterion corrected for finite sample sizes (AICc), and Akaike weights for meta-analysis of the effect of a 10 °C increase in temperature on CH4-C release. Bolded model is the final model. yi = effect size, soiltype = soil type,p ermafrost = permafrost, ecosystem = ecosystem, doi = day of incubation
Model AICc Akaike weights
yi ~ 1 32.78 0.63 yi ~ 1 + doi 35.64 0.15 yi ~ 1 + permafrost 36.23 0.11 yi ~ 1 + soiltype 37.74 0.05 yi ~ 1 + permafrost + doi 38.6 0.03 yi ~ 1 + ecosystem 42.28 0.01 yi ~ 1 + soiltype + doi 42.84 0 yi ~ 1 + permafrost + soiltype 43.35 0 yi ~ 1 + permafrost + soiltype + doi 49.57 0 yi ~ 1 + ecosystem + doi 52.02 0 yi ~ 1 + ecosystem + soiltype 52.34 0 yi ~ 1 + ecosystem + permafrost 52.53 0 yi ~ 1 + ecosystem + permafrost + doi 67.04 0 yi ~ 1 + ecosystem + soiltype + doi 69.57 0 yi ~ 1 + ecosystem + permafrost + soiltype 70.23 0 yi ~ 1 + ecosystem + permafrost + soiltype + doi 103.6 0
© 2016 Macmillan Publishers Limited. All rights reserved.

21
Table S13 | All possible model subsets, their corresponding Akaike Information Criterion corrected for finite sample sizes (AICc), and Akaike weights for meta-analysis of the effect of aerobic to anaerobic total C release (CO2-C+CH4-C). Bolded model is the final model. yi = effect size, soiltype = soil type, temp = temperature, permafrost = permafrost, ecosystem = ecosystem, doi = day of incubation
Model AICc Akaike weights
yi ~ 1 + soiltype + temp 53.97 0.35 yi ~ 1 + soiltype + temp + doi 54.02 0.34 yi ~ 1 + permafrost + soiltype + temp 56.67 0.09 yi ~ 1 + permafrost + soiltype + temp + doi 57.05 0.07 yi ~ 1 + soiltype 58.87 0.03 yi ~ 1 + soiltype + doi 59.08 0.03 yi ~ 1 + ecosystem + soiltype + temp 59.37 0.02 yi ~ 1 + ecosystem + soiltype + temp + doi 60.48 0.01 yi ~ 1 + permafrost + soiltype 61.47 0.01 yi ~ 1 + temp 61.62 0.01 yi ~ 1 + permafrost + soiltype + doi 61.98 0.01 yi ~ 1 + ecosystem + permafrost + soiltype + temp 62.37 0.01 yi ~ 1 + temp + doi 62.9 0 yi ~ 1 + ecosystem + temp 63.11 0 yi ~ 1 63.89 0 yi ~ 1 + ecosystem + soiltype 64 0 yi ~ 1 + ecosystem + permafrost + soiltype + temp + doi 64.02 0 yi ~ 1 + permafrost + temp 64.39 0 yi ~ 1 + ecosystem + soiltype + doi 65.12 0 yi ~ 1 + doi 65.29 0 yi ~ 1 + ecosystem + temp + doi 65.4 0 yi ~ 1 + permafrost + temp + doi 65.83 0 yi ~ 1 + ecosystem + permafrost + temp 66.3 0 yi ~ 1 + permafrost 66.48 0 yi ~ 1 + ecosystem + permafrost + soiltype 66.94 0 yi ~ 1 + ecosystem 67.09 0 yi ~ 1 + permafrost + doi 68.01 0 yi ~ 1 + ecosystem + permafrost + soiltype + doi 68.5 0 yi ~ 1 + ecosystem + permafrost + temp + doi 68.9 0 yi ~ 1 + ecosystem + doi 69.14 0 yi ~ 1 + ecosystem + permafrost 70.06 0 yi ~ 1 + ecosystem + permafrost + doi 72.39 0
© 2016 Macmillan Publishers Limited. All rights reserved.

22
Table S14 All possible model subsets, their corresponding Akaike Information Criterion corrected for finite sample sizes (AICc), and Akaike weights for meta-analysis of the effect of aerobic to anaerobic C release calculated as CO2-C equivalent. Bolded model is the final model. yi = effect size, soiltype = soil type, temp = temperature, permafrost = permafrost, ecosystem = ecosystem, doi = day of incubation
Model AICc Akaike weights
yi ~ 1 + temp 60.55 0.14 yi ~ 1 + permafrost + temp 60.8 0.12 yi ~ 1 + ecosystem + soiltype + temp 61.65 0.08 yi ~ 1 + ecosystem + temp 62.4 0.06 yi ~ 1 62.43 0.06 yi ~ 1 + permafrost + soiltype + temp 62.49 0.05 yi ~ 1 + temp + doi 62.59 0.05 yi ~ 1 + permafrost + temp + doi 62.63 0.05 yi ~ 1 + soiltype + temp 62.82 0.05 yi ~ 1 + permafrost 63.2 0.04 yi ~ 1 + ecosystem + soiltype 63.63 0.03 yi ~ 1 + ecosystem 63.66 0.03 yi ~ 1 + ecosystem + permafrost + soiltype + temp 63.71 0.03 yi ~ 1 + doi 64.19 0.02 yi ~ 1 + ecosystem + permafrost + temp 64.52 0.02 yi ~ 1 + permafrost + doi 64.58 0.02 yi ~ 1 + soiltype 64.73 0.02 yi ~ 1 + permafrost + soiltype + temp + doi 64.83 0.02 yi ~ 1 + ecosystem + soiltype + temp + doi 65.05 0.01 yi ~ 1 + permafrost + soiltype 65.11 0.01 yi ~ 1 + soiltype + temp + doi 65.22 0.01 yi ~ 1 + ecosystem + temp + doi 65.26 0.01 yi ~ 1 + ecosystem + permafrost + soiltype 65.79 0.01 yi ~ 1 + ecosystem + permafrost 66 0.01 yi ~ 1 + ecosystem + doi 66.32 0.01 yi ~ 1 + ecosystem + soiltype + doi 66.62 0.01 yi ~ 1 + soiltype + doi 66.81 0.01 yi ~ 1 + permafrost + soiltype + doi 66.93 0.01 yi ~ 1 + ecosystem + permafrost + soiltype + temp + doi 67.2 0.01 yi ~ 1 + ecosystem + permafrost + temp + doi 67.39 0 yi ~ 1 + ecosystem + permafrost + doi 68.58 0 yi ~ 1 + ecosystem + permafrost + soiltype + doi 68.76 0
© 2016 Macmillan Publishers Limited. All rights reserved.

23
Table S15 | All possible model subsets, their corresponding Akaike Information Criterion corrected for finite sample sizes (AICc), and Akaike weights for regression analysis of logit transformed ratio of CH4-C to total anaerobic C release. Bolded model is the final model. yi = effect size, soiltype = soil type, temp = temperature, permafrost = permafrost, ecosystem = ecosystem, doi = day of incubation
Model AICc Akaike weights
logit.ratio ~ 1 + ecosystem + temp 146.45 0.41 logit.ratio ~ 1 + ecosystem + permafrost + temp 148.00 0.19 logit.ratio ~ 1 + ecosystem + temp + doi 148.87 0.12 logit.ratio ~ 1 + ecosystem + soiltype + temp 149.01 0.11 logit.ratio ~ 1 + ecosystem + permafrost + temp + doi 150.47 0.05 logit.ratio ~ 1 + ecosystem + permafrost + soiltype + temp 151.08 0.04 logit.ratio ~ 1 + ecosystem + soiltype + temp + doi 151.53 0.03 logit.ratio ~ 1 + ecosystem 153.71 0.01 logit.ratio ~ 1 + ecosystem + permafrost + soiltype + temp + doi 153.72 0.01 logit.ratio ~ 1 + ecosystem + doi 156.00 0.00 logit.ratio ~ 1 + ecosystem + permafrost 156.00 0.00 logit.ratio ~ 1 + ecosystem + soiltype 156.31 0.00 logit.ratio ~ 1 + ecosystem + permafrost + doi 158.28 0.00 logit.ratio ~ 1 + ecosystem + soiltype + doi 158.62 0.00 logit.ratio ~ 1 + soiltype + temp 158.84 0.00 logit.ratio ~ 1 + ecosystem + permafrost + soiltype 159.02 0.00 logit.ratio ~ 1 + soiltype + temp + doi 159.18 0.00 logit.ratio ~ 1 + soiltype 160.27 0.00 logit.ratio ~ 1 + soiltype + doi 160.31 0.00 logit.ratio ~ 1 + permafrost + soiltype + temp 160.38 0.00 logit.ratio ~ 1 + permafrost + soiltype + temp + doi 160.54 0.00 logit.ratio ~ 1 161.39 0.00 logit.ratio ~ 1 + ecosystem + permafrost + soiltype + doi 161.40 0.00 logit.ratio ~ 1 + permafrost + soiltype + doi 162.05 0.00 logit.ratio ~ 1 + doi 162.17 0.00 logit.ratio ~ 1 + permafrost + soiltype 162.26 0.00 logit.ratio ~ 1 + temp 162.27 0.00 logit.ratio ~ 1 + permafrost 163.30 0.00 logit.ratio ~ 1 + temp + doi 163.32 0.00 logit.ratio ~ 1 + permafrost + temp 163.58 0.00 logit.ratio ~ 1 + permafrost + doi 163.63 0.00 logit.ratio ~ 1 + permafrost + temp + doi 164.18 0.00
© 2016 Macmillan Publishers Limited. All rights reserved.

24
Table S16| Variable importance values for each Meta-Analysis
Meta-Analysis Moderators Variance importance value
Temperature, total C (CO2-C + CH4-C) Ecosystem 0.22 Permafrost 0.09 Soil type 0.24 Water treatment 0.45 Day of incubation 0.34
Temperature, CO2-C equivalent Ecosystem 0.29 Permafrost 0.13 Soil type 0.24 Water treatment 0.23 Day of incubation 0.36
Temperature, CH4-C (CH4-C) Ecosystem 0.01 Permafrost 0.15 Soil type 0.06 Day of incubation 0.19
Ae/Anaerobic, total C (CO2-C + CH4-C) Ecosystem 0.04 Permafrost 0.19 Soil type 0.97 Temperature 0.9 Day of incubation 0.46
Ae/Anaerobic, total CO2-C equivalent Ecosystem 0.32 Permafrost 0.4 Soil type 0.36 Temperature 0.71 Day of incubation 0.24
Regression analysis, CH4-C to total C Ecosystem 1.0 Permafrost 0.3 Soil type 0.21 Temperature 0.97 Day of incubation 0.23
© 2016 Macmillan Publishers Limited. All rights reserved.
25
Table S17: Number (Nr) of samples used in meta-analysis for ratio of aerobic to anaerobic C release.
a One sample pair is a set of soil that has been incubated under aerobic and anaerobic conditions
Citation Total Nr of sample pairsa
Nr of anaerobic samples reaching max. CH4 rate
Percentage (%) of samples that reached max. CH4 rate
Čapek et al. (2015)2 9 6 67 Diáková et al. (in revision)5 9 0 0 Estop-Aragones et al. (in prep) 48 31 65 Iversen et al. (2015a)9 41 11 27 Kane et al. (2013)10 48 27 56 Knoblauch et al. (2013)11 25 13 52 Lee et al. (2012)12 28 26 93 Treat et al. (2014)20 29 19 66 Waldrop et al. (2010)21 16 16 100 Waldrop et al. (in prep) 60 31 52
© 2016 Macmillan Publishers Limited. All rights reserved.

26
Table S18: Summary of the results of the sensitivity analysis. meta-analyses of the ratio of aerobic to anaerobic incubation conditions on total C release (CO2-C + CH4-C) and on total C release as CO2-C equivalent by accounting for the GWP of CO2 (GWP=1) and CH4 (GWP=3423). N are numbers of observations (not equal to number of samples as multiple samples could be grouped into one observation). Letters a-c in the headers refer to the three analyses performed as part of the sensitivity analysis.
a) All studies and samples b) Studies with > 60% of samples reaching max. CH4 rate
c) Only samples included that reached maximum CH4 rate
N Estimate 95% CI N Estimate 95% CI N Estimate 95% CI
lower upper lower upper lower upper
Ecosystem Total C Tundra 11 3.32 1.57 7.03 6 4.34 0.98 19.24 8 3.82 2.07 7.03 Peatland 13 3.46 1.54 7.77 8 2.69 0.73 9.95 9 4.1 1.52 11.06 Boreal Forest 9 5.0 3.99 6.27 5 5.52 4.15 7.33 8 5.1 3.89 6.69
Soil Type Mineral 14 3.34 2.11 5.28 7 4.09 2.21 7.6 11 3.36 2.35 4.8 Organic 19 4.23 2.44 7.34 12 4.47 1.95 10.23 14 5.04 2.91 8.71 Permafrost Active layer 21 3.29 1.99 5.45 10 3.76 1.86 7.6 15 3.9 2.33 6.53 Permafrost 12 4.15 2.53 6.8 9 4.03 1.88 8.62 10 3.9 2.38 6.41
Overall mean 33 3.39 2.22 5.18 19 3.65 1.91 6.98 25 3.81 2.53 5.73
CO2-C equivalent Ecosystem Tundra 11 1.68 0.9 3.12 6 2.58 1.0 6.64 8 1.68 0.79 3.6 Peatland 13 2.48 1.4 4.41 8 2.28 0.72 7.23 9 2.53 1.28 4.99 Boreal Forest 9 4.17 3.34 5.21 5 4.17 3.16 5.5 8 3.71 2.74 5.02
Soil Type Mineral 14 2.18 1.27 3.72 7 2.95 1.69 5.14 11 1.93 1.08 3.43 Organic 19 2.63 1.79 3.87 12 2.67 1.46 4.87 14 2.63 1.75 3.96
Permafrost Active layer 21 2.2 1.56 3.09 10 2.25 1.39 3.63 15 2.36 1.68 3.3 Permafrost 12 2.76 1.53 4.95 9 3.15 1.66 5.99 10 2.32 1.2 4.48
Overall mean 33 2.3 1.55 3.4 19 2.7 1.62 4.49 25 2.26 1.44 3.54
© 2016 Macmillan Publishers Limited. All rights reserved.

27
References: 1. Bracho, R. et al. Temperature sensitivity of organic matter decomposition of permafrost-region
soils during laboratory incubations. Soil Biol Biochem 97, 1-14, (2016).
2. Čapek, P. et al. The effect of warming on the vulnerability of subducted organic carbon in arctic soils. Soil Biol Biochem 90, 19-29, (2015).
3. Dai, X. Y., White, D. & Ping, C. L. Comparing bioavailability in five Arctic soils by pyrolysis-gas chromatography/mass spectrometry. Journal of Analytical and Applied Pyrolysis 62, 249-258, (2002).
4. De Baets, S. et al. Investigating the controls on soil organic matter decomposition in tussock tundra soil and permafrost after fire. Soil Biol. Biochem, (in revision).
5. Diáková, K. et al. Carbon loss from old permafrost-affected peat deposits under changing environmental conditions. FEMS Microbiology Ecology, (in revision).
6. Dutta, K., Schuur, E. A. G., Neff, J. C. & Zimov, S. A. Potential carbon release from permafrost soils of Northeastern Siberia. Glob. Change. Biol 12, 2336-2351, (2006).
7. Ernakovich, J., Lynch, L., Schimel, J. & Wallenstein, M. D. Soil chemistry and characteristics measured for incubation of microbial communities in permafrost UCAR/NCAR-CISL-ACADIS (2014) http://dx.doi.org/10.5065/D66M34S3
8. Hobbie, S. E., Miley, T. A. & Weiss, M. S. Carbon and nitrogen cycling in soils from acidic and nonacidic tundra with different glacial histories in Northern Alaska. Ecosystems 5, 761-774, (2002).
9. Iversen, C. M. et al. Active Layer Soil Carbon and Nutrient Mineralization, Barrow, Alaska, 2012. Oak Ridge National Laboratory, Oak Ridge, Tennessee, USA. Carbon Dioxide Information Analysis Center Next Generation Ecosystem Experiments Arctic Data Collection (2015) http://dx.doi.org/10.5440/1185213.
10. Kane, E. S. et al. Response of anaerobic carbon cycling to water table manipulation in an Alaskan rich fen. Soil Biol. Biochem 58, 50-60, (2013).
11. Knoblauch, C., Beer, C., Sosnin, A., Wagner, D. & Pfeiffer, E.-M. Predicting long-term carbon mineralization and trace gas production from thawing permafrost of Northeast Siberia. Glob. Change. Biol 19, 1160-1172, (2013).
12. Lee, H., Schuur, E. A. G., Inglett, K. S., Lavoie, M. & Chanton, J. P. The rate of permafrost carbon release under aerobic and anaerobic conditions and its potential effects on climate. Glob. Change. Biol 18, 515-527, (2012).
13. Lavoie, M., Mack, M. C. & Schuur, E. A. G. Effects of elevated nitrogen and temperature on carbon and nitrogen dynamics in Alaskan arctic and boreal soils. Journal of Geophysical Research-Biogeosciences 116, (2011).
14. Nadelhoffer, K. J., Giblin, A. E., Shaver, G. R. & Laundre, J. A. Effects of temperature and substrate quality on element mineralization in 6 arctic soils. Ecology 72, 242-253, (1991).
15. Neff, J. C. & Hooper, D. U. Vegetation and climate controls on potential CO2, DOC and DON production in northern latitude soils. Glob. Change. Biol 8, 872-884, (2002).
16. O'Donnell, J. A. et al. Interactive Effects of Fire, Soil Climate, and Moss on CO(2) Fluxes in Black Spruce Ecosystems of Interior Alaska. Ecosystems 12, 57-72, (2009).
© 2016 Macmillan Publishers Limited. All rights reserved.

28
17. Oelbermann, M., English, M. & Schiff, S. L. Evaluating carbon dynamics and microbial activity in arctic soils under warmer temperatures. Canadian Journal of Soil Science 88, 31-44, (2008).
18. Roy Chowdhury, T. et al. Stoichiometry and temperature sensitivity of methanogenesis and CO2 production from saturated polygonal tundra in Barrow, Alaska. Glob. Change. Biol 21, 722-737, (2015).
19. Shaver, G. R. et al. Carbon turnover in Alaskan tundra soils: effects of organic matter quality, temperature, moisture and fertilizer. J Ecol 94, 740-753, (2006).
20. Treat, C. C. et al. Temperature and peat type control CO2 and CH4 production in Alaskan permafrost peats. Glob. Change. Biol 20, 2674-2686, (2014).
21. Waldrop, M. P. et al. Molecular investigations into a globally important carbon pool: permafrost-protected carbon in Alaskan soils. Glob. Change. Biol 16, 2543-2554, (2010).
22. Wickland, K. P. & Neff, J. C. Decomposition of soil organic matter from boreal black spruce forest: environmental and chemical controls. Biogeochemistry 87, 29-47, (2008).
23. Myhre, G. et al. Anthropogenic and Natural Radiative Forcing. In: Climate Change 2013: The Physical Science Basis. Contributions of Working Group I to the Fifth Assessment Report of the Intergovernmental Panel on Climate Change. 659-740 (Cambridge University Press, Cambridge, United Kingdom and New York, NY, USA, 2013).
© 2016 Macmillan Publishers Limited. All rights reserved.


![CORPORATE FINANCE Core Principles and Applications 1/e · 2014-11-13 · Ch 3 International Financial Markets. Ch 4 Exchange Rate Determination [e] Ch 5 Currency Derivatives PART](https://static.fdocument.pub/doc/165x107/5e6ec6a87b725c55d868f05f/corporate-finance-core-principles-and-applications-1e-2014-11-13-ch-3-international.jpg)