Population Pyramids. Population Pyramids = Typical pyramid shape during the 1800’s. What does this...
27
Population Pyramids
-
Upload
dominic-blake -
Category
Documents
-
view
221 -
download
0
Transcript of Population Pyramids. Population Pyramids = Typical pyramid shape during the 1800’s. What does this...
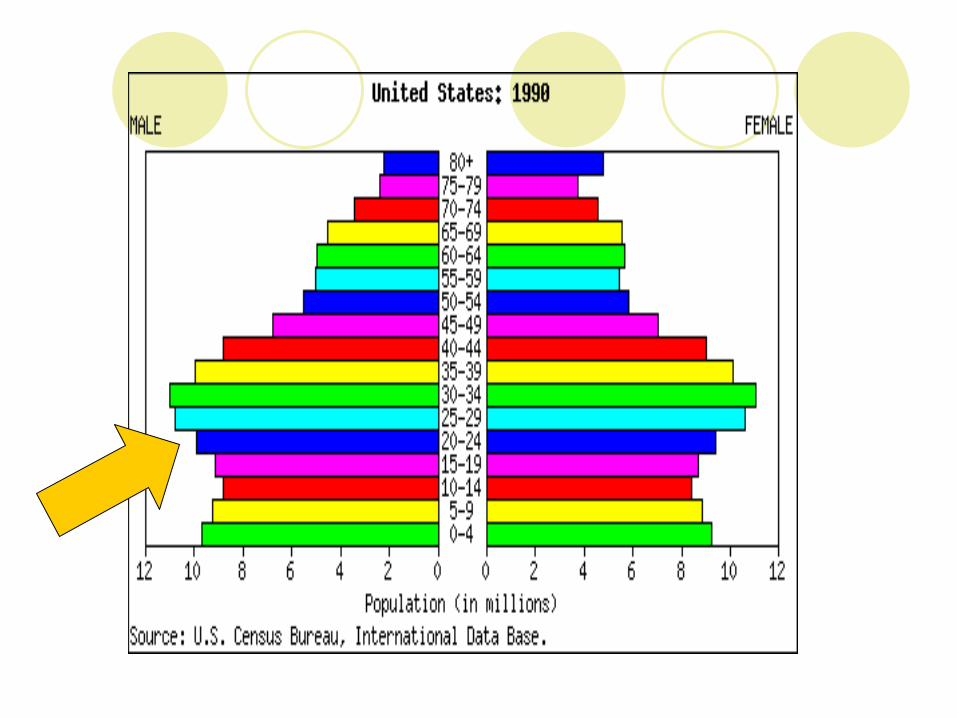
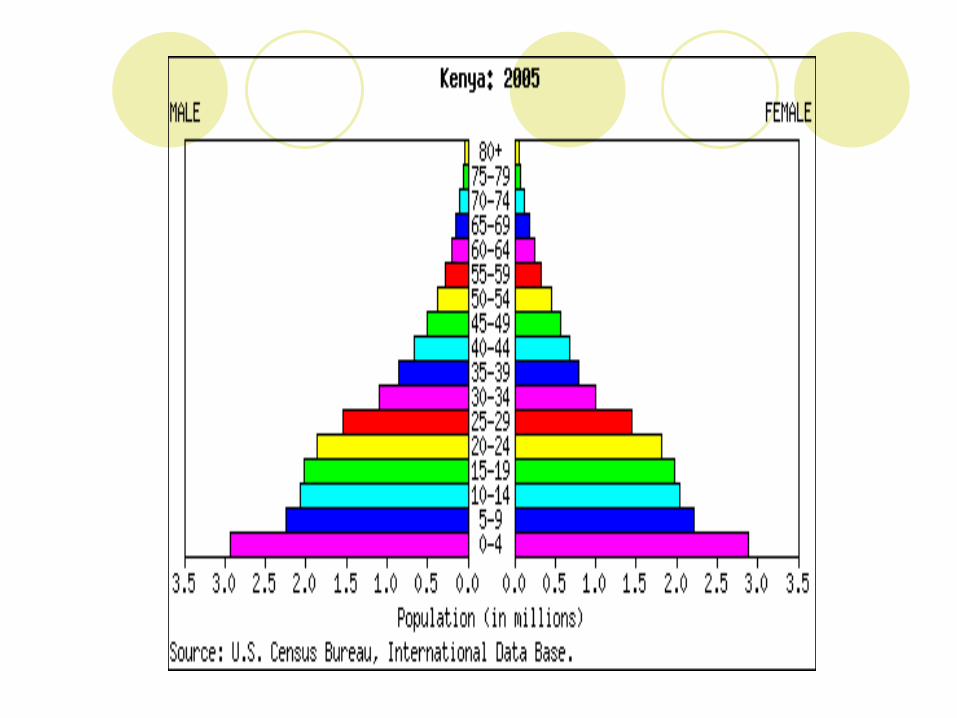
Population Pyramids
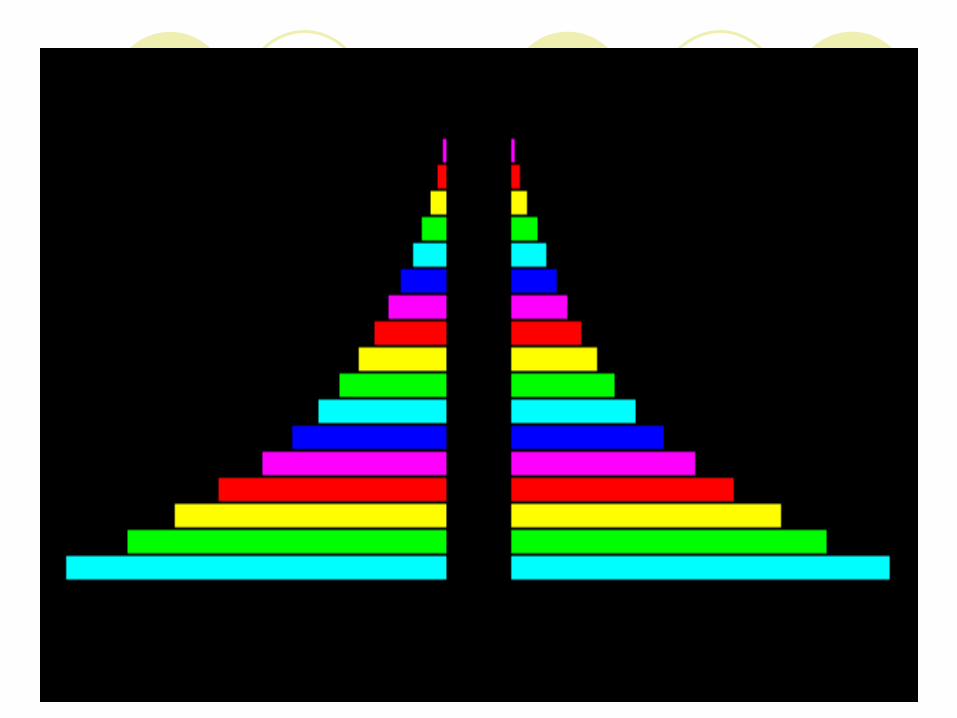
Population Pyramids =
Typical pyramid shape during the 1800’s. What does this mean????
Population Pyramids
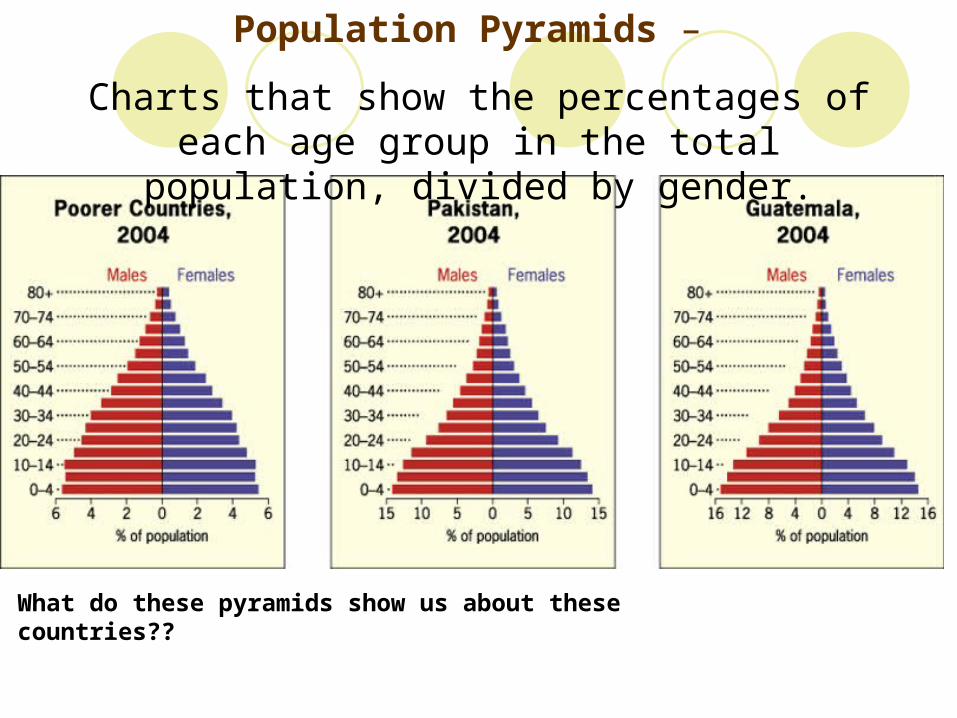
Population Pyramids –
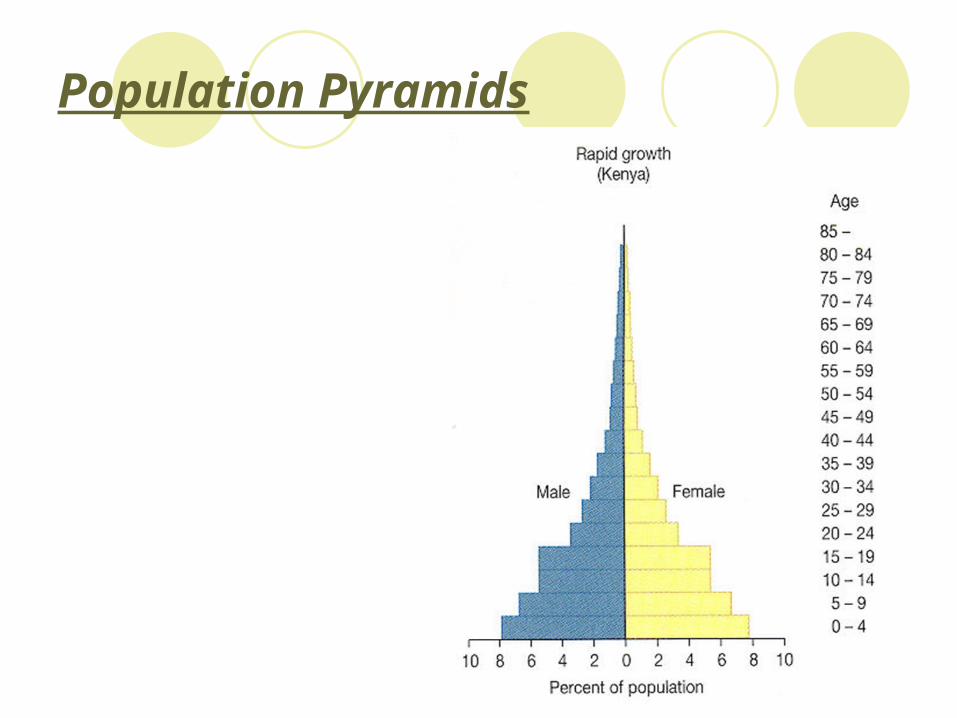
Charts that show the percentages of each age group in the total population, divided by gender.
What do these pyramids show us about these countries??
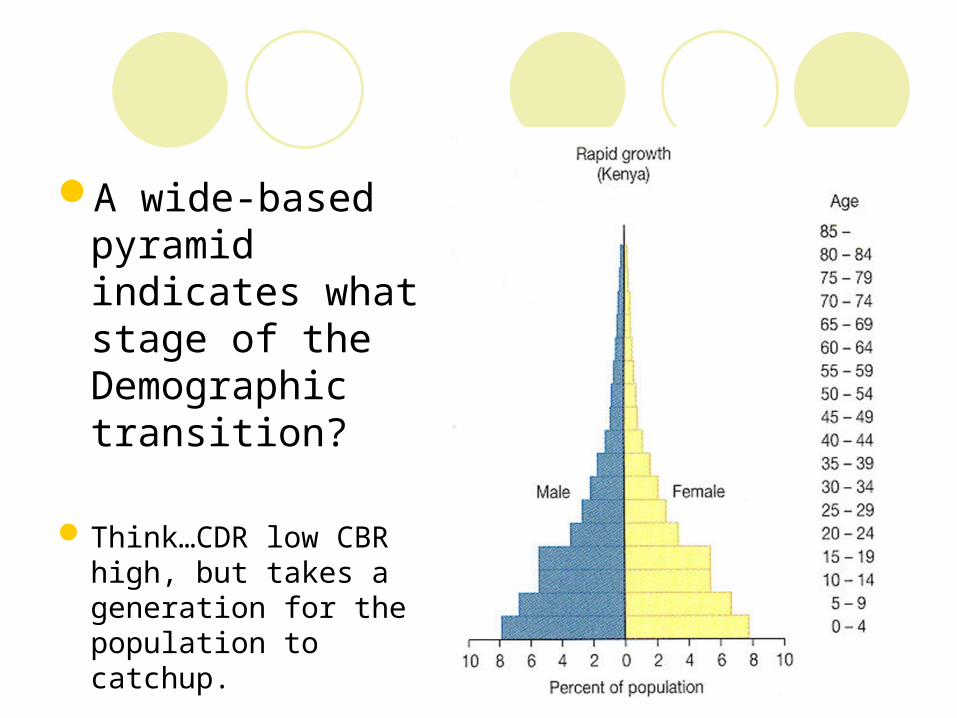
A wide-based pyramid indicates what stage of the Demographic transition?
Think…CDR low CBR high, but takes a generation for the population to catchup.
Population Pyramids
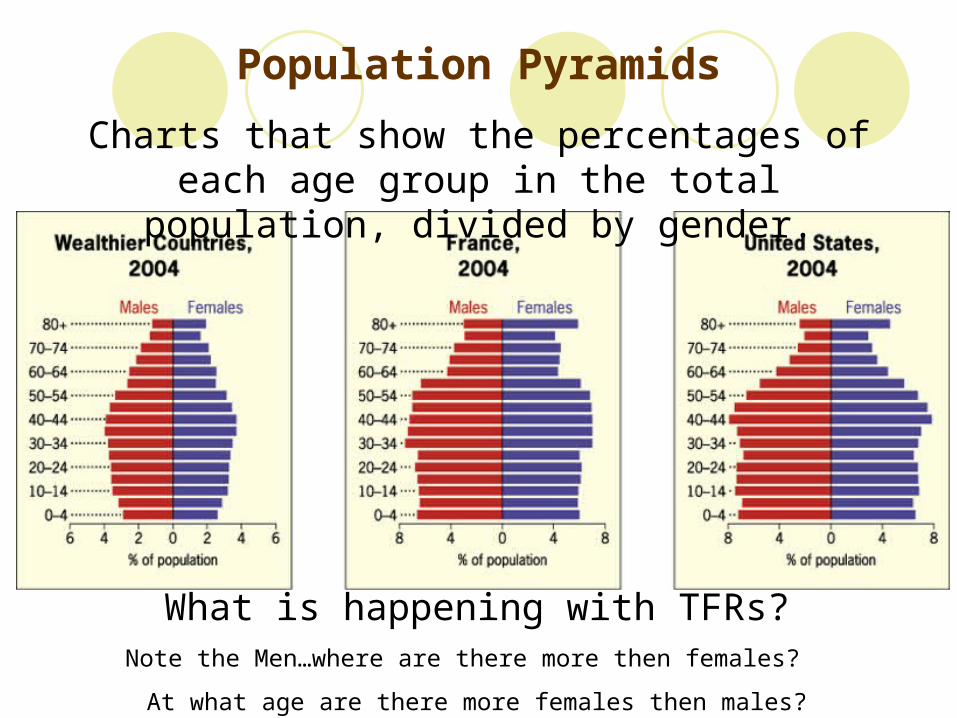
Charts that show the percentages of each age group in the total population, divided by gender.
What is happening with TFRs?Note the Men…where are there more then females?
At what age are there more females then males?
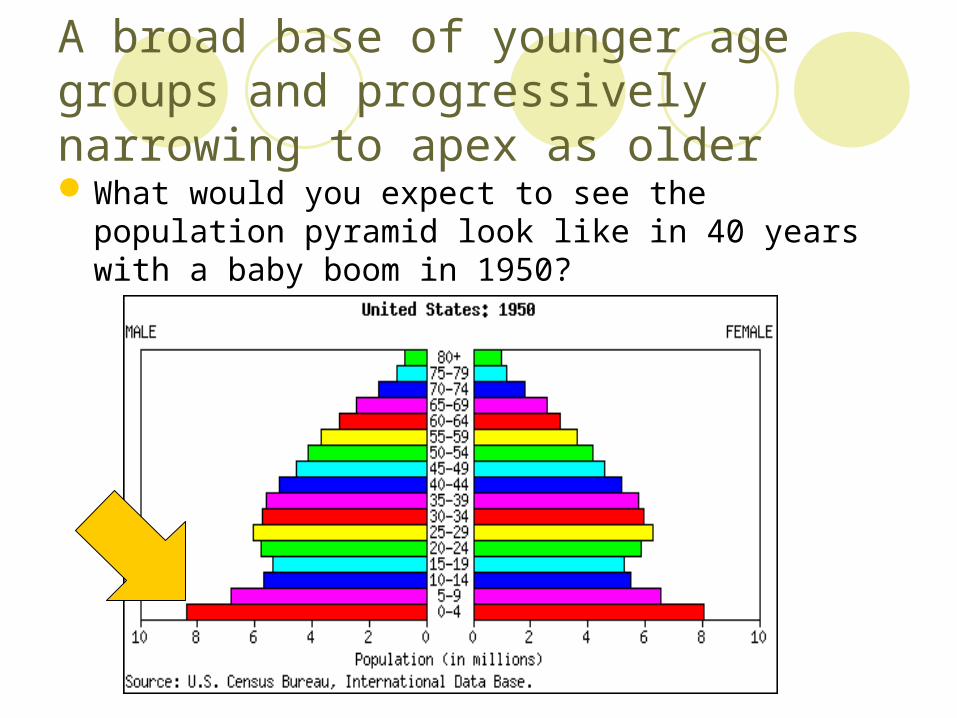
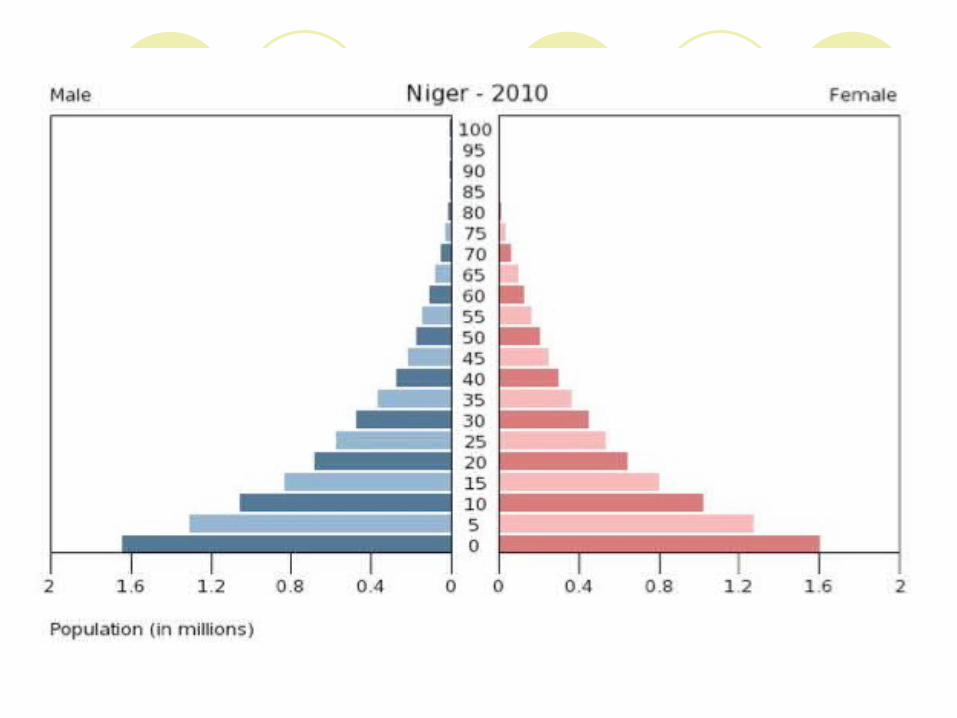
A broad base of younger age groups and progressively narrowing to apex as older
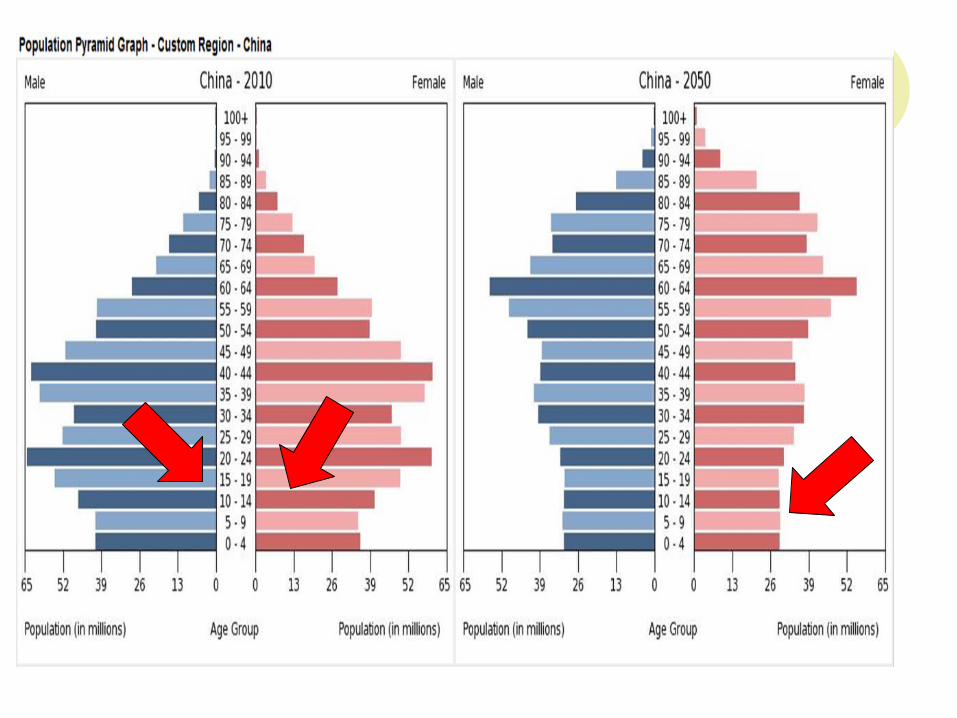
What would you expect to see the population pyramid look like in 40 years with a baby boom in 1950?
An old typical version of a pyramid it was obvious that Populations were thinned by death. However…
Now there are many different shapes.
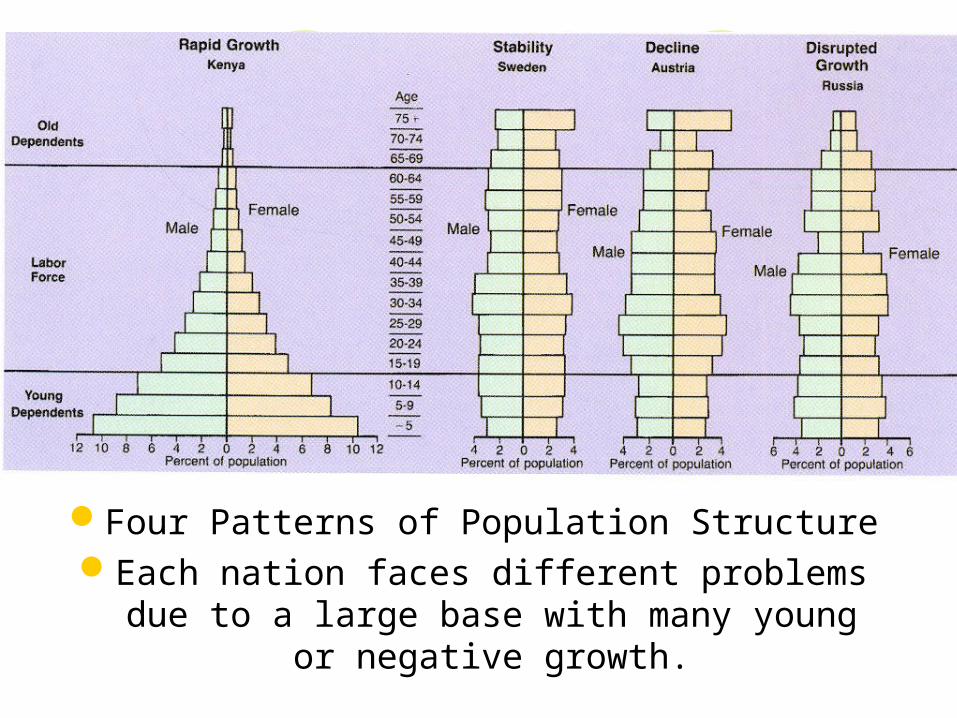
Four Patterns of Population StructureEach nation faces different problems due to a
large base with many young or negative growth.
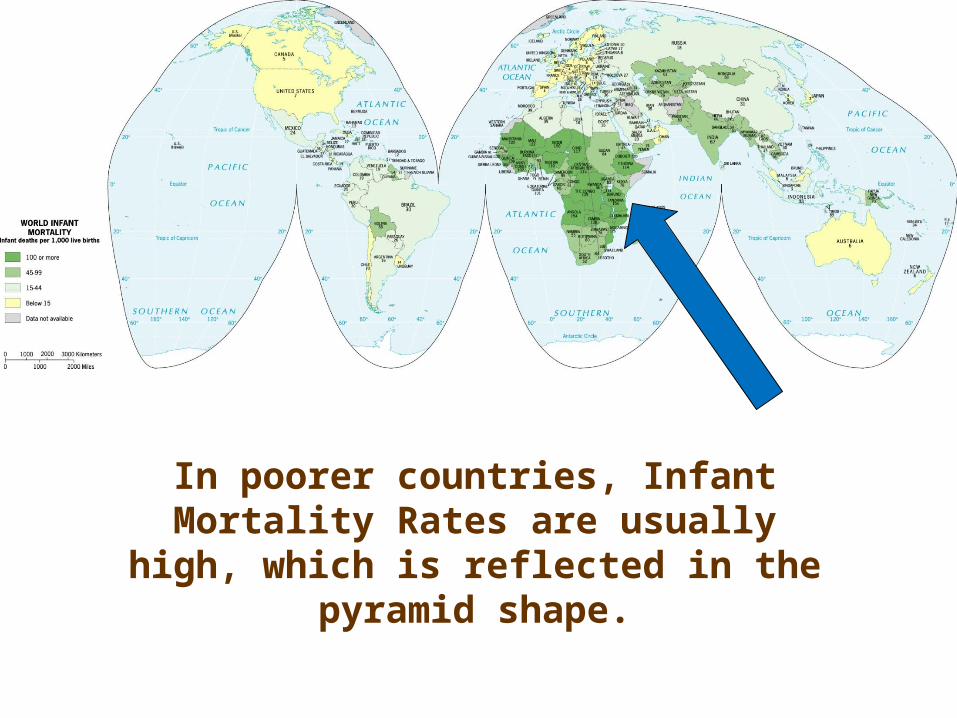
In poorer countries, Infant Mortality Rates are usually high, which is reflected in the
pyramid shape.
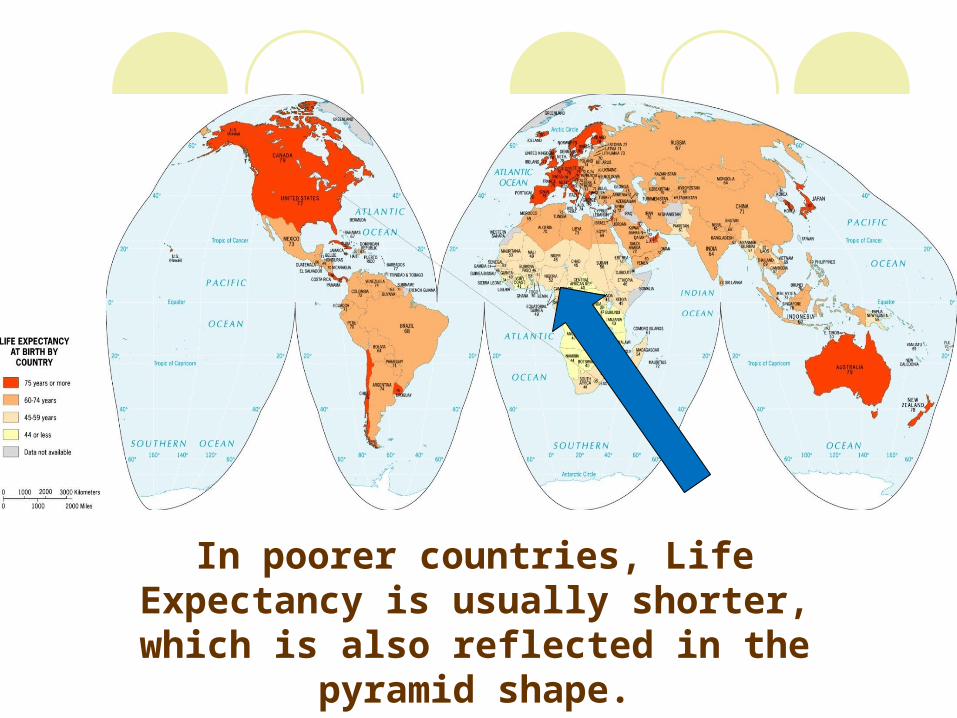
In poorer countries, Life Expectancy is usually shorter, which is also reflected in the
pyramid shape.
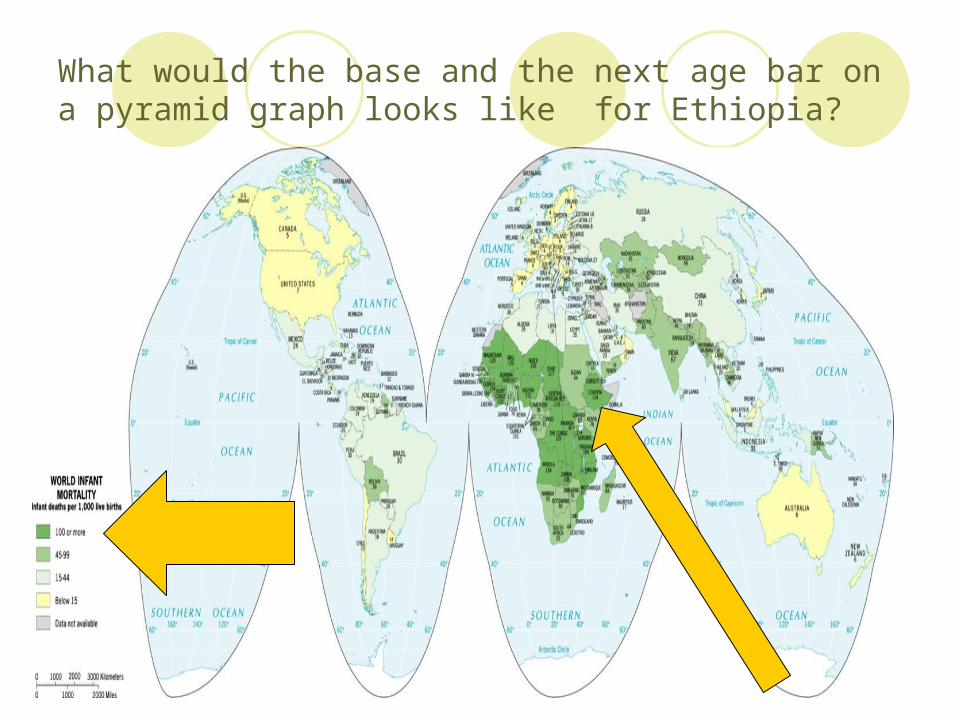
What would the base and the next age bar on a pyramid graph looks like for Ethiopia?
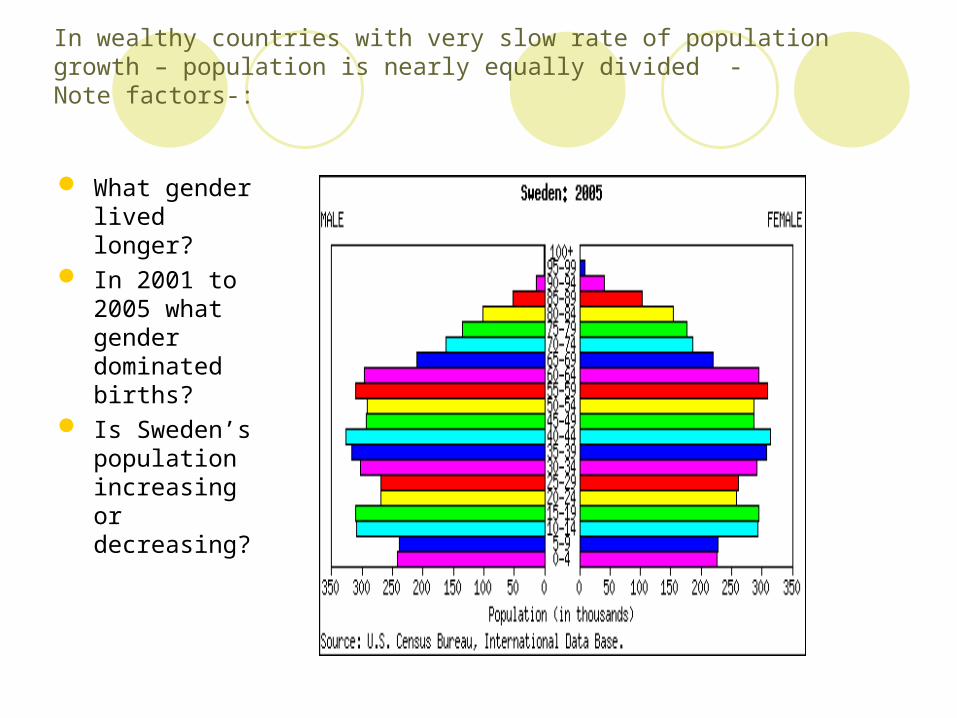
In wealthy countries with very slow rate of population growth – population is nearly equally divided - Note factors-:
What gender lived longer?
In 2001 to 2005 what gender dominated births?
Is Sweden’s population increasing or decreasing?

What can we tell from a country’s pyramid?
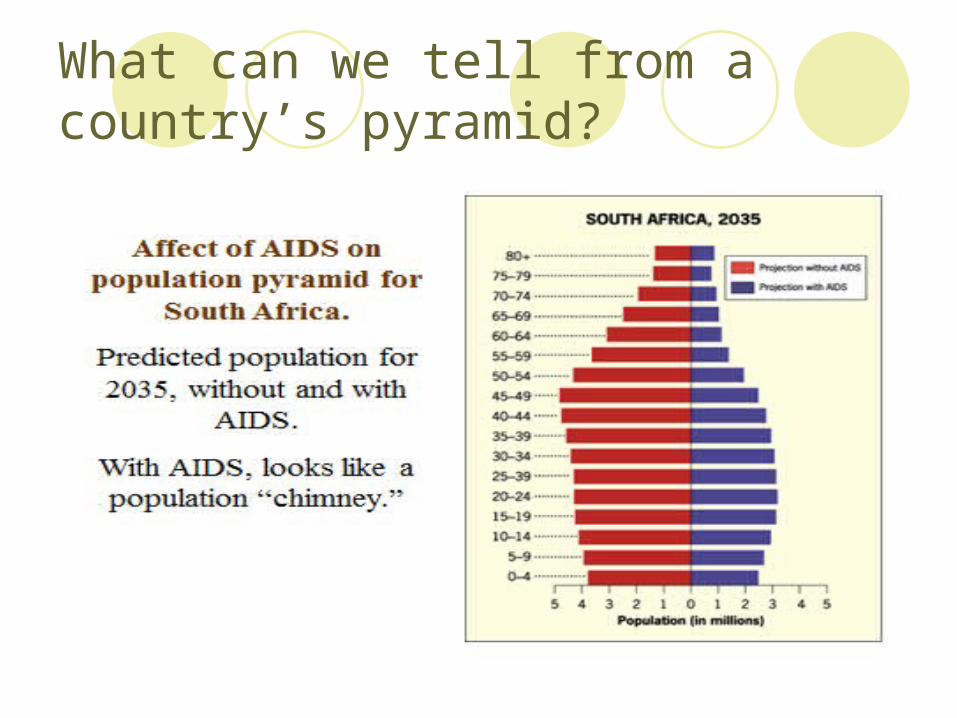
What can we tell from a country’s pyramid?
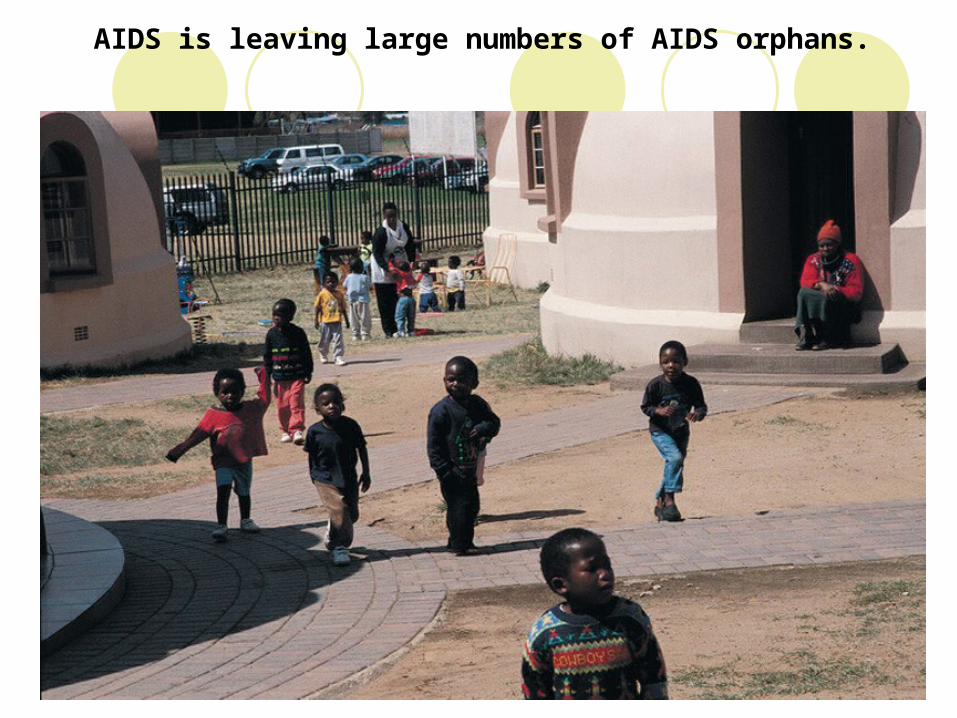
AIDS is leaving large numbers of AIDS orphans.
Dependency Ratio = measure of # of dependents – old and young that each 100 people in productive years (15 – 64)
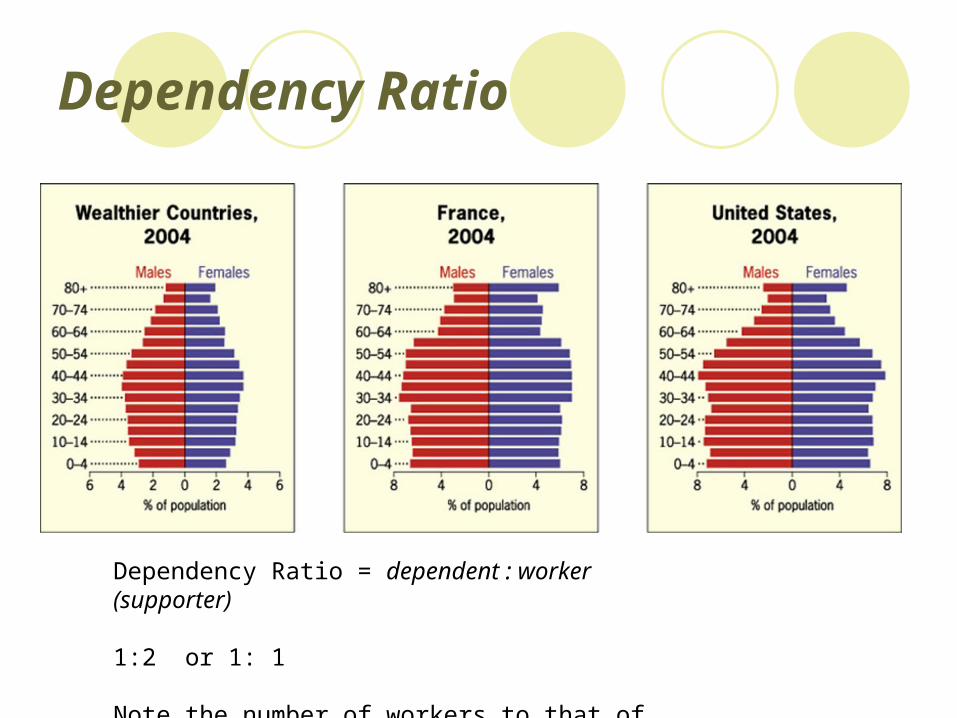
Dependency Ratio
Dependency Ratio = dependent : worker (supporter)
1:2 or 1: 1
Note the number of workers to that of dependents
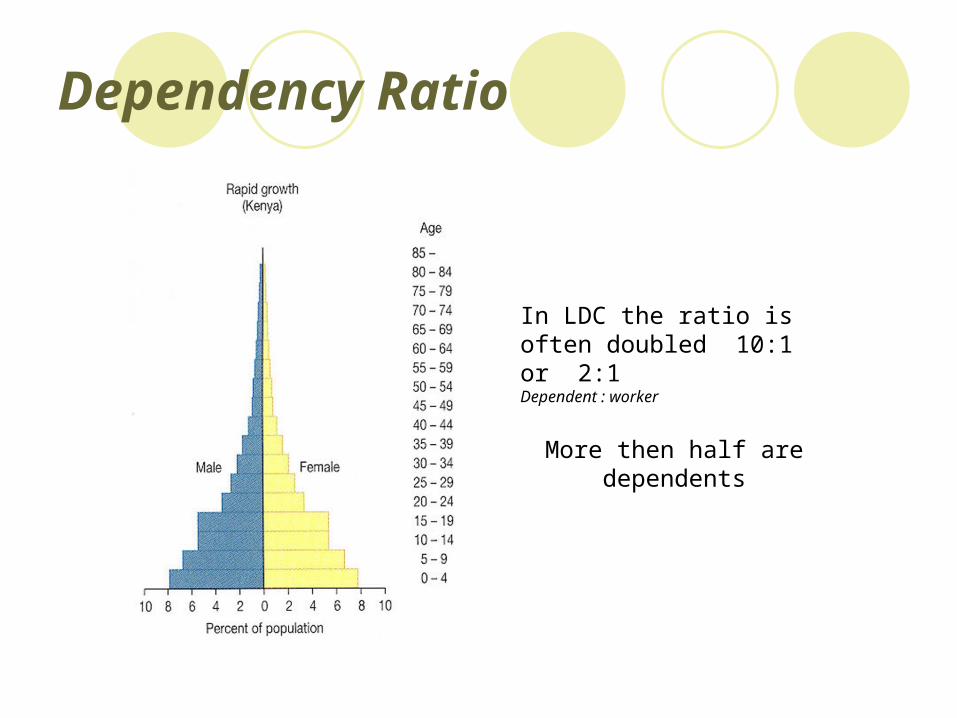
Dependency Ratio
In LDC the ratio is often doubled 10:1 or 2:1 Dependent : worker
More then half are dependents
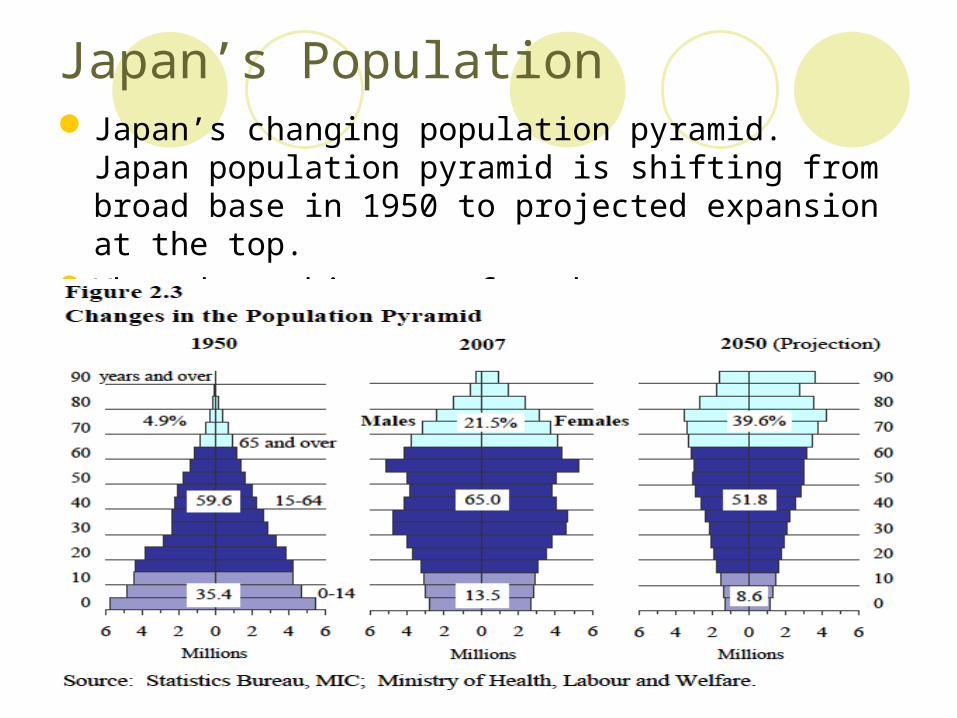
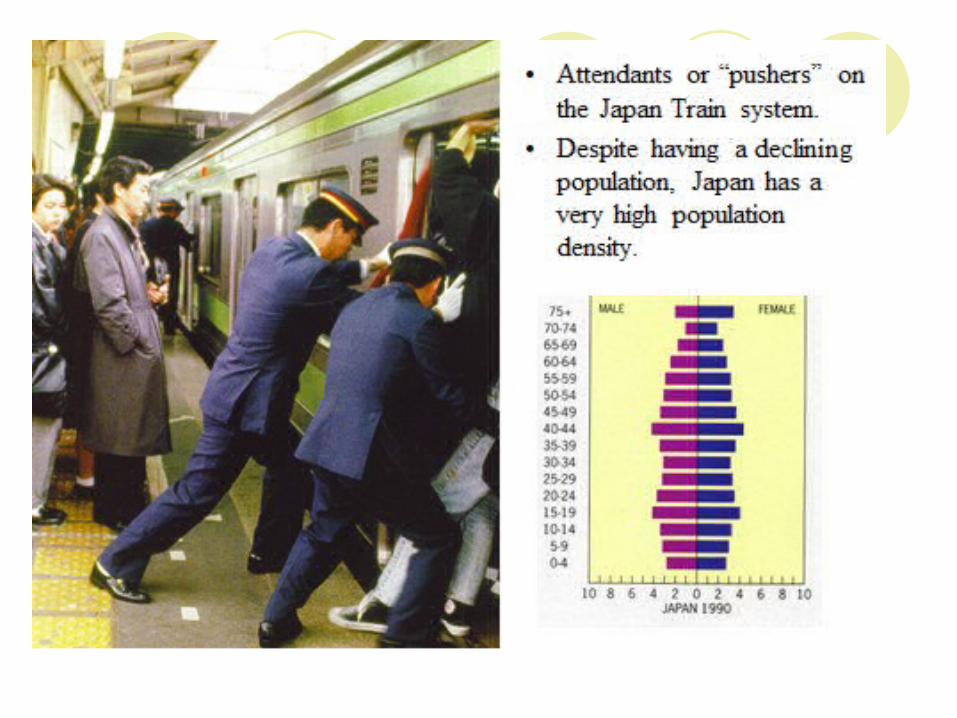
Japan’s PopulationJapan’s changing population pyramid. Japan population
pyramid is shifting from broad base in 1950 to projected expansion at the top.
What does this mean for the younger generation?