population growth
23
In the name of god Population growth form J-shaped growth curve S-shaped growth curve Population Pyramids Navab ahmadi
Transcript of population growth

In the name of god
Population growth form
J-shaped growth curve
S-shaped growth curve
Population PyramidsNavab
ahmadi


“the power of
population
growth is greater
than the power
of Earth to
produce
subsistence.”
Thomas Malthus an English economist and
(demographer (population expert
Report
of
Jam
aic
a O
lazo


Rank Megacity Country Population
1 Tokyo Japan 34,800,000
2 Guangzhou China 31,700,000
3 Shanghai China 28,900,000
4 Jakarta Indonesia 26,400,000
5 Seoul South Korea 25,800,000
6 Delhi (India) India 24,000,000
7 Mexico City Mexico 23,800,000
8 Karach Pakistan 23,500,000
9 Manila Philippines 22,200,000
10 New York City United States 21,600,000
11 São Paulo Brazil 21,600,000
12 Mumbai India 21,400,000
13 Beijing China 19,300,000
14 Los Angeles United States 17,200,000
15 Osaka Japan 16,800,000
16 Dhaka Bangladesh 16,300,000
17 Cairo Egypt 16,100,000
18 Kolkata India 16,000,000
19 LondonUnited
Kingdom15,500,000
20 Buenos Aires Argentina 14,500,000
21 Bangkok Thailand 14,500,000
22 Istanbul Turkey 14 160 467
23 Lagos Nigeria 13,200,000
24 Tehran Iran 13,200,000

DIAGRAMMATIC REPRESENTATION OF GLOBAL POPULATION

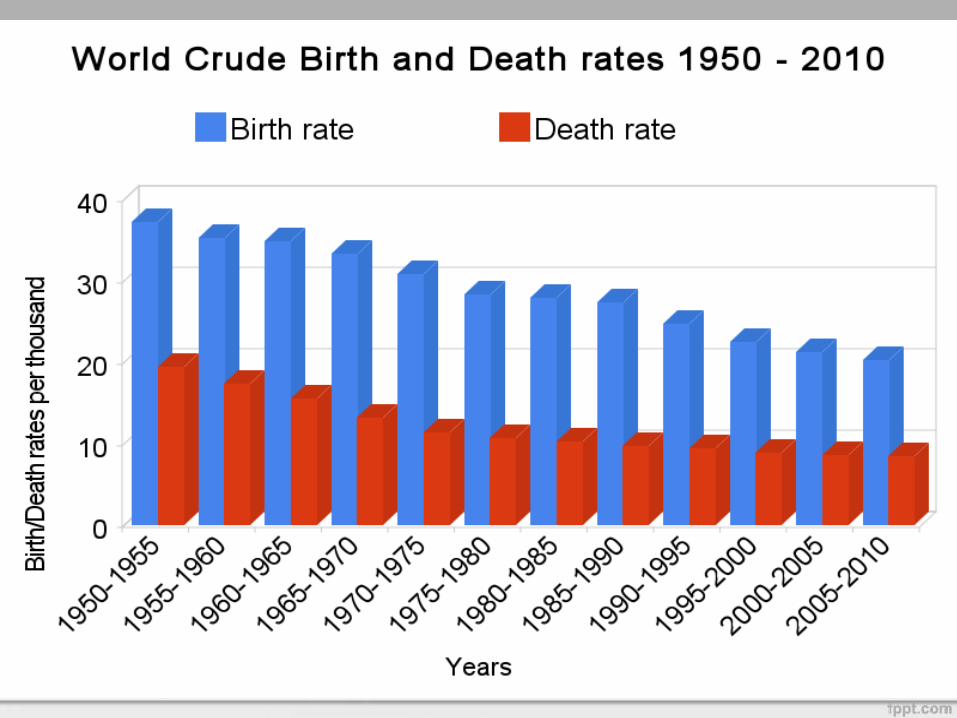
Human population growth rate has been
growing more than exponentially.


What is Population Pyramid?
A population pyramid, also called an age structure
diagram, is a graphical illustration that shows the
distribution of various age groups in a population
which forms the shape of a pyramid when the
population is growing.
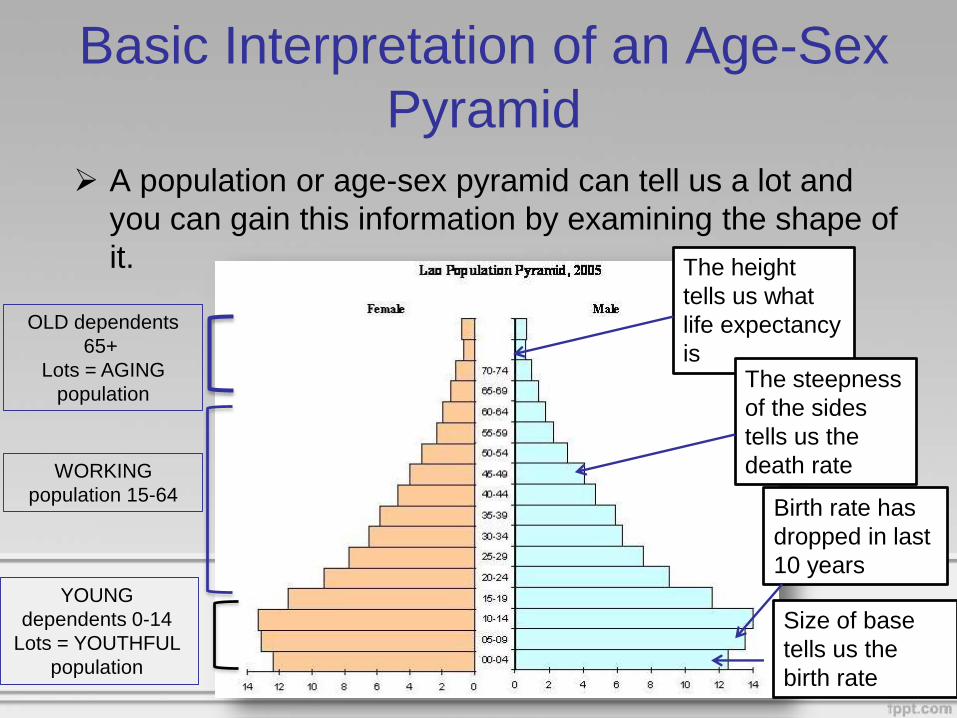
Basic Interpretation of an Age-Sex
Pyramid
A population or age-sex pyramid can tell us a lot and
you can gain this information by examining the shape of
it. The height
tells us what
life expectancy
isThe steepness
of the sides
tells us the
death rate
Birth rate has
dropped in last
10 years
Size of base
tells us the
birth rate
YOUNG
dependents 0-14
Lots = YOUTHFUL
population
WORKING
population 15-64
OLD dependents
65+
Lots = AGING
population
Population Pyramids →
Graphic device: bar graph
Shows the age and gender composition of
a region
Horizontal axis: gender
–male: left-hand female: right-hand
–absolute number of people or %
Vertical axis: age
5-year or 10-year age groups

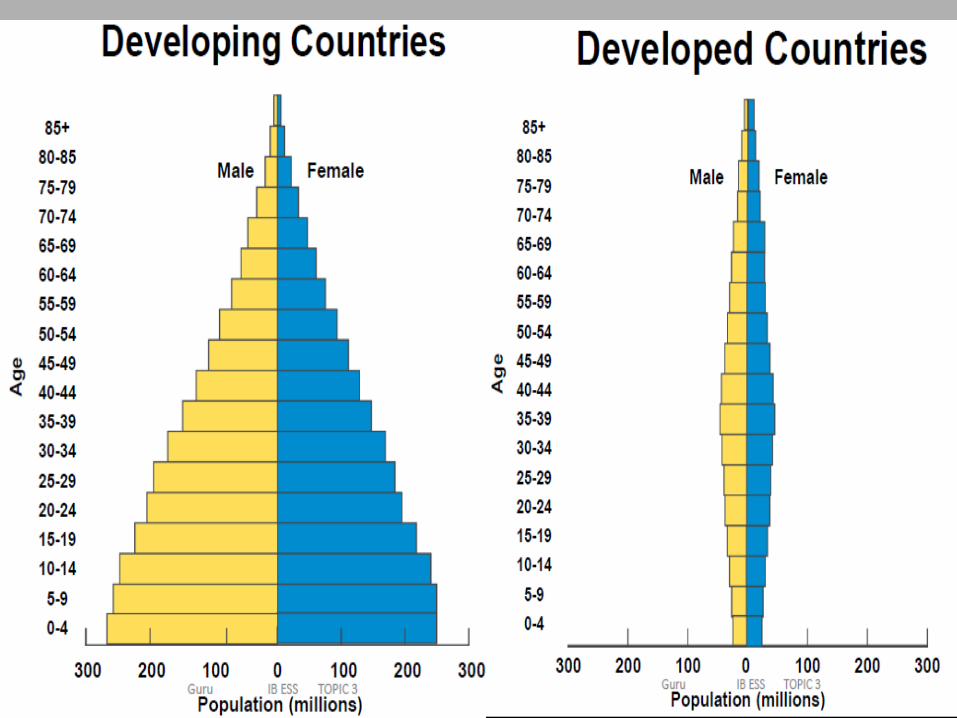
Age Structure
Countries that have high rates of growth
usually have more young people than
older people.
In contrast, countries that have slow
growth or no growth usually have an even
distribution of ages in the population.
Age structure can be graphed in a
population pyramid, a type of double sided
bar graph.

Age-Structure Diagrams

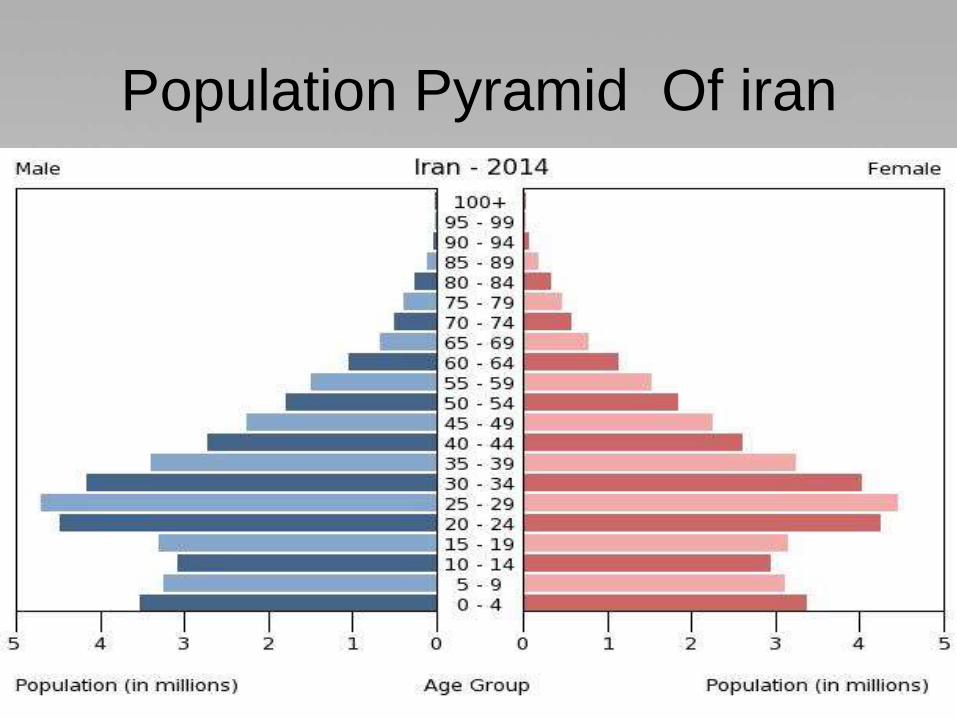
Of iranPopulation Pyramid

Two types of population curve
S Population Curve
J Population Curve

J Population Curve
J-Shape curve is also known as-
Exponential curve occurs when there is no
limit to population size.

What is J shaped?
A curve on a graph that records the situation in
which, in a new environment, the population
density of an organism increases rapidly but
then stops abruptly as environmental resistance

S Population Curve
S-Shape curve is also known as - Logistic
curve shows the effect of a limiting factor

What is S-Shaped Curve?
In S - shaped or sigmoid growth the population
show an initial gradual increase in population
size in an ecosystem, followed by an exponential
increase and then a gradual decline to near
constant level.

Navab ahmadi