POLITICS
6
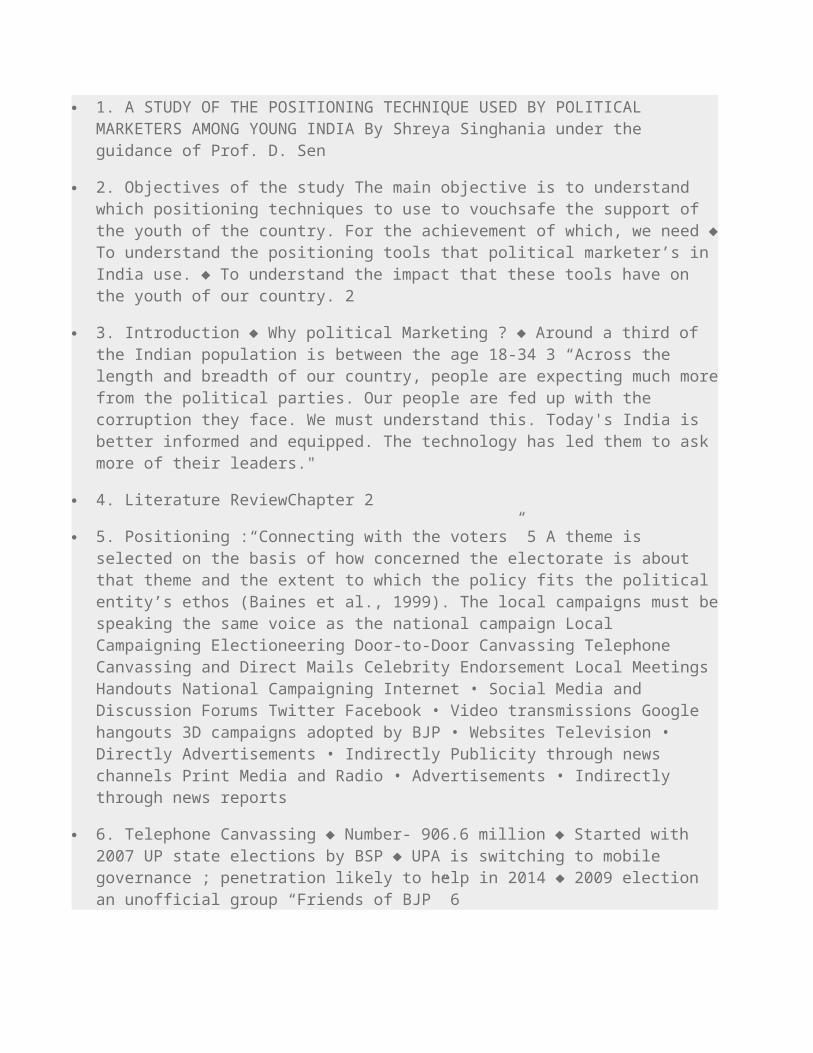
1. A STUDY OF THE POSITIONING TECHNIQUE USED BY POLITICAL MARKETERS AMONG YOUNG INDIA By Shreya Singhania under the guidance of Prof. D. Sen 2. Objectives of the study The main objective is to understand which positioning techniques to use to vouchsafe the support of the youth of the country. For the achievement of which, we need To understand the positioning tools that political marketer’s in India use. To understand the impact that these tools have on the youth of our country. 2 3. Introduction Why political Marketing ? Around a third of the Indian population is between the age 18-34 3 “Across the length and breadth of our country, people are expecting much more from the political parties. Our people are fed up with the corruption they face. We must understand this. Today's India is better informed and equipped. The technology has led them to ask more of their leaders." 4. Literature ReviewChapter 2 5. Positioning :“Connecting with the voters” 5 A theme is selected on the basis of how concerned the electorate is about that theme and the extent to which the policy fits the political entity’s ethos (Baines et al., 1999). The local campaigns must be speaking the same voice as the national campaign Local Campaigning Electioneering Door-to-Door Canvassing Telephone Canvassing and Direct Mails Celebrity Endorsement Local Meetings Handouts National Campaigning Internet • Social Media and Discussion Forums Twitter Facebook • Video transmissions Google hangouts 3D campaigns adopted by BJP • Websites Television • Directly Advertisements • Indirectly Publicity through news channels Print Media and Radio • Advertisements • Indirectly through news reports 6. Telephone Canvassing Number- 906.6 million Started with 2007 UP state elections by BSP UPA is switching to mobile governance ; penetration likely to help in 2014 2009 election an unofficial group “Friends of BJP” 6
-
Upload
blodin-zylfiu -
Category
Documents
-
view
13 -
download
0
description
POLITICS
Transcript of POLITICS
1. A STUDY OF THE POSITIONING TECHNIQUE USED BY POLITICAL MARKETERS AMONG YOUNG INDIA By Shreya Singhania under the guidance of Prof. D. Sen
2. Objectives of the study The main objective is to understand which positioning techniques to use to vouchsafe the support of the youth of the country. For the achievement of which, we need To understand the positioning tools that political marketer’s in India use. To understand the impact that these tools have on the youth of our country. 2
3. Introduction Why political Marketing ? Around a third of the Indian population is between the age 18-34 3 “Across the length and breadth of our country, people are expecting much more from the political parties. Our people are fed up with the corruption they face. We must understand this. Today's India is better informed and equipped. The technology has led them to ask more of their leaders."
4. Literature ReviewChapter 2
5. Positioning :“Connecting with the voters” 5 A theme is selected on the basis of how concerned the electorate is about that theme and the extent to which the policy fits the political entity’s ethos (Baines et al., 1999). The local campaigns must be speaking the same voice as the national campaign Local Campaigning Electioneering Door-to-Door Canvassing Telephone Canvassing and Direct Mails Celebrity Endorsement Local Meetings Handouts National Campaigning Internet • Social Media and Discussion Forums Twitter Facebook • Video transmissions Google hangouts 3D campaigns adopted by BJP • Websites Television • Directly Advertisements • Indirectly Publicity through news channels Print Media and Radio • Advertisements • Indirectly through news reports
6. Telephone Canvassing Number- 906.6 million Started with 2007 UP state elections by BSP UPA is switching to mobile governance ; penetration likely to help in 2014 2009 election an unofficial group “Friends of BJP” 6
7. 82% penetration of social media in college going students and 84% in young men. BJP seems to be very active in this method of campaigning. Though both have established themselves in networking sites. Social Media7 1,454* 379 280 271 248 178 159 96 74 Narendra ModiManmohan SinghMamta BanerjeeArvind KejriwalRahul GandhiPriyanka GandhiSukhbir Singh BadalAkhilesh YadavNitish Kumar Thousands Top 10 Indian Polical Leaders according to Number of followers on Official Facebook Page *as on 31st April,2013
8. Video Transmissions 8 Google+ Hangouts are places used to facilitate group video chat (with a maximum of 10 people participating in a single Hangout at any point in time). Narendra Modi’s generated over 82,000 online views while P. Chidambaram's generated over 38,200 online views . Other than that the 5-Year Planning Commission and Roads Minister, C.P. Joshi has also used this medium. 3D holographic projection campaigns are being used by the BJP, using this they can rally in many places at a time. The cost involved, was Rs. 5 crore for each projection
9. Advertisements 9 Congress in 2009 : ““Aam aadmi ke badhte kadam, Har kadam par Bharat buland”, “Jai Ho” (the famous song by AR Rahman). Whereas BJP: “Bhay Ho” & “Dishaheen”, “mazboot neta, nirnayak sarkar — strong leader, decisive government” Congress
in Gujrat 2012 : disha badlo, dasha badlo; “Damb” and “Ahankar” in Gujarat, unemployed youths questioning “Vibrant Gujrat” BJP in Gujarat 2012 : “Ekmat Gujarat, Bane BhaJap Sarkar”; sound of a “slap”; Kabbadi ad. TV spots are around 60-65 for 30sec-60sec. Congress has 12 to 15 ads per day on radio as for BJP it is 15 to 18 ads per day. Misrepresentation by Political Advertisements.
10. Objective : To understand the impact of the aforementioned techniques on youth (ages 17-35) No of valid Responses received: 46 Medium: Google Docs SurveyChapter 3
11. 11
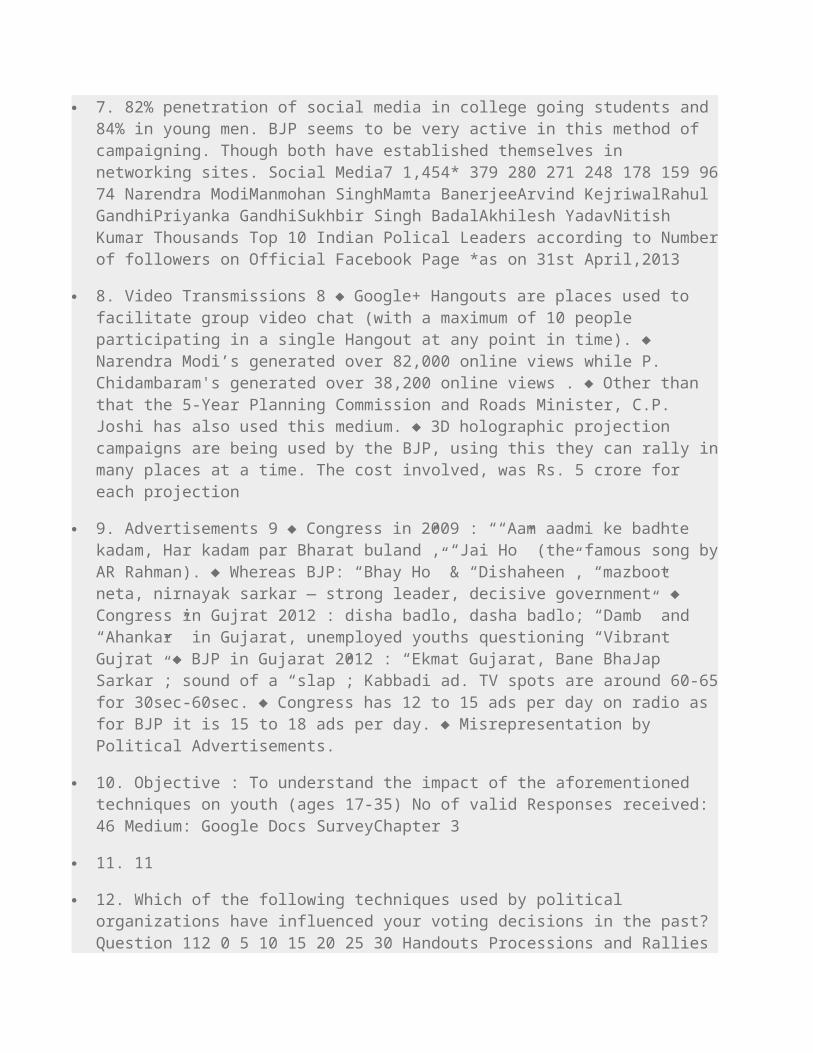
12. Which of the following techniques used by political organizations have influenced your voting decisions in the past? Question 112 0 5 10 15 20 25 30 Handouts Processions and Rallies Loudspeakers being used to… Banners/ Flags/ Bills/ Paintings… Receiving texts supporting a… Receiving emails or letters Receiving invitations to a party…
13. A hypothetical test shows that the level of influence on each technique was same for men and women. 13 Test statistic (t) is equal to ~ N (0, 1) Name of the technique Value of test statistic (t) for each technique Φ(x) Handouts 0.2727 0.2308 0.29878 0.61791 Processions and Rallies 0.4242 0.3846 0.24746 0.59871 Loudspeakers 0.4545 0.2308 1.537492 0.93822 Banners/ Flags/ Bills etc 0.6061 0.5385 0.41643 0.66276 SMS 0.3939 0.3077 0.56088 0.71226 Emails and Post 0.606 0.769 -1.127499 0.10204 Party Meets 0.909 0.769 1.100923 0.84134 Therefore for a significance level of less than 20%, there is insufficient evidence to reject H0. Hence we accept the hypothesis that influence on females and males is the same for each technique.
14. The above data shows the percentage of women respondents ranking each technique Question 214 Handouts Processions/ Rallies Loudspeake rs Banners/ Flags/ Bills/ Paintings of party symbols on walls SMS Emails/ Post Letters Party meet invitations/ advertiseme nts in other meetings Rank 1 6.1 9.1 12.1 21.2 6.1 9.1 3.0 Rank 2 12.1 15.2 3.0 9.1 12.1 3.0 0.0 Rank 3 6.1 36.4 6.1 12.1 0.0 0.0 6.1 Rank 4 15.2 9.1 12.1 9.1 3.0 9.1 6.1 Rank 5 6.1 6.1 3.0 0.0 18.2 6.1 9.1 Rank 6 3.0 9.1 15.2 3.0 3.0 6.1 9.1 Rank 7 0.0 12.1 0.0 6.1 9.1 0.0 9.1
15. The above data shows the percentage of men respondents ranking each technique 15 Handouts Processions/ Rallies Loudspeakers Banners/ Flags/ Bills/ Paintings of party symbols on walls SMS Emails/ Post Letters Party meet invitations/ advertisements in other meetings Rank 1 15.4 7.7 0.0 15.4 0.0 15.4 0.0 Rank 2 7.7 7.7 7.7 7.7 7.7 15.4 15.4 Rank 3 0.0 23.1 0.0 15.4 7.7 7.7 0.0 Rank 4 7.7 0.0 7.7 0.0 15.4 0.0 7.7 Rank 5 0.0 0.0 0.0 23.1 0.0 0.0 15.4 Rank 6 0.0 23.1 0.0 0.0 15.4 0.0 0.0 Rank 7 30.8 0.0 30.8 0.0 0.0 7.7 0.0
16. 16
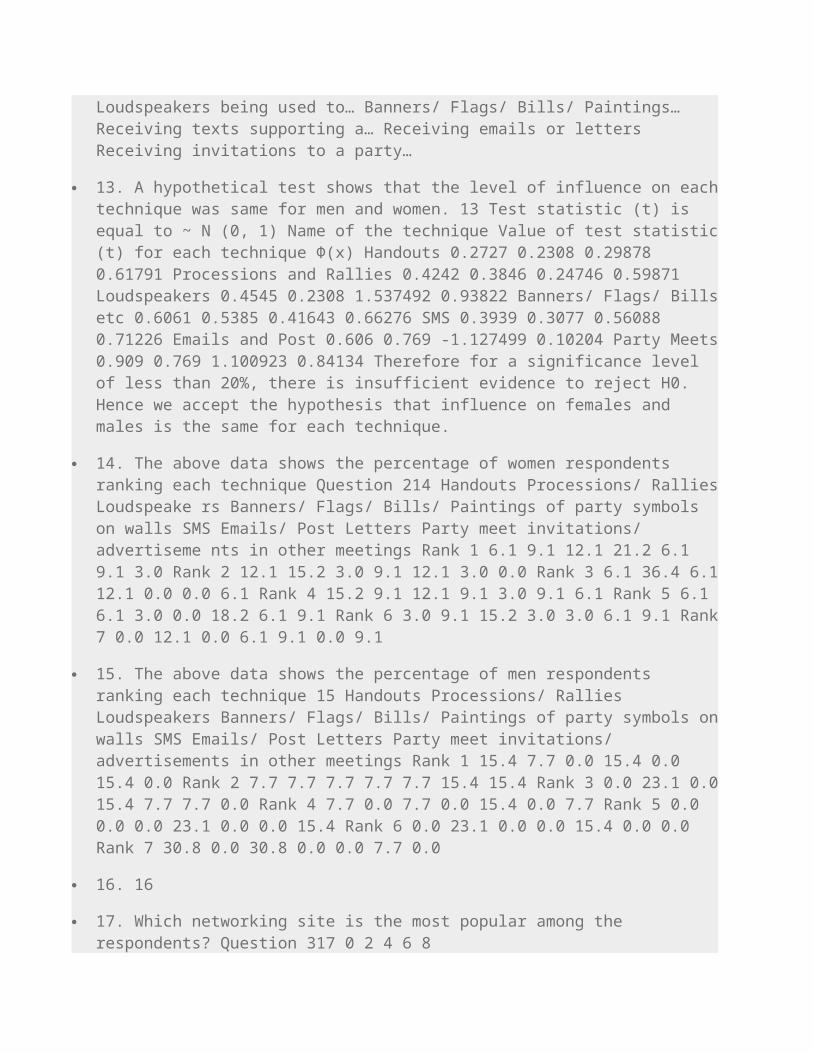
17. Which networking site is the most popular among the respondents? Question 317 0 2 4 6 8 10121416182022242628303234363840424446 Facebook Twitter Google Plus Youtube Linkedin Total Females Males
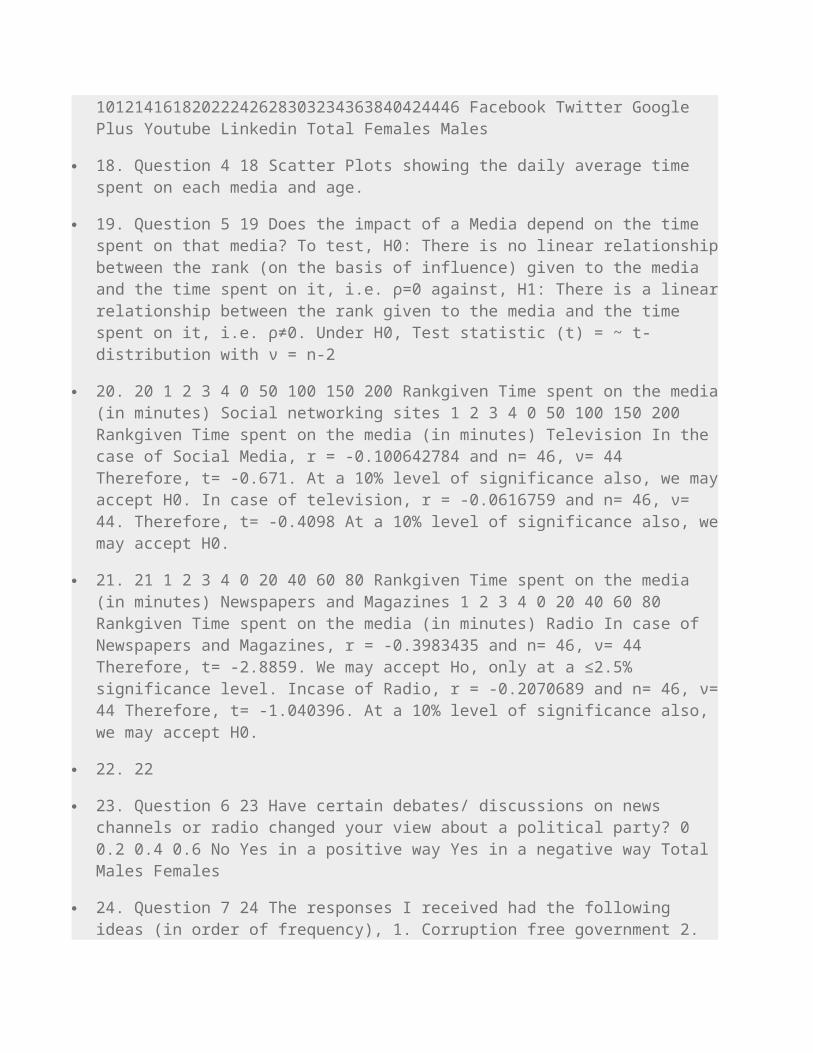
18. Question 4 18 Scatter Plots showing the daily average time spent on each media and age.
19. Question 5 19 Does the impact of a Media depend on the time spent on that media? To test, H0: There is no linear relationship between the rank (on the basis of influence) given to the media and the time spent on it, i.e. ρ=0 against, H1: There is a linear relationship between the rank given to the media and the time spent on it, i.e. ρ≠0. Under H0, Test statistic (t) = ~ t-distribution with ν = n-2
20. 20 1 2 3 4 0 50 100 150 200 Rankgiven Time spent on the media (in minutes) Social networking sites 1 2 3 4 0 50 100 150 200 Rankgiven Time spent on the media (in minutes) Television In the case of Social Media, r = -0.100642784 and n= 46, ν= 44 Therefore, t= -0.671. At a 10% level of significance also, we may accept H0. In case of television, r = -0.0616759 and n= 46, ν= 44. Therefore, t= -0.4098 At a 10% level of significance also, we may accept H0.
21. 21 1 2 3 4 0 20 40 60 80 Rankgiven Time spent on the media (in minutes) Newspapers and Magazines 1 2 3 4 0 20 40 60 80 Rankgiven Time spent on the media (in minutes) Radio In case of Newspapers and Magazines, r = -0.3983435 and n= 46, ν= 44 Therefore, t= -2.8859. We may accept Ho, only at a ≤2.5% significance level. Incase of Radio, r = -0.2070689 and n= 46, ν= 44 Therefore, t= -1.040396. At a 10% level of significance also, we may accept H0.
22. 22
23. Question 6 23 Have certain debates/ discussions on news channels or radio changed your view about a political party? 0 0.2 0.4 0.6 No Yes in a positive way Yes in a negative way Total Males Females
24. Question 7 24 The responses I received had the following ideas (in order of frequency), 1. Corruption free government 2. Development and Betterment of the nation 3. How they have dealt with problems in the past 4. Not sure about whom to votes 5. Change towards citizens and society 6. Keeping up to promises 7. Not make money for self 8. Sincerity towards problem solving 9. Practical approach in problem solving 10. Young candidates 11. Just nature of the government 12. Not being interested in voting and it was just a formailty.
25. Conclusion 25 Of all the techniques, Banners, Flags, Bills and Paintings of Party symbols have been most influential followed by Processions and Rallies. Facebook is the most popular social networking site There is no substance in the fact that time spent on a media (internet, television, print or radio) makes a difference on the voting decision. Debates/ discussions on news channels or
26. Bibliography
27. 27 Market Research Reports Synovate “Young Asians survey” 2011 Internet & Mobile Association of India “Social Media in India” 2012 IAMAI and IMRB “I-cube” 2011 TAM(Television Authority Measurement) India “India’s Peoplemeter Update” 2013 IMRB @ Brand Sciences “IMPRINT”(Newsletter) June 2009 Scholarly Articles Phil Harris “The political marketing planning process: improving image and message in strategic target areas” Jennifer Lees Marshment Political Marketing: Principles and Applications Newspaper Articles N Madhavan, Hindustan Times Bepreparedforsocialmediain2014generalelections November 11, 2012 Arun Prabhudesai, Trak India 52 Million Active Internet Users in India – rural India overtakes Urbanites ! April 7, 2010 Manish Pandey, India Today UPA introduces mobile
governance ahead of 2014, aims to reach out to electorate in rural areas March 3, 2013 Nabanita, One India Entertainment Bollywood's immortal love for Indian politics Feb 21, 2012 Ani News CP Joshi to go live on Google Plus Hangout on March 29 March 29, 2013 Anish Sinha, India Today FM's hit Hangout raises UPA's social media hopes March 07, 2013 Search Engines Google http://www.google.com You tube http://www.youtube.com Book Actuarial Education Company, UK Probability and Mathematical Statistics