PLANNING ANNUAL PERFORMANCE REPORT … · 4. Our Overall Performance – Summary 8 5....
54
Snowdonia National Park LPA PLANNING ANNUAL PERFORMANCE REPORT (APR) 2016-17
Transcript of PLANNING ANNUAL PERFORMANCE REPORT … · 4. Our Overall Performance – Summary 8 5....

Snowdonia National Park LPA
PLANNING ANNUAL PERFORMANCE
REPORT (APR)
2016-17
Snowdonia National Park LPA
PLANNING ANNUAL PERFORMANCE REPORT (APR)
2016-17
Page
Preface 1
1. Context 2
2. Planning Service – Background and Structure of the Department 4
3. Our Local Story – Key Issues in Snowdonia 7
4. Our Overall Performance – Summary 8
5. Characteristics of a Good Planning Service 13
6. Our Performance 2016-17 15
7. Overall Conclusions 29
Annex A - Performance Framework Overview 31
Section 1 - Plan Making 34 Section 2 - Efficiency 37 Section 3 - Quality 39 Section 4 - Engagement 41 Section 5 - Enforcement 43 Section 6 - Sustainable Development Indicators 45
1
I am very pleased to introduce the third Annual Performance Report for Snowdonia National Park Authority’s (SNPA) planning service. The report demonstrates on how the Authority has performed against various indicators, identifies what has been done well, and identifies what steps to be taken to address areas of performance in need of improvement.
Planning is an important function for all authorities but especially so in the National Park, where the additional statutory purposes of protecting and enhancing these areas, as well as promoting people’s understanding and enjoyment of them is central to everything that we do. Our economic duty also ensures that our decisions as a Planning Authority must ensure that any development that takes place within Snowdonia accord with the principles of sustainability. Delivering an efficient and pro-active planning service is an essential element in meeting these long term local and national objectives for the benefit of existing and future generations.
This report demonstrates that the Authority’s overall performance has been reasonably good, and we continue to improve with less resources and we have a clear focus to deliver a good planning service. The APR is an opportunity for our entire team to reflect and evaluate key areas for improvement as we try and continuously improve our Service for the benefit of all our customers, as well as for the special environment within which are charged with protecting.
There have been challenging times and there are challenging times ahead and we now must make proper use of resources, invest in technology and be more innovative, creative and flexible to respond effectively.
Councillor Elwyn Edwards Chairman Planning and Access Committee
PREFACE
2
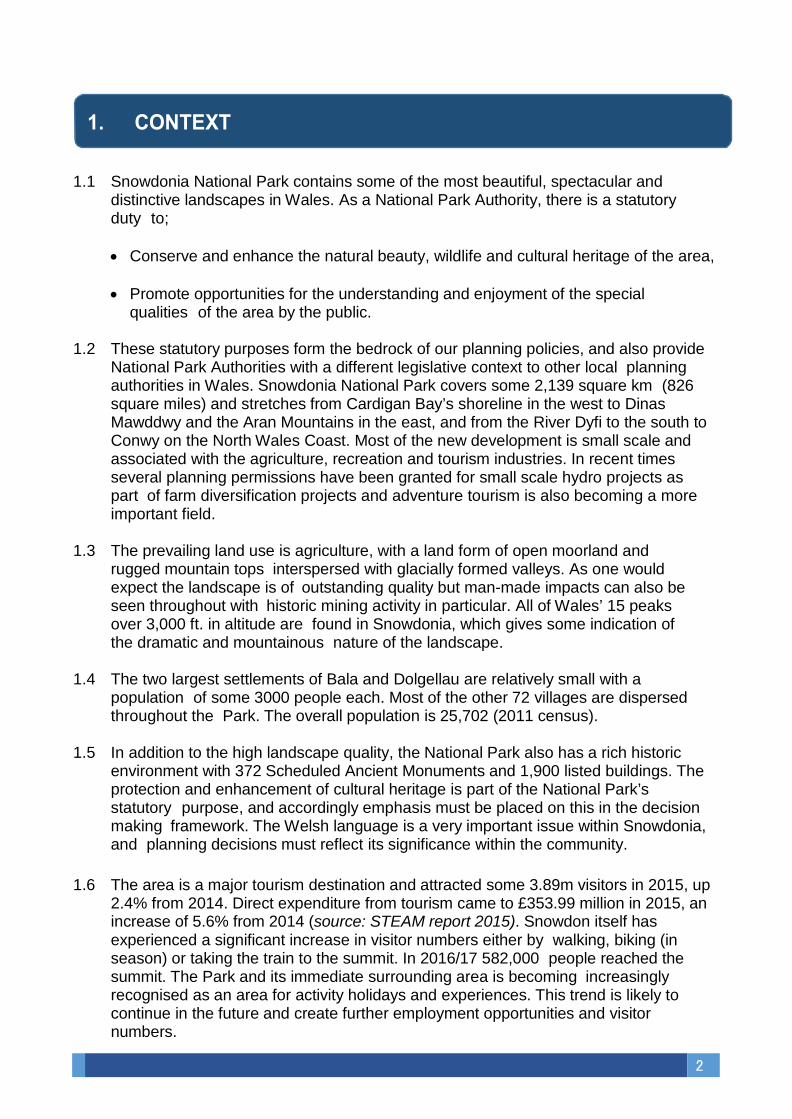
1.1 Snowdonia National Park contains some of the most beautiful, spectacular and
distinctive landscapes in Wales. As a National Park Authority, there is a statutory duty to;
• Conserve and enhance the natural beauty, wildlife and cultural heritage of the area,
• Promote opportunities for the understanding and enjoyment of the special
qualities of the area by the public. 1.2 These statutory purposes form the bedrock of our planning policies, and also provide
National Park Authorities with a different legislative context to other local planning authorities in Wales. Snowdonia National Park covers some 2,139 square km (826 square miles) and stretches from Cardigan Bay’s shoreline in the west to Dinas Mawddwy and the Aran Mountains in the east, and from the River Dyfi to the south to Conwy on the North Wales Coast. Most of the new development is small scale and associated with the agriculture, recreation and tourism industries. In recent times several planning permissions have been granted for small scale hydro projects as part of farm diversification projects and adventure tourism is also becoming a more important field.
1.3 The prevailing land use is agriculture, with a land form of open moorland and
rugged mountain tops interspersed with glacially formed valleys. As one would expect the landscape is of outstanding quality but man-made impacts can also be seen throughout with historic mining activity in particular. All of Wales’ 15 peaks over 3,000 ft. in altitude are found in Snowdonia, which gives some indication of the dramatic and mountainous nature of the landscape.
1.4 The two largest settlements of Bala and Dolgellau are relatively small with a
population of some 3000 people each. Most of the other 72 villages are dispersed throughout the Park. The overall population is 25,702 (2011 census).
1.5 In addition to the high landscape quality, the National Park also has a rich historic
environment with 372 Scheduled Ancient Monuments and 1,900 listed buildings. The protection and enhancement of cultural heritage is part of the National Park’s statutory purpose, and accordingly emphasis must be placed on this in the decision making framework. The Welsh language is a very important issue within Snowdonia, and planning decisions must reflect its significance within the community.
1.6 The area is a major tourism destination and attracted some 3.89m visitors in 2015, up 2.4% from 2014. Direct expenditure from tourism came to £353.99 million in 2015, an increase of 5.6% from 2014 (source: STEAM report 2015). Snowdon itself has experienced a significant increase in visitor numbers either by walking, biking (in season) or taking the train to the summit. In 2016/17 582,000 people reached the summit. The Park and its immediate surrounding area is becoming increasingly recognised as an area for activity holidays and experiences. This trend is likely to continue in the future and create further employment opportunities and visitor numbers.

3
1.7 Generally the scale of existing and proposed developments is small. The average annual housing completion rate since 2007 is 48 units. The Eryri Local Development Plan was the first to be adopted in North Wales and was produced in conjunction with the National Park Management Plan which was adopted in 2011. A Short Form Review of the LDP commenced earlier this year (2016-17).
1.8 Both plans have a shared vision and a set of “special qualities” which identify what is
unique and special to the area.
1.9 Both of the above plans have taken on board the relevant Community Strategies and the overriding need to take into account the importance of the Welsh language within local communities. The importance of the Welsh language has now been formally recognised as a material planning consideration in the Planning Act (Wales) 2015.
4
2.1 STRUCTURE OF THE DEPARTMENT
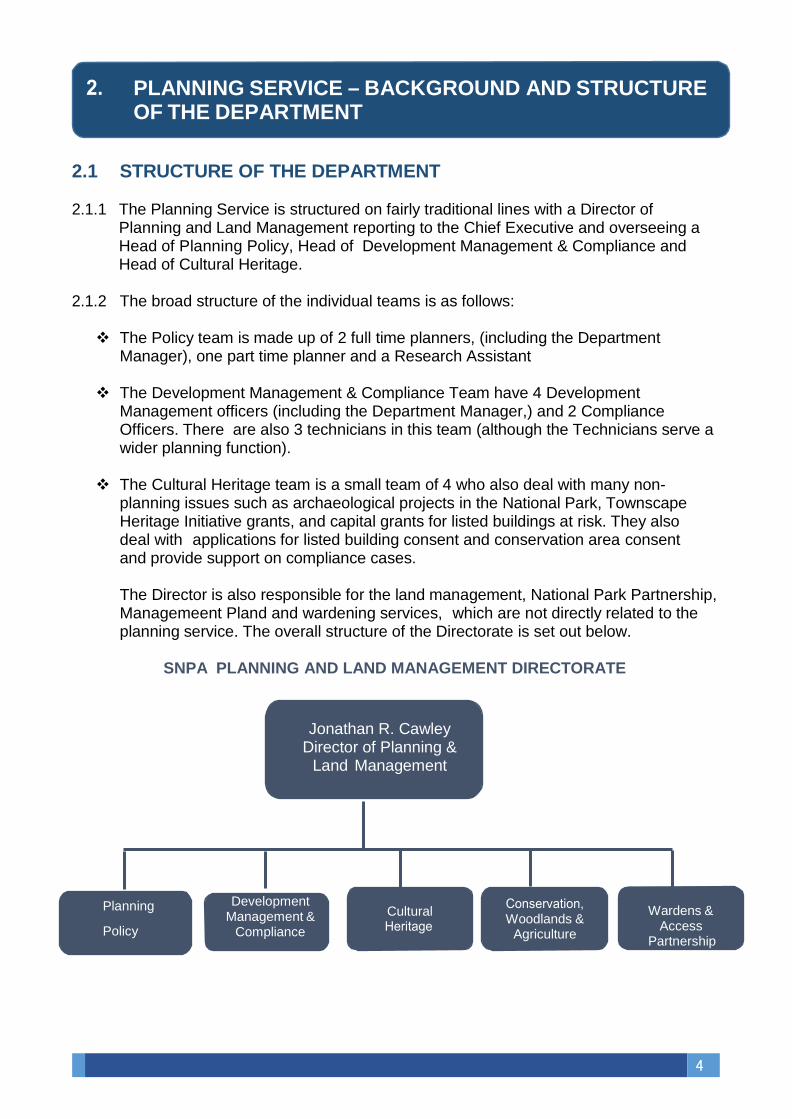
2.1.1 The Planning Service is structured on fairly traditional lines with a Director of Planning and Land Management reporting to the Chief Executive and overseeing a Head of Planning Policy, Head of Development Management & Compliance and Head of Cultural Heritage.
2.1.2 The broad structure of the individual teams is as follows:
The Policy team is made up of 2 full time planners, (including the Department
Manager), one part time planner and a Research Assistant
The Development Management & Compliance Team have 4 Development Management officers (including the Department Manager,) and 2 Compliance Officers. There are also 3 technicians in this team (although the Technicians serve a wider planning function).
The Cultural Heritage team is a small team of 4 who also deal with many non-
planning issues such as archaeological projects in the National Park, Townscape Heritage Initiative grants, and capital grants for listed buildings at risk. They also deal with applications for listed building consent and conservation area consent and provide support on compliance cases.
The Director is also responsible for the land management, National Park Partnership, Managemeent Pland and wardening services, which are not directly related to the planning service. The overall structure of the Directorate is set out below.
SNPA PLANNING AND LAND MANAGEMENT DIRECTORATE
Jonathan R. Cawley Director of Planning &
Land Management
Planning
Policy
Development Management &
Compliance
PLANNING SERVICE – BACKGROUND AND STRUCTURE OF THE DEPARTMENT
Cultural
Woodlands &Agriculture
Wardens &
Access Partnership

5
2.2 CORPORATE BACKGROUND 2.2.1 The Authority has a Business and Improvement Plan and an overall Corporate Plan.
A 3 year financial plan which was prepared to help the Authority delivery the austerity measures has recently been delivered. However, a further round of austerity measures is currently been delivered in the face of Welsh Government financial cuts - and these are currently being implemented.
2.2.2 The small size and nature of NPAs necessitates working in a collaborative manner,
and partnership working forms a part of the culture of the organisation – this includes work with other NPAs, other local planning authorities and other related organisations. There is now a formalised arrangement whereby the Welsh NPAs meet bi annually to address any potential joint working opportunities.
2.2.3 The Policy and Development Management function has worked flexibly in the past, which has allowed some cover during staff absence. For example, if there is an issue with absence of Development Management staff, Policy officers have been used for cover. This system has worked well and is a great benefit in having a small and flexible team. However, now that the review of the LDP has commenced any opportunities for flexibility here will be limited.
2.2.4 An area of concern for the Authority is that of succession planning. The Authority has
a Welsh essential recruitment policy, which is important in an area where the Welsh language forms such an integral part of the community. Recruiting high caliber planning professionals is a problem across the country – but it is also a problem which may be more acute for Authorities with a ‘Welsh essential’ recruitment requirement. Further careful consideration is required on trying to recruit good caliber Welsh speaking planning officers and mentoring them in the medium term as future managers.
2.2.5 In 2015, the Wales Audit office looked into whether the Authority provided an efficient planning service, aimed at high performance, even in the face of increasing budget cuts. The findings indicate that there is a shared vision supported by improved leadership. The Development Management costs are low in comparison with the other two National Parks but further work is required on more strategic collaboration and comparative costs.
2.2.6 Key areas of work for the Planning Service include:
• Providing pre-application advice to customers;
• Determining planning applications in accordance with adopted policy and material planning considerations, taking into account stakeholder comments and corporate objectives;
• Taking robust enforcement action against unathorised development that is unacceptable;
• Preparing supplementary planning guidance (SPG’s) to assist in the implementation and interpretation of LDP policy;
• Implementing the Authority’s LDP through engaging and working with communities;
• Monitoring and evaluating Plan policies.
6
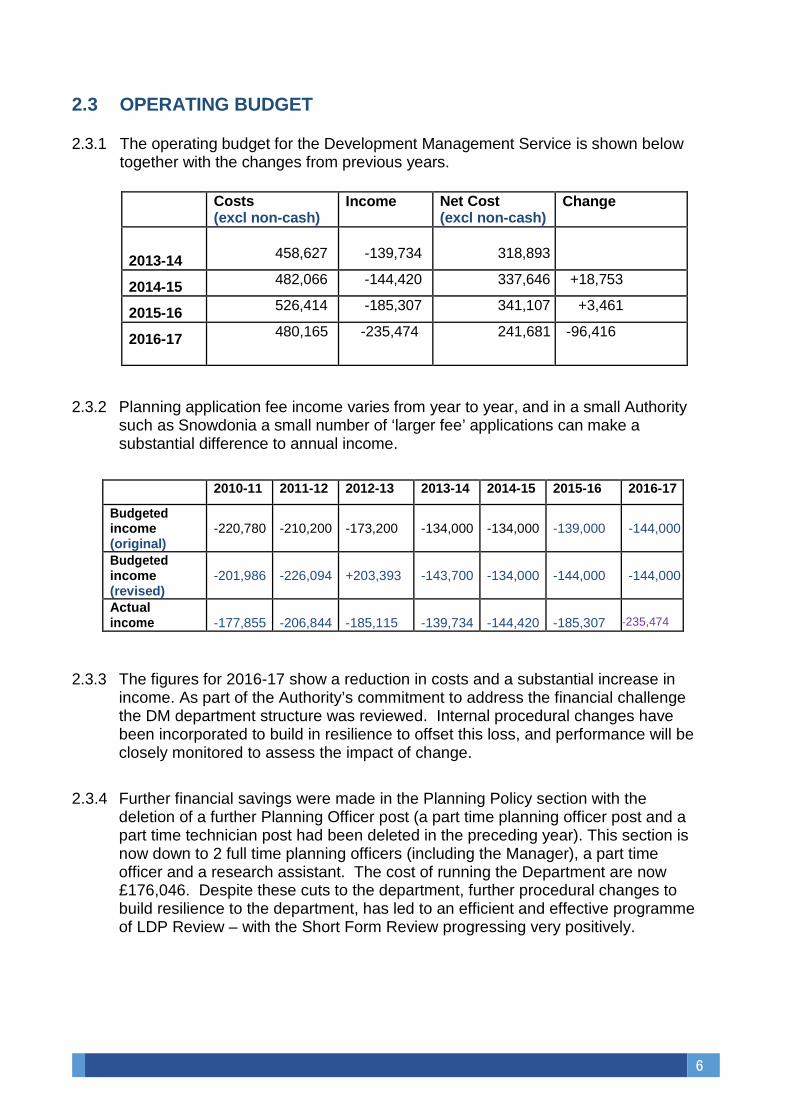
2.3 OPERATING BUDGET 2.3.1 The operating budget for the Development Management Service is shown below
together with the changes from previous years.
Costs (excl non-cash)
Income Net Cost (excl non-cash)
Change
2013-14
458,627
-139,734
318,893
2014-15 482,066 -144,420 337,646 +18,753
2015-16 526,414 -185,307 341,107 +3,461
2016-17
480,165 -235,474 241,681 -96,416
2.3.2 Planning application fee income varies from year to year, and in a small Authority
such as Snowdonia a small number of ‘larger fee’ applications can make a substantial difference to annual income.
2010-11 2011-12 2012-13 2013-14 2014-15 2015-16 2016-17
Budgeted income (original)
-220,780
-210,200
-173,200
-134,000
-134,000
-139,000
-144,000
Budgeted income (revised)
-201,986
-226,094
+203,393
-143,700
-134,000
-144,000
-144,000
Actual income
-177,855
-206,844
-185,115
-139,734
-144,420
-185,307
-235,474
2.3.3 The figures for 2016-17 show a reduction in costs and a substantial increase in
income. As part of the Authority’s commitment to address the financial challenge the DM department structure was reviewed. Internal procedural changes have been incorporated to build in resilience to offset this loss, and performance will be closely monitored to assess the impact of change.
2.3.4 Further financial savings were made in the Planning Policy section with the
deletion of a further Planning Officer post (a part time planning officer post and a part time technician post had been deleted in the preceding year). This section is now down to 2 full time planning officers (including the Manager), a part time officer and a research assistant. The cost of running the Department are now £176,046. Despite these cuts to the department, further procedural changes to build resilience to the department, has led to an efficient and effective programme of LDP Review – with the Short Form Review progressing very positively.
7
3.1 A UNIQUE LANDSCAPE, WITH UNIQUE CHALLENGES:
Planning in an environment as beautiful and as environmentally and socially fragile as Snowdonia is not without challenge, and our Officers and Members recognise the huge responsibility that is placed upon their shoulders in ensuring the National Park’s special qualities are protected for future generations to enjoy – whilst retaining communities that are viable. Some of the key issues that contribute to Snowdonia’s special landscape include:
• Much of Snowdonia is a stronghold for the Welsh language – although the fragile
nature of the language requires it to be considered in all major development decisions;
• It includes all of Wales’ 14 peaks over 3,000ft – include the highest peak, Snowdon - making a rugged and beautiful landscape;
• These mountains draw people from all over the World – with Snowdon alone attracting 650,000 visitors a year, creating a unique pressure on a fragile landscape;
• Other honeypots in the National Park draw in a great deal of visitors, again creating development pressures that the Planning department must deal with. These places include Beddgelert, Betws-y-Coed, Coed-y-Brenin and Capel Curig.
• In addition to the rugged mountains, the National Park also has about 60km of beautiful coastline, in very sensitive locations;
• Snowdonia has 14 Conservation Areas, 1,900 listed buildings (including 13 Grade 1 listed buildings and 116 Grade 2*), and 21 Historic Parks and Gardens;
• It includes many stunning castles – including Harlech Castle which forms part of a World Heritage Site (the Castles and Town Walls of Edward I);
• The entire National Park is rich in biodiversity, and it has 15 Special Areas of Conservation, 3 Ramsar sites, 107 Sites of Special Scientific Interest, 21 National Nature Reserves, and a World Biosphere Site;
• However, despite this rich landscape setting the area also has fragile communities characterised by low wages, depopulation of young people, an ageing population and as referred to above a fragile status to the Welsh language in many of the settlements.
The above issues give rise to significant and unique (and in many cases unique) planning challenges for the Authority.
OUR LOCAL STORY – KEY ISSUES IN SNOWDONIA
8
4.1 SUMMARY • During 2016/17 the Authority determined 530 planning applications. The overall record
of the Authority’s Development Management Service is good. In 2016/17 with fewer resources we managed to improve on the number of applications determined within the required timescales. These increased from 71.5% to 81%, exceeding the Welsh Government’s target. The Authority monitors this on a regular basis to ensure that we maintain the 80% mark and look at ways to improve further. We relalise that this is an important performance measure and strive to maintain it
• 87% of all applications received were approved. • 9 of the Authority’s applications ended up at appeal which works out as 1.6% of all
applications and 14% of all applications refused. The Authority’s record at appeal increased from the 50% of decisions upheld in 2015/16 to 73% in 2016/17. This again exceeds the Welsh Government target upheld Appeal Decisions
• The Authority still has a relatively high number of ‘overturns’ (member made decisions
against officer approval) at Planning Committee at 18%. These decisions were all to approve against officer advice. However, this percentage is not a cause for any major concern. The low number of planning applications can distort this figure and it should be noted that the majority of the ‘overturns’ were to approve the application against officer recommendation. A review of all ‘overturned decisions’ has taken place at the Planning and Access Committee – and nearly all the applications could be classed as ones that were ‘in the balance’ where a case could have been made to go the other way.
• The feedback from the Customer Service Surveys suggests that this as an area where
potential service improvements could be made. However, it is a field which does not yield immediate and obvious answers. The results of this survey will continue to be carefully assessed within the Department, with a view to enhancing the customer experience of those who come into contact with the Planning Service.
• In the previous APR it has been reported that the Authority had to deal with the
pressures of Hydro Electric Power (HEP) schemes, with over a hundred applications being determined in the last 4 years. These applications are labour intensive, and are often submitted in very sensitive and highly designated landscapes – requiring the inputs of landscape architects, tree officers, ecologist and Archaeologist. Whilst there has been a significant decrease in the number received they continue to be submitted. In 2016/17 the Authority received 18 applications for telecommunications masts. These require careful assessment but they are mostly located in very sensitive environments with multiple designations. The vast majority have been approved, but this usually requires officer input to understand the landscape impacts.
• The Authority completed its 4th Local Development Plan (LDP) Annual Monitoring
Report and is currently in the review process, with an examination due to be held early in 2018. To date the performance of the LDP has been relatively consistent with the
OUR OVERALL PERFORMANCE - SUMMARY

9
performance targets set out in the monitoring schedule. The policies have been effective in guiding development management decisions.
• Collaboration work with other Local Planning Authorities and the other 2 National Park
Authorities remains an important objective, although further emphasis could be placed on this moving forward. However, officers are ‘holding back’ on this pending the outcome of more formal collaboration projects including the POSW Collaboration project on Natural and Built Heritage (funded by the Welsh Government, CADW, POSW, NWPOG and NRW), and the Welsh Government’s Future Landscapes project.
• The above referenced project is assessing the efficiency and effectiveness of
communication with statutory agencies on both built and natural environment matters. This work will also ensure clearer lines of responsibility and communication. The Director of Planning and Land management at SNPA is leading on the natural environment work with colleagues at NRW. The work will be completed by April 2018.

10
4.2 WHAT SERVICE USERS 4.2.1 Customer Satisfaction Survey
In 2016-17 we conducted a customer satisfaction survey aimed at assessing the views of people that had received a planning application decision during the year. The survey was sent to 267 people, 18% of whom submitted a completed response. The majority of responses (55%) were from members of the public. 15% of respondents had their most recent planning application refused. We asked respondents whether they agreed or disagreed with a series of statements about the planning service. They were given the following answer options:
• Strongly agree; • Tend to agree; • Neither agree not disagree; • Tend to disagree; and • Strongly disagree.
4.2.2 Table 1 shows the percentage of respondents that selected either ‘tend to agree’ or
‘strongly agree’ for each statement for both our planning authority and Wales.
Table 1: Percentage of respondents who agreed with each statement, 2016-17
%
Percentage of respondents who agreed that:
SNPA LPA
Wales
The LPA enforces its planning rules fairly and consistently 46 52 The LPA gave good advice to help them make a successful application 53 62 The LPA gives help throughout, including with conditions 47 52 The LPA responded promptly when they had questions 58 61 They were listened to about their application 50 59 They were kept informed about their application 51 51 They were satisfied overall with how the LPA handled their application 59 61
11
4.2.3 Assessment of Results in Table 1: 4.2.4 Assessment of Customer Survey Results:
• The Authority fell slightly below the Welsh average in all of the above questions,
however there has been an improvement in all areas compared to the 2015/16 results. The Authority will continue to assess areas to improve customer services.
• The Authority has historically prided itself on the fact that its officers are accessible to applicants/agents. There are no call centres, and there is always a duty officer available and officers or technicians are on hand to deal with any queries, either be it by phone or personal visits to the office.
• The relatively low number of responses requires some care when interpreting these
results – with only 27 completed forms being submitted.
• In additional to the customer survey forms, the Authority also holds annual meetings with Planning Agents and Town & Community Councils. The feedback from these events is very positive, and the relationship we have built with these groups is appreciated.
• The Authority also monitors complaints made about the Planning Service. 5
complaints were received throughout the course of the year, as compared to 8 in the previous financial year. Our adopted procedures ensures that such complaints are assessed by the Head of Administration & Customer Care. Only 1 of the 5 complaints was upheld. The upheld complaint related to an officer visiting a site and caused concern to the landowner. 1 complaint was made to the Ombudsman in 2016-17, the Ombudsman concluded not to investigate this. It is considered, that this record relating to complaints is a good reflection of the department and how it goes about its work.
4.2.5 Responding to the Customer Survey Results:
There is an ongoing concern on the low response rate to the survey. Although this is out of our control there is a tendency as can be seen from the results that the survey participants which were refused planning permission respond, with 15% of the 18% had their most recent planning application refused. This year’s sample was sent to 267 people, 18% of whom submitted a whole or partial response. That being 48 completed responses from a population sample of 267 – and only 8% when measured against all submitted planning applications.
12
4.2.6 In last year APR we addressed the best way to respond to our customers and addressed the following matters (a to I below)
a. Are officers always available to answer telephone queries?
b. Are officers courteous in dealing with customers?
c. How often are officer’s not available to answer the telephone?
d. If they are not available and a voicemail message is left, do officers respond in a
timely fashion?
e. Is the advice that officers provide sufficient and is it consistent?
f. Is there enough information to help applicants and agents online?
g. What improvements can we make to online services?
h. Is there enough information about the status of an application given online or given directly to an applicant?
i. Is the service we provide to customers calling in at the office of a high standard?
4.2.7 There has been some improvement as demonstrated in the figures above.
However, it is recognised that there is still room for improvement and we have and continue to provide time and resources to address this issue. Focus will be placed on back office systems and the dispensation of information on the Authority’s website – with a view that customers can improve their overall experience of dealing with the Authority in this way.
4.2.8 Action 1 remains as an action for the coming year.
Action 1: Customer Satisfaction Review
SNPA to continue to assess how customers (in particular planning applicants) are dealt with at pre- and post-application stages. Amongst other things, this will focus on the questions raised in the section above.

13
5.1 As part of the Customer Survey we also asked respondents to select three planning service characteristics from a list that they thought would most help them achieve successful developments. Figure 1 shows how often each characteristic was selected as a percentage of the total number of selections.
5.2 For us, 'the availability to talk to a duty planner before submitting an application' was the
most popular choice, followed by Access to the case officer to check the application; with 3rd and 4th placed characteristics being; “Consistent advice from officers” and “Getting a speedy decision on your application”
Figure 1: Characteristics of a good planning service, Snowdonia National Park LPA, 2016-17
5.3 Comments received include:
• “The assistance given by the authority was much appreciated and advice also helped
immensely.”
• “I feel that the LPA provide a very satisfactory service on the whole, my only concerns are sometimes at the registration stage of the application, this is sometimes delayed due to the fact that as an example a "Protective Species Survey" (sic) has to be provided which is dependent on the time of year and holds back the registration of the application.”
• “It is generally a fair process, but could be streamlined. Approvals are rarely issued until the proscribed (sic) period has expired.”
0 20 40 60 80 100
Wales Snowdonia National Park
Availability to talk to a duty planner before you submit your application
Access to the case officer to check on your application
Getting a speedy decision on your submitted application
Having a chance to amend an application before it is decided
Consistent advice from officers
Quick response times to requests for pre-application meetings
Information, design guides and policies available on the website
A concise list of what is needed to make an application
Elected members engaged and involved throughout the process
%
CHARACTERISTICS OF A GOOD PLANNING SERVICE

14
5.4 In undertaking any review of the service in response to the Customer Survey as set
out in Action 1 above, we will as part of this Review also focus on the issues that customers have stated above are important to them.
15
6.1 This section details our performance in 2016-17. It considers both the Planning Performance Framework indicators and other available data to help paint a comprehensive picture of performance. Where appropriate we make comparisons between our performance and the all Wales picture.
6.2 Performance is analysed across the five key aspects of planning service delivery as
set out in the Planning Performance Framework: • Plan making; • Efficiency; • Quality; • Engagement; and • Enforcement.
6.3 PLAN MAKING
6.3.1 As at 31 March 2017, we were one of 22 LPAs that had a current development plan in place. We were required to submit an Annual Monitoring Report in October 2016 – and this document was prepared and submitted to the Welsh Government. The Authority was the first in North Wales to prepare an adopted LDP, and since then 4 Annual Monitoring Reports (AMR) have been submitted to the Welsh Government. The AMRs demonstrate that the LDP has been operating effectively and the Plan’s Strategy works. In view of this, the impending Review of the LDP will be a ‘short form’ review which will focus on a few key areas for change, whilst retaining the existing Plan Strategy.
6.3.2 Only 32% of LPAs (8 in total) have an adequate supply of housing land (more than
5 years supply) – and SNPA fall within this category – which put the Authority in a strong position to have plan-led decisions on new development. During this APR period we had 4 years of housing land supply identified. This exposes the Authority to less risk of speculative house building, and allows a greater control and certainty over having a plan-led approach to housing within the Authority.
6.3.3 Overall therefore, it is considered the Authority’s overall performance on issues of
Plan-making is excellent and we are one of the top performing Authority’s in Wales in terms of having an up to date adopted Plan and sufficient housing land supply.
OUR PERFORMANCE 2016 - 17
16
6.4 EFFICIENCY
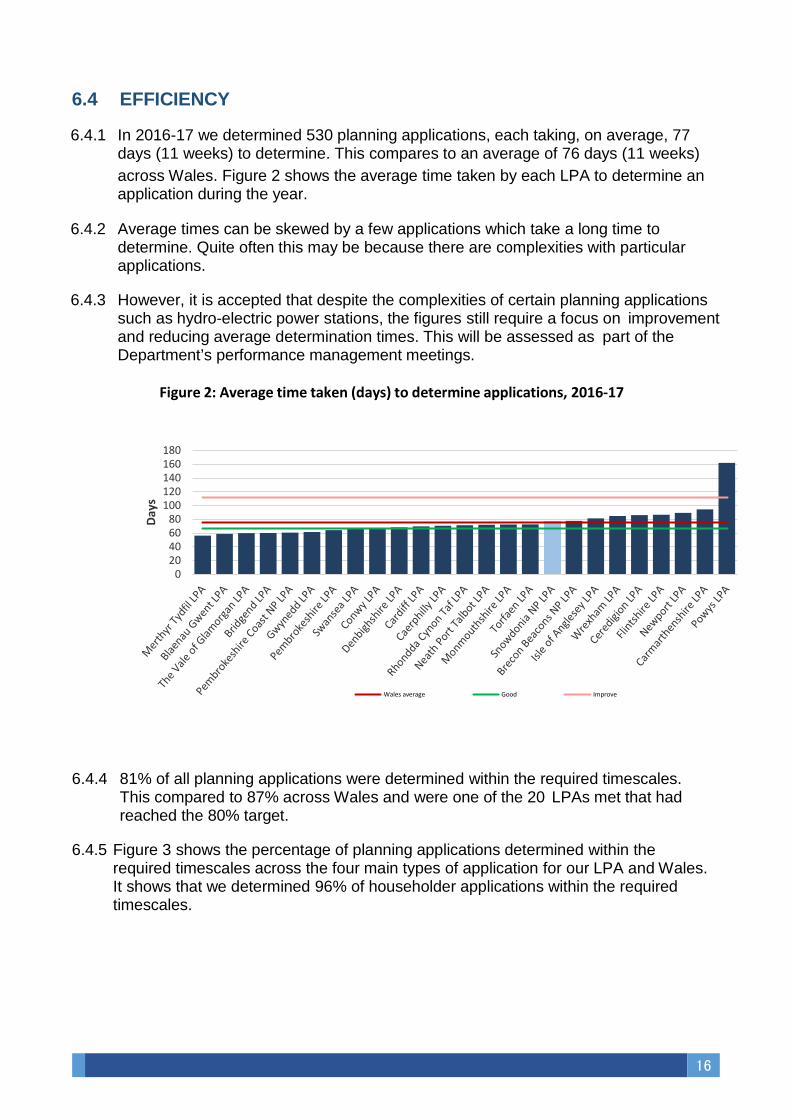
6.4.1 In 2016-17 we determined 530 planning applications, each taking, on average, 77 days (11 weeks) to determine. This compares to an average of 76 days (11 weeks) across Wales. Figure 2 shows the average time taken by each LPA to determine an application during the year.
6.4.2 Average times can be skewed by a few applications which take a long time to
determine. Quite often this may be because there are complexities with particular applications.
6.4.3 However, it is accepted that despite the complexities of certain planning applications such as hydro-electric power stations, the figures still require a focus on improvement and reducing average determination times. This will be assessed as part of the Department’s performance management meetings.
Figure 2: Average time taken (days) to determine applications, 2016-17
6.4.4 81% of all planning applications were determined within the required timescales.
This compared to 87% across Wales and were one of the 20 LPAs met that had reached the 80% target.
6.4.5 Figure 3 shows the percentage of planning applications determined within the
required timescales across the four main types of application for our LPA and Wales. It shows that we determined 96% of householder applications within the required timescales.
020406080
100120140160180
Days
Wales average Good Improve

17
Figure 3: Percentage of planning applications determined within the required timescales, by type, 2016-17
6.4.6 Between 2015-16 and 2016-17, as Figure 4 shows, the percentage of planning applications we determined within the required timescales increased from 71%. Wales also saw an increase this year.
Figure 4: Percentage of planning applications determined within the required timescales
6.6.7 Over the same period:
• The number of applications we received decreased; • The number of applications we determined increased; and • The number of applications we approved increased.
6.4.8 These results offer some encouragement and that there is a noticeable
improvement from last year’s results. We acknowledge that there is still areas of improvement
0
10
20
30
40
50
60
70
80
90
100
Major applications Minor applications Householder applications Other applications
%
Snowdonia National Park LPA Wales average
0
10
20
30
40
50
60
70
80
90
100
2013-14 2014-15 2015-16 2016-17
%
Snowdonia National Park LPA Wales average

18
• Internal delays – for example, at validation stage; • Negotiation on aspects of the application (post validation) to make it acceptable • Requests for further information on the application • Late responses from internal and external consultees • Delays in planning applications which accompany Listed Building Consent (whilst we
await CADW’s final approval of the LBC application) • Applications which go before committee / Inspection Panels
6.4.9 An internal review of our processes is an on-going process and has looked at the
following in the past year.
Efficiency Improvements to Internal Processes: It is considered that further ‘efficiency improvements’ can be made to the way that planning applications are processed. This includes the way applications are validated, consulted, as well as issues on internal and external communication. There may not need to be a structural change in these processes, although any ‘marginal gains’ in improving the system will be implemented;
Improvements in the use of ICT: A review of the back office system has taken place and has focused on how this can be used to improve performance management. This could lead to efficiencies in internal processing, better internal and external communication, as well as other benefits – such as a move towards a paperless system and better use of mobile technologies. Training days have been arranged to ensure that the system is used to its full capacity This will not be an ‘overnight fix’ and requires the investment of time and resources.
Internal and External Consultees: A study is currently taking place on making improvements to the way that consultation with the statutory agencies is being handled on both built and natural heritage issues. The Director of Planning & Land Management at Snowdonia is leading on the natural heritage project (with colleagues from NRW). All of these issues in combination should lead to significant efficiency improvements in the process, although we may not see the full benefits of some of these until 2017. Improvements in the way internal consultees communicate with the department will also be assessed.
Regular Programme of Performance Management Meetings: A programme of performance management meetings has recently commenced, which aim to involve and encourage staff within the department to become pro-actively involved in improving performance.
19
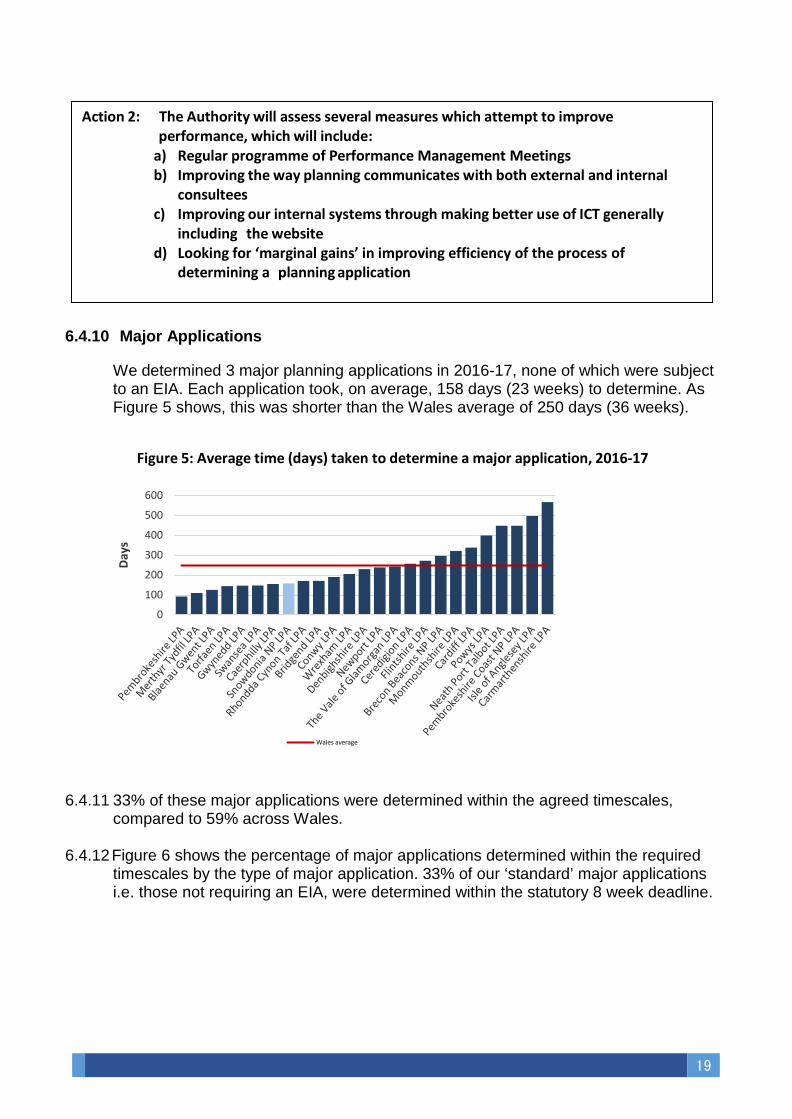
6.4.10 Major Applications
We determined 3 major planning applications in 2016-17, none of which were subject to an EIA. Each application took, on average, 158 days (23 weeks) to determine. As Figure 5 shows, this was shorter than the Wales average of 250 days (36 weeks).
Figure 5: Average time (days) taken to determine a major application, 2016-17
6.4.11 33% of these major applications were determined within the agreed timescales, compared to 59% across Wales.
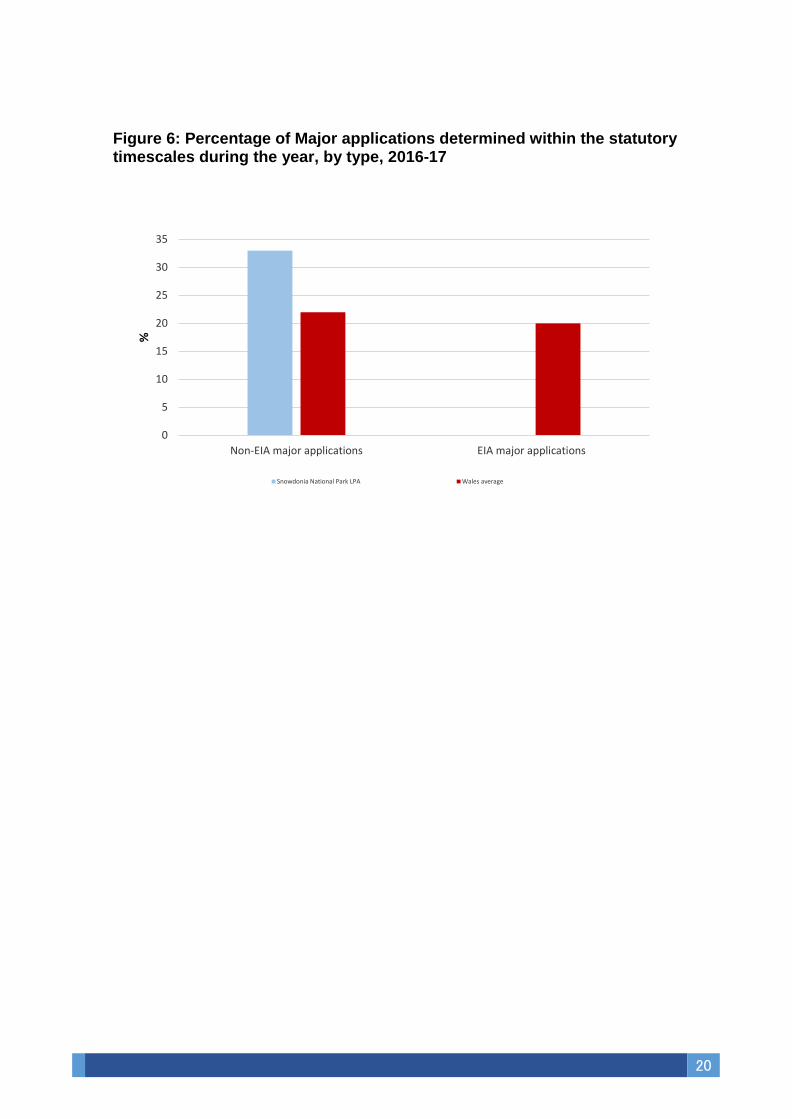
6.4.12 Figure 6 shows the percentage of major applications determined within the required
timescales by the type of major application. 33% of our ‘standard’ major applications i.e. those not requiring an EIA, were determined within the statutory 8 week deadline.
0
100
200
300
400
500
600
Days
Wales average
Action 2: The Authority will assess several measures which attempt to improve performance, which will include:
a) Regular programme of Performance Management Meetings b) Improving the way planning communicates with both external and internal
consultees c) Improving our internal systems through making better use of ICT generally
including the website d) Looking for ‘marginal gains’ in improving efficiency of the process of
determining a planning application
20
Figure 6: Percentage of Major applications determined within the statutory timescales during the year, by type, 2016-17
0
5
10
15
20
25
30
35
Non-EIA major applications EIA major applications
%
Snowdonia National Park LPA Wales average

21
6.4.13 Since 2015-16 the percentage of major applications determined within the required
timescales had increased from 0%. Similarly, the number of major applications determined increased while the number of applications subject to an EIA determined during the year decreased.
6.4.14 Figure 7 shows the trend in the percentage of major planning applications determined
within the required timescales in recent years and how this compares to Wales.
Figure 7: Percentage of major planning applications determined within the required timescales
6.4.15 Over the same period:
• The percentage of minor applications determined within the required timescales increased from 77% to 82%;
• The percentage of householder applications determined within the required timescales increased from 91% to 96%; and
• The percentage of other applications determined within required timescales increased from 57% to 78%.
Applications defined as ‘major’ are relatively rare in the National Park – this is mainly due to the rural nature of the area (small villages and vast rural areas), and the suitability of major developments (e.g. wind farms), in a National Park setting. Only 3 major applications were received last year – the same figure as the preceding year (1 of which was an EIA application).
0
10
20
30
40
50
60
70
2013-14 2014-15 2015-16 2016-17
%
Snowdonia National Park LPA Wales average
22
6.5 QUALITY
6.5.1 During 2016-17, our Planning Committee determined 45 planning application decisions during the year, which equated to 8% of all planning applications determined. Across Wales 6% of all planning application decisions were made by planning committee.
6.5.2 18% of these member-made decisions went against officer advice. This compared to
11% of member-made decisions across Wales. This equated to 1.5% of all planning application decisions going against officer advice; 0.7% across Wales.
6.53 Some care is required here as we are dealing with a very low number of planning applications
here – and a swing of 1 or 2 decisions either way could have a large effect on the final result. 6.5.4 It is interesting to note that all of the member-made decisions against officer advice were
to approve an application, when the officer had recommended refusal. This leads to a greater approval rate and fewer appeals.
6.5.5 However, given that the percentages are higher than the Government targets, it is worth
exploring this issue further and a paper assessing all member-made decisions against officer advice are presented and discussed with Members. If there are any lessons learnt or improvements that can be achieved resulting from this exercise, these will of course be implemented.

23
6.5.6 In 2016-17 we received 9 appeals against our planning decisions, which equated to 1.7 appeals for every 100 applications received. Across Wales 2 appeals were received for every 100 applications.
Figure 8 shows how the volume of appeals received has changed since 2016-17 and how this compares to Wales.
Figure 8: Number of appeals received per 100 planning applications
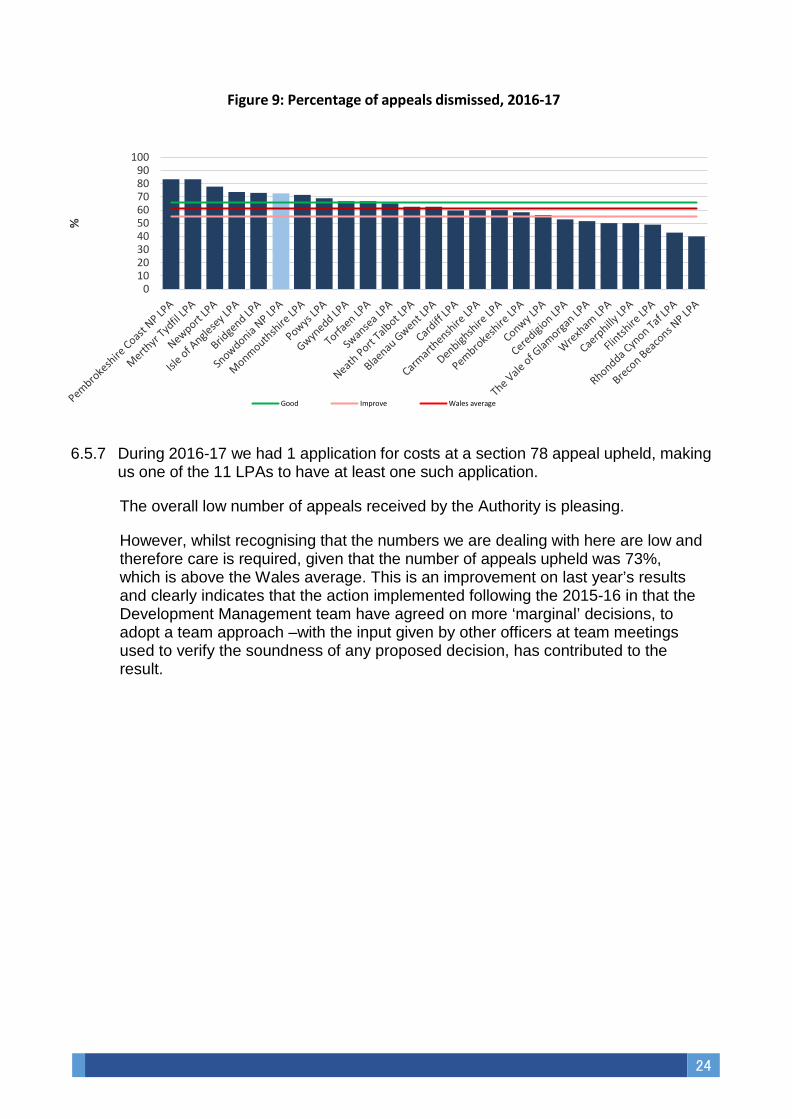
In 2016-17 we approved 87% of planning applications. This compares to 91% across Wales. Of the 11 appeals that were decided during the year, 73% were dismissed. As Figure 9 shows, this was higher than the percentage of appeals dismissed across Wales as a whole and we were one of 10 LPAs that reached the 66% target.
0.0
0.5
1.0
1.5
2.0
2.5
3.0
3.5
2013-14 2014-15 2015-16 2016-17
Num
ber
Snowdonia National Park LPA Wales average
24
Figure 9: Percentage of appeals dismissed, 2016-17
6.5.7 During 2016-17 we had 1 application for costs at a section 78 appeal upheld, making
us one of the 11 LPAs to have at least one such application.
The overall low number of appeals received by the Authority is pleasing.
However, whilst recognising that the numbers we are dealing with here are low and therefore care is required, given that the number of appeals upheld was 73%, which is above the Wales average. This is an improvement on last year’s results and clearly indicates that the action implemented following the 2015-16 in that the Development Management team have agreed on more ‘marginal’ decisions, to adopt a team approach –with the input given by other officers at team meetings used to verify the soundness of any proposed decision, has contributed to the result.
0102030405060708090
100
%
Good Improve Wales average
25
6.6 ENGAGEMENT
6.6.1 We are: • one of 24 LPAs that allowes members of the public to address the
Planning Committee; • one of 22 LPAs that had a Duty Officer on hand to speak to applicants; and • one of 20 LPAs that had an online register of planning applications.
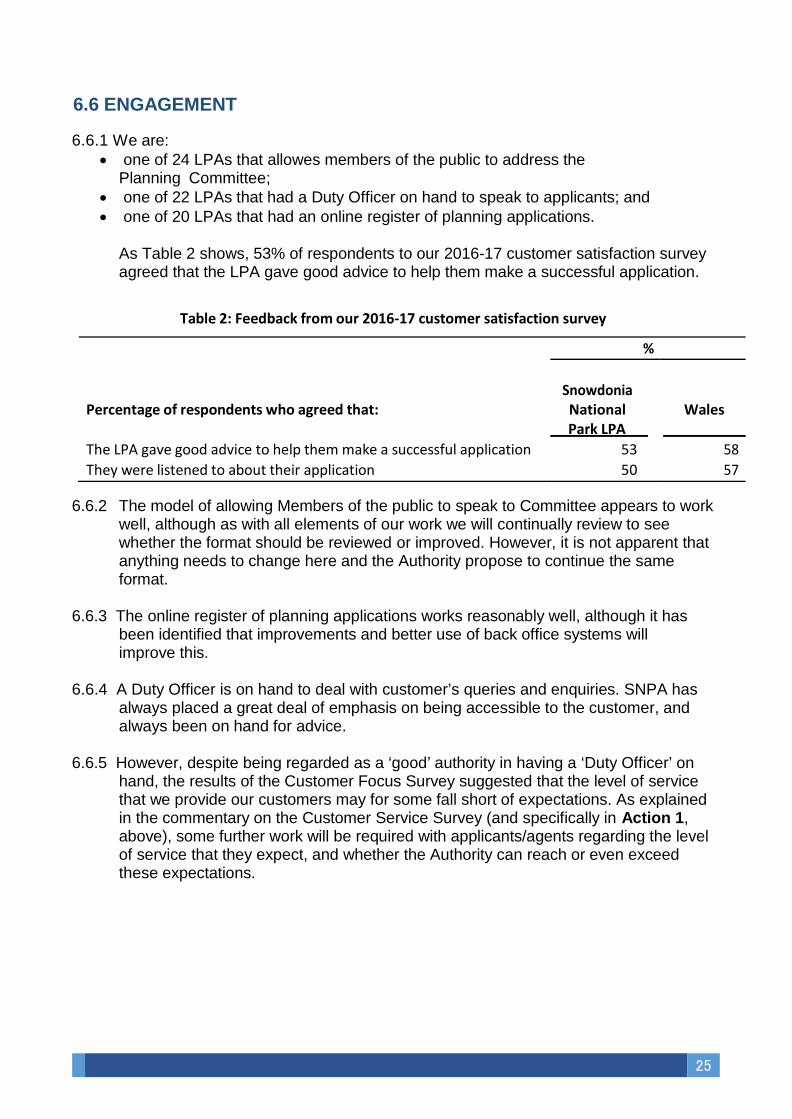
As Table 2 shows, 53% of respondents to our 2016-17 customer satisfaction survey agreed that the LPA gave good advice to help them make a successful application.
Table 2: Feedback from our 2016-17 customer satisfaction survey
% Percentage of respondents who agreed that:
Snowdonia National
Park LPA
Wales
The LPA gave good advice to help them make a successful application 53 58 They were listened to about their application 50 57
6.6.2 The model of allowing Members of the public to speak to Committee appears to work well, although as with all elements of our work we will continually review to see whether the format should be reviewed or improved. However, it is not apparent that anything needs to change here and the Authority propose to continue the same format.
6.6.3 The online register of planning applications works reasonably well, although it has
been identified that improvements and better use of back office systems will improve this.
6.6.4 A Duty Officer is on hand to deal with customer’s queries and enquiries. SNPA has
always placed a great deal of emphasis on being accessible to the customer, and always been on hand for advice.
6.6.5 However, despite being regarded as a ‘good’ authority in having a ‘Duty Officer’ on
hand, the results of the Customer Focus Survey suggested that the level of service that we provide our customers may for some fall short of expectations. As explained in the commentary on the Customer Service Survey (and specifically in Action 1, above), some further work will be required with applicants/agents regarding the level of service that they expect, and whether the Authority can reach or even exceed these expectations.

26
6.6 ENFORCEMENT
6.6.1 In 2015-16 we investigated 133 enforcement cases, which equated to 5.2 per 1,000 population. This was the third highest rate in Wales. We took, on average, 34 days to investigate each enforcement case.
6.6.2 We investigated 93% of these enforcement cases within 84 days. Across Wales 85%
were investigated within 84 days. Figure 10 shows the percentage of enforcement cases that were investigated within 84 days across all Welsh LPAs.
Figure 10: Percentage of enforcement cases investigated within 84 days, 2016-17
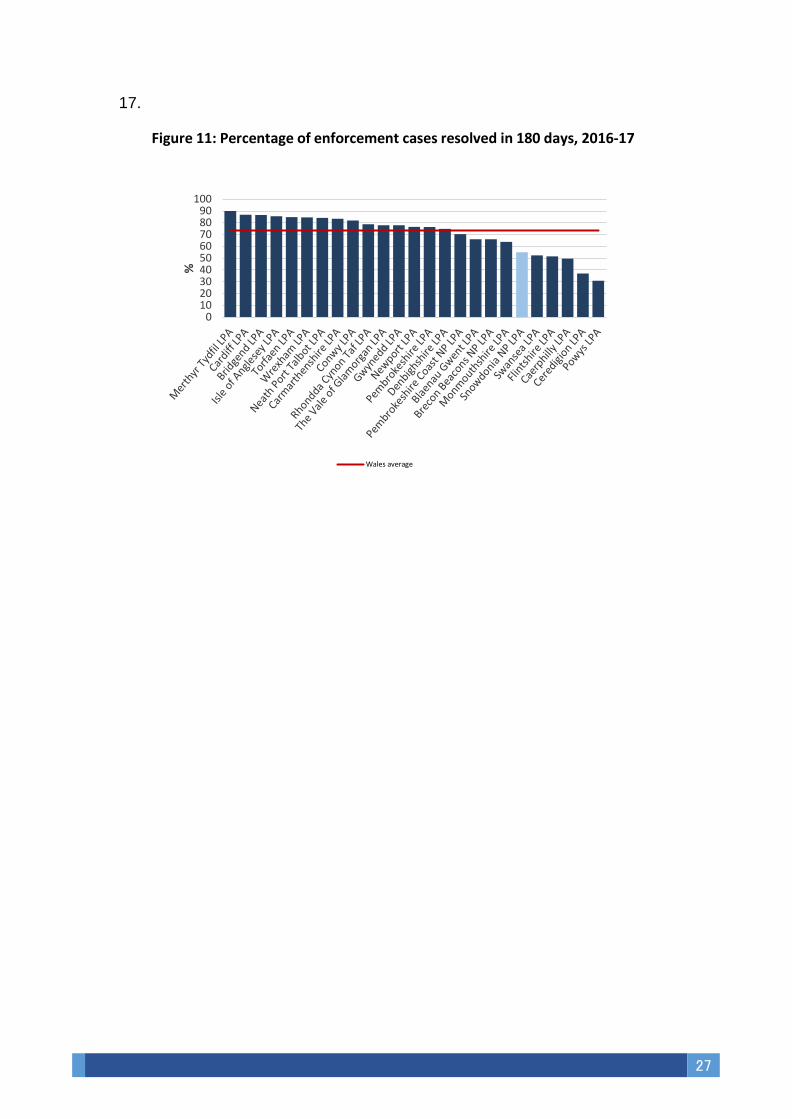
6.6.3 Over the same period, we resolved 178 enforcement cases, taking, on average, 545 days to resolve each case.
55% of this enforcement action was resolved within 180 days from the start of the case. As Figure 11 shows this compared to 73% of enforcement cases resolved within 180 days across Wales.
6.6.5 This results here demonstrate that SNPAs enforcement section is performing well.
This is despite some practical difficulties of operating in an extensive rural area, which does make ongoing monitoring of some developments more challenging than geographically smaller authorities.
6.6.6 The Compliance Team continues to clear a backlog of older cases. This may have
an adverse impact on the average number of days it takes to resolve cases in the performance data for 2017-18 but in the long term this will lead to further improvements for the team.
The Compliance Team has also been affected by the Authority’s response to financial austerity, and there has been a reduction in staff numbers during 2016-
0102030405060708090
100
%
Wales average
27
17.
Figure 11: Percentage of enforcement cases resolved in 180 days, 2016-17
0102030405060708090
100%
Wales average
28
6.4 Collaboration
6.7.1 Collaboration is an important part of SNPA’s culture – and this is probably largely due to the small size of the organisation. Joint working allows us to share good practice, and also makes the Authority more resilient.
6.7.2 Effective collaboration takes place across North Wales Authorities. Examples of this
include the work that the North Wales Chief Planning Officers group are currently undertaking on both built and natural heritage. We have a good and close working relationship with our constituent authorities, Gwynedd and Conwy. A policy officer has recently been seconded from Denbighshire to Snowdonia to help cover for maternity leave.
6.7.3 The Wales Audit Office in their 2015 Review of National Park Authority Planning
Services entitled ‘Delivering More with Less’ recommended further collaboration between the 3 NPAs. Whilst some progress has been done on this, it is considered that more could potentially be done here.
6.7.4 Good collaboration naturally takes place between the NPAs internal departments,
although again this will be assessed over the next year to ascertain whether improvements can be achieved here, particularly as part of providing consultation responses to planning applications.
Action 3: To assess improvements that can be achieved on collaboration issues, with a particular focus on:
a) Improving our ICT systems and reviewing how we consult with external consultees
through our electronic services; b) Collaboration on Natural and Built Heritage in the Planning Process – in partnership
with all North Wales Authorities, NRW and CADW; c) Collaboration with the Planning Departments at Brecon Beacons National Park and
Pembrokeshire Coast National Park; d) Making improvements to how we consult and receive consultee responses from
internal departments.
29
7.1 Snowdonia National Park Authority’s Planning Department deals with many difficult and sometimes unique planning challenges. This work requires a good understanding of the statutory purposes of National Parks, environmental and cultural heritage designations and the fragile nature of its communities, economy and language.
7.2 The overall speed and efficiency of decision making shows improvement. It is
recognised that there is still potential to improve this. 7.3 Very few of the Authority’s applications are appealed – 9 in 2016-17, which equates
to about 1.7 per 100 applications (less than the Wales average of 2 per 100). The appeals that were upheld, was above the Government target. Through implementing a team approach and thorough scrutiny on certain decisions, we will maintain and improve on this.
7.4 The number of member made decisions against officer advice increased slightly on
last year’s figure to 18% - With improved member training, detailed committee reports this should reduce. However only 45 applications were determined by the Authority’s Planning and Access Committee.
7.5 Despite being an accessible authority to our customers, the results of our customer
service survey were slightly disappointing and we continue to try and understand why the results were not as expected.
7.6 The LDP continues to serve the Authority well, and the latest LDP Annual Monitoring
Report (AMR) to be submitted to the Welsh Government indicates that a ‘short form’ review is likely to be the most effective way forward for the Review of the LDP.
7.7 Collaboration is something that the Authority does well, although it is considered
there is further scope to improve joint working with various stakeholders – including external consultees, constituent Authorities and the other 2 Welsh National Park Authorities.
7.8 To help progress some of the issues addressed in this document, some key Actions
have been identified in the main body of the text. These are set out below:
OVERALL CONCLUSIONS

30
Action 1: Customer Satisfaction Review
SNPA to undertake an internal assessment of how customers (in particular planning applicants) are dealt with at pre- and post-application stages. Amongst other things, this will focus on the questions raised in the section above.
The results of this review are unlikely to be experienced in the 2016-17 Customer Service Survey (next year’s APR), and it is likely to be 2017-18 when the full benefits of this review are experienced.
Action 2: Performance Improvements
The Authority will assess several measures which attempt to improve performance, which will include:
a) Regular Programme of Performance Management Meetings b) Improving the way planning communicates with both external and internal
consultees c) Improving our internal systems through making better use of ICT generally
including the website d) Looking for ‘marginal gains’ in improving efficiency of the process of determining a
planning application
Action 3: To assess improvements that can be achieved on collaboration issues, with a particular focus on:
a) Improving our ICT systems and reviewing how we consult with external
consultees through our electronic services; b) Collaboration on Natural and Built Heritage in the Planning Process – in
partnership with all North Wales Authorities, NRW and CADW; c) Collaboration with the Planning Departments at Brecon Beacons National Park
and Pembrokeshire Coast National Park; d) Making improvements to how we consult and receive consultee responses
from internal departments.
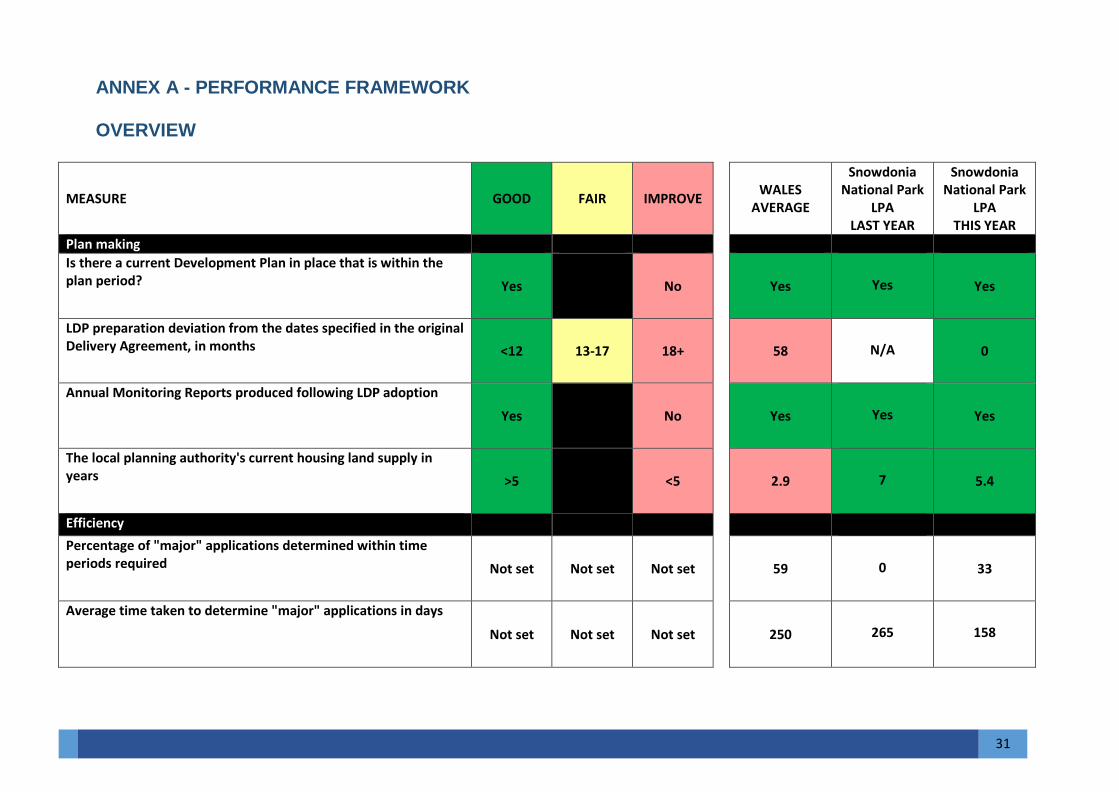
ANNEX A - PERFORMANCE FRAMEWORK
OVERVIEW
MEASURE GOOD FAIR IMPROVE
WALES
AVERAGE
Snowdonia National Park
LPA LAST YEAR
Snowdonia National Park
LPA THIS YEAR
Plan making Is there a current Development Plan in place that is within the plan period? Yes No
Yes
Yes
Yes
LDP preparation deviation from the dates specified in the original Delivery Agreement, in months <12 13-17 18+
58
N/A
0
Annual Monitoring Reports produced following LDP adoption
Yes No
Yes
Yes
Yes
The local planning authority's current housing land supply in years >5 <5
2.9
7
5.4
Efficiency Percentage of "major" applications determined within time periods required Not set Not set Not set
59
0
33
Average time taken to determine "major" applications in days
Not set Not set Not set
250
265
158
31
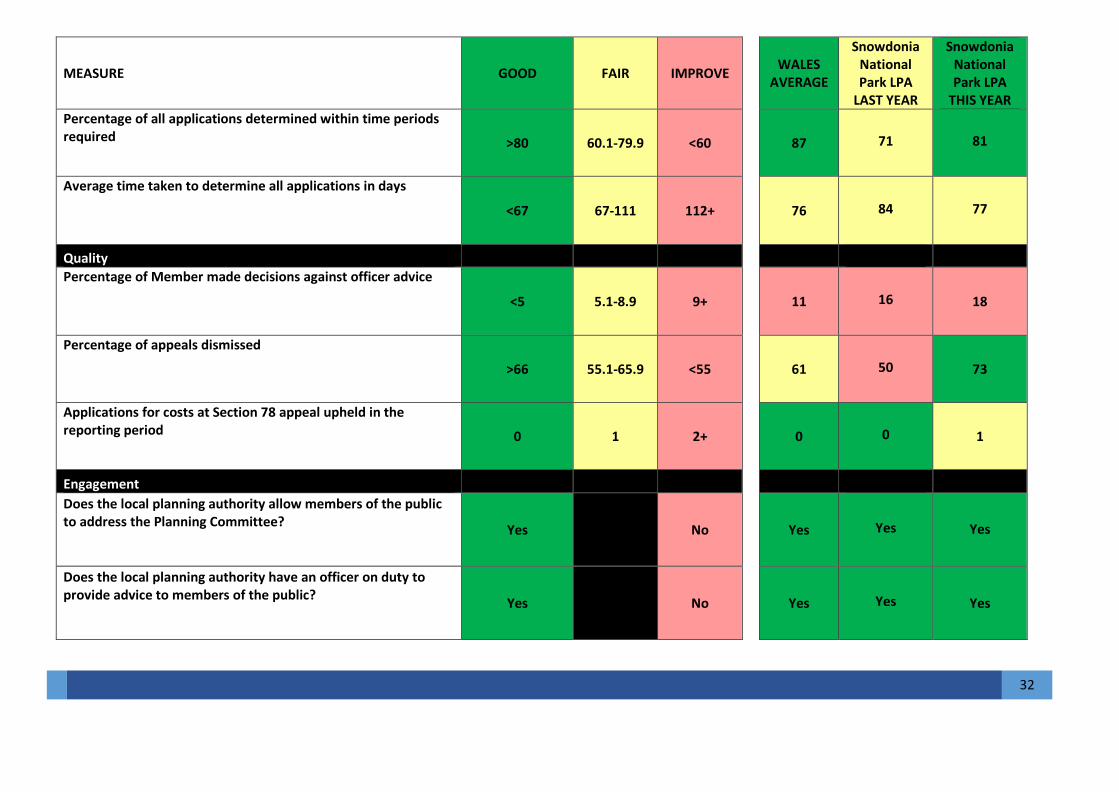
MEASURE GOOD FAIR IMPROVE
WALES
AVERAGE
Snowdonia National Park LPA
LAST YEAR
Snowdonia National Park LPA
THIS YEAR Percentage of all applications determined within time periods required >80 60.1-79.9 <60
87
71
81
Average time taken to determine all applications in days
<67 67-111 112+
76
84
77
Quality Percentage of Member made decisions against officer advice
<5 5.1-8.9 9+
11
16
18
Percentage of appeals dismissed
>66 55.1-65.9 <55
61
50
73
Applications for costs at Section 78 appeal upheld in the reporting period 0 1 2+
0
0
1
Engagement Does the local planning authority allow members of the public to address the Planning Committee?
Yes No
Yes
Yes
Yes
Does the local planning authority have an officer on duty to provide advice to members of the public?
Yes No
Yes
Yes
Yes
32
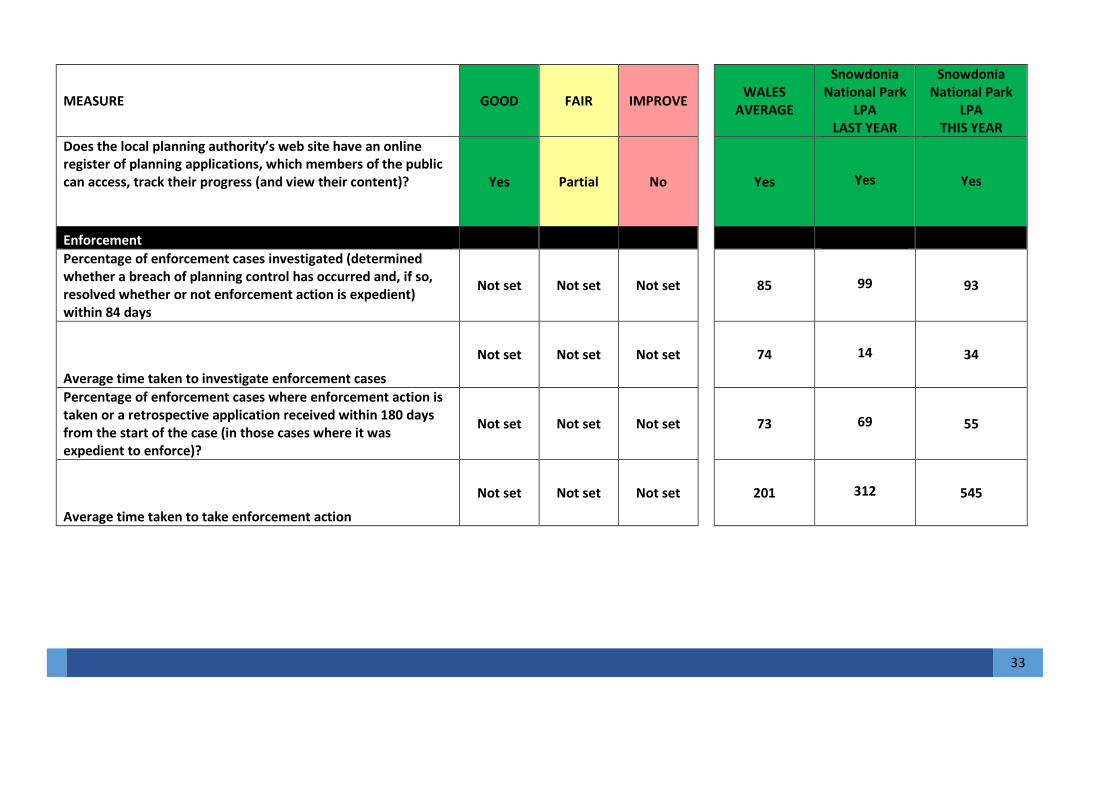
MEASURE GOOD FAIR IMPROVE
WALES
AVERAGE
Snowdonia National Park
LPA LAST YEAR
Snowdonia National Park
LPA THIS YEAR
Does the local planning authority’s web site have an online register of planning applications, which members of the public can access, track their progress (and view their content)?
Yes Partial No
Yes
Yes
Yes
Enforcement Percentage of enforcement cases investigated (determined whether a breach of planning control has occurred and, if so, resolved whether or not enforcement action is expedient) within 84 days
Not set Not set Not set
85
99
93
Average time taken to investigate enforcement cases
Not set Not set Not set
74
14
34
Percentage of enforcement cases where enforcement action is taken or a retrospective application received within 180 days from the start of the case (in those cases where it was expedient to enforce)?
Not set Not set Not set
73
69
55
Average time taken to take enforcement action
Not set Not set Not set
201
312
545
33
34
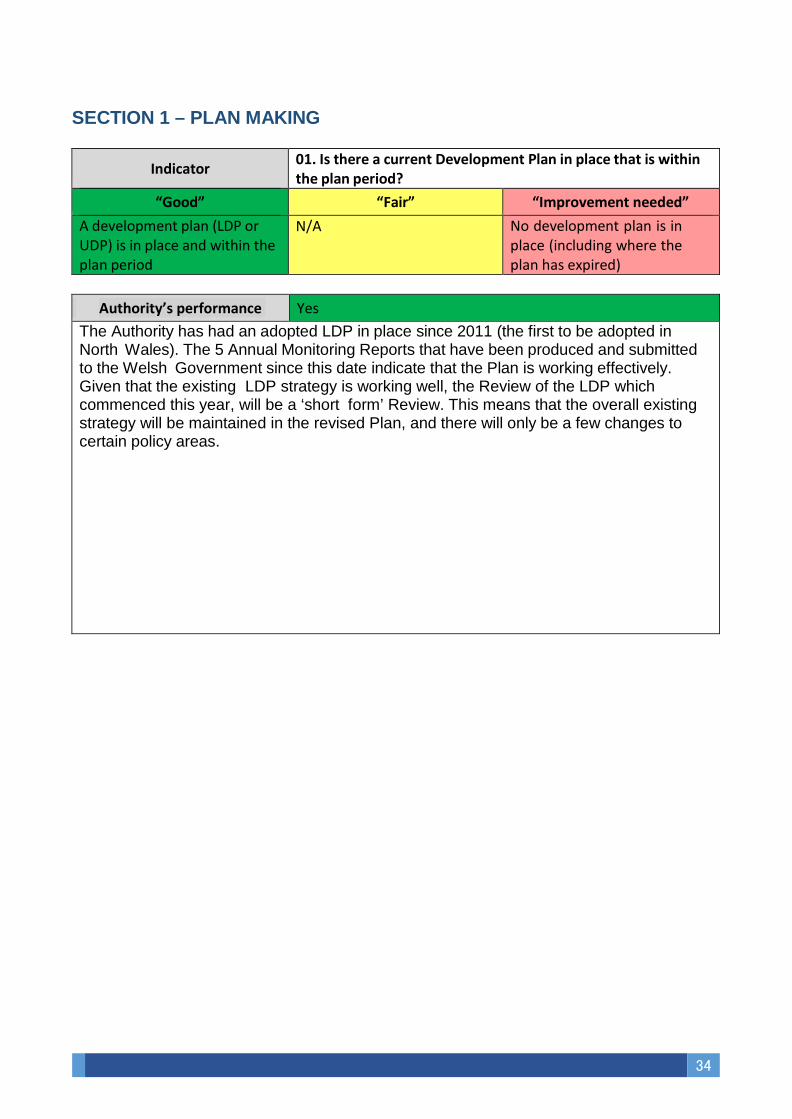
SECTION 1 – PLAN MAKING
Indicator 01. Is there a current Development Plan in place that is within the plan period? “Good” “Fair” “Improvement needed”
A development plan (LDP or UDP) is in place and within the plan period
N/A No development plan is in place (including where the plan has expired)
A u thori ty’s p er f or man ce Yes The Authority has had an adopted LDP in place since 2011 (the first to be adopted in North Wales). The 5 Annual Monitoring Reports that have been produced and submitted to the Welsh Government since this date indicate that the Plan is working effectively. Given that the existing LDP strategy is working well, the Review of the LDP which commenced this year, will be a ‘short form’ Review. This means that the overall existing strategy will be maintained in the revised Plan, and there will only be a few changes to certain policy areas.

35
Indicator 02. LDP preparation deviation from the dates specified in the original Delivery Agreement, in months
“Good” “Fair” “Improvement needed” The LDP is being progressed within 12 months of the dates specified in the original Delivery Agreement
The LDP is being progressed within between 12 and 18 months of the dates specified in the original Delivery Agreement
The LDP is being progressed more than 18 months later than the dates specified in the original Delivery Agreement
A u thori ty’s p er f or man ce N/A The Revision of the LDP is being progressed in line with the dates specified in the Delivery Agreement which was agreed with the WG in July 2016.
Indicator 03. Annual Monitoring Reports produced following LDP adoption
“Good” “Improvement needed” An AMR is due, and has been prepared
An AMR is due, and has not been prepared
Authority’s performance Yes
The Authority has submitted an AMR in each year following the adoption of the LDP, as required by the Welsh Government.

36
Indicator 04. The local planning authority's current housing land supply in years
“Good” “Improvement needed” The authority has a housing land supply of more than 5 years
The authority has a housing land supply of less than 5 years
A u thori ty’s p er f or man ce 5.4 SNPA achieve their target of having a supply of land greater than 5 years. This gives the Authority a great deal of certainty in its planning decisions, as there is no pressure to find additional land for housing needs.

37
SECTION 2 - EFFICIENCY
Indicator 05. Percentage of "major" applications determined within time periods required
“Good” “Fair” “Improvement needed” Target to be benchmarked Target to be benchmarked Target to be benchmarked
A u thori ty’s p er f or man ce 0 Only 3 major applications were received by the Authority throughout the year (1 residential development, 1 waste and 1 tourism development (none were subject to an EIA)
Whilst these were not determined within the required time scale, each application on average took 158 days (23 weeks), this is much improved on the 2015/16 result in which the average was 38 weeks. Action 3 for last year’s APR was to establish a ‘team approach’ to processing major applications. This is now effective and assists in reducing the time taken to determine major applications as is demonstrated in this year’s result. Clearly with only 3 applications it is difficult to pick out any trend.
Despite this, on the very few major applications received, it is considered that they could be determined quicker and a more structured approach is now being adopted by the Authority, with the ‘team approach’ as mentioned above and regular reviews on the progress.
38
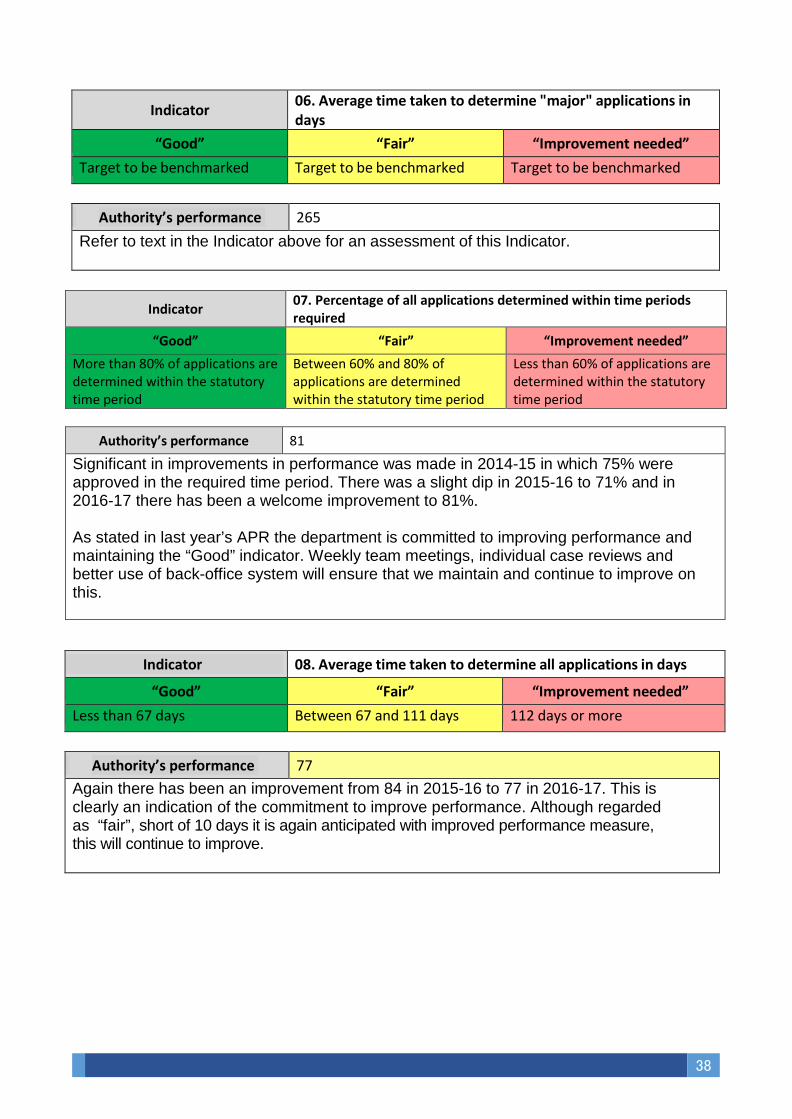
Indicator 06. Average time taken to determine "major" applications in days
“Good” “Fair” “Improvement needed” Target to be benchmarked Target to be benchmarked Target to be benchmarked
A u thori ty’s p er f or man ce 265 Refer to text in the Indicator above for an assessment of this Indicator.
Indicator 07. Percentage of all applications determined within time periods required
“Good” “Fair” “Improvement needed” More than 80% of applications are determined within the statutory time period
Between 60% and 80% of applications are determined within the statutory time period
Less than 60% of applications are determined within the statutory time period
Authority’s performance 81
Significant in improvements in performance was made in 2014-15 in which 75% were approved in the required time period. There was a slight dip in 2015-16 to 71% and in 2016-17 there has been a welcome improvement to 81%. As stated in last year’s APR the department is committed to improving performance and maintaining the “Good” indicator. Weekly team meetings, individual case reviews and better use of back-office system will ensure that we maintain and continue to improve on this.
Indicator 08. Average time taken to determine all applications in days
“Good” “Fair” “Improvement needed” Less than 67 days Between 67 and 111 days 112 days or more
A u thori ty’s p er f or man ce 77 Again there has been an improvement from 84 in 2015-16 to 77 in 2016-17. This is clearly an indication of the commitment to improve performance. Although regarded as “fair”, short of 10 days it is again anticipated with improved performance measure, this will continue to improve.
39
SECTION 3 - QUALITY
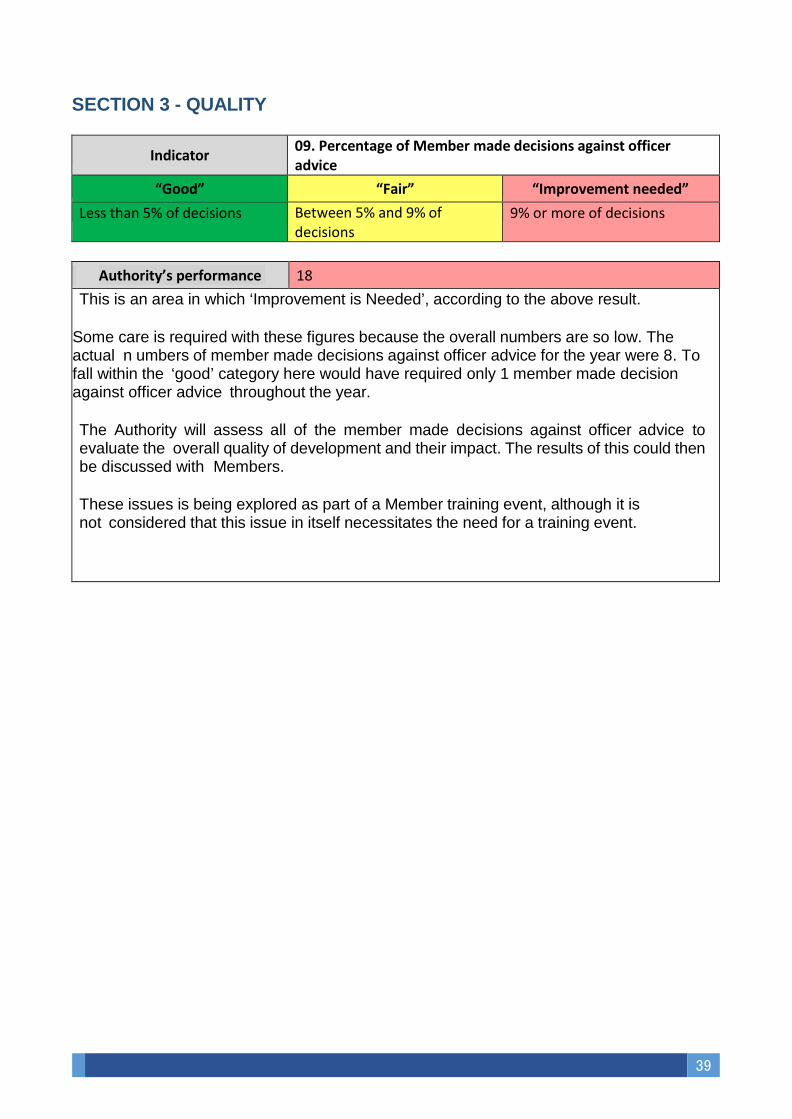
Indicator 09. Percentage of Member made decisions against officer advice
“Good” “Fair” “Improvement needed” Less than 5% of decisions Between 5% and 9% of
decisions 9% or more of decisions
A u thori ty’s p er f or man ce 18 This is an area in which ‘Improvement is Needed’, according to the above result.
Some care is required with these figures because the overall numbers are so low. The actual n umbers of member made decisions against officer advice for the year were 8. To fall within the ‘good’ category here would have required only 1 member made decision against officer advice throughout the year. The Authority will assess all of the member made decisions against officer advice to evaluate the overall quality of development and their impact. The results of this could then be discussed with Members.
These issues is being explored as part of a Member training event, although it is not considered that this issue in itself necessitates the need for a training event.
40
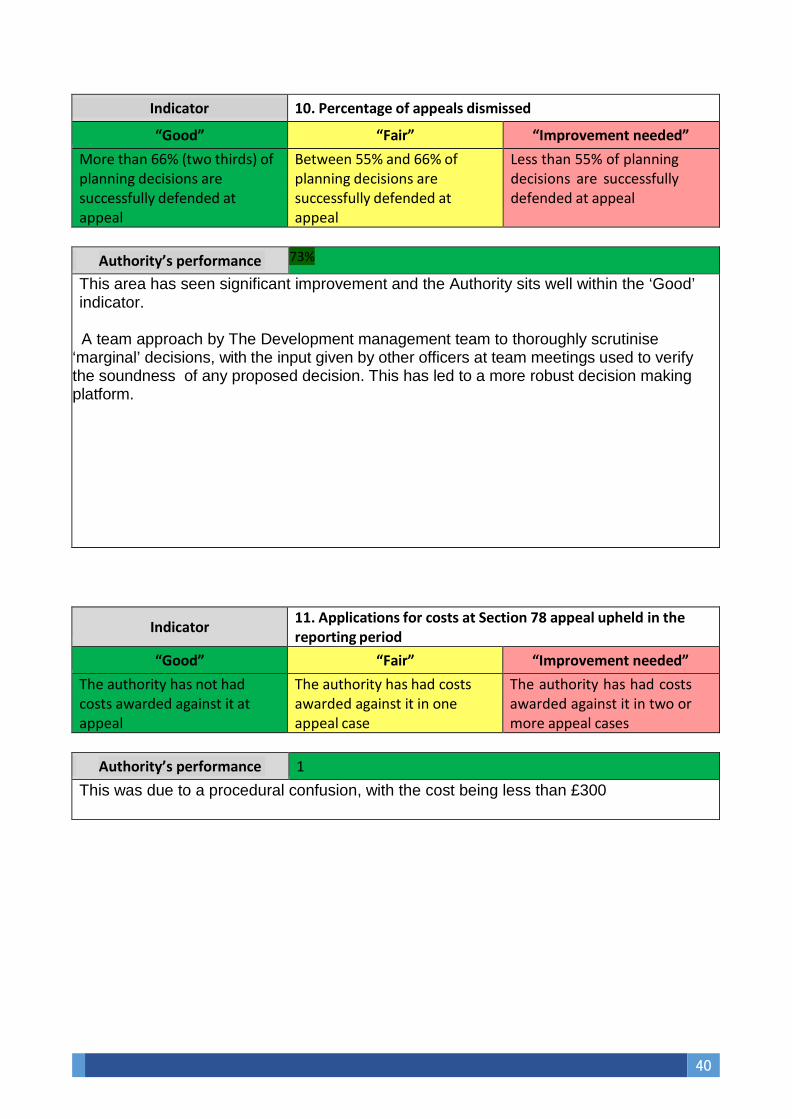
Indicator 10. Percentage of appeals dismissed
“Good” “Fair” “Improvement needed” More than 66% (two thirds) of planning decisions are successfully defended at appeal
Between 55% and 66% of planning decisions are successfully defended at appeal
Less than 55% of planning decisions are successfully defended at appeal
A u thori ty’s p er f or man ce 73%
This area has seen significant improvement and the Authority sits well within the ‘Good’ indicator.
A team approach by The Development management team to thoroughly scrutinise ‘marginal’ decisions, with the input given by other officers at team meetings used to verify the soundness of any proposed decision. This has led to a more robust decision making platform.
Indicator 11. Applications for costs at Section 78 appeal upheld in the reporting period
“Good” “Fair” “Improvement needed” The authority has not had costs awarded against it at appeal
The authority has had costs awarded against it in one appeal case
The authority has had costs awarded against it in two or more appeal cases
A u thori ty’s p er f or man ce 1 This was due to a procedural confusion, with the cost being less than £300

41
SECTION 4 – ENGAGEMENT
Indicator 12. Does the local planning authority allow members of the public to address the Planning Committee?
“Good” “Improvement needed” Members of the public are able to address the Planning Committee
Members of the public are not able to address the Planning Committee
A u thori ty’s p er f or man ce Yes The model of allowing Members of the public to speak to Committee appears to work fairly well, although as with all elements of our work we will continually review to see whether the format should be reviewed etc. However, it does not appear that anything needs to change here and the Authority propose to continue the same format.
Indicator 13. Does the local planning authority have an officer on duty to
provide advice to members of the public? “Good” “Improvement needed”
Members of the public can seek advice from a duty planning officer
There is no duty planning officer available
A u thori ty’s p er f or man ce Yes A Duty Officer is on hand to deal with customer’s queries and enquiries. SNPA has always placed a great deal of emphasis on being accessible to the customer, and always been on hand for advice.
However, despite being regarded as a ‘good’ authority in having a ‘Duty Officer’ on hand, the results of the Customer Focus Survey suggested that the level of service that we provide our customers may fall short of their expectations. Further work will be required with agents regarding the level of service that they expect, and whether the Authority can reach or even exceed these expectations.
The Planning Service will undertake an assessment to ascertain customer’s expectations throughout the planning process, and to ascertain whether these expectations can be matched or exceeded.

42
Indicator
14. Does the local planning authority’s web site have an online register of planning applications, which members of the public can access track their progress (and view their content)?
“Good” “Fair” “Improvement needed” All documents are available online
Only the planning application details are available online, and access to other documents must be sought directly
No planning application information is published online
A u thori ty’s p er f or man ce Yes Again the Authority scores ‘good’ here and applicants can track the progress of planning applications online.
There is the potential to improve the online experience for applicants and members of the public. More information could possibly be put online regarding information relating to an applicant, guidance & help regarding planning applications, and the status of live planning applications. More could potentially also be done on the use of mobile applications, and enhancing the customer experience in this way. This is now being explored with training in place and the software provider is fully aware of our requirement in this field.
However, this work requires significant assessment and investment before making any decisions, although this work has already started. Any changes that will arise from these changes to the ICT / online system at Snowdonia are unlikely to come into effect until 2017-18.
The Department to closely assess the effectiveness of the online planning system, with a view to:
- assessing the effectiveness of the information we provide to applicants and whether improvements could be made with regard to this
- providing more advice and guidance to applicants online - making better use of mobile data applications – in order to modernise the
customer experience
43
SECTION 5 – ENFORCEMENT
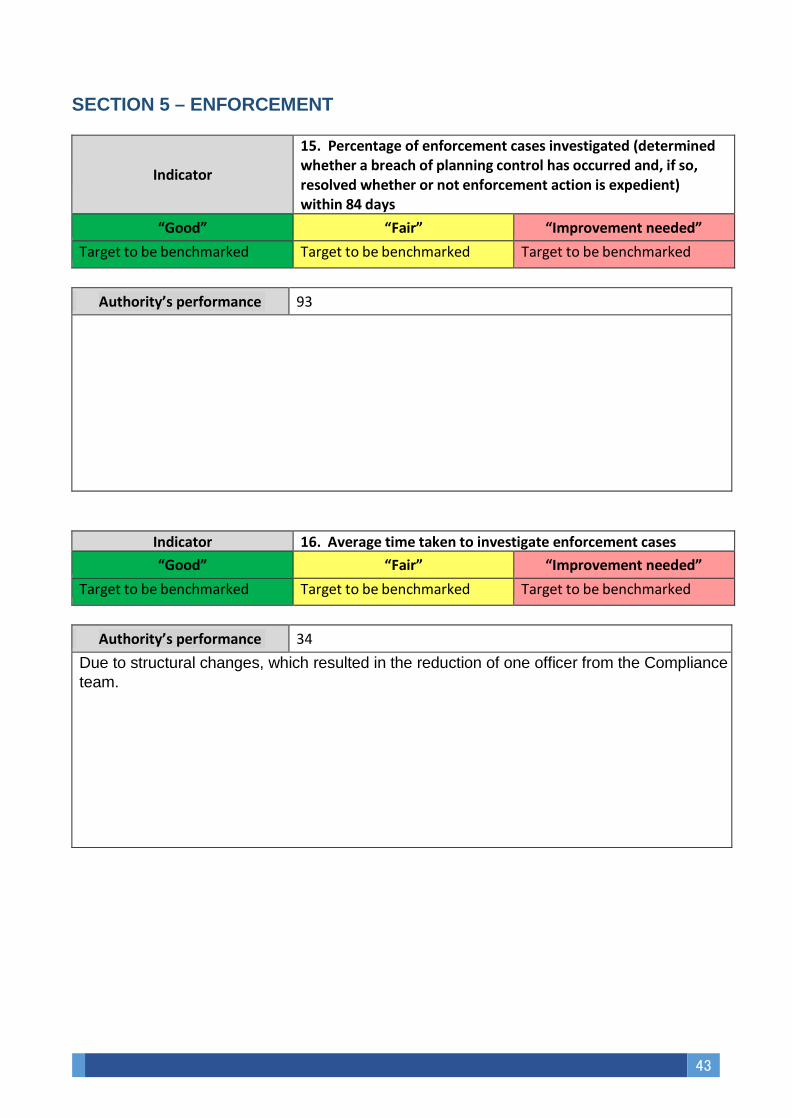
Indicator
15. Percentage of enforcement cases investigated (determined whether a breach of planning control has occurred and, if so, resolved whether or not enforcement action is expedient) within 84 days
“Good” “Fair” “Improvement needed” Target to be benchmarked Target to be benchmarked Target to be benchmarked
A u thori ty’s p er f or man ce 93
Indicator 16. Average time taken to investigate enforcement cases “Good” “Fair” “Improvement needed”
Target to be benchmarked Target to be benchmarked Target to be benchmarked
A u thori ty’s p er f or man ce 34 Due to structural changes, which resulted in the reduction of one officer from the Compliance team.
44
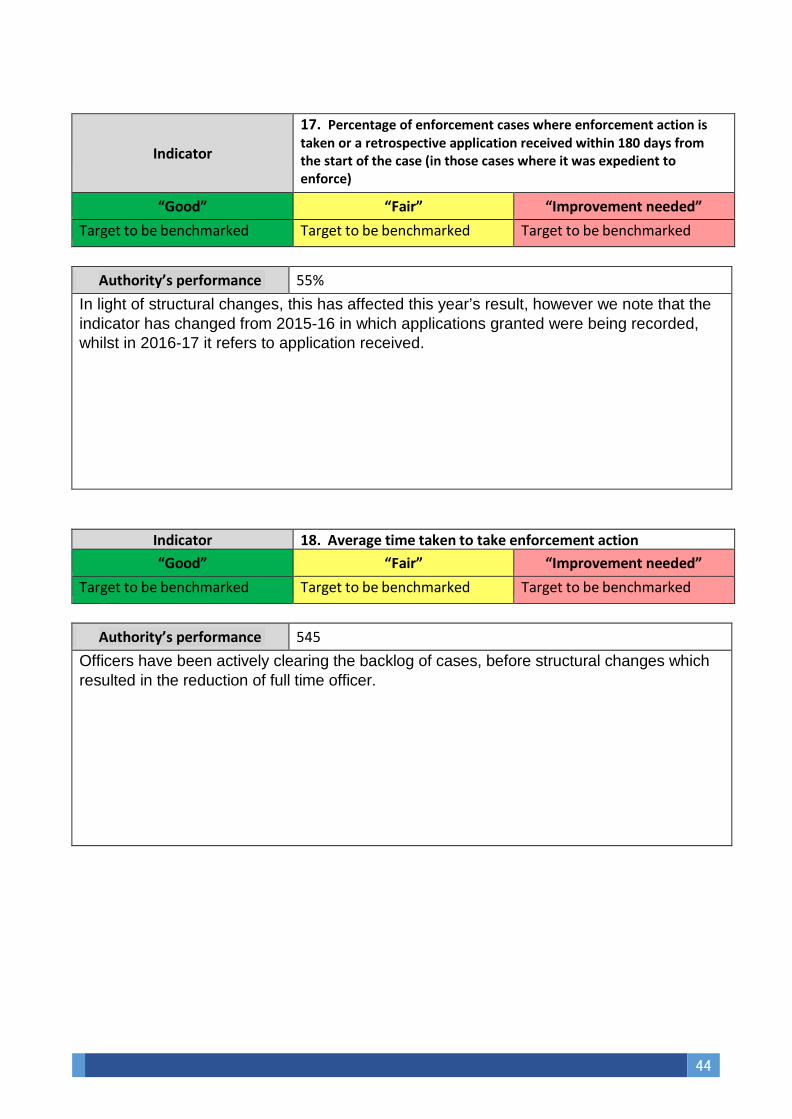
Indicator
17. Percentage of enforcement cases where enforcement action is taken or a retrospective application received within 180 days from the start of the case (in those cases where it was expedient to enforce)
“Good” “Fair” “Improvement needed” Target to be benchmarked Target to be benchmarked Target to be benchmarked
A u thori ty’s p er f or man ce 55% In light of structural changes, this has affected this year’s result, however we note that the indicator has changed from 2015-16 in which applications granted were being recorded, whilst in 2016-17 it refers to application received.
Indicator 18. Average time taken to take enforcement action “Good” “Fair” “Improvement needed”
Target to be benchmarked Target to be benchmarked Target to be benchmarked
A u thori ty’s p er f or man ce 545 Officers have been actively clearing the backlog of cases, before structural changes which resulted in the reduction of full time officer.

45
SECTION 6 – SUSTAINABLE DEVELOPMENT INDICATORS The purpose of the Sustainable Development Indicators is to measure the contribution the planning system makes to sustainable development in Wales.
The Sustainable Development Indicators will be used to measure the progress against national planning sustainability objectives, set out in Planning Policy Wales, and can be used to demonstrate to our stakeholders the role and scope of the planning system in delivering wider objectives. The information will also be useful to local planning authorities to understand more about the outcomes of the planning system and help inform future decisions.

46
Granted (square metres) A u thori ty’s data 0
Refused (square metres)
A u thori ty’s data 0
Indicator
SD1. The floorspace (square metres) granted and refusedplanning permission for new economic development onallocated employment sites during the year.
In line with the Authority’s LDP there is no allocated employment land within the National Park, and as such this Indicators is not applicable to this Authority.

47
Granted permission (number of applications) A u thori ty’s data 10
Granted permission (MW energy generation)
A u thori ty’s data 1
Indicator SD2. Planning permission granted for renewable and low carbonenergy development during the year.
There has been a reduction in the number of Hydro electric applications in 2016-17, the main source of renewable energy applications. There has been a number of applications for solar panels on commercial buildings.
Applications tend to be very small scale, and the overall contribution that they made in 2015-16 came to 2MW.

48
Market housing (number of units) A u thori ty’s data 37
Affordable housing (number of units)
A u thori ty’s data 19
Indicator SD3. The number of dwellings granted planning permissionduring the year.
The number of residential dwellings granted planning permission during 2016-17 is slightly above the target set in the Eryri Local Development Plan which suggests that the Plan is on course. The number of new consents and completions tends to fluctuate from year to year therefore very difficult to determine any specific trends. The number of affordable housing units granted planning permission is below the ambitious target figure of 26 units per annum set out in the Eryri Local Development Plan, however it is above the trigger level in the Plan.

49
Number of residential units (and also hectares of non-residential units) that DID NOT meet all TAN 15 tests which were GRANTED permission
A u thori ty’s data 0
Number of residential units (and also hectares of non-residential units) that did not meet all TAN 15 tests which were REFUSED permission on flood risk grounds
A u thori ty’s data 0
Number of residential units (and also hectares of non-residential units) that MET all TAN 15 tests which were GRANTED permission
A u thori ty’s data 6
Indicator SD4. Planning permission granted and refused for developmentin C1 and C2 floodplain areas during the year.
No development took place which did not meet the TAN 15 requirements.
50
Previously developed land (hectares) A u thori ty’s data 5
Greenfield land (hectares)
A u thori ty’s data 4
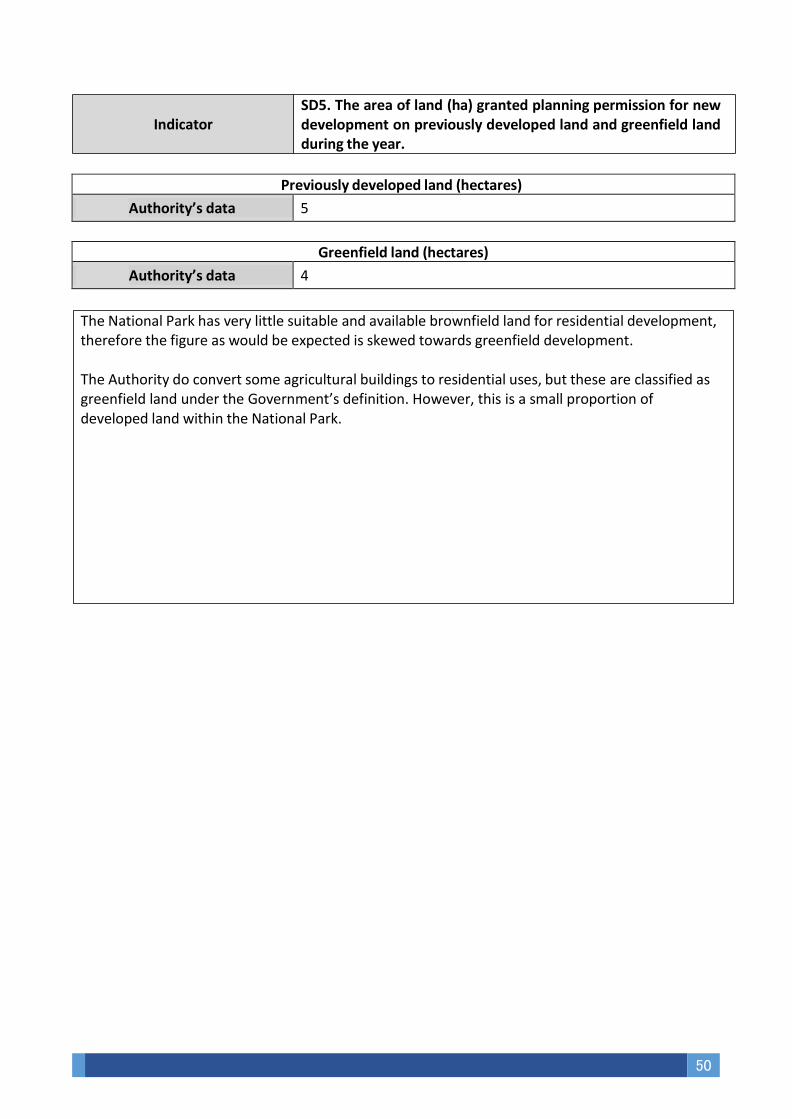
Indicator
SD5. The area of land (ha) granted planning permission for new development on previously developed land and greenfield landduring the year.
The National Park has very little suitable and available brownfield land for residential development, therefore the figure as would be expected is skewed towards greenfield development.
The Authority do convert some agricultural buildings to residential uses, but these are classified as greenfield land under the Government’s definition. However, this is a small proportion of developed land within the National Park.
51
Open space lost (hectares) A u thori ty’s data 0
Open space gained (hectares)
A u thori ty’s data 0
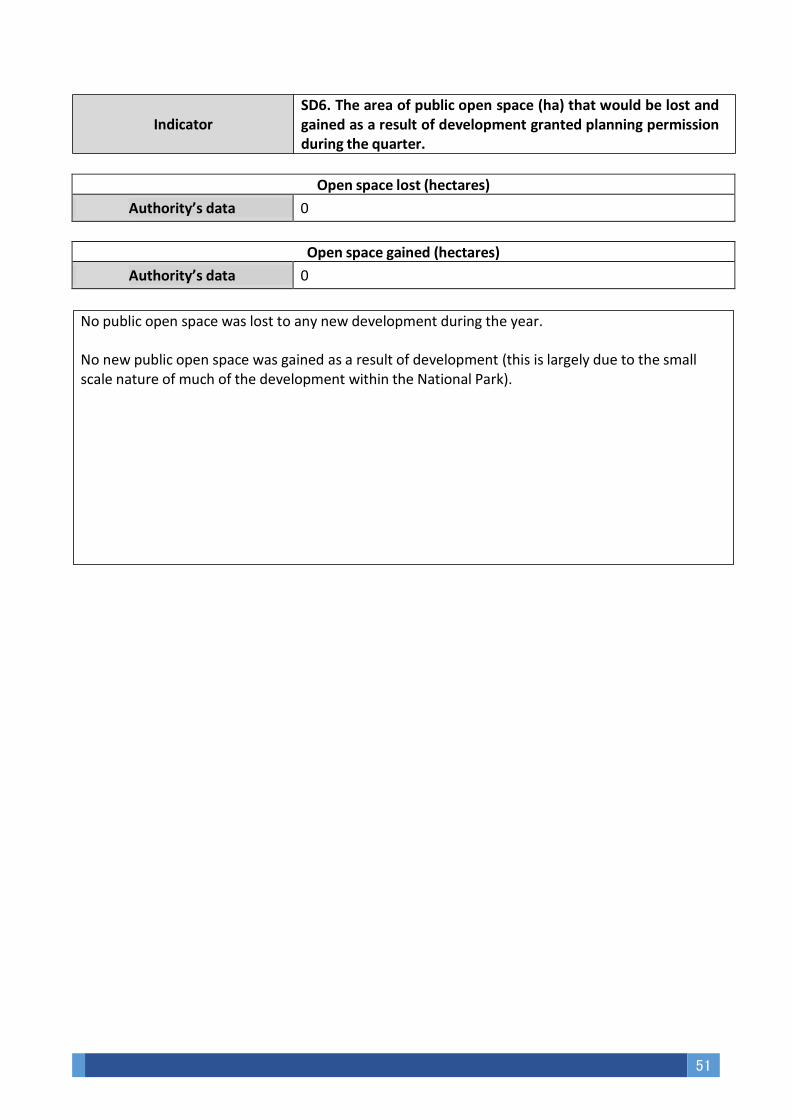
Indicator
SD6. The area of public open space (ha) that would be lost andgained as a result of development granted planning permissionduring the quarter.
No public open space was lost to any new development during the year. No new public open space was gained as a result of development (this is largely due to the small scale nature of much of the development within the National Park).

52
Gained via Section 106 agreements (£) A u thori ty’s data 0
Gained via Community Infrastructure Levy (£)
A u thori ty’s data 0
Indicator
SD7. The total financial contributions (£) agreed from new development granted planning permission during the quarter for the provision of community infrastructure.
The justification for securing new community infrastructure development through either CIL or Section 106 is difficult to make due to the small scale nature of development within the National Park, and no infrastructure was brought forward during the Plan period.
Most Section 106 legal agreements within the National Park area relate to securing local affordable housing, or securing commuted sum payments in lieu of affordable housing contributions.