Phillips 66 first Quarter Conference...
40
PHILLIPS 66 FOURTH QUARTER 2017 CONFERENCE CALL February 2, 2018
Transcript of Phillips 66 first Quarter Conference...

PHILLIPS 66FOURTH QUARTER 2017 CONFERENCE CALLFebruary 2, 2018

This presentation contains certain forward-looking statements within the meaning of Section 27A of the Securities Act of 1933, as amended, and
Section 21E of the Securities Exchange Act of 1934, as amended, which are intended to be covered by the safe harbors created thereby. Words and
phrases such as “is anticipated,” “is estimated,” “is expected,” “is planned,” “is scheduled,” “is targeted,” “believes,” “intends,” “objectives,” “projects,”
“strategies” and similar expressions are used to identify such forward-looking statements. However, the absence of these words does not mean that a
statement is not forward-looking. Forward-looking statements relating to Phillips 66’s operations (including joint venture operations) are based on
management’s expectations, estimates and projections about the company, its interests and the energy industry in general on the date this
presentation was prepared. These statements are not guarantees of future performance and involve certain risks, uncertainties and assumptions that
are difficult to predict. Therefore, actual outcomes and results may differ materially from what is expressed or forecast in such forward-looking
statements. Factors that could cause actual results or events to differ materially from those described in the forward-looking statements include
fluctuations in NGL, crude oil, petroleum products and natural gas prices, and refining, marketing and petrochemical margins; unexpected changes in
costs for constructing, modifying or operating our facilities; unexpected difficulties in manufacturing, refining or transporting our products; lack of, or
disruptions in, adequate and reliable transportation for our NGL, crude oil, natural gas and refined products; potential liability from litigation or for
remedial actions, including removal and reclamation obligations, under environmental regulations; limited access to capital or significantly higher cost
of capital related to illiquidity or uncertainty in the domestic or international financial markets; and other economic, business, competitive and/or
regulatory factors affecting Phillips 66’s businesses generally as set forth in our filings with the Securities and Exchange Commission. Phillips 66 is
under no obligation (and expressly disclaims any such obligation) to update or alter its forward-looking statements, whether as a result of new
information, future events or otherwise.
This presentation includes non-GAAP financial measures. You can find the reconciliations to comparable GAAP financial measures at the end of the
presentation materials or in the “Investors” section of our website.
CAUTIONARY STATEMENT
2

3
EXECUTING THE STRATEGY
Billings Refinery, Billings, MT
4
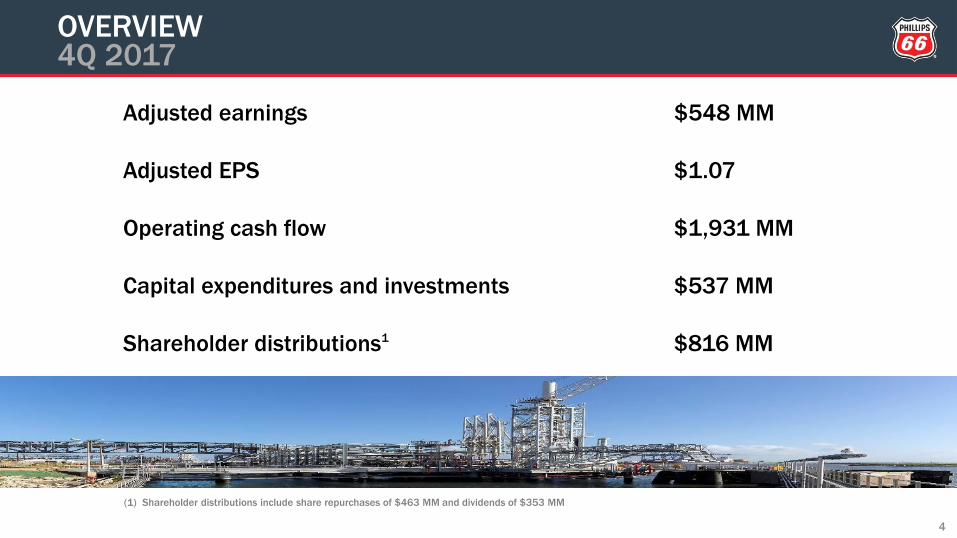
OVERVIEW4Q 2017
Adjusted earnings $548 MM
Adjusted EPS $1.07
Operating cash flow $1,931 MM
Capital expenditures and investments $537 MM
Shareholder distributions1 $816 MM
(1) Shareholder distributions include share repurchases of $463 MM and dividends of $353 MM
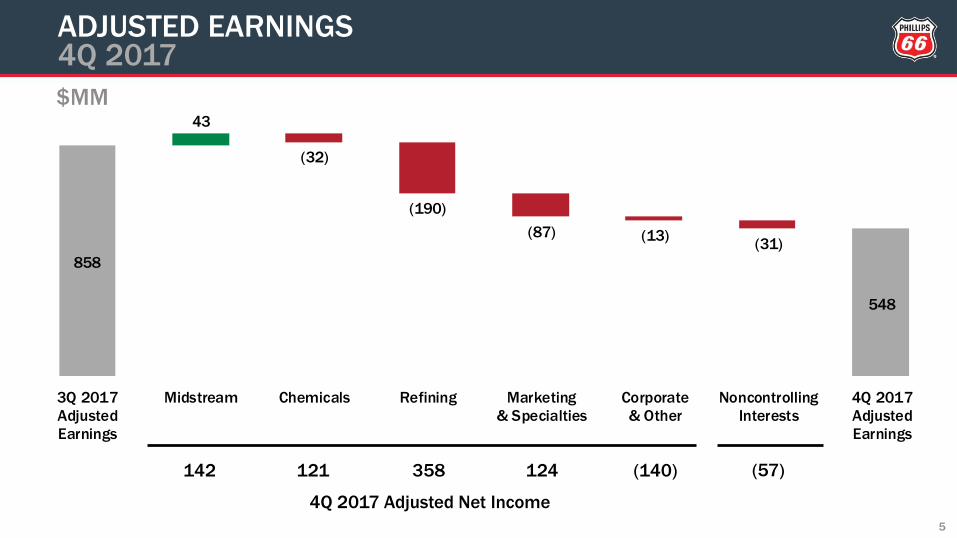
858
548
43
(32)
(190)
(87) (13)(31)
3Q 2017
Adjusted
Earnings
Midstream Chemicals Refining Marketing
& Specialties
Corporate
& Other
Noncontrolling
Interests
4Q 2017
Adjusted
Earnings
4Q 2017 Adjusted Net Income
$MM
142 (140)358121 124
ADJUSTED EARNINGS4Q 2017
5
(57)

99
142
10
20
13
3Q 2017
Adjusted
Net Income
Transportation NGL and Other DCP
Midstream
4Q 2017
Adjusted
Net Income
MIDSTREAM4Q 2017
108 20 14
4Q 2017
$MM
Completed Merey Sweeny and
Bakken Pipeline interest dropdown
to PSXP
Transportation benefited from
higher volumes
Record Sweeny Hub volumes
DCP Midstream benefited from
higher commodity prices and
volumes
6

153
121
(42)
12
(2)
3Q 2017
Adjusted
Net Income
Olefins &
Polyolefins
Specialties,
Aromatics &
Styrenics
Other 4Q 2017
Adjusted
Net Income
CHEMICALS4Q 2017
95 34 (8)
4Q 2017
$MM
79% O&P capacity utilization
Cedar Bayou hurricane recovery
New ethane cracker at Cedar
Bayou achieved mechanical
completion
SA&S improved margins and
volumes
7

548
358
(52) (5) (6)
(127)
3Q 2017
Adjusted
Net Income
Atlantic
Basin /
Europe
Gulf Coast Central
Corridor
West Coast 4Q 2017
Adjusted
Net Income
$MM
REFINING4Q 2017
8
120 19272 (26)
4Q 2017
100% crude utilization
87% clean product yield
$8.98/BBL realized margin
$99 MM pre-tax turnaround costs
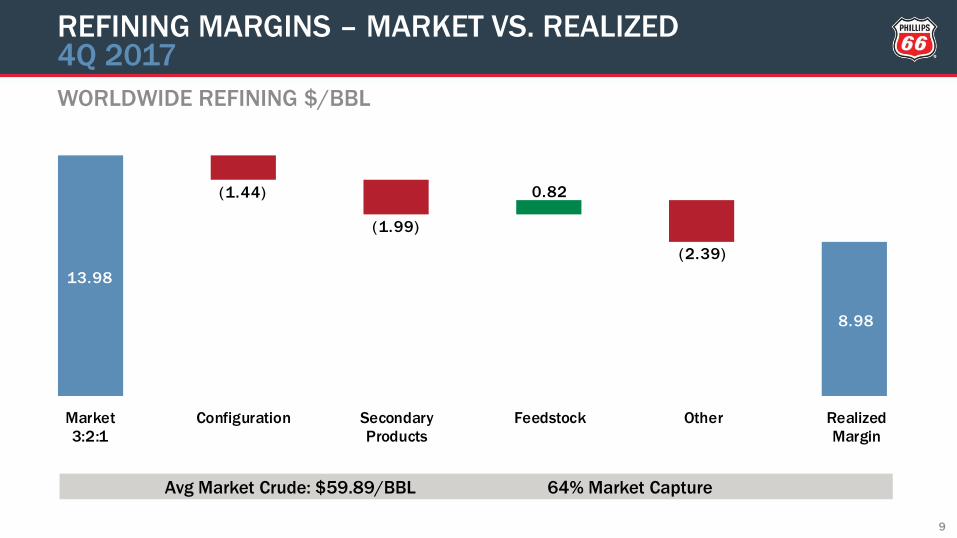
13.98
8.98
(1.44)
(1.99)
0.82
(2.39)
Market
3:2:1
Configuration Secondary
Products
Feedstock Other Realized
Margin
WORLDWIDE REFINING $/BBL
REFINING MARGINS – MARKET VS. REALIZED4Q 2017
9
Avg Market Crude: $59.89/BBL 64% Market Capture

211
124
(76)(11)
3Q 2017
Adjusted
Net Income
Marketing
& Other
Specialties 4Q 2017
Adjusted
Net Income
MARKETING AND SPECIALTIES 4Q 2017
87 37
4Q 2017
10
Marketing margins impacted by
rising prices
Seasonally lower demand
Re-imaged over 140 branded
sites
Lower base oil and finished
lubricants margins
$MM

(127)(140)
1
(14)
3Q 2017
Adjusted
Net Loss
Net Interest
Expense
Corporate
Overhead
& Other
4Q 2017
Adjusted
Net Loss
$MM
CORPORATE AND OTHER4Q 2017
11

12
OVERVIEW2017
Adjusted earnings $2.3 B
Adjusted EPS $4.38
Operating cash flow $3.6 B
Capital expenditures and investments $1.8 B
Shareholder distributions1 $3.0 B
(1) Shareholder distributions include share repurchases of $1.6 B and dividends of $1.4 B
Net-debt-to-capital ratio 20%
Adjusted ROCE 8%
PSXP equity proceeds $1.2 B
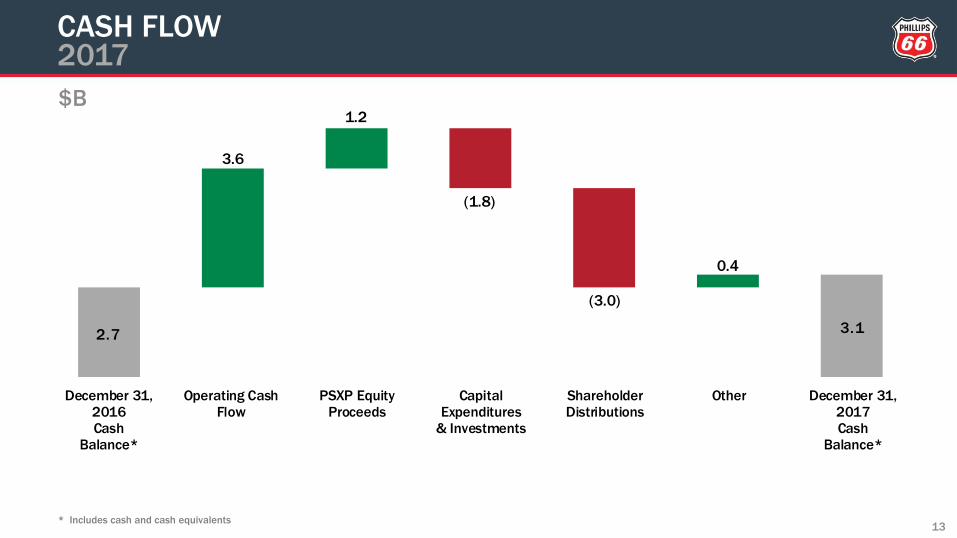
2.7 3.1
(1.8)
0.4
3.6
1.2
(3.0)
December 31,2016Cash
Balance*
Operating CashFlow
PSXP EquityProceeds
CapitalExpenditures
& Investments
ShareholderDistributions
Other December 31,2017Cash
Balance*
$B
CASH FLOW2017
13* Includes cash and cash equivalents

Global Olefins & Polyolefins utilization Mid-90%
Refining crude utilization Mid-80%
Depreciation and amortization $1.4 B
Effective income tax rate Low-to-Mid-20%
Corporate & Other costs (after-tax) $160 MM - $180 MM
Refining turnaround expenses (pre-tax) $230 MM - $260 MM
2018
Refining turnaround expenses (pre-tax) $520 MM - $570 MM
Corporate & Other costs (after-tax) $640 MM - $680 MM
1Q 2018
14
OUTLOOK

PHILLIPS 66FOURTH QUARTER 2017CONFERENCE CALL
Questions and Answers

PHILLIPS 66FOURTH QUARTER 2017CONFERENCE CALL
Appendix

Midstream - DCP (net to Phillips 66)
10¢/Gal Increase in NGL price 5
10¢/MMBtu Increase in Natural Gas price 1
$1/BBL Increase in WTI price 1
Chemicals - CPChem (net to Phillips 66)
1¢/Lb Increase in Chain Margin (Ethylene, Polyethylene, NAO) 45
Worldwide Refining
$1/BBL Increase in Gasoline Margin 260
$1/BBL Increase in Distillate Margin 230
$1/BBL Widening WTI / WCS Differential (WTI less WCS) 50
$1/BBL Widening LLS / Maya Differential 40
$1/BBL Widening LLS / Medium Sour Differential 30
$1/BBL Widening LLS / WCS Differential 25
$1/BBL Widening WTI / WTS Differential 15
$1/BBL Widening LLS / WTI Differential 10
$1/BBL Widening ANS / WTI Differential 10
$1/BBL Widening Brent / WTI Differential 5
10¢/MMBtu Increase in Natural Gas price (15)
Impacts due to Actual Crude Feedstock Differing from Feedstock Assumed in Market Indicators:
Annual Net Income $MM
ESTIMATED SENSITIVITIES2018
17Sensitivities shown above are independent and are only valid within a limited price range

23.9 23.7 23.7 23.8 24.0
27.4
23.1 22.4 22.4 22.4 22.6
25.1
8.9 10.1 10.2 10.0 10.2
10.1 7.8 7.7 7.6 7.6 7.8
7.2
3.1 2.7 1.5
2.2 1.5
3.1 3.0 2.7 1.5 2.2 1.5 2.9
27%
30% 30% 30% 30%
27%25% 26% 25% 25% 26%
22%
20%
24%
27%
25%
27%
20%
17%18%
21%
20%
22%
14%
2015 2016 1Q
2017
2Q
2017
3Q
2017
4Q
2017
2015 2016 1Q
2017
2Q
2017
3Q
2017
4Q
2017
Equity $B Debt $B Cash & Cash Equivalents $B Debt-to-Capital Net-Debt-to-Capital
CAPITAL STRUCTURE2015 – 2017
18
Consolidated PSX Excluding PSXP

13.43
8.32
(0.95) (0.11)
(2.35)
(1.70)
Market
3:2:1
Configuration Secondary
Products
Feedstock Other Realized
Margin
ATLANTIC BASIN / EUROPE $/BBL
REFINING MARGINS – MARKET VS. REALIZED4Q 2017
19
Market 3:2:1 – Dated Brent / Gasoline 83.7 RBOB NYH / Diesel 15ppm NYH
Brent: $61.39/BBL 104% Crude Capacity Utilization 62% Market Capture
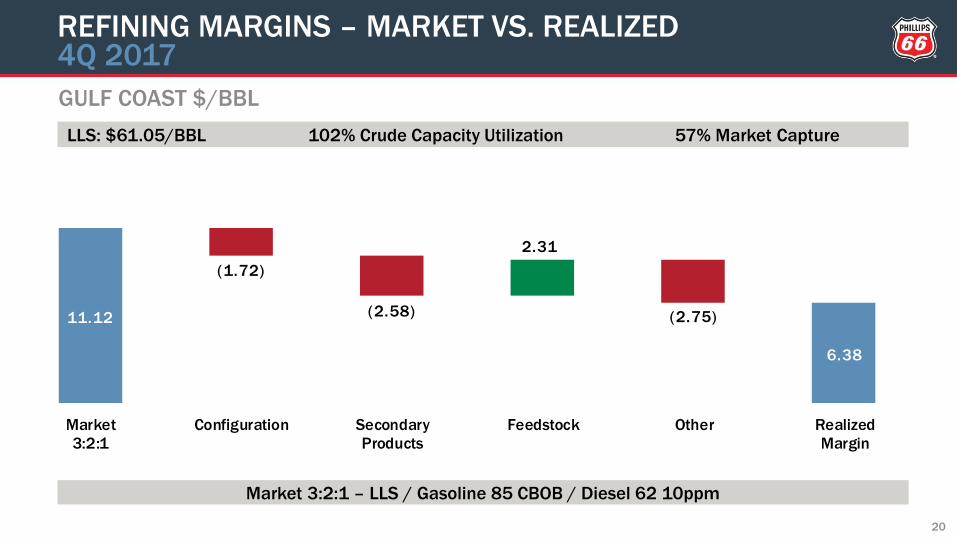
11.12
6.38
(1.72)
(2.58)
2.31
(2.75)
Market
3:2:1
Configuration Secondary
Products
Feedstock Other Realized
Margin
GULF COAST $/BBL
REFINING MARGINS – MARKET VS. REALIZED4Q 2017
20
Market 3:2:1 – LLS / Gasoline 85 CBOB / Diesel 62 10ppm
LLS: $61.05/BBL 102% Crude Capacity Utilization 57% Market Capture
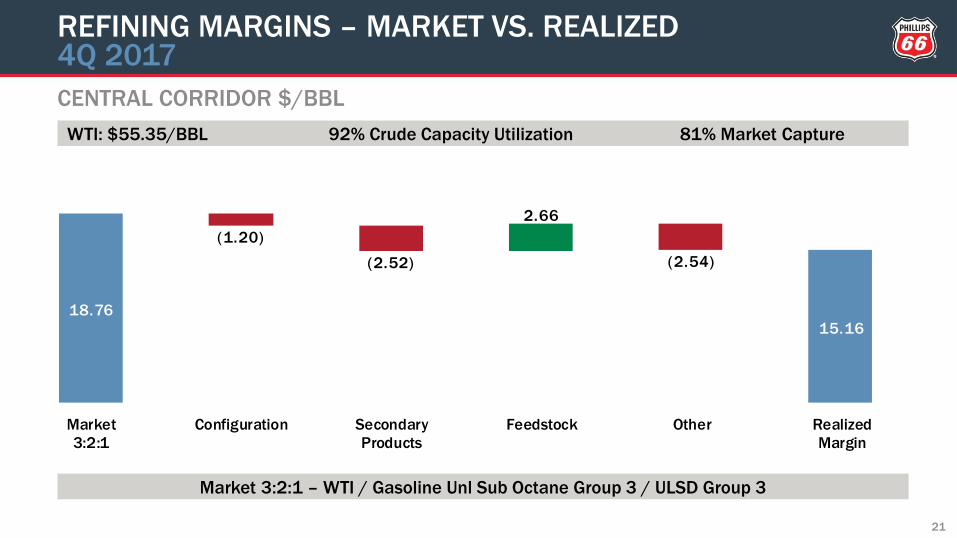
18.76
15.16
(1.20)
(2.52)
2.66
(2.54)
Market
3:2:1
Configuration Secondary
Products
Feedstock Other Realized
Margin
CENTRAL CORRIDOR $/BBL
REFINING MARGINS – MARKET VS. REALIZED4Q 2017
21
Market 3:2:1 – WTI / Gasoline Unl Sub Octane Group 3 / ULSD Group 3
WTI: $55.35/BBL 92% Crude Capacity Utilization 81% Market Capture

14.11
7.96
(1.01)
(3.46)
1.14
(2.82)
Market
3:2:1
Configuration Secondary
Products
Feedstock Other Realized
Margin
WEST COAST $/BBL
REFINING MARGINS – MARKET VS. REALIZED4Q 2017
22
Market 3:2:1 – ANS / Los Angeles CARBOB / Los Angeles No. 2 CARB
ANS: $61.52/BBL 98% Crude Capacity Utilization 56% Market Capture

83
548
73
(3)
453
(16) (16)(26)
4Q 2016
Adjusted
Earnings
Midstream Chemicals Refining Marketing
& Specialties
Corporate
& Other
Noncontrolling
Interests
4Q 2017
Adjusted
Earnings
$MM
ADJUSTED EARNINGS4Q 2017 VS. 4Q 2016
23
4Q 2017 Adjusted Net Income
142 (140)358121 124 (57)
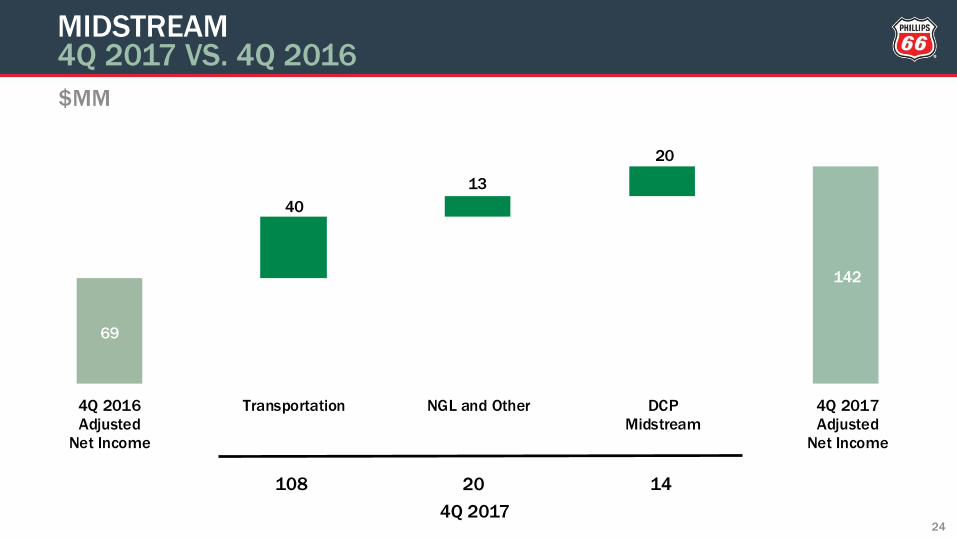
69
142
40
13
20
4Q 2016
Adjusted
Net Income
Transportation NGL and Other DCP
Midstream
4Q 2017
Adjusted
Net Income
$MM
MIDSTREAM4Q 2017 VS. 4Q 2016
24
108 20 14
4Q 2017

124 121
(10)
10
(3)
4Q 2016
Adjusted
Net Income
Olefins &
Polyolefins
Specialties,
Aromatics &
Styrenics
Other 4Q 2017
Adjusted
Net Income
$MM
CHEMICALS4Q 2017 VS. 4Q 2016
25
95 (8)34
4Q 2017

(95)
358
173
135
22
123
4Q 2016
Adjusted
Net Loss
Atlantic
Basin /
Europe
Gulf
Coast
Central
Corridor
West Coast 4Q 2017
Adjusted
Net Income
$MM
REFINING4Q 2017 VS. 4Q 2016
26
120 19272 (26)
4Q 2017

140 124
(27)
11
4Q 2016
Adjusted
Net Income
Marketing
& Other
Specialties 4Q 2017
Adjusted
Net Income
$MM
MARKETING AND SPECIALTIES4Q 2017 VS. 4Q 2016
27
87 37
4Q 2017

(124)(140)
(13) (3)
4Q 2016
Adjusted
Net Loss
Net Interest
Expense
Corporate
Overhead
& Other
4Q 2017
Adjusted
Net Loss
$MM
CORPORATE AND OTHER4Q 2017 VS. 4Q 2016
28

29
NON-GAAP RECONCILIATIONS
* We generally tax effect taxable U.S.-based special items using a combined federal and state statutory income tax rate of approximately 38 percent. Taxable special items attributable to foreign locations
likewise use a local statutory income tax rate. Nontaxable events reflect zero income tax. These events include, but are not limited to, most goodwill impairments, transactions legislatively exempt from
income tax, transactions related to entities for which we have made an assertion that the undistributed earnings are permanently reinvested, or transactions occurring in jurisdictions with a valuation
allowance.
** Weighted-average diluted shares outstanding and income allocated to participating securities, if applicable, in the adjusted earnings per share calculation are the same as those used in the GAAP diluted
earnings per share calculation.
2017
Year 4Q 3Q Year 4Q
Phillips 66
Net Income Attributable to Phillips 66 5,106$ 3,198$ 823$ 1,555$ 163$
Pre-tax Adjustments:
Pending claims and settlements (60) - (36) (117) -
Pension settlement expense 83 7 21 - -
Impairments by equity affiliates 64 31 - 95 -
Recognition of deferred logistics commitments - - - 30 -
Gain on consolidation of business (423) - - - -
Hurricane-related costs 210 140 70 - -
Equity affiliate ownership restructuring - - - 33 33
Railcar lease residual value deficiencies and related costs - - - 40 40
Certain tax impacts * (23) (23) - (32) (32)
Tax impact of adjustments * 47 (70) (20) 4 (27)
U.S. tax reform (2,735) (2,735) - - -
Other tax impacts - - - (110) (94)
Adjusted Net Income Attributable to Phillips 66 2,269$ 548$ 858$ 1,498$ 83$
Net Income Attributable to Phillips 66 Per Share of Common Stock (dollars) ** 9.85$ 6.25$ 1.60$ 2.92$ 0.31$ 2.82
Adjusted Net Income Attributable to Phillips 66 Per Share of Common Stock (dollars) ** 4.38$ 1.07$ 1.66$ 2.82$ 0.16$
Millions of Dollars
Except as Indicated
2016
30
NON-GAAP RECONCILIATIONS
Year 4Q 3Q Year 4Q
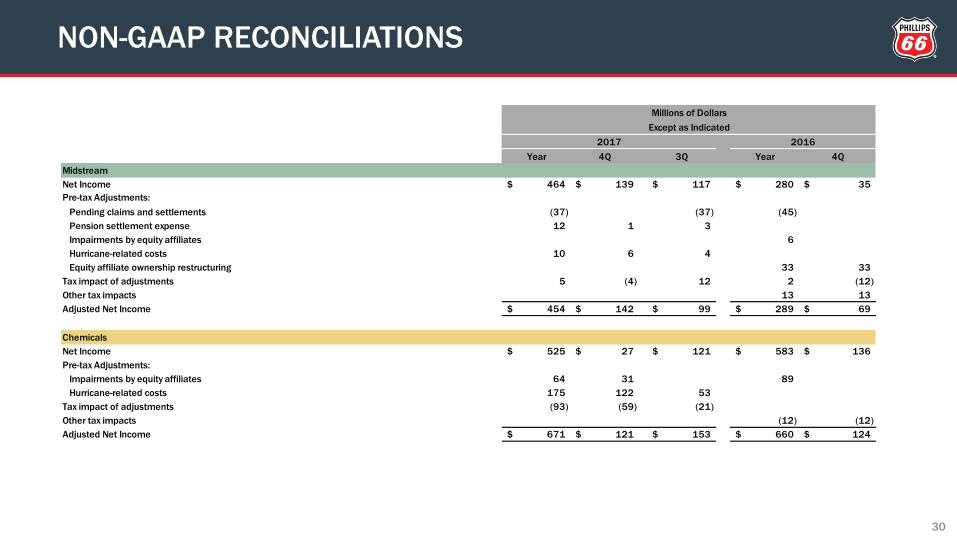
Midstream
Net Income 464$ 139$ 117$ 280$ 35$
Pre-tax Adjustments:
Pending claims and settlements (37) (37) (45)
Pension settlement expense 12 1 3
Impairments by equity affiliates 6
Hurricane-related costs 10 6 4
Equity affiliate ownership restructuring 33 33
Tax impact of adjustments 5 (4) 12 2 (12)
Other tax impacts 13 13
Adjusted Net Income 454$ 142$ 99$ 289$ 69$
Chemicals
Net Income 525$ 27$ 121$ 583$ 136$
Pre-tax Adjustments:
Impairments by equity affiliates 64 31 89
Hurricane-related costs 175 122 53
Tax impact of adjustments (93) (59) (21)
Other tax impacts (12) (12)
Adjusted Net Income 671$ 121$ 153$ 660$ 124$
2017 2016
Millions of Dollars
Except as Indicated
31
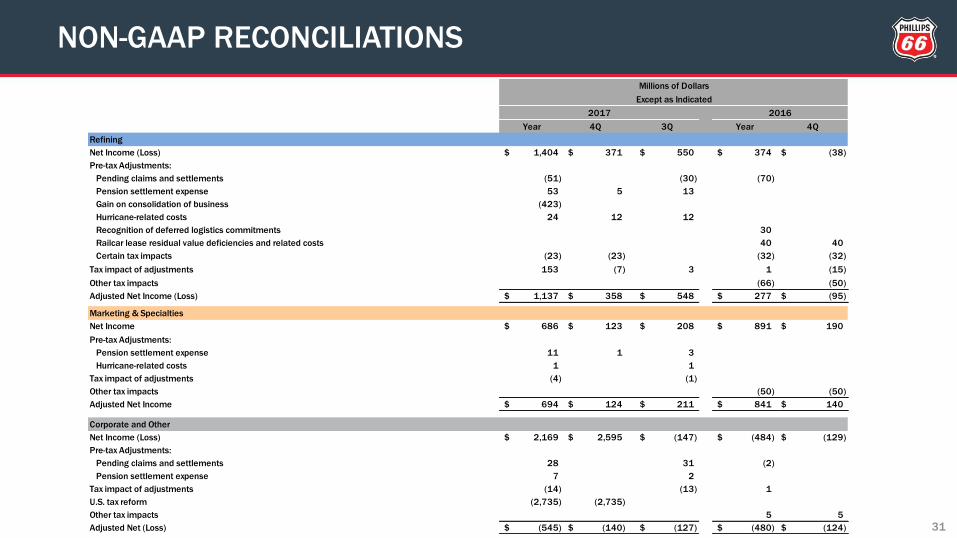
NON-GAAP RECONCILIATIONS
Year 4Q 3Q Year 4Q
Refining
Net Income (Loss) 1,404$ 371$ 550$ 374$ (38)$
Pre-tax Adjustments:
Pending claims and settlements (51) (30) (70)
Pension settlement expense 53 5 13
Gain on consolidation of business (423)
Hurricane-related costs 24 12 12
Recognition of deferred logistics commitments 30
Railcar lease residual value deficiencies and related costs 40 40
Certain tax impacts (23) (23) (32) (32)
Tax impact of adjustments 153 (7) 3 1 (15)
Other tax impacts (66) (50)
Adjusted Net Income (Loss) 1,137$ 358$ 548$ 277$ (95)$
Marketing & Specialties
Net Income 686$ 123$ 208$ 891$ 190$
Pre-tax Adjustments:
Pension settlement expense 11 1 3
Hurricane-related costs 1 1
Tax impact of adjustments (4) (1)
Other tax impacts (50) (50)
Adjusted Net Income 694$ 124$ 211$ 841$ 140$
Corporate and Other
Net Income (Loss) 2,169$ 2,595$ (147)$ (484)$ (129)$
Pre-tax Adjustments:
Pending claims and settlements 28 31 (2)
Pension settlement expense 7 2
Tax impact of adjustments (14) (13) 1
U.S. tax reform (2,735) (2,735)
Other tax impacts 5 5
Adjusted Net (Loss) (545)$ (140)$ (127)$ (480)$ (124)$
2017 2016
Millions of Dollars
Except as Indicated

32
NON-GAAP RECONCILIATIONS
Year 4Q 3Q Year 4Q
Midstream - Transportation
Net Income 376$ 105$ 119$ 311$ 70$
Pre-tax Adjustments:
Pending claims and settlements (37) (37)
Hurricane-related costs 8 5 3
Tax impact of adjustments 11 (2) 13
Other tax impacts (2) (2)
Adjusted Net Income 358$ 108$ 98$ 309$ 68$
Midstream - NGL and Other
Net Income (Loss) 43$ 20$ (3)$ 2$ 2$
Pre-tax Adjustments:
Pension settlement expense 12 1 3
Hurricane-related costs 2 1 1
Tax impact of adjustments (6) (2) (1)
Other tax impacts 5 5
Adjusted Net Income 51$ 20$ -$ 7$ 7$
Midstream - DCP Midstream
Net Income (Loss) 45$ 14$ 1$ (33)$ (37)$
Pre-tax Adjustments:
Pending claims and settlements (45)
Impairments by equity affiliates 6
Equity affiliate ownership restructuring 33 33
Tax impact of adjustments 2 (12)
Other tax impacts 10 10
Adjusted Net Income (Loss) 45$ 14$ 1$ (27)$ (6)$
Millions of Dollars
Except as Indicated
2017 2016

33
NON-GAAP RECONCILIATIONS
Year 4Q 3Q Year 4Q
Refining - Atlantic Basin / Europe
Net Income 370$ 142$ 171$ 204$ 163$
Pre-tax Adjustments:
Pending claims and settlements (7) (2)
Pension settlement expense 14 1 4
Recognition of deferred logistics commitments 30
Railcar lease residual value deficiencies and related costs 5 5
Certain tax impacts (23) (23) (32) (32)
Tax impact of adjustments (3) (1) (13) (2)
Other tax impacts (52) (36)
Adjusted Net Income 351$ 120$ 172$ 142$ 98$
Refining - Gulf Coast
Net Income (Loss) 512$ 64$ 67$ 52$ (51)$
Pre-tax Adjustments:
Pending claims and settlements (9) (2) (70)
Pension settlement expense 18 2 4
Gain on consolidation of business (423)
Hurricane-related costs 24 12 12
Railcar lease residual value deficiencies and related costs 16 16
Tax impact of adjustments 150 (6) (4) 21 (6)
Other tax impacts (10) (10)
Adjusted Net Income (Loss) 272$ 72$ 77$ 9$ (51)$
2017 2016
Millions of Dollars
Except as Indicated

34
NON-GAAP RECONCILIATIONS
Year 4Q 3Q Year 4Q
Refining - Central Corridor
Net Income 477$ 191$ 197$ 234$ 17$
Pre-tax Adjustments:
Pending claims and settlements (7) (2)
Pension settlement expense 13 2 3
Railcar lease residual value deficiencies and related costs 11 11
Tax impact of adjustments (2) (1) (4) (4)
Other tax impacts (5) (5)
Adjusted Net Income 481$ 192$ 198$ 236$ 19$
Refining - West Coast
Net Income (Loss) 45$ (26)$ 115$ (116)$ (167)$
Pre-tax Adjustments:
Pending claims and settlements (28) (24)
Pension settlement expense 8 2
Railcar lease residual value deficiencies and related costs 8 8
Tax impact of adjustments 8 8 (3) (3)
Other tax impacts 1 1
Adjusted Net Income (Loss) 33$ (26)$ 101$ (110)$ (161)$
Millions of Dollars
Except as Indicated
2017 2016

35
NON-GAAP RECONCILIATIONS
Year 4Q 3Q Year 4Q
Marketing & Specialties - Marketing & Other
Net Income 551$ 86$ 160$ 747$ 158$
Pre-tax Adjustments:
Pension settlement expense 11 1 3
Hurricane-related costs 1 1
Tax impact of adjustments (4) (1)
Other tax impacts (44) (44)
Adjusted Net Income 559$ 87$ 163$ 703$ 114$
Marketing & Specialties - Specialties
Net Income 135$ 37$ 48$ 144$ 32$
Pre-tax Adjustments:
Tax impact of adjustments
Other tax impacts (6) (6)
Adjusted Net Income 135$ 37$ 48$ 138$ 26$
Millions of Dollars
Except as Indicated
20162017

36
NON-GAAP RECONCILIATIONS
* Adjusted total processed inputs include our proportional share of processed inputs of equity affiliates.
** Net income (loss) divided by total processed inputs.
*** Realized refining margins per barrel, as presented, are calculated using the underlying realized refining margin amounts, in dollars, divided by adjusted total processed inputs, in barrels.
As such, recalculated per barrel amounts using the rounded margins and barrels presented may differ from the presented per barrel amounts due to rounding.
Atlantic
Basin/EuropeGulf Coast Central Corridor West Coast Worldwide
Realized Refining Margins
Net income (loss) 142$ 64$ 191$ (26)$ 371$
Plus:
Income tax expense (benefit) 37 29 108 (29) 145
Taxes other than income taxes 13 23 10 23 69
Depreciation, amortization and impairments 49 70 33 61 213
Selling, general and administrative expenses 16 15 10 13 54
Operating expenses 207 282 151 235 875
Equity in (earnings) losses of affiliates 2 2 (166) (162)
Other segment (income) expense, net (2) (1) 1 (2)
Proportional share of refining gross margins contributed by equity affiliates 14 325 339
Special Items:
Certain tax impacts (23) (23)
Realized refining margins 455$ 485$ 661$ 278$ 1,879$
Total processed inputs (thousands of barrels) 54,897 76,213 21,643 34,736 187,489
Adjusted total processed inputs (thousands of barrels)* 54,897 76,213 43,451 34,736 209,297
Net income (loss) (dollars per barrel)** 2.59$ 0.84$ 8.83$ (0.75)$ 1.98$
Realized refining margins (dollars per barrel)*** 8.32$ 6.38$ 15.16$ 7.96$ 8.98$
Millions of Dollars
2017
4Q
37
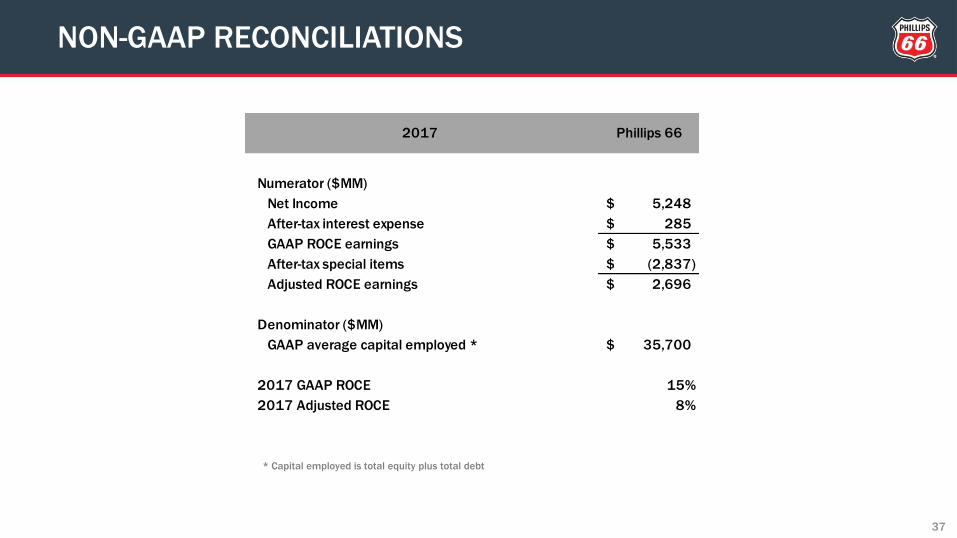
* Capital employed is total equity plus total debt
NON-GAAP RECONCILIATIONS
2017 Phillips 66
Numerator ($MM)
Net Income 5,248$
After-tax interest expense 285$
GAAP ROCE earnings 5,533$
After-tax special items (2,837)$
Adjusted ROCE earnings 2,696$
Denominator ($MM)
GAAP average capital employed * 35,700$
2017 GAAP ROCE 15%
2017 Adjusted ROCE 8%

38
NON-GAAP RECONCILIATIONS
* Phillips 66 Partners’ third-party debt and Phillips 66's noncontrolling interest attributable to Phillips 66 Partners
Phillips 66
Consolidated
Phillips 66
Partners *
Adjusted
Phillips 66
Total Debt 10,110$ 2,945$ 7,165$
Total Equity 27,428$ 2,314$ 25,114$
Debt-to-Capital Ratio 27% 22%
Total Cash & Cash Equivalents 3,119$ 185$ 2,934$
Net-Debt-to-Capital Ratio 20% 14%
2017
December 31
Millions of Dollars

39
NON-GAAP RECONCILIATIONS
Growth Sustaining Total Growth Sustaining Total
Capital Expenditures and Investments
Midstream 152$ 60$ 212$ 597$ 174$ 771$
Refining 58$ 172$ 230$ 323$ 530$ 853$
Marketing & Specialties 24$ 19$ 43$ 62$ 46$ 108$
Corporate and Other 52$ 52$ 100$ 100$
Total 234$ 303$ 537$ 982$ 850$ 1,832$
Millions of Dollars Millions of Dollars
2017 2017
4Q Year
40
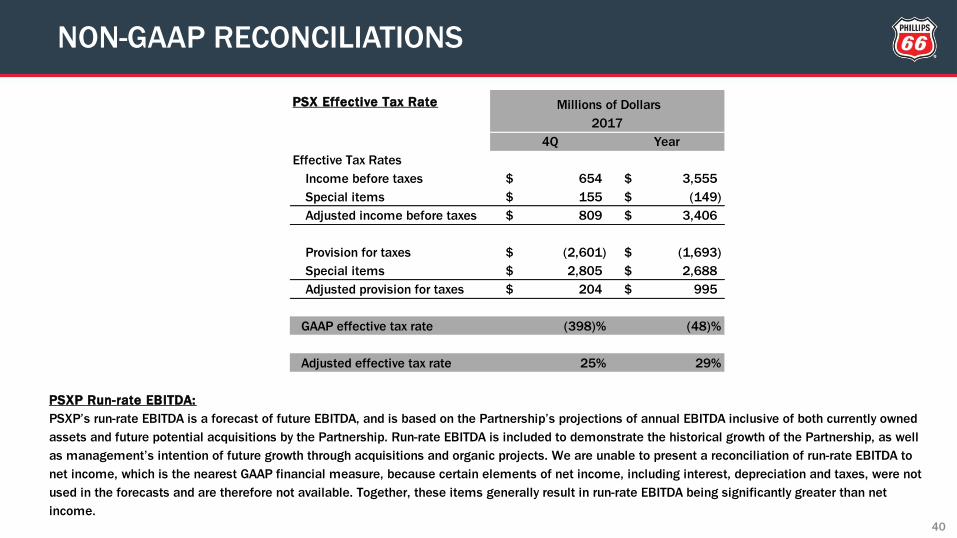
NON-GAAP RECONCILIATIONS
PSX Effective Tax Rate
4Q Year
Effective Tax Rates
Income before taxes 654$ 3,555$
Special items 155$ (149)$
Adjusted income before taxes 809$ 3,406$
Provision for taxes (2,601)$ (1,693)$
Special items 2,805$ 2,688$
Adjusted provision for taxes 204$ 995$
GAAP effective tax rate (398)% (48)%
Adjusted effective tax rate 25% 29%
PSXP Run-rate EBITDA:
PSXP’s run-rate EBITDA is a forecast of future EBITDA, and is based on the Partnership’s projections of annual EBITDA inclusive of both currently owned
assets and future potential acquisitions by the Partnership. Run-rate EBITDA is included to demonstrate the historical growth of the Partnership, as well
as management’s intention of future growth through acquisitions and organic projects. We are unable to present a reconciliation of run-rate EBITDA to
net income, which is the nearest GAAP financial measure, because certain elements of net income, including interest, depreciation and taxes, were not
used in the forecasts and are therefore not available. Together, these items generally result in run-rate EBITDA being significantly greater than net
income.
Millions of Dollars
2017