Personality Traits: A Comparison of Education and …apjee.usm.my/JPP_11_1991/Jilid 11 Artikel...
12
PENDIDIK DAN PENDIDIKAN Personality Traits: A Comparison of Education and Non-Education Students Noran Fauziah Yaakub Department of Education Faculty of Educational Studies Universiti Pertanian Malaysia Jld.11 , 1991/92 Kajian ini melaporkan profil personaliti bagi dua kumpulan pelajar; satu dari sebuah maktab perguruan dan satu lagi dari sebuah universiti. Ujian enam belas P.F. Cattell (Borang A) telah digunakan untuk mengukur trait personaliti pelajar-pelajar tersebut. Hasil kajian menunjukkan perbezaan signifikan antara pelajar maktab perguruan dan universiti bagi enam daripada enam belas faktor. Analisis meng ikut jantina menunjukkan perbezaan signifikan bag i tujuh faktor bagi pelajar lelaki dan empat faktor bagi pelajar perempuan. Profil personaliti bagi pelajar Melayu dari kedua-dua institusi menunjukkan perbezaan signifikan bagi sembilan faktor; manakala bagi pelajar Gi na, perbezaan signifikan adalah bagi tiga faktor. lntorduction Teacher personality characteristics are regarded by educationists as one of the more important variables that either facilitate or hinder the teaching process. The importance of choosing the "right" people to join teaching has been voiced by Symonds (1954: 79). He argued that good teaching was dependent upon personality factors of individuals who took up teaching as a career. Even as early as 191 0, Ruediger and Strayer reported that personality was amongst the most significant qualities of successful teachers (Montross, 1954: 73). Murray (1972) also shares the same opinion when he says that: personality influences the behaviour of the teacher in diverse areas -- interaction with students , methods selected and educational experiences chosen. (Murray, 1972: 383) . Teachers work in the open environment of classroom setting, where human contact and communication are at their maximum. The emphasis in the work of teachers, for example in primary schools is on communication, empathy, openness, and tolerance. It is therefore hypothesised that primary school teachers be more empathetic and friendly in nature. Working in a more closed office environment, such as administrators, the human contact and communication are less frequent compared to the classroom teacher. The nature of human contact is also different. If there is at all ·any human contact, it is with adults. Duties involve more paper work such as planning, writing reports and forecasting trends for the company.
Transcript of Personality Traits: A Comparison of Education and …apjee.usm.my/JPP_11_1991/Jilid 11 Artikel...
PENDIDIK DAN PENDIDIKAN
Personality Traits: A Comparison of Education and Non-Education Students
Noran Fauziah Yaakub Department of Education Faculty of Educational Studies Universiti Pertanian Malaysia
Jld.11 , 1991/92
Kajian ini melaporkan profil personaliti bagi dua kumpulan pelajar; satu dari sebuah maktab perguruan dan satu lagi dari sebuah universiti. Ujian enam belas P.F. Cattell (Borang A) telah digunakan untuk mengukur trait personaliti pelajar-pelajar tersebut. Hasil kajian menunjukkan perbezaan signifikan antara pelajar maktab perguruan dan universiti bagi enam daripada enam belas faktor. Analisis mengikut jantina menunjukkan perbezaan signifikan bagi tujuh faktor bagi pelajar lelaki dan empat faktor bagi pelajar perempuan. Profil personaliti bagi pelajar Melayu dari kedua-dua institusi menunjukkan perbezaan signifikan bagi sembilan faktor; manakala bagi pelajar Gina, perbezaan signifikan adalah bagi tiga faktor.
lntorduction
Teacher personality characteristics are regarded by educationists as one of the more important variables that either facilitate or hinder the teaching process. The importance of choosing the "right" people to join teaching has been voiced by Symonds (1954: 79). He argued that good teaching was dependent upon personality factors of individuals who took up teaching as a career. Even as early as 191 0, Ruediger and Strayer reported that personality was amongst the most significant qualities of successful teachers (Montross, 1954: 73). Murray (1972) also shares the same opinion when he says that:
personality influences the behaviour of the teacher in diverse areas -- interaction with students, methods selected and educational experiences chosen. (Murray, 1972: 383).
Teachers work in the open environment of classroom setting, where human contact and communication are at their maximum. The emphasis in the work of teachers, for example in primary schools is on communication, empathy, openness, and tolerance. It is therefore hypothesised that primary school teachers be more empathetic and friendly in nature.
Working in a more closed office environment, such as administrators, the human contact and communication are less frequent compared to the classroom teacher. The nature of human contact is also different. If there is at all ·any human contact, it is with adults. Duties involve more paper work such as planning, writing reports and forecasting trends for the company.
Personality Traits 51
The importance of selecting prospective teachers with the desired personality traits is explicitly stated in Clause 287.1 of the Cabinet Report (Laporan, 1980: 146). In response to the suggestion made in this Report, the Teacher Education Division (TED) of the Ministry of Education gives a weightage of 37 percent to the personality component of the written aptitude test and another 27 percent during the interview for selection of new teacher trainees.
Six major aspects of personality are elicited. in the written aptitude test, that is, self-concept, self-development, attitude, behaviour, hobbies, values and flexibility in adjustment with society in stressful situations. In the interview, five areas of personality are assessed, namely, leadership quality, confidence, sensitivity, general knowledge on some current issues and respect for others.
Comparative studies on students' personality attributes have received some attention from researchers. The findings of these studies provide a wealth of information to teachers and administrators; such information will certainly enable teacher educators to understand their students better. For example, Ryans (1967) indicated that desired charactristics for elementary school teachers were warmth, being child-centred and emotional stability. The results of Hoover's study (1979) showed assertion and tough-mindedness to be correlated with teaching performance. Tarpey (1965) found conscientiousness to be positively correlated with teaching practice performance. McClain (1968) reported warmth, intelligence and extraversion to be good predictors of teaching performance.
A Malaysian study on student personality characteristics was conducted by Koay (1979). In her study, Koay analyzed personality patterns of student teachers in two Teacher's Training College and the University of Malaya. Koay's study was carried out with the objective of getting a personality profile of these two groups of students.
One of her conclusions was that the student teachers of her study do possess some of the traits deemed desirable for teachers as reported by various researchers though on a marginal level. These trails are self-sufficency, resourcefulness, couscientiousness, systematic and planful, self-control. However, Malaysian student teacher personality appears to lack some other vital traits like emotional stability and dominance. They tend to be easily upset, to worry, to be anxious and tensed, and also lack adaptability traits. Instead the sample possess the undesirable traits of suspiciousness and jealousy, not trusting and easy to get along with, and is less generous in appraisals of behaviour and motives of others. Generally, Koay's study showed that the university students group as a whole, possess a much more wholesome and better adjusted personality than teachers from the two teacher trainning colleges.
This study was undertaken with the purpose of deriving a personality profile of a group of Malaysian teacher trainees and examining the extent to which they possess those traits regarded as desirable for successful teaching as reported by some researchers. This study will also try to ascertain if there exists any marked difference between two groups of students, namely, those who choose teaching as a career and those who seek other professions. In addition, this study also seeks to identify a set of personality attributes of these two groups of students in terms of demographic variables of gender and ethnicity.
52 Noran Fauziah Yaakub
Method
Subjects
Subjects for the study were 321 male and female students from a Teachers Training College and Universiti Utara Malaysia. There were altogether 21 0 students from the Teachers Training College and 111 students from the Universiti Utara Malaysia. Data on students from the Teachers Training College were collected in September 1986. These education students were in the fourth semester of their teacher education programme. Data from the Universiti Utara Malaysia were collected from a group of first year students majoring in Economics, who were enrolled in Introductory Sociology taught by the author for the July 1987/88 academic year. Both groups of students were of about the same age group, i.e., twenty years.
Instrumentation
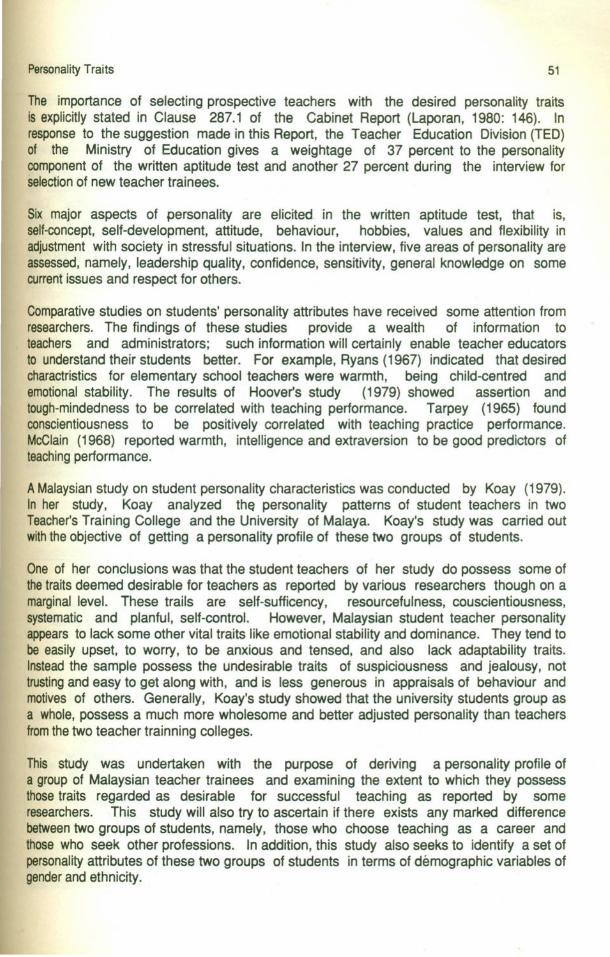
Form A of Cattell's 16 Personality Factor (16 P.F.) Test was used to measure personality traits of the teacher trainees. The 16 P.F. was developed by Cattell et. al. (1950) after extensive research over a period of three decades. Cattell et. al. concluded that there were approximately 16 source traits on which people could be compared. The Cattell instrument consists of 187 items which can be reduced to 16 "factors" (or personality traits) by following a scoring scheme devised by the developers of the instrument. The 16 personality traits are given Table 1, as follows:
Table 1 : List of Cattell's Sisteen Personality Factors
Traits Low Score vs High Score Factor A reversed vs outgoing Factor B less intelligent vs more intelligent Factor C affected by feelings vs emotionally stable Factor E humble vs assertive Factor F sober vs happy-go-lucky Factor G expedient vs conscientious Factor H shy vs venturesome Factor I tough-minded vs tender-minded Factor L trusting vs suspicious Factor M conventional vs imaginative Factor N simplicity vs sophistication Factor 0 placid VS apprenhensive Factor 01 conservative vs experimenting Factor 02 group dependent vs self-sufficient Factor 03 casual vs controlled Factor 04 relaxed VS tensed
The test-retest reliability of the 16 P .F. ranges from 0. 70 to 0.90 if the interval is just over a few days. However, the correlations between test and retest scores two months later range from 0.63 to 0.88 with a median of 0.78.
Personality Traits 53
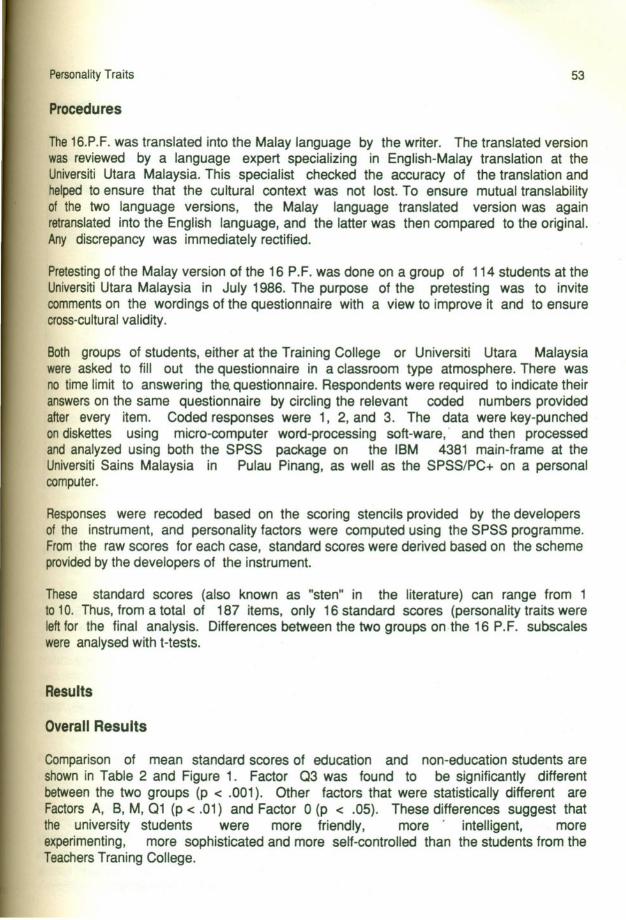
Procedures
The 16.P.F. was translated into the Malay language by the writer. The translated version was reviewed by a language expert specializing in English-Malay translation at the Universiti Utara Malaysia. This specialist checked the accuracy of the translation and helped to ensure that the cultural context was not lost. To ensure mutual translability of the two language versions, the Malay language translated version was again retranslated into the English language, and the latter was then compared to the original. Any discrepancy was immediately rectified.
Pretesting of the Malay version of the 16 P. F. was done on a group of 114 students at the Universiti Utara Malaysia in July 1986. The purpose of the pretesting was to invite comments on the wordings of the questionnaire with a view to improve it and to ensure cross-cultural validity.
Both groups of students, either at the Training College or Universiti Utara Malaysia were asked to fill out the questionnaire in a classroom type atmosphere. There was no time limit to answering the. questionnaire. Respondents were required to indicate their answers on the same questionnaire by circling the relevant coded numbers provided after every item. Coded responses were 1, 2, and 3. The data were key-punched on diskettes using micro-computer word-processing soft-ware, · and then processed and analyzed using both the SPSS package on the IBM 4381 main-frame at the Universiti Sains Malaysia in Pulau Pinang, as well as the SPSS/PC+ on a personal computer.
Responses were receded based on the scoring stencils provided by the developers of the instrument, and personality factors were computed using the SPSS programme. From the raw scores for each case, standard scores were derived based on the scheme provided by the developers of the instrument.
These standard scores (also known as "sten" in the literature) can range from 1 to 1 0. Thus, from a total of 187 items, only 16 standard scores (personality traits were left for the final analysis. Differences between the two groups on the 16 P.F. subscales were analysed with t-tests.
Results
Overall Results
Comparison of mean standard scores of education and non-education students are shown in Table 2 and Figure 1. Factor 03 was found to be significantly different between the two groups (p < .001 ). Other factors that were statistically different are Factors A, B, M, 01 (p < .01) and Factor 0 (p < .05). These differences suggest that the university students were more friendly, more · intelligent, more experimenting, more sophisticated and more self-controlled than the students from the Teachers Traning College.
54 Noran Fauziah Yaakub
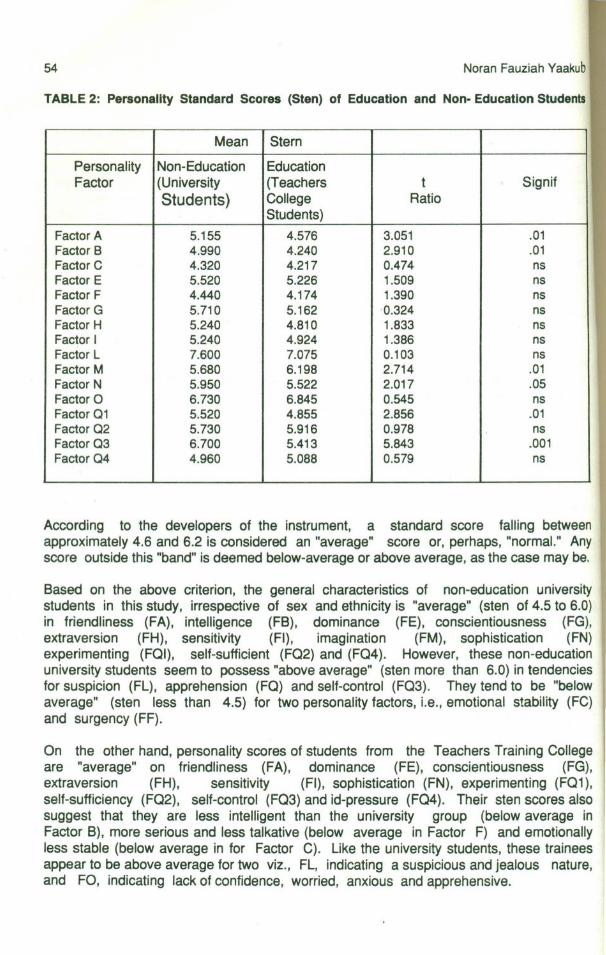
TABLE 2: Personality Standard Scores (Sten) of Education and Non- Education Students
Mean Stern Personality Non-Education Education Factor (University (Teachers t Sign if
Students) College Ratio Students)
Factor A 5.155 4.576 3.051 .01 Factor 8 4.990 4.240 2.910 .01 Factor C 4.320 4.217 0.474 ns Factor E 5.520 5.226 1.509 ns Factor F 4.440 4.174 1.390 ns Factor G 5.710 5.162 ·0.324 ns Factor H 5.240 4.810 1.833 ns Factor I 5.240 4.924 1.386 ns Factor L 7.600 7.075 0.103 ns Factor M 5.680 6.198 2.714 .01 Factor N 5.950 5.522 2.017 .05 Factor 0 6.730 6.845 0.545 ns Factor 01 5.520 4.855 2.856 .01 Factor 02 5.730 5.916 0.978 ns Factor 03 6.700 5.413 5.843 .001 Factor 04 4.960 5.088 0.579 ns
According to the developers of the instrument, a standard score falling between approximately 4.6 and 6.2 is considered an "average" score or, perhaps, "normal." Any score outside this "band" is deemed below-average or above average, as the case may be.
Based on the above criterion, the general characteristics of non-education university students in this study, irrespective of sex and ethnicity is "average" (sten of 4.5 to 6.0) in friendliness (FA), intelligence (FB), dominance (FE), conscientiousness (FG), extraversion (FH), sensitivity (FI) , imagination (FM), sophistication (FN) experimenting (FQI), self-sufficient (FQ2) and (FQ4). However, these non-education university students seem to possess "above average" (sten more than 6.0) in tendencies for suspicion (FL), apprehension (FQ) and self-control (FQ3). They tend to be "below average" (sten less than 4.5) for two personality factors, i.e., emotional stability (FC) and surgency (FF).
On the other hand, personality scores of students from the Teachers Training College are "average" on friendliness (FA), dominance (FE), conscientiousness (FG), extraversion (FH), sensitivity (FI), sophistication (FN), experimenting (FQ1 ), self-sufficiency (FQ2), self-control (FQ3) and id-pressure (FQ4). Their sten scores also suggest that they are less intelligent than the university group (below average in Factor B), more serious and less talkative (below average in Factor F) and emotionally less stable (below average in for Factor C). Like the university students, these trainees appear to be above average for two viz., FL, indicating a suspicious and jealous nature, and FO, indicating lack of confidence, worried, anxious and apprehensive.
Personality Traits 55
Personality by Ethnlclty
The t-test was also used to compare the non-education (university) students with education (Teachers Traomomg College) students within each ethnic group, except that no comparison was made for the Indians because of the small number of Indian students in the university group.
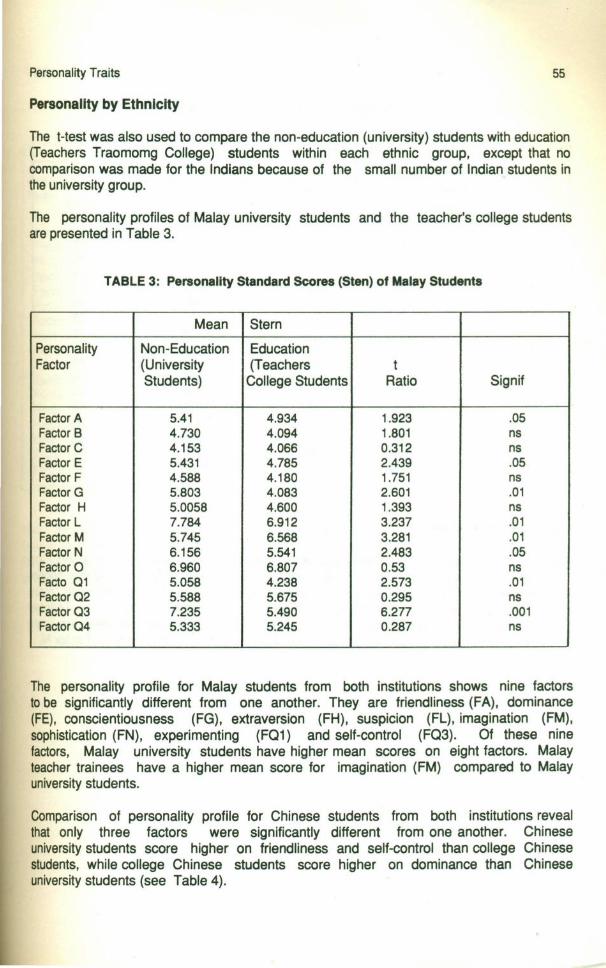
The personality profiles of Malay university students and the teacher's college students are presented in Table 3.
TABLE 3: Personality Standard Scores (Sten) of Malay Students
Mean Stern
Personality Non-Education Education Factor (University (Teachers t
Students) College Students Ratio Sign if
Factor A 5.41 4.934 1.923 .05 Factor B 4.730 4.094 1.801 ns Factor C 4.153 4.066 0.312 ns Factor E 5.431 4.785 2.439 .05 Factor F 4.588 4.180 1.751 ns Factor G 5.803 4.083 2.601 .01 Factor H 5.0058 4.600 1.393 ns Factor L 7.784 6.912 3.237 .01 Factor M 5.745 6.568 3.281 .01 Factor N 6.156 5.541 2.483 .05 Factor 0 6.960 6.807 0.53 ns Facto 01 5.058 4.238 2.573 .01 Factor 02 5.588 5.675 0.295 ns Factor 03 7.235 5.490 6.277 .001 Factor 04 5.333 5.245 0.287 ns
The personality profile for Malay students from both institutions shows nine factors to be significantly different from one another. They are friendliness (FA), dominance (FE), conscientiousness (FG), extraversion (FH), suspicion (FL), imagination (FM), sophistication (FN), experimenting (FQ1) and self-control (FQ3). Of these nine factors, Malay university students have higher mean scores on eight factors. Malay teacher trainees have a higher mean score for imagination (FM) compared to Malay university students.
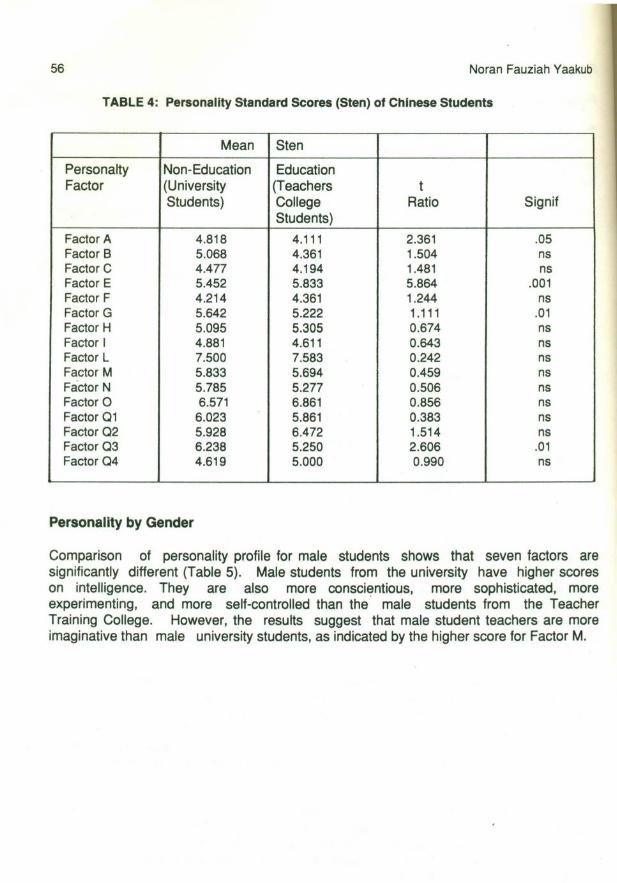
Comparison of personality profile for Chinese students from both institutions reveal that only three factors were significantly different from one another. Chinese university students score higher on friendliness and self-control than college Chinese students, while college Chinese students score higher on dominance than Chinese university students (see Table 4).
56 Noran Fauziah Yaakub
TABLE 4: Personality Standard Scores (Sten) of Chinese Students
Mean Sten Personalty Non-Education Education Factor (University (Teachers t
Students) College Ratio Signif Students)
Factor A 4.818 4.111 2.361 .05 Factor B 5.068 4.361 1.504 ns Factor C 4.477 4.194 1.481 ns Factor E 5.452 5.833 5.864 .001 Factor F 4.214 4.361 1.244 ns Factor G 5.642 5.222 1.111 .01 Factor H 5.095 5.305 0.674 ns Factor I 4.881 4.611 0.643 ns Factor L 7.500 7.583 0.242 ns Factor M 5.833 5.694 0.459 ns Factor N 5.785 5.277 0.506 ns Factor 0 6.571 6.861 0.856 ns Factor 01 6.023 5.861 0.383 ns Factor 02 5.928 6.472 1.514 ns Factor 03 6.238 5.250 2.606 .01 Factor 04 4.619 5.000 0.990 ns
Personality by Gender
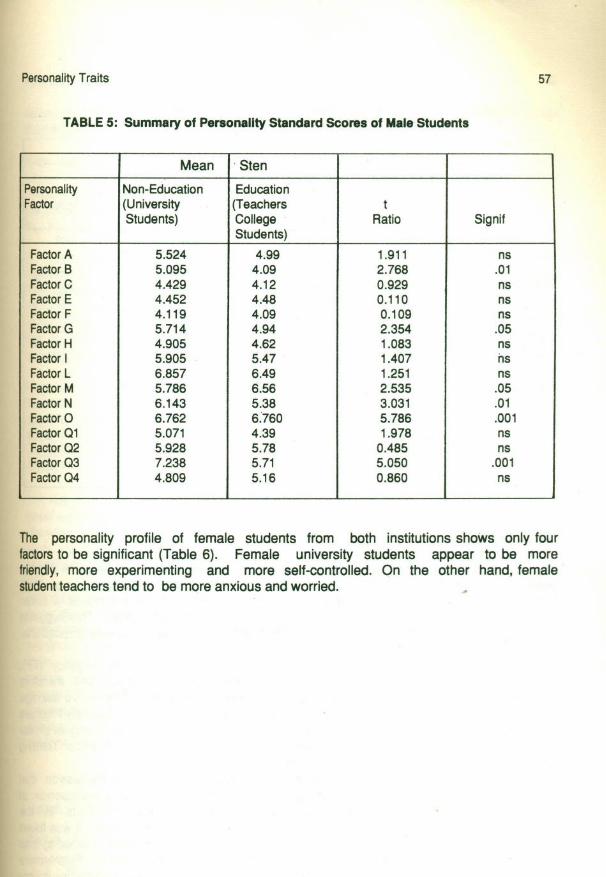
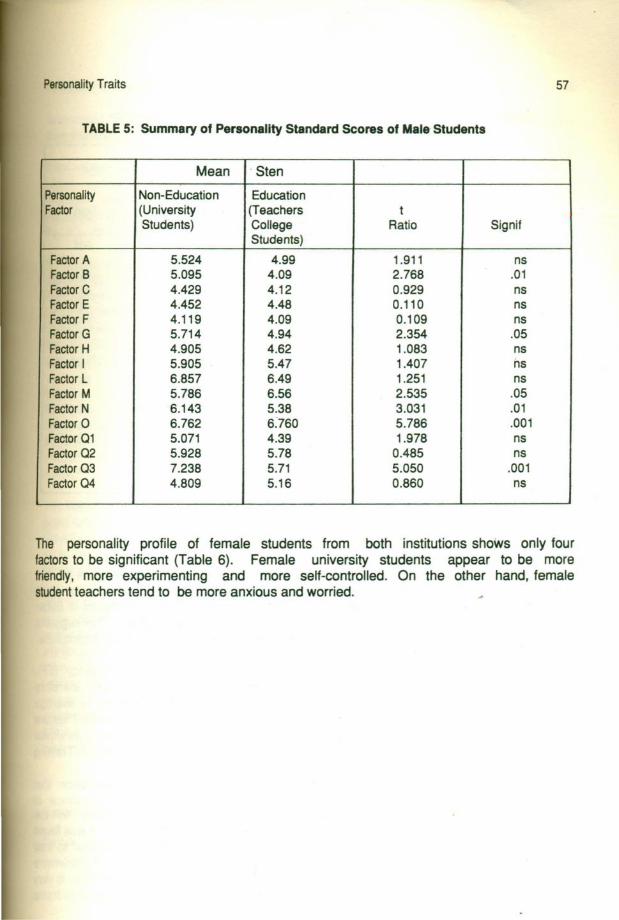
Comparison of personality profile for male students shows that seven factors are significantly different (Table 5). Male students from the university have higher scores on intelligence. They are also more conscientious, more sophisticated, more experimenting, and more self-controlled than the . male students from the Teacher Training College. However, the results suggest that male student teachers are more imaginative than male university students, as indicated by the higher score for Factor M.
Personality Traits 57
TABLE 5: Summary of Personality Standard Scores of Male Students
Mean · Sten
Personality Non-Education Education Factor (University (Teachers t
Students) College Ratio Signif Students)
Factor A 5.524 4.99 1.911 ns Factor B 5.095 4.09 2.768 .01 Factor C 4.429 4.12 0.929 ns Factor E 4.452 4.48 0.110 ns Factor F 4.119 4.09 0.109 ns Factor G 5.714 4.94 2.354 .05 Factor H 4.905 4.62 1.083 ns Factor I 5.905 5.47 1.407 ns Factor L 6.857 6.49 1.251 ns Factor M 5.786 6.56 2.535 .05 Factor N 6.143 5.38 3.031 .01 Factor 0 6.762 6:760 5.786 .001 Factor 01 5.071 4.39 1.978 ns Factor 02 5.928 5.78 0.485 ns Factor 03 7.238 5.71 5.050 .001 Factor 04 4.809 5.16 0.860 ns
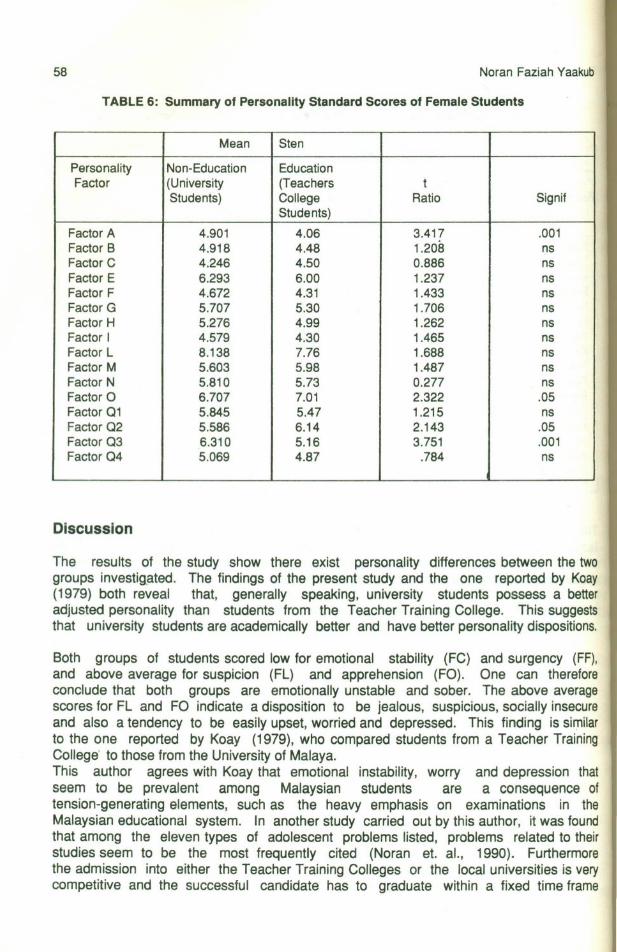
The personality profile of female students from both institutions shows only four factors to be significant (Table 6). Female university students appear to be more friendly, more experimenting and more self-controlled. On the other hand, female student teachers tend to be more anxious and worried.
Personality Traits 57
TABLE 5: Summary of Personality Standard Scores of Male-Students
Mean · Sten
Personality Non-Education Education Factor (University (Teachers t
Students) College Ratio Sign if Students)
Factor A 5.524 4.99 1.911 ns Factor B 5.095 4.09 2.768 .01 Factor C 4.429 4.12 0.929 ns Factor E 4.452 4.48 0.110 ns Factor F 4.119 4.09 0.109 ns Factor G 5.714 4.94 2.354 .05 Factor H 4.905 4.62 1.083 ns Factor I 5.905 5.47 1.407 ns Factor L 6.857 6.49 1.251 ns Factor M 5.786 6.56 2.535 .05 Factor N 6.143 5.38 3.031 .01 Factor 0 6.762 6:760 5.786 .001 Factor 01 5.071 4.39 1.978 ns Factor 02 5.928 5.78 0.485 ns Factor 03 7.238 5.71 5.050 .001 Factor 04 4.809 5.16 0.860 ns
The personality profile of female students from both institutions shows only four factors to be significant (Table 6). Female university students appear to be more friendly, more experimenting and more self-controlled. On the other hand, female student teachers tend to be more anxious and worried.
-
58 Noran Faziah Yaakub
TABLE 6: Summary of Personality Standard Scores of Female Students
Mean Sten
Personality Non-Education Education Factor (University (Teachers t
Students) College Ratio Sign if Students)
Factor A 4.901 4.06 3.417 .001 Factor B 4.918 4.48 1.208 ns Factor C 4.246 4.50 0.886 ns Factor E 6.293 6.00 1.237 ns Factor F 4.672 4.31 1.433 ns Factor G 5.707 5.30 1.706 ns Factor H 5.276 4.99 1.262 ns Factor I 4.579 4.30 1.465 ns Factor L 8.138 7.76 1.688 ns Factor M 5.603 5.98 1.487 ns Factor N 5.810 5.73 0.277 ns Factor 0 6.707 7.01 2.322 .05 Factor 01 5.845 5.47 1.215 ns Factor 02 5.586 6.14 2.143 .05 Factor 03 6.310 5.16 3.751 .001 Factor 04 5.069 4.87 .784 ns
Discussion
The results of the study show there exist personality differences between the two groups investigated. The findings of the present study and the one reported by Koay (1979) both reveal that, generally speaking, university students possess a better adjusted personality than students from the Teacher Training College. This suggests that university students are academically better and have better personality dispositions.
Both groups of students scored low for emotional stability (FC) and surgency (FF), and above average for suspicion (FL) and apprehension (FO). One can therefore conclude that both groups are emotionally unstable and sober. The above average scores for FL and FO indicate a disposition to be jealous, suspicious, socially insecure and also a tendency to be easily upset, worried and depressed. This finding is similar to the one reported by Koay (1979), who compared students from a Teacher Training College· to those from the University of Malaya. This author agrees with Koay that emotional instability, worry and depression that seem to be prevalent among Malaysian students are a consequence of tension-generating elements, such as the heavy emphasis on examinations in the Malaysian educational system. In another study carried out by this author, it was found that among the eleven types of adolescent problems listed, problems related to their studies seem to be the most frequently cited (Noran et. al., 1990). Furthermore the admission into either the Teacher Training Colleges or the local universities is very competitive and the successful candidate has to graduate within a fixed time frame
Personality Traits 59
determined by each institution. It is only natural for students to feel apprehensive about their studies.
Wnh respect to emotional stability (FC), studies carried out outside Malaysia reported higher scores for this personality trait (Tarpey, 1965; Elmore and Ellett, 1979; Shannon and Houston, 1980; Kenney and Kenney, 1982). Tarpey further reported that her sample of four groups of student teachers in Ireland and England have low scores for FL, indicating adaptable, trustful and tolerant people.
H is also worthy to note that, non-education university students in this study scored significantly higher on FQ3, indicating good self-control and considerate of others. This above-average score for FQ3 is similar to the one reported by Shannon and Houston (1980). Even though student teachers do not possess some of the personality characteristics of non-education university students, they do however, possess some of the desired personality characteristics expected of teachers, such as friendliness, conscientiousness, extraversion, experimenting, self-sufficiency and self-control.
Based on the findings of this study, the following suggestions are made. Research should be carried out to explain emotional instability, suspicion and apprehension among Malaysian students. Apart from reviewing the public examination system in Malaysia which affects psychological development among students, there should also be research on the socialization process of children either at home or at school.
The literature has pointed to some personality traits that go hand in hand with perceived good teaching, such as friendliness, conscientiousness, self-control, venturesomeness, assertion, and tough-mindedness. Therefore, it is suggested that psychological tests such as Cattell's 16 P.F. or other personality tests may be used to assess personality characteristics.
This study has some implications for both university and teacher training college. University counsellors would have to be more sensitive to the above-average tendencies of suspicion and worry among their students. They should be able to provide counselling sessions to handle these two personality traits more cautiously. This study also points to the need of having counsell.ors in teacher training colleges play a more active role in helping student teachers overcome their personal problems. · Koay made the same suggestion a decade ago; but the Ministry of Education is yet to take up on this suggestion. There is no doubt that the decade of the nineties will witness the onslaught of human resource development and it is about time that positive action be taken to implement some of the recommendations based on research.
References
Cattell, A.B. 16 P.F.: Form A, Institute for Personality and Ability Testing, Inc., 1978.
Cattell, ·A.B. Eber, H.W. And Tatsouka, M.M. "Handbook for Sixteen Personality Factor Questionnaire", Champaign, Ill. Institute for Personality and Ability Testing, 1970.
60 Noran Fauziah Yaakub
Hoover, Todd "Performance Prediction of Students in Teacher Education, "Journal of Experimental Education, vol. 47, No. 3, pp. 192-195, 1979.
Kenney, S.E. and Kenney, J.B. "Personality Patterns of Public School Librarians and Teacher", J. Exp. Educ., Vol. 50, No. 3, pp. 152-153, 1982.
Koay Siew Luan. "A comparative Analysis of the Personality of Student Teachers in Teachers' Training College and in University of Malaya", Pendidik dan Pendidikan, Vol. 1, No. 1 , 1979.
__ Laporan Jawatankuasa Kabinet Mengkaji Pelaksanaan Dasar Pelajaran, Kementerian Pendidikan Malaysia, Kuala Lumpur, 1980.
McClain, Edwin W. "Sixteen P.F. Scores and Success in Student Teaching," Journal of Teacher Education, Vol. 19, No. 1, pp. 25- 31, 1968.
Montross, Harold Wesley. "Temperament and Teaching Success," Journal of Experimental Education. Vol. 23, pp. 73-97, 1954.
Murray, Eloise. "Students' Perceptions of Self-Actualizing and Non-Self- Actualizing Teachers, "Journal of Teacher Education. Vol. 23, No. 3, pp. 383-387, 1972.
Noran Fauziah Yaakub et. al. "Adolescents and Their Problems," Research Report, UPM, 1990.
Ryans, David G. Characteristics of Teachers, American Council on Educaton, Washington D.C., 1967.
Shannon, L.A. And Houston, S. "Personality Factors of College Students from Two Different Enrolment Periods", J. Exp. Educ., Vol. 48, No. 4, pp. 302-306, 1980.
Symonds, Percival M., "Teaching As A Function of the Teachers' Personality," Journal of Teacher Education, Vol. 5, pp. 79-83, 1954.
Tarpey, M. Simeon, "Personality Factors in Teacher Trainee Selection", Brit. J. Educ. Psycho/., vol. 35, pp. 140-149, 1965.
Elmore, Randy F. and C.E. Ellett, "Personality Characteristics, Belief Systems, and Cognitive Performance of Existing Teacher Education Students," Journal of Experimental Education, Vol. 48, No. 2, pp. 104-109, 1979/80.


![Diverse Personality Traits and Translation Quality...2017/12/06 · Alireza Akbari & Winibert Segers trans-kom 10 [2] (2017): 242-270 Diverse Personality Traits and Translation Quality](https://static.fdocument.pub/doc/165x107/5ed2a6d27d90860af766b2ff/diverse-personality-traits-and-translation-20171206-alireza-akbari-.jpg)