
Performance Optimization of Virtualized Packet Processing...
80
Performance Optimization of Virtualized Packet Processing Function for 5G RAN FILIP ÖSTERMARK KTH ROYAL INSTITUTE OF TECHNOLOGY INFORMATION AND COMMUNICATION TECHNOLOGY DEGREE PROJECT IN INFORMATION TECHNOLOGY, SECOND CYCLE STOCKHOLM, SWEDEN 2017
-
Upload
trinhduong -
Category
Documents
-
view
215 -
download
0
Transcript of Performance Optimization of Virtualized Packet Processing...

Performance Optimization of Virtualized Packet Processing Function for 5G RAN
FILIP ÖSTERMARK
KTH ROYAL INSTITUTE OF TECHNOLOGY I N F O R M A T I O N A N D C O M M U N I C A T I O N T E C H N O L O G Y
DEGREE PROJECT IN INFORMATION TECHNOLOGY, SECOND CYCLE STOCKHOLM, SWEDEN 2017

Performance Optimization of Virtualized Packet Processing Function for 5G RAN
Filip Östermark
2017-11-19
Master’s Thesis
Examiner Gerald Q. Maguire Jr. Academic adviser Anders Västberg Industrial adviser Gábor Fényes (Ericsson)
KTH Royal Institute of Technology School of Information and Communication Technology (ICT) Department of Communication Systems SE-100 44 Stockholm, Sweden

i
Abstract
The advent of the fifth generation mobile networks (5G) presents many new challengesto satisfy the requirements of the upcoming standards. The 5G Radio Access Network(RAN) has several functions which must be highly optimized to keep up with increasingperformance requirements. One such function is the Packet Processing Function (PPF) whichmust process network packets with high throughput and low latency. A major factor inthe pursuit of higher throughput and lower latency is adaptability of 5G technology. Forthis reason, Ericsson has developed a prototype 5G RAN PPF as a Virtualized NetworkFunction (VNF) using an extended version of the Data Plane Development Kit’s Eventdevframework, which can be run on a general purpose computer. This thesis project optimizesthe throughput and latency of a 5G RAN PPF prototype using a set of benchmarking andcode profiling tools to find bottlenecks within the packet processing path, and then mitigatesthe effects of these bottlenecks by changing the configuration of the PPF.
Experiments were performed using IxNetwork to generate 2 flows with GTP-u/UDP/IPv4packets for the PPF to process. IxNetwork was also used to measure throughput and latencyof the PPF.
The results show that the maximum throughput of the PPF prototype could be increased by40.52% with an average cut-through latency of 97.59% compared to the default configurationin the evaluated test case, by reassigning the CPU cores, performing the packet processingwork in fewer pipeline stages, and patching the RSS function of the packet reception (Rx)driver.
Keywords: 5G, RAN, virtualization, packet processing, NFV, optimization.


iii
Sammanfattning
Med den annalkande femte generationen av mobila nätverk (5G) följer en rad utmaningarför att uppnå de krav som ställs av kommande standarder. Den femte generationensRadioaccessnätverk (RAN) har flera funktioner som måste vara väloptimerade för attprestera enligt ökade krav. En sådan funktion är Packet Processing-funktionen (PPF), vilkenmåste kunna bearbeta paket med hög genomströmning och låg latens. En avgörandefaktor i jakten på högre genomströmning och lägre latens är anpassningsbarhet hos 5G-teknologin. Ericsson har därför utvecklat en prototyp av en PPF för 5G RAN som en virtuellnätverksfunktion (VNF) med hjälp av DPDK:s Eventdev-ramverk, som kan köras på en datoravsedd för allmän användning. I detta projekt optimeras genomströmningen och latensenhos Ericssons 5G RAN PPF-prototyp med hjälp av ett antal verktyg för prestandamätningoch kodprofilering för att hitta flaskhalsar i pakethanteringsvägen, och därefter minskaflaskhalsarnas negativa effekt på PPFens prestanda genom att ändra dess konfiguration.
I experimenten användes IxNetwork för att generera 2 flöden med GTP-u/UDP/IPv4-paketsom bearbetades av PPFen. IxNetwork användes även för att mäta genomströmning ochlatens.
Resultaten visade att den maximala genomströmningen kunde ökas med 40.52% med engenomsnittlig latens på 97.59% jämfört med den ursprungliga PPF-prototypkonfigurationeni testfallet, genom att omfördela processorkärnor, sammanslå paketbearbetningssteg, och attpatcha RSS-funktionen hos mottagardrivaren.
Nyckelord: 5G, RAN, virtualisering, packet processing, NFV, optimering.


Contents
Contents v
List of Acronyms and Abbreviations vii
1 Introduction 11.1 Motivation . . . . . . . . . . . . . . . . . . . . . . . . . . . . . . . . . . . . . . . 11.2 Problem Statement . . . . . . . . . . . . . . . . . . . . . . . . . . . . . . . . . . 21.3 Purpose . . . . . . . . . . . . . . . . . . . . . . . . . . . . . . . . . . . . . . . . . 31.4 Goal . . . . . . . . . . . . . . . . . . . . . . . . . . . . . . . . . . . . . . . . . . . 31.5 Delimitations . . . . . . . . . . . . . . . . . . . . . . . . . . . . . . . . . . . . . 41.6 Methodology . . . . . . . . . . . . . . . . . . . . . . . . . . . . . . . . . . . . . 4
2 Background 62.1 4G/LTE and 5G Mobile Networks . . . . . . . . . . . . . . . . . . . . . . . . . 6
2.1.1 State of Modern Mobile Networks . . . . . . . . . . . . . . . . . . . . . 62.1.2 4G - E-UTRAN . . . . . . . . . . . . . . . . . . . . . . . . . . . . . . . . 72.1.3 5G - New Radio . . . . . . . . . . . . . . . . . . . . . . . . . . . . . . . . 9
2.1.3.1 D-RAN . . . . . . . . . . . . . . . . . . . . . . . . . . . . . . . 92.1.3.2 C-RAN . . . . . . . . . . . . . . . . . . . . . . . . . . . . . . . 92.1.3.3 V-RAN . . . . . . . . . . . . . . . . . . . . . . . . . . . . . . . 102.1.3.4 5G New Radio and Cloud RAN . . . . . . . . . . . . . . . . . 11
2.1.4 Functional Splitting of the 5G NR . . . . . . . . . . . . . . . . . . . . . 112.2 Packet Processing for 5G RAN . . . . . . . . . . . . . . . . . . . . . . . . . . . 13
2.2.1 Virtualization . . . . . . . . . . . . . . . . . . . . . . . . . . . . . . . . . 142.2.2 Packet I/O . . . . . . . . . . . . . . . . . . . . . . . . . . . . . . . . . . . 182.2.3 Receive Side Scaling . . . . . . . . . . . . . . . . . . . . . . . . . . . . . 232.2.4 The Data Plane Development Kit . . . . . . . . . . . . . . . . . . . . . . 242.2.5 A 5G RAN PPF Prototype . . . . . . . . . . . . . . . . . . . . . . . . . . 28
2.3 Performance Optimization . . . . . . . . . . . . . . . . . . . . . . . . . . . . . . 292.3.1 System Performance Factors . . . . . . . . . . . . . . . . . . . . . . . . 29
2.3.1.1 Context switch cost . . . . . . . . . . . . . . . . . . . . . . . . 292.3.1.2 Memory access cost . . . . . . . . . . . . . . . . . . . . . . . . 302.3.1.3 Cache hit/miss ratio . . . . . . . . . . . . . . . . . . . . . . . . 302.3.1.4 CPU Load Balance . . . . . . . . . . . . . . . . . . . . . . . . . 31
2.3.2 Performance Profiling . . . . . . . . . . . . . . . . . . . . . . . . . . . . 312.3.2.1 LMbench . . . . . . . . . . . . . . . . . . . . . . . . . . . . . . 312.3.2.2 Linux Perf . . . . . . . . . . . . . . . . . . . . . . . . . . . . . 32
v
vi CONTENTS
2.3.2.3 IxNetwork . . . . . . . . . . . . . . . . . . . . . . . . . . . . . 33
3 Methodology 343.1 Testbed Setup . . . . . . . . . . . . . . . . . . . . . . . . . . . . . . . . . . . . . 343.2 Throughput Measurements . . . . . . . . . . . . . . . . . . . . . . . . . . . . . 363.3 Latency Measurements . . . . . . . . . . . . . . . . . . . . . . . . . . . . . . . . 373.4 Code Profiling . . . . . . . . . . . . . . . . . . . . . . . . . . . . . . . . . . . . . 383.5 Multicore Performance Scaling . . . . . . . . . . . . . . . . . . . . . . . . . . . 383.6 Packet Processing Stage Consolidation . . . . . . . . . . . . . . . . . . . . . . . 403.7 Rx Optimization - RSS Patch . . . . . . . . . . . . . . . . . . . . . . . . . . . . . 423.8 Optimization Workflow . . . . . . . . . . . . . . . . . . . . . . . . . . . . . . . 42
4 Results 444.1 Core Reassignment Results . . . . . . . . . . . . . . . . . . . . . . . . . . . . . 444.2 Worker Stage Consolidation Results . . . . . . . . . . . . . . . . . . . . . . . . 464.3 RSS Patch Results . . . . . . . . . . . . . . . . . . . . . . . . . . . . . . . . . . . 484.4 Summarized Results . . . . . . . . . . . . . . . . . . . . . . . . . . . . . . . . . 50
5 Discussion 535.1 Results Analysis . . . . . . . . . . . . . . . . . . . . . . . . . . . . . . . . . . . . 535.2 Methodology Discussion . . . . . . . . . . . . . . . . . . . . . . . . . . . . . . . 55
6 Conclusions and Future Work 566.1 Conclusions . . . . . . . . . . . . . . . . . . . . . . . . . . . . . . . . . . . . . . 566.2 Limitations . . . . . . . . . . . . . . . . . . . . . . . . . . . . . . . . . . . . . . . 566.3 Required Reflections . . . . . . . . . . . . . . . . . . . . . . . . . . . . . . . . . 576.4 Future Work . . . . . . . . . . . . . . . . . . . . . . . . . . . . . . . . . . . . . . 57
Bibliography 59
A LMbench Output 63A.1 Host (Physical) Machine Results . . . . . . . . . . . . . . . . . . . . . . . . . . 63A.2 Guest (Virtual) Machine Results . . . . . . . . . . . . . . . . . . . . . . . . . . . 64A.3 LMbench Config-Run Script Sample Output . . . . . . . . . . . . . . . . . . . 66

List of Acronyms and Abbreviations
3GPP . . . . . . . . . . . . . . . . 3rd Generation Partnership Project4G . . . . . . . . . . . . . . . . . . Fourth generation mobile networks5G . . . . . . . . . . . . . . . . . . Fifth generation mobile networksC-RAN . . . . . . . . . . . . . . Cloud Radio Access NetworkCN . . . . . . . . . . . . . . . . . . Core NetworkCPU . . . . . . . . . . . . . . . . . Central Processing UnitCS . . . . . . . . . . . . . . . . . . . Context Switch(es)D-RAN . . . . . . . . . . . . . . Distributed Radio Access NetworkDL . . . . . . . . . . . . . . . . . . DownlinkDPDK . . . . . . . . . . . . . . . Data Plane Development KitE-UTRAN . . . . . . . . . . . Evolved Universal Terrestrial Radio Access NetworkEAL . . . . . . . . . . . . . . . . . Environment Abstraction LayereNB . . . . . . . . . . . . . . . . . Evolved NodeBHAL . . . . . . . . . . . . . . . . Hardware Abstraction LayerIP . . . . . . . . . . . . . . . . . . . Internet ProtocolIPC . . . . . . . . . . . . . . . . . . Instructions Per Cyclelcore . . . . . . . . . . . . . . . . Logical CoreLTE . . . . . . . . . . . . . . . . . Long Term EvolutionNFV . . . . . . . . . . . . . . . . . Network Function VirtualizationNIC . . . . . . . . . . . . . . . . . Network Interface CardNR . . . . . . . . . . . . . . . . . . New RadioOS . . . . . . . . . . . . . . . . . . Operating SystemOvS . . . . . . . . . . . . . . . . . Open vSwitchPMD . . . . . . . . . . . . . . . . Poll Mode DriverPPF . . . . . . . . . . . . . . . . . Packet Processing Functionpps . . . . . . . . . . . . . . . . . . Packets/SecondRAN . . . . . . . . . . . . . . . . Radio Access NetworkRSS . . . . . . . . . . . . . . . . . Receive Side ScalingRx . . . . . . . . . . . . . . . . . . . Receive/ReceptionTx . . . . . . . . . . . . . . . . . . . Transmit/TransmissionUDP . . . . . . . . . . . . . . . . User Datagram ProtocolUE . . . . . . . . . . . . . . . . . . User EquipmentUL . . . . . . . . . . . . . . . . . . UplinkV-RAN . . . . . . . . . . . . . . Virtualized Radio Access NetworkVM . . . . . . . . . . . . . . . . . . Virtual MachineVNF . . . . . . . . . . . . . . . . . Virtualized Network Function
vii


Chapter 1
Introduction
This chapter gives an introduction to the subject of this thesis and includes a brief overviewof the latest developments in mobile networks, specifically 5G, along with a descriptionof the problem of implementing efficient and future proof packet processing. A concreteresearch question is presented along with an explanation of the purpose and goals of thethesis.
1.1 Motivation
Mobile networks have rapidly become an omnipresent part of people’s daily lives in thepast few decades, giving access to quick and easy communication in nearly all parts of theworld. As the evolution and integration of technology into our everyday lives continues,the demand for better coverage, quality of service, lower latency, and higher data rates inmobile networks continues to increase. According to a 2016 Cisco∗ white paper, the globaltotal amount of mobile data traffic reached an estimated 3.7 exabytes (EB) per month duringthe year 2015 [1]. The same paper predicts an increase from 3.7 EB/month globally in 2015to 30.6 EB/month by the year 2020, which would mean an increase of 827% in the five yearsfollowing 2015.
To keep up with the increasing volume of mobile data, mobile networks have to constantlyadapt and evolve. Currently, the fifth generation of mobile networks also known as 5Gis under development and has been predicted to arrive around the year 2020 [2, 3]. Withthe transition from the fourth generation mobile networks (4G) to 5G networks comesrequirements for higher throughput and lower latency in the Radio Access Network (RAN).A vital part of any 5G RAN architecture is the Packet Processing Function (PPF). ThePPF is responsible for the handling data packets flowing through the network. A highlyoptimized PPF is an important component in order to provide the high throughput andlow latency proposed for the 5G standard. To reduce the cost of maintaining and updatingnetwork functions such as the PPF, network operators have moved to Network FunctionsVirtualization (NFV) [4, 5, 6]. Ericsson has followed this trend by developing a 5G RAN PPFas a Virtualized Network Function (VNF). For example, this introduces a need for additionalperformance considerations regarding packet I/O, as the cost of I/O will generally increase∗ Cisco Systems, Inc.
1
2 CHAPTER 1. INTRODUCTION
under virtualization with traditional Linux network drivers [7]. To combat this problem,Ericsson’s PPF relies on Data Plane Development Kit (DPDK) [8], which reduces I/O costby giving user space applications direct access to the buffers of the Network InterfaceCards (NICs). Additionally, DPDK has functionality to improve the caching performanceof network applications, as well as data structures which allows lockless operations inapplications running on multicore systems. Ericsson’s 5G RAN PPF prototype uses DPDK’sEventdev framework [9] for scheduling and load balancing packet processing events overmultiple CPU cores, and is designed to run on multicore systems with at least 4 CPUcores. The DPDK master thread requires one CPU core, while the rest of the CPU corescan be configured to run Eventdev threads. The PPF prototype configures Eventdev torun a centralized software scheduler on its first logical core (lcore), packet reception (Rx)and transmission (Tx) on its second lcore, and worker threads on the remaining lcores.The Eventdev configuration plays an important role in the optimization of Ericsson’s PPFprototype and will be described in greater detail in Section 2.2.4. Virtualization and NFVwill be described in Section 2.2.1.
This thesis studies the packet processing performance of a 5G RAN PPF prototype developedby Ericsson, by profiling its software and measuring and evaluating the throughput andlatency while processing UDP/IP packets. A set of benchmarking and profiling tools wereused to used to gain insight about the bottlenecks of the PPF prototype in an attempt toremove or mitigate the effects that these bottlenecks had on the throughput and latency of thePPF prototype. The PPF prototype was optimized using by reconfiguration of the Eventdevframework, including core assignments and consolidated packet processing stages. Lastly,an optimization of the RSS computation in the Rx driver was performed to further improvethe throughput and latency performance. The purpose of this study was to gain a deeperunderstanding of an existing prototype of a 5G RAN PPF, and to optimize a 5G RAN PPFimplementation in terms of throughput and latency.
1.2 Problem Statement
This thesis answers the question: "Given an NFV PPF prototype for the 5G RAN based on theDPDK Eventdev framework, what are the bottlenecks of its packet processing path, and how can theireffects be mitigated?"
The investigation looks at implementation details of Ericsson’s 5G RAN PPF prototype, andmore specifically at its use of the Eventdev framework which is used for the scheduling ofpacket processing events and packet reception (Rx) and transmission (Tx). To gain insightinto the bottlenecks and costly operations performed by the PPF prototype, Linux Perfand IxNetwork was used. The Eventdev framework provides a number of configurableparameters which affect for example the number of reception and transmission buffers,the size of the bursts of events which are enqueued or dequeued for processing, a limiton the number of new events which are allowed to enter the PPF prototype before oldevents are processed, and more. These parameters, as well as the scheduling quanta fordifferent events, were considered when attempting to optimize the PPF’s throughput andlatency. The goal of this investigation was to provide an understanding of the effects ofdifferent configurations and implementation details of the PPF prototype on its throughputand latency when processing UDP/IP packets, and finally to optimize the performance of
CHAPTER 1. INTRODUCTION 3
the PPF prototype.
The optimization process was focused on (1) configuration optimization and (2) codeoptimization. While both methods were used to achieve better throughput and latencyperformance, there is an intended distinction between the use of the terms as follows:
• Configuration optimization achieves increased performance of the PPF prototype bychanging the way it performs its tasks, i.e. a reassignment of CPU cores, changes tothe scheduling of tasks, or changes to the packet processing stages.
• Code optimization achieves increased performance by increasing the speed at whichtasks are performed, for example a speedup of the Receive Side Scaling (RSS) com-putation without changing the way that the PPF prototype operates.
Uses of the term optimization alone in this thesis refers to configuration optimization or codeoptimization interchangeably.
1.3 Purpose
The purpose of this thesis project was to aid Ericsson∗ in their development of a 5G RANby providing a deeper understanding of the effects that different configurations of theEventdev framework and other implementation details of a 5G RAN PPF have on theprocessing of UDP/IP packets. By understanding which parameters have the greatest effecton throughput, latency, and the execution of hot parts of the PPF prototype, the 5G RAN PPFcan be optimized. This thesis is a step towards an optimized implementation of the 5G RANPPF, and by extension a step towards a full deployment of the 5G standard to the market.
1.4 Goal
The end goal of this thesis project was to understand the effects of different configurationsof an implementation of the Eventdev framework on throughput and latency of a 5G RANPPF, and ideally to suggest the best 5G RAN PPF configuration from those that were studied.The results are presented in terms of the throughput and latencies achieved for differentconfigurations of the adjustable parameters of the event device.
The thesis will be valuable to the teams at Ericsson working with the 5G RAN PPF byproviding a deeper understanding of its functions and configurability, to others who areinvolved in the development of 5G RANs, and to others who want to implement efficientpacket processing functions. A concrete deliverable is a set of example configurationswhich could aid in the design and evaluation of different packet processing functionimplementations.
∗ Telefonaktiebolaget LM Ericsson
4 CHAPTER 1. INTRODUCTION
1.5 Delimitations
This thesis looks at different configurations of a 5G RAN PPF prototype developed byEricsson, and determines which of these configurations work best in terms of high through-put and low latency of UDP/IPv4 packets. To determine which configuration works best,tests were performed using Ixia’s∗ IxNetwork software to generate UDP network trafficand perform throughput and latency measurements. In addition, the tools described inSection 2.3.2 were used for code profiling and benchmarking. The aim of these testswas to find critical parameters, potential bottlenecks, and costly operations caused by theconfiguration of the Eventdev framework used by the PPF prototype, and to collect generalmeasurements on throughput and latency. The methodology of the throughput and latencymeasurements is described in Sections 3.2 and 3.3, and are based on Ericsson’s previouslyconfigured test cases. The throughput was measured using Ethernet frames of only 90 bytes,which was close to the minimum possible size needed to accommodate a 32 byte payloadand all of the required encapsulation. Using 90 bytes as the only Ethernet frame size fortesting was deemed appropriate as these test results represent the worst case for throughputperformance (more formally goodput, due to the small payload size relative to the overheadof the various headers). The number of packets per second (pps) was recorded. For thelatency tests, a mix of frames of 86 bytes, 592 bytes, and 1522 bytes were used.
There are several key capabilities of 5G which can all be viewed as performance indicators- such as mobility, spectrum and energy efficiency, etc. This thesis will focus only on theoptimization of throughput (peak and user experienced data rate) and data plane latency. Interms of optimizations of these capabilities, this thesis limits itself (1) to parameters withinthe code of the Eventdev framework and its registered drivers which run inside the VirtualMachine (VM) under the PPF prototype, and (2) potential optimizations of the hypervisorsettings.
1.6 Methodology
This thesis studies the effects on throughput and latency that different configurations of theEventdev framework and its configured drivers which are at the core of the PPF prototypedeveloped by Ericsson have. A combination of Linux Perf and IxNetwork were used toprofile the PPF to help identify the effects seen following a configuration adjustment. Thestudy was performed in the following steps:
1. Pre-study to find state-of-the-art network analysis and performance profiling tools tohelp identify potential bottlenecks in the Eventdev framework of the PPF prototype.IxNetwork was chosen for traffic generation and measurements, as it was compatiblewith Ericsson’s testbed equipment and had all the basic measurement functionalityneeded. Linux Perf was chosen for code profiling due to the relative ease of running iton the PPF prototype, and due to its extensive profiling features.
2. Using the IxNetwork and Linux Perf, a baseline measurement of UDP/IP processingwith the 5G RAN PPF using the default event device configuration was produced. Themaximum throughput achieved without any packet drops was recorded, as well as the
∗ https://www.ixiacom.com/products/ixnetwork

CHAPTER 1. INTRODUCTION 5
minimum, average, and maximum latency. Perf was used to identify expensive andfrequent function calls.
3. Iterative reconfigurations of the PPF prototype were made and analyzed using IxNet-work and Linux Perf as described in step 2.
4. The results of these investigation are compiled and discussed in terms of throughputand latency in Chapter 4.
5. Suggestions and considerations for a finished 5G RAN PPF product are presented inChapter 5.
Chapter 2
Background
This chapter explains the theoretical background for this thesis, including descriptions of 4Gand upcoming 5G mobile networks, packet processing, code profiling, and NFV.
2.1 4G/LTE and 5G Mobile Networks
Mobile networks are currently evolving from their reliance on a variety of 4G standardstowards an emerging 5G standard. This section describes the state of current mobilenetworks and the architecture of their Radio Access Networks (RANs) as well as an overviewof the progress being made towards the development of a 5G standard. In this thesis we willfocus on the 4G and 5G standards as specified by the 3rd Generation Partnership Project(3GPP).
2.1.1 State of Modern Mobile Networks
With the rapid worldwide increase in mobile data traffic and the advent of 5th generationmobile networks (5G), the requirements on the performance of mobile networks willdrastically increase. The IMT-2020 specification suggested by Working Party 5D of ITU-Rlists a set of key parameters to define the performance of future mobile networks [10], ofwhich the first three are the subject of this thesis:
• Peak data rate - The maximum data rate under optimal conditions. Data rate means theamount of data which can be sent through a part of a network per unit of time. Thisthesis uses the terms throughput and data rate interchangeably. Throughput is oftengiven in the unit: bits/second (bps).
• User experienced data rate - The data rate that is achieved under typical conditions fromthe perspective of a user.
• Latency - The time it takes for a packet to traverse the given part of a network fromentry to exit.
Also included in the key capabilities of IMT-2020 5G are requirements on:
6

CHAPTER 2. BACKGROUND 7
• Mobility,
• Connection density,
• Energy efficiency,
• Spectrum efficiency, and
• Area traffic capacity.
Mobile network standards differentiate between downlink (DL) and uplink (UL) capabilitiesin their specifications. For example, IMT-2020 specifies different data rates and latencies forthe DL and UL. The DL in this case refers to data connections from the core network (CN)towards the user equipment (UE), and the UL refers to the traffic from the UE towards theCN. The latency specifications of IMT-2020 also differentiate between what is called the dataplane (sometimes user plane) and the control plane. The control plane comprises the functionsof the network concerned with for example routing and network topology, while the dataplane performs the actual forwarding of packet data according to the rules set by the controlplane. Since the data plane performs per packet operations while the control plane generallydoes not, it is generally more important for data plane functions to be able to achieve thelowest possible latency. The IMT-2020 5G specification suggests improvements over its 4Gpredecessor IMT-Advanced with respect to all of the key capabilities, with a twentyfoldincrease in the peak data rate and tenfold improvements to the user experienced data rateand latency as shown in Table 2.1.
Table 2.1: Comparison of the 4G (IMT-Advanced) and 5G (IMT-2020) DL data rate andlatency specifications [10, 11].
4G (IMT-Advanced) 5G (IMT-2020)
Peak DL data rate (Gbps) 1 20
Ubiquitous DL data rate (Mbps) 10 100
Data plane latency (ms) 10 1
Control plane latency (ms) 100 10∗
The rest of this chapter introduces current and upcoming mobile network architecturesdesigned to implement 4G and 5G standards.
2.1.2 4G - E-UTRAN
The 4G RAN, formally known as Evolved Universal Terrestrial Radio Access Network,abbreviated E-UTRAN), consists of a decentralized system of base stations called EvolvedNodeBs (eNBs), which communicate with each other via a standardized interface named X2.The network of eNBs communication with the UEs via the Uu interface on one side and onthe other side with the CN via the standardized S1 interface[13].∗ Based on use case analysis in [12].

8 CHAPTER 2. BACKGROUND
UE
E-UTRAN
EvolvedPacket
Core
Uu
X2
S1-U
S1-MME
eNB
eNB eNB
Internet
Figure 2.1: Simplified overview of the 4G architecture with E-UTRAN.
Each eNB performs both control plane and data plane tasks. The control plane tasks of theeNB include radio resource management functions, such as radio bearer control, connectionmobility control, radio admission control, and dynamic resource allocation [14]. The dataplane is responsible for the handling and forwarding of actual user data.
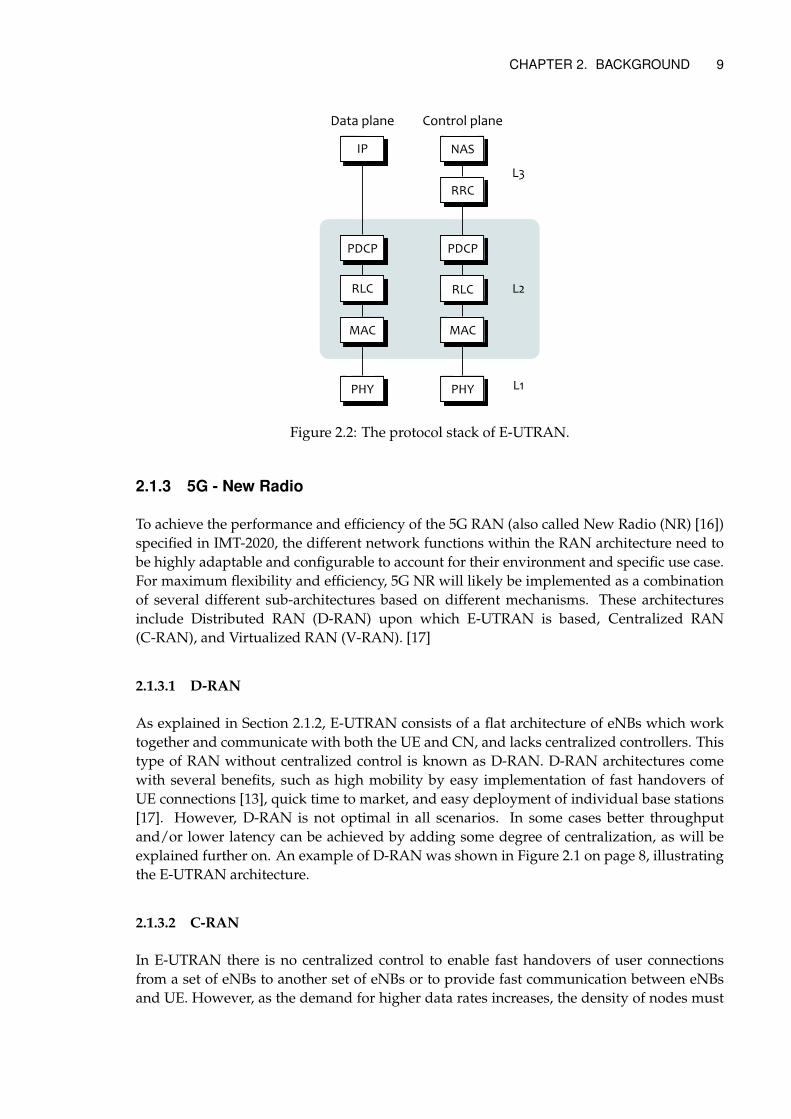
In the data plane, the protocol stack of E-UTRAN is responsible for the communicationbetween UE and eNBs consists of a physical layer protocol generally referred to as PHY, adata link layer consisting of the Medium Access Control (MAC), Radio Link Control (RLC),and Packet Data Convergence Protocol (PDCP) protocols [15]. At the network layer, the UEcommunicates with E-UTRAN gateways in the Evolved Packet Core (EPC). In the controlplane the IP protocol is replaced by the Radio Resource Control (RRC) and Non-AccessStratum (NAS) protocols at the network layer [14]. Figure 2.2 shows the E-UTRAN protocolstack.
CHAPTER 2. BACKGROUND 9
PDCP
RLC
PDCP
RRC
IP NAS
RLC
MACMAC
PHYPHY
Data plane Control plane
L1
L2
L3
Figure 2.2: The protocol stack of E-UTRAN.
2.1.3 5G - New Radio
To achieve the performance and efficiency of the 5G RAN (also called New Radio (NR) [16])specified in IMT-2020, the different network functions within the RAN architecture need tobe highly adaptable and configurable to account for their environment and specific use case.For maximum flexibility and efficiency, 5G NR will likely be implemented as a combinationof several different sub-architectures based on different mechanisms. These architecturesinclude Distributed RAN (D-RAN) upon which E-UTRAN is based, Centralized RAN(C-RAN), and Virtualized RAN (V-RAN). [17]
2.1.3.1 D-RAN
As explained in Section 2.1.2, E-UTRAN consists of a flat architecture of eNBs which worktogether and communicate with both the UE and CN, and lacks centralized controllers. Thistype of RAN without centralized control is known as D-RAN. D-RAN architectures comewith several benefits, such as high mobility by easy implementation of fast handovers ofUE connections [13], quick time to market, and easy deployment of individual base stations[17]. However, D-RAN is not optimal in all scenarios. In some cases better throughputand/or lower latency can be achieved by adding some degree of centralization, as will beexplained further on. An example of D-RAN was shown in Figure 2.1 on page 8, illustratingthe E-UTRAN architecture.
2.1.3.2 C-RAN
In E-UTRAN there is no centralized control to enable fast handovers of user connectionsfrom a set of eNBs to another set of eNBs or to provide fast communication between eNBsand UE. However, as the demand for higher data rates increases, the density of nodes must

10 CHAPTER 2. BACKGROUND
increase. Without any centralized logic to distribute workloads and allocate appropriatenetwork functions, denser deployment may lead to inefficiency in the utilization of nodes,because of greater variance in workload between Radio Access Points (RAPs). The peak DLdata rate of 20 Gbps and latency of 1 ms anticipated for the 5G NR may be achieved byultra-dense deployment of RAPs together with centralized logic for on-demand allocation ofspecific network functions. Such functions may for example include high bandwidth packetdelivery of streaming media to UEs or ultra-low latency messaging in machine-to-machinecommunications, for example between driverless vehicles [18]. This type of architecture,where centralized logic is used to allocate network functions, is referred to as CentralizedRAN (C-RAN). While decisions on the architecture of the 5G RAN are still being made, ithas been suggested that the 5G NR should be deployed with some degree of centralization[17, 19].
UE
C-RAN
Fiber
RAP
RAP
Data center
Backhaul Core Network
Figure 2.3: An overview of a generic C-RAN architecture.
2.1.3.3 V-RAN
The development of 5G NR includes transitioning parts of the decentralized architecture ofE-UTRAN which relies on specific purpose processors, towards centralized logic and gen-eral purpose processors with Software-Defined Networking (SDN) and Network FunctionVirtualization (NFV) [19]. A RAN that runs Virtual Network Functions (VNFs) on generalpurpose hardware is sometimes called a V-RAN. There are multiple potential benefits ofNFV which relate directly to the needs of a future 5G RAN. NFV allows for separationof the logical network resources from physical network resources, hence running networkfunctions which traditionally would run on special purpose hardware on general purposehardware instead, which leads to [17]:
• Easy and cost effective deployment of new or upgraded VNFs.
• Scalability of the Virtual Machines (VMs) running each network function, leading toincreased flexibility in the RAN.
• Increased energy efficiency with several VNFs running on the same physical host

CHAPTER 2. BACKGROUND 11
machine and on different cores of the same processor.
2.1.3.4 5G New Radio and Cloud RAN
While the exact specifications of the 5G standard are yet to be fully determined, there havebeen several suggestions about the details of the 5G NR architecture. Many point to whatis often called Cloud RAN [17, 18, 10], which generally means a combination of D-RAN,C-RAN, and V-RAN where network functions can be allocated dynamically based on theneeds of the network user. The aim is to use the best suited parts of each type of architecturefor each use case in order to achieve the highest performance possible in the vastly differentsituations that are expected to occur in the deployment of 5G NR.
5G has also been proposed to use Multiple Radio Access Technologies (Multi-RAT) to includeunlicensed spectrum for greater spectral efficiency [19]. For example, E-UTRAN can beused for the control plane while 5G NR provides higher throughput and/or lower latency.Multi-RAT solutions will likely also be required to provide coverage during the initial phaseof 5G deployment [17].
2.1.4 Functional Splitting of the 5G NR
An important factor in the performance of the 5G RAN is the way in which the network islogically split into its different elements. This means the separation of network functionswith different characteristics - for example those with less strict requirements on latency(mainly control plane functions) from those that require very low latency (for example dataplane functions) or functions that can benefit from NFV from those that cannot. In the contextof C-RAN, the degree of centralization, i.e. the decision of which network layers to centralize,is also an important question as it will affect the performance of the RAN. The degree towhich the 5G RAN should be centralized is discussed in [17] and [18]. Centralization splitsare considered within the PHY layer, between the PHY and MAC layers, and between theRLC and PDCP layers [17]. In the former case, parts of the PHY layer which can benefitfrom running in a distributed architecture would remain distributed while the rest of thePHY layer processing is centralized along with the higher layers. In the PHY-MAC split, adistributed PHY layer and centralized MAC (and higher) layer is discussed. Similarly theRLC-PDCP split suggests centralization of the PDCP layer and higher layers.
Erik Westberg provides an overview of the current E-UTRAN architecture and the envi-sioned 5G RAN architecture, with descriptions of their respective functional splits [20], asshown in Figures 2.4 and 2.5. A logical abstraction of the E-UTRAN architecture can be madeby splitting it into its Radio Unit (RU) and a Digital Unit (DU) functions. The RU functionperforms the physical radio communication with the UE and connects to the DU function.The DU function performs both control plane and data plane functions with different levelsof urgency.

12 CHAPTER 2. BACKGROUND
Digital Unit
User Equipment
Control PlaneFunctions
Data PlaneFunctions
4G RANRadio Unit
Internet
Core Network
Figure 2.4: An abstract overview of the 4G RAN architecture. Solid lines representconnections between data plane functions and dashed lines represent connections betweencontrol plane functions.
As demonstrated in the functional abstraction of E-UTRAN shown in Figure 2.4, the DUfunction performs both control plane and data plane tasks, where the data plane generallyrequires lower latency [11]. To pave the way for further optimizations to reduce the latencyof data plane functions, it is beneficial to separate architectural functions, increasing theflexibility and configurability of individual functions. For example, the envisioned 5GRAN architecture can be split into the functions depicted in Figure 2.5. In this functionalsplit, the Radio Function remains its own function while the DU function of E-UTRANis split into a Baseband Processing Function (BPF), Radio Control Function (RCF), and aPacket Processing Function (PPF). While the BPF performs both control plane and data planefunctions, the RCF performs only control plane functions and the PPF mostly performs dataplane functions. Thus the functions of the RCF and PPF have been completely separated.The suggested functions of the 5G RAN are well suited to NFV. Westberg suggests that theBPF be implemented on specific purpose hardware due to its strict requirements on spectrumefficiency, while the RCF is suitable for NFV. Implementation of the 5G RAN PPF as a VNFis the subject of this thesis. Its configuration will be studied based on code profiling andmeasurements of throughput and latency.

CHAPTER 2. BACKGROUND 13
User Equipment
5G RANRadio Function
Internet
Core Network
PacketProcessing
Function
BasebandProcessing
Function
RadioControl
Function
Figure 2.5: An abstract overview of an envisioned 5G RAN architecture. Solid lines representconnections between data plane functions and dashed lines represent connections betweencontrol plane functions.
2.2 Packet Processing for 5G RAN
In today’s mobile networks, user equipment (UE) communicates with other UEs and with thecore network via radio base stations called eNBs, which perform different types of processingof the data traffic. Packet processing is performed by an eNB; together with other types ofprocessing such as baseband processing which prepares data for efficient transmission overthe radio interface. A network packet is a unit of data which contains control informationsuch as the source and destination of the packet, and the actual data transmitted (i.e. thepayload). A Packet Processing Function (PPF) looks at the content of packets moving throughthe network and performs operations on the packet’s data depending on the content ofthe packet. The PPF may perform common and simple but time critical functions suchas forwarding of user data packets, and less frequent but more complex functions in thecontrol plane such as processing packets which contain information about network topologychanges, error handling, etc. The latter types of operations are often less critical in termsof throughput and latency. The path of packets inside the PPF that is made up of the mostcommon and time critical operations is often referred to as the fast path and has traditionallyexploited some type of hardware acceleration. The corresponding slow path is made up ofthe operations which require more advanced or less time critical types of processing and hastraditionally been performed in software running on a general purpose processor.
In E-UTRAN (as described in Section 2.1.2), the packet processing, as well as baseband and

14 CHAPTER 2. BACKGROUND
radio control, is performed by the eNB’s DU and runs on special purpose hardware. The 5GRAN PPF, which has been factored out of the DU, represents a distinct unit as was shown inFigure 2.5 on page 13. The 5G RAN PPF is a virtualized adaptation of the packet processingelements of the eNB and is designed to run in a Cloud RAN architecture. The reasons forrunning a virtualized 5G RAN PPF include greater adaptability and configurability, thus thePPF VM guest can be installed on any general purpose machine that fulfills the hardwarerequirements. This approach makes it easier to deploy a PPF, to configure the emulatedhardware of the VM to better accommodate the PPF software, and more.
This section will explain the concepts related to packet processing and how it is being im-plemented for upcoming 5G standards. These concepts include virtualization, NFV, Event-driven packet processing using DPDK, as well as packet I/O and its related performanceimplications.
2.2.1 Virtualization
Virtualization enables multiple Virtual Machines (VMs) to run on physical machines. Thereare multiple aspects of virtualization, each with different types of benefits. For example,applications designed for an architecture different than that of the physical machine can berun inside a VM that offers the desired architecture. A VM can also be very flexible becauseits hardware components can be emulated, hence VMs can be easily changed without havingto replace any physical components. This section will explain the concepts of virtualizationand Network Function Virtualization (NFV). NFV refers to the virtualization of networkfunctions. NFV is a cornerstone in the development of large parts of the upcoming 5Gstandard, and is largely the basis of the 5G RAN PPF.
Virtualization can be realized on many general purpose machines. Figure 2.6 shows anoverview of a generic virtualization setup. The physical machine, which is generally referredto as the host machine or host, often runs an operating system referred to as the host OS.This host OS runs a special type of software called a hypervisor, which provides support formaintaining and running VMs. Some hypervisors are capable of running on bare-metal,i.e. without a host OS - such hypervisors are called Type 1 hypervisors, while hypervisorsrunning on top of a host OS are called Type 2 hypervisors. A hypervisor may run one ormore different VMs at once. A VM consists of emulated hardware components, which canbe fully or partly independent of the components of the host. The concept of completevirtualization of all components of the VM is called full virtualization. The emulation of asubset of components of the VM is called paravirtualization. A VM, sometimes called a guestmachine or guest, can run a guest OS which is often different from the host OS. For example,VMs can be used to run applications and functions which cannot be executed directly by thehost OS. Another benefit of virtualization is that functions inside VMs are generally isolatedfrom functions running inside other VMs. This isolation can be emphasized by allocatingdifferent host resources to different guests, for example by CPU core isolation where differentVMs are allocated different cores of the host’s CPU.

CHAPTER 2. BACKGROUND 15
Host machine
Host OS
Applications
. . .
Hypervisor
VM 1
Guest OS 1
Applications
VM n
Guest OS n
Applications
Figure 2.6: An overview of a generic virtualization with a host machine running severalguest systems.
Network Function Virtualization (NFV) refers to the virtualization of network functionsso that they can run on general purpose hardware instead of having to run on specialpurpose hardware as was previously the case. Network functions that are virtualizedare commonly called Virtualized Network Functions (VNFs). NFV offers several potentialbenefits, including the following that were listed in a white paper produced by contributorsto the ETSI NFV Industry Specification Group (NFV ISG) [4]:
• Reduced equipment costs - By running several VNFs on the same physical generalpurpose machine, the cost of maintenance and power consumption can be reduced.An example of NFV with multiple VNFs running on the same host machine is shownin Figure 2.7.
• Faster time to market - New network products and services can be deployed faster asthe reliance on special purpose hardware is reduced. For example, new VNFs can bepushed to previously deployed general purpose machines.
• Scalability of network functions - Capabilities of VNFs can potentially be extended whilestill running on the same platform.
• Innovation encouragement - The deployment difficulty and cost both decrease, facilitat-ing research driven deployments of experimental network services.
16 CHAPTER 2. BACKGROUND
General purpose multicore machine
Host OS
KVM
4 core VM
Linux OS
Misc.applications
Masterthread
Worker1
Worker2
Worker3
Packet Processing Function
...
Other VNFs
OS
App.
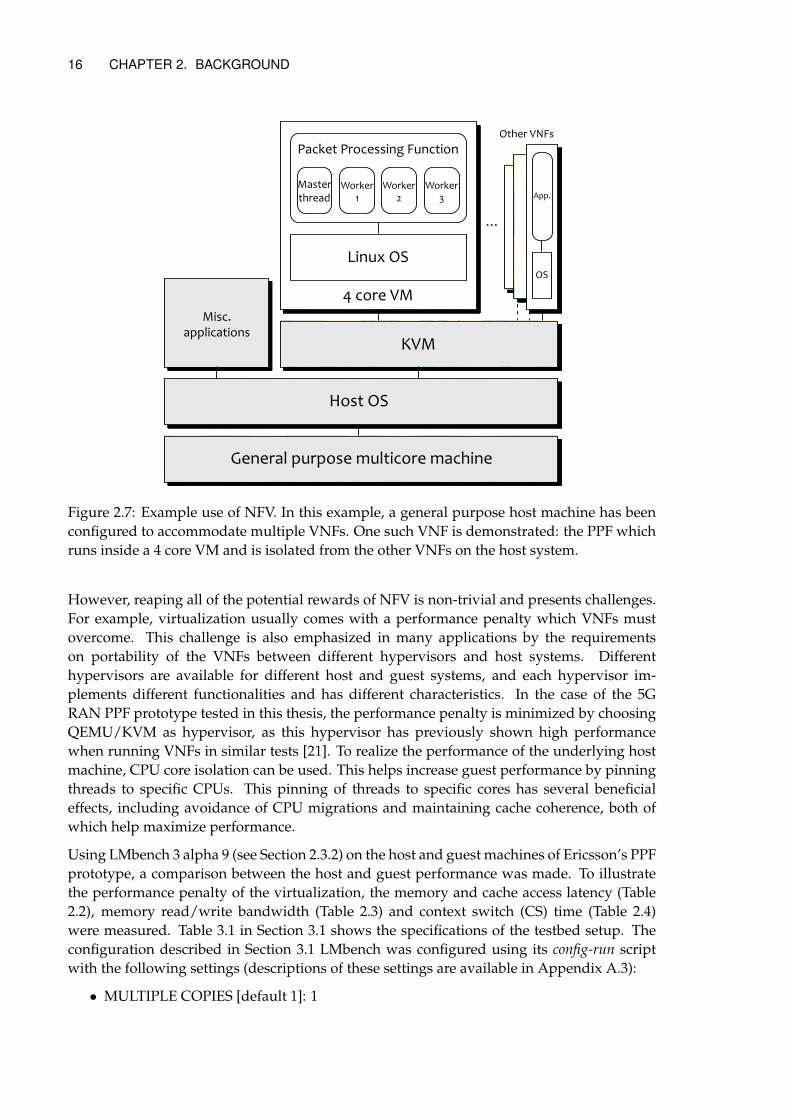
Figure 2.7: Example use of NFV. In this example, a general purpose host machine has beenconfigured to accommodate multiple VNFs. One such VNF is demonstrated: the PPF whichruns inside a 4 core VM and is isolated from the other VNFs on the host system.
However, reaping all of the potential rewards of NFV is non-trivial and presents challenges.For example, virtualization usually comes with a performance penalty which VNFs mustovercome. This challenge is also emphasized in many applications by the requirementson portability of the VNFs between different hypervisors and host systems. Differenthypervisors are available for different host and guest systems, and each hypervisor im-plements different functionalities and has different characteristics. In the case of the 5GRAN PPF prototype tested in this thesis, the performance penalty is minimized by choosingQEMU/KVM as hypervisor, as this hypervisor has previously shown high performancewhen running VNFs in similar tests [21]. To realize the performance of the underlying hostmachine, CPU core isolation can be used. This helps increase guest performance by pinningthreads to specific CPUs. This pinning of threads to specific cores has several beneficialeffects, including avoidance of CPU migrations and maintaining cache coherence, both ofwhich help maximize performance.
Using LMbench 3 alpha 9 (see Section 2.3.2) on the host and guest machines of Ericsson’s PPFprototype, a comparison between the host and guest performance was made. To illustratethe performance penalty of the virtualization, the memory and cache access latency (Table2.2), memory read/write bandwidth (Table 2.3) and context switch (CS) time (Table 2.4)were measured. Table 3.1 in Section 3.1 shows the specifications of the testbed setup. Theconfiguration described in Section 3.1 LMbench was configured using its config-run scriptwith the following settings (descriptions of these settings are available in Appendix A.3):
• MULTIPLE COPIES [default 1]: 1

CHAPTER 2. BACKGROUND 17
• Job placement selection [default 1]: 1
• MB [default ...]: 1024
• SUBSET (ALL|HARWARE|OS|DEVELOPMENT) [default all]: all
• FASTMEM [default no]: no
• SLOWFS [default no]: no
• DISKS [default none]: none
• REMOTE [default none]: none
• Processor mhz [default ... MHz, ... nanosec clock]: [default]
• FSDIR [default /var/tmp]: /var/tmp
• Status output file [default /dev/tty]: /dev/tty
• Mail results [default yes]: no
The results show decreased performance in terms of memory latency and bandwidth.However, the context switch times were actually shorter in some measurements. This maybe due to the fact that the host and guest OS are built around different kernels which mayhandle context switches differently, and that fewer processes ran on the guest machine.
Table 2.2: Latencies of L1-L3 cache and main memory reads in nanoseconds as reportedby LMbench. The bottom row displays the relative performance of the guest machineand is calculated as frequencyguest/frequencyhost for the CPU MHz frequency column andlatencyhost/latencyguest for the cache and main memory latency columns.
CPU clockfrequency(MHz)
L1 cachelatency (ns)
L2 cachelatency (ns)
L3 cachelatency (ns)
Main memorylatency (ns)
Host 2899 1.3790 5.3080 24.3 130.2
Guest 2460 1.6340 11.5 70.4 136.3
Relative guestperformance (%)
84.9 84.394 46.2 34.5 95.52

18 CHAPTER 2. BACKGROUND
Table 2.3: Memory read/write bandwidth for the host and guest machines as reportedby LMbench. The bottom row displays the relative performance of the guest machineand is calculated as frequencyguest/frequencyhost for the CPU frequency column andbandwidthhost/bandwidthguest for the memory read/write bandwidth columns.
CPU clock frequency(MHz)
Memory Read(MB/s)
Memory Write(MB/s)
Host 2899 10000 7450
Guest 2460 6640 5599
Relative guestperformance (%)
84.9 66.4 75.2
Table 2.4: CS time in microseconds for different numbers of processes and process sizes onthe host and guest machines as reported by LMbench. The relative performance of the guestmachine is calculated as frequencyguest/frequencyhost for the CPU frequency column andcshost/csguest for the CS columns.
CPU clockfrequency(MHz)
2p/0K(us)
2p/16K(us)
2p/64K(us)
8p/16K(us)
8p/64K(us)
16p/16K(us)
16p/64K(us)
Host 2899 4.470 3.510 3.040 2.610 1.780 2.430 1.670
Guest 2460 0.630 1.050 1.240 1.840 2.500 2.160 2.600
Relativeguestperformance(%)
84.9 710 334 245 142 71.2 113 64.2
2.2.2 Packet I/O
Realizing packet processing as a VNF with high throughput and low latency requiresefficiency within the I/O and network stack on the packet processing platform. Recent effortsto improve packet processing speeds - such as the Data Plane Development Kit (DPDK) [8]- have been made by reworking the way in which network applications communicate withNetwork Interface Cards (NICs) on Linux platforms. The PPF implementations tested inthis thesis will use DPDK drivers and libraries for packet processing. To better understandDPDK and its effects on packet processing, it is beneficial to also have an understandingof the way in which packets are traditionally handled by Linux; how packets traverse theLinux network stack from arrival at the NIC to an application upon reception, and vice versaduring transmission. This section will now explain the general process of packet reception(Rx) and transmission (Tx) of Ethernet frames in the traditional Linux network paradigmusing the Linux New API (NAPI) [22], based on the previous work by W. Wu, M. Crawford,and M. Bowden in “The performance analysis of linux networking – Packet receiving” [23].
The packet Rx procedure is illustrated in figure 2.8. When an Ethernet frame arrives atthe NIC, it is buffered in the NIC’s internal hardware and transferred to kernel space main
CHAPTER 2. BACKGROUND 19
memory by the device driver using Direct Memory Access (DMA). The NIC and the Linuxkernel each also have buffers of data structures generally referred to as packet descriptorswhich contain packet metadata, realized in the Linux kernel code as a ring buffer structurecalled sk_buff [24]. A packet descriptor of an arriving Ethernet frame is initially stored in theNIC before being copied into an available sk_buff residing in kernel space main memory.The NIC then informs the CPU of the arriving frame with a hardware interrupt request. TheNIC’s interrupt handler, which is part of the NIC driver, then schedules a software interrupt.For each CPU the kernel maintains a poll queue of devices that have made software interruptrequests. The kernel polls the NICs referenced in each CPU’s poll queue via the NICs’ devicedriver poll function to retrieve new packets contained in the sk_buffs of the ring buffer forfurther processing by the kernel’s network stack. When an sk_buff is taken from the ringbuffer, a new sk_buff is allocated and appended to the ring.

20 CHAPTER 2. BACKGROUND
NIC
Poll queue
Newsk_buff
Kernel space
(2)
(3)
(4)
(5)
(6)
(7)
(1)
Ringbuffer
NIC driver
Network layerprocessing
Transport layerprocessing
CPU
Socketqueue
User space application
Figure 2.8: shows the following steps in processing of the arriving Ethernet frames:1. Ethernet frame arrives as physical signals at the NIC and is stored in its internal
hardware buffer.2. Ethernet frame is transferred by the NIC device driver to a ring of packet descriptors
(sk_buffs) in kernel space main memory, using DMA.3. Hardware interrupt from NIC to indicate that a packet has arrived and is available to
the kernel. This hardware interrupt causes the NIC device driver to run its interrupthandler.
4. The NIC device driver schedules a software interrupt request for the NIC device in theCPU’s poll queue. The poll queue is polled to check if any of the NICs have reportednew incoming packets.
5. If a device is scheduled in the CPU’s poll queue, sk_buffs are taken from the ring bufferfor further packet processing in the network stack. New sk_buffs are allocated andappended to the ring to replace the used descriptors.
6. The processed packet is placed in the application’s socket queue.7. Application retrieves packet via read/recv or similar system call.

CHAPTER 2. BACKGROUND 21
The Linux network stack will process incoming packets differently depending on theprotocols involved. IP packets are removed from the ring buffer and processed by calls tothe ip_rcv() (ip6_rcv() for IPv6) function of the IP stack [25, 26]. This function extractsthe IP header, performs checks on the packet, etc. and determines what to do with it, i.e.transport layer processing, forwarding, or dropping the packet. If the packet has arrived atthe destination host, then the kernel will proceed with for example TCP or UDP processingbefore submitting the packet to the receiving application’s socket receive buffer. From there,a user space application can acquire the packet, copying the data into user space memory,and removing the packet from the socket receive buffer using for example the recv() [27]system call.
Packet Tx can be performed by a call to the send() system call (or equivalent) whichcopies the message from user space to kernel space memory where protocol processing isperformed, placing packet information in an sk_buff in a Tx packet descriptor ring, andeventually transmits the packet by calling hard_start_xmit(), which is a pointer to a Txcallback function defined by the NIC’s device driver [28].
While Linux’s traditional approach to packet I/O maintains a clear separation betweenkernel and user mode and protects the NIC device from direct interaction with user spaceapplications, it involves many operations which slow down the performance on the packet’sI/O path as demonstrated by Georgios P. Katsikas in [7]. Key factors in the slow performanceof the traditional Linux network I/O, compared to recent alternatives such as the DataPlane Development Kit (DPDK), include the number of expensive system calls and contextswitches involved in the I/O process, which in large part are caused by the copying of databetween user space and kernel space memory.
To mitigate the problem of slow I/O due to excessive data copying and context switching,DPDK (which is described in greater detail in Section 2.2.4) introduces a set of librariesand drivers which allow direct access to a NIC’s hardware storage from Linux user space.Traditionally Linux Rx requires a receive system call which involves context switching tothe kernel to process the incoming packet before copying the packet data to user space andcontext switching back to user space. By mapping a NIC’s hardware buffers to user spacememory and bypassing the kernel, these context switches and data copies can be avoided.DPDK’s packet I/O process is shown in Figure 2.9.

22 CHAPTER 2. BACKGROUND
NIC
NewMbuf
Kernel space
(1)
(2)
(3)
(4)
Ringbuffer
User spacePoll Mode
Driver
Network layerprocessing
Transport layerprocessing
User space
DPDK Application
Figure 2.9: The following steps are performed during packet Rx using DPDK:1. Ethernet frame arrives as physical signals at the NIC and is stored in its internal
hardware buffer.2. DPDK’s registered Poll Mode Driver (PMD) polls the NIC directly, looking for arriving
Ethernet frames.3. Frames are received by the application in user space, bypassing the kernel to avoid data
copying and context switching between kernel and user space. Frame information isplaced in Mbufs in a ring buffer by the application.
4. The application performs the desired processing of packets at the network andtransport layers.
DPDK maintains a ring buffer of a structure called Mbuf, which corresponds to Linux’ssk_buff structure. These are mapped to the packet descriptors of a NIC and are passed toa user space application by a Poll Mode Driver (PMD) registered by DPDK. Polling requiresa CPU core to actively query the NIC for incoming packets at some rate. When a NIC receivespackets at a high rate, this technique grants good performance by avoiding the requirementfor handling interrupt requests [7]. Since the purpose of the 5G RAN PPF is to processincoming packets at a high rate, polling is the preferred method for acquiring packets from

CHAPTER 2. BACKGROUND 23
the NIC. However, when the rate of incoming traffic is low, the CPU core used to poll theNIC is underutilized.
While DPDK’s network I/O is designed to outperform traditional Linux’s network stack,it blurs the boundaries between Linux kernel and user space by allowing user spaceapplications access to the hardware address space of the NICs. DPDK also leaves all of theresponsibility for packet processing to the application, whereas the Linux kernel’s networkstack performs some of the network and transport layer processing. In the case of the 5GRAN PPF, the increased I/O speed and flexibility in the implementation details of the packetprocessing motivates the use of the DPDK rather than relying on Linux’s traditional networkstack.
2.2.3 Receive Side Scaling
Receive Side Scaling (RSS) is a technology which distributes Rx packets to different CPUcores to achieve good performance scaling in multicore systems. RSS processes the receivedpacket data in the NIC through a hash function, which produces a hash value. The leastsignificant bits of the hash value are used to index an indirection table, which contains theIDs of the available CPU cores. Figure 2.10 shows the general RSS process. [29]
Received Data
IndirectionTable
Hash Function
Hash Value LSBs
...
Core 0
Core 1
Core 2
1
Core ID 0
...
Core ID n
Figure 2.10: An overview of the RSS core selection process. Derivative of the illustration at[29]
DPDK implements RSS as a software function, based on the Toeplitz hash function. Thecode for DPDK’s RSS function which is used by the PPF prototype and was subject to codeoptimization in this thesis project, is shown below and is available at [30]:
static inline uint32_trte_softrss_be(uint32_t *input_tuple, uint32_t input_len,const uint8_t *rss_key)
{uint32_t i, j, ret = 0;
for (j = 0; j < input_len; j++) {for (i = 0; i < 32; i++) {
if (input_tuple[j] & (1 << (31 - i))) {ret ^= ((const uint32_t *)rss_key)[j] << i |
(uint32_t)((uint64_t)(((const uint32_t *)rss_key)[j + 1]) >>
24 CHAPTER 2. BACKGROUND
(32 - i));}
}}return ret;
}
2.2.4 The Data Plane Development Kit
The Data Plane Development Kit (DPDK) is an Open Source BSD licensed∗ set of librariesand NIC drivers for fast packet processing in data plane applications [8]. DPDK can be usedin Linux systems running on a wide range of processor architectures, including Intel x86,ARM and more†. This section summarizes some of the most important design principles andimplementation details of DPDK necessary for understanding this thesis. The information isbased on the DPDK Programmer’s Guide [31] which contains a more complete descriptionof DPDK and its functions. The components of DPDK which are used by the PPF prototypeinclude:
• Environment Abstraction Layer - The Environment Abstraction Layer (EAL) allowsthe libraries of DPDK to communicate directly with low level resources from userspace via an abstract and highly configurable interface. It is responsible for theinitialization of DPDK, memory mappings for direct access to the NICs’ memory, CPUcore affinitization, keeping track of CPU specific properties and functions, and more.
• Mbuf Library - Similar to the sk_buff in the traditional Linux packet I/O paradigm,as was described in Section 2.2.2, DPDK uses packet descriptor buffers for incomingand outgoing packets, although they differ from the sk_buff in the details of theirimplementation.
• Mempool Library - The Mempool library handles allocation of Mbufs by DPDK appli-cations. It includes features such as per logical core (lcore) caching of Mbufs to avoidexcessive inter-core communication. It also optimizes the spread of objects over theDRAM and DDR3 memory channels by memory alignment.
• Ring Library - While traditional Linux ring buffers are implemented as a circular doublylinked list of the packet descriptor struct sk_buff, DPDK implements a ring buffer as afixed size table of pointers to packet descriptors. This design improves the performanceof queue operations at the cost of a larger memory footprint and less flexibility. Someof the features of the DPDK ring manager library include its lockless implementation,multi- and single-producer/consumer operations to append or retrieve packets andbulk operations for appending or retrieving a specified number of packets at once.
• Poll Mode Drivers - DPDK allows an application to register a Poll Mode Driver (PMD).This PMD is used to poll a system’s NICs in order to receive packets. The purpose ofpolling the NICs is to avoid the use of interrupts, which can degrade the performanceof high throughput VNFs. Using DPDK’s hardware abstraction layer (HAL), the PMDcan poll the NIC and retrieve packets directly in user space.
∗ https://opensource.org/licenses/BSD-3-Clause † There is also a port of DPDK for FreeBSD.

CHAPTER 2. BACKGROUND 25
• Eventdev Framework - A framework which supports an event driven packet processingmodel. This framework introduces scheduling functionality and dynamic load balanc-ing between lcores.
The 5G RAN PPF proposed by Ericsson is a virtualized adaption of the PPF of the DUinside E-UTRAN’s eNBs. This PPF is built using DPDK’s Eventdev framework [9] with asoftware event device driver. The PPF maps a virtual event device inside the user space ofa Linux guest to the physical NICs of the host machine. An event device is essentially anevent scheduler, which configures a set of event queues used to hold different types of eventswaiting to be scheduled. An event is a unit of schedulable work, for example a packetthat has just been received and awaits further processing, a timer expiry notification, oran intermediate unit of work between packet processing pipeline stages. Linked to eachevent queue is an event port, which is used to configure the enqueue and dequeue operationsassociated with one or more event queues. An event port can be linked to multiple eventqueues. The event port configures enqueue depth and dequeue depth, which specify the numberof event objects to enqueue or dequeue in a burst operation where multiple events areenqueued or dequeued at once. This parameter may affect the throughput and latencyof packet processing since burst enqueue/dequeue operations reduce the total amountof enqueue/dequeue operations that have to be performed. Depending on the balancebetween the cost of a single enqueue/dequeue operation and the processing time afterenqueue/dequeue, this may increase throughput and in some cases reduce the averagepacket delivery latency of the application. However, burst operations may also increasethe per-packet latency when the operation must wait for a certain number of events to arrivebefore the enqueue/dequeue. The maximum time to wait for enough events in the eventqueue to perform a successful burst operation on an event port is specified by the event portstructure. Also configured by the event port is the new event threshold, which is used to controlthe number of new events which are allowed to enter the event device. This parameter canbe used to make the Eventdev complete processing of older events before accepting newones. As such, an optimized setting of this parameter may reduce the latency of packets incases when many new events are produced.
In a multicore architecture, different CPU cores can be assigned to poll the event queues andschedule events of any type or specified types. This approach makes it easy to implementnatural and dynamic balancing of workloads between CPU cores. One lcore (the DPDKmaster lcore) is reserved for program control while the rest of the lcores can be divided asdesired with a subset of lcores used for scheduling of events, a subset of lcores for Rx/Tx,and the rest of the lcores as workers for different packet processing stages. The event queuesare capable of simultaneously queueing events from multiple flows. This functionality canbe configured using different event scheduling types, which specify how events belongingto a flow can be scheduled for processing. The scheduling types are:
Ordered Events from a flow handled by the event queue can be scheduled for parallelprocessing on different lcores, but the original order of the events is maintained.Correct ordering is ensured by the enqueue operation on the destination event queueof the events. The event port handling the events of an ordered event flow will onlyprocess events of this particular flow until the burst dequeue operation is performedon the port, or earlier if the burst enqueue operation is performed with an option torelease the flow context.

26 CHAPTER 2. BACKGROUND
Atomic An atomic flow can be scheduled only to a single event port at a time. Thisdiffers from the ordered scheduling type by not scheduling events concurrently todifferent ports. However, the original order of events is maintained also for the atomicscheduling type since only a single port will schedule processing of a flow.
Parallel Events from a flow can be scheduled in parallel to different ports. Event order isnot necessarily maintained.
The ASCII image in Figure 2.11 displays the functionality of the Eventdev framework.
The PPF software is driven by DPDK and receives and transmits packets directly from Linuxuser space. Incoming packets are acquired from the NIC’s Rx queues using a PMD whichis scheduled on a CPU core reserved for handling of packet I/O. When a new packet hasarrived, a packet Rx event is generated by the event device and is placed in an event queuefor packet processing by the worker cores. The worker cores dequeue new and intermediateevents from the event queues based on decisions from the scheduler cores. The worker coresthen perform the different stages of packet processing, which eventually finishes and maygenerate a Tx event for the response to/forwarding of the packet that was initially received.

CHAPTER 2. BACKGROUND 27
+-----------------+| +-------------+ |
+-------+ | | flow 0 | ||Packet | | +-------------+ ||event | | +-------------+ || | | | flow 1 | |port_link(port0, queue0)+-------+ | +-------------+ | | +--------++-------+ | +-------------+ o-----v-----o |dequeue +------+|Crypto | | | flow n | | | event +------->|Core 0||work | | +-------------+ o----+ | port 0 | | ||done ev| | event queue 0 | | +--------+ +------++-------+ +-----------------+ |+-------+ ||Timer | +-----------------+ | +--------+|expiry | | +-------------+ | +------o |dequeue +------+|event | | | flow 0 | o-----------o event +------->|Core 1|+-------+ | +-------------+ | +----o port 1 | | |
Event enqueue | +-------------+ | | +--------+ +------+o-------------> | | flow 1 | | |
enqueue( | +-------------+ | |queue_id, | | | +--------+ +------+flow_id, | +-------------+ | | | |dequeue |Core 2|sched_type, | | flow n | o-----------o event +------->| |event_type, | +-------------+ | | | port 2 | +------+subev_type, | event queue 1 | | +--------+event) +-----------------+ | +--------+
| | |dequeue +------++-------+ +-----------------+ | | event +------->|Core n||Core | | +-------------+ o-----------o port n | | ||(SW) | | | flow 0 | | | +--------+ +--+---+|event | | +-------------+ | | |+-------+ | +-------------+ | | |
^ | | flow 1 | | | || | +-------------+ o------+ || | +-------------+ | || | | flow n | | || | +-------------+ | || | event queue n | || +-----------------+ || |+-----------------------------------------------------------+
Figure 2.11: Functionality of the Eventdev framework - taken from the DPDK Eventdevdocumentation [9].

28 CHAPTER 2. BACKGROUND
2.2.5 A 5G RAN PPF Prototype
The 5G RAN PPF prototype developed by Ericsson is based on the DPDK Eventdevframework as described in Section 2.2.4. This section will further describe the way in whichthe PPF prototype was configured.
The PPF prototype is designed to run on a general purpose machine using at least 4 CPUcores. The cores are distributed as follows: one master core to process user I/O for PPFcontrol, one core to perform scheduling, one core to perform both Rx and Tx of packets,and one worker core to perform packet processing. If the PPF prototype is offered morethan 4 cores, the additional cores are configured as worker cores. The PPF prototype wasconfigured with a centralized software scheduler running on a single core and performingthe scheduling for all worker cores. The PPF prototype has 7 event queues: 1 Rx queue, 1Tx queue, 1 timer queue and 4 worker queues. The Rx and Tx queues are used to enqueueevents resulting from packet reception and events of packet transmissions to be executedrespectively. The timer event queue is used to enqueue timer expiry events. The workerqueues are used to enqueue events for different stages of packet processing. For the purposeof this thesis the PPF prototype was configured with 4 processing stages, each with theirown event queue. The first stage performs classification of events to decide how to processit further. This stage also increments the event flow ID of the event, which loops backto 0 at 512. Thus, the PPF prototype creates 512 flows. The second and third stages aredummy stages which consume a number of CPU cycles to simulate the time consumptionof packet processing. The fourth and final stage also consumes a number of cycles beforeapplying some actual packet processing and sending the packet out on the Tx event queuefor transmission. The priority of each stage decreases with the stage number, i.e. the firststage has the highest priority and the fourth stage has the lowest priority.
The PPF prototype has 4 event ports linked to its event queues. The Rx, Tx and timer eventqueues each have their own event port and are the only queues linked to their respectiveports. The worker event queues all share the last event port.

CHAPTER 2. BACKGROUND 29
Tx Event Queue
Rx Event Queue
Timer Event Queue
Worker Event Queue 1
Worker Event Queue 2
Worker Event Queue 3
Worker Event Queue 4
Rx Event Port
Tx Event Port
Timer Event Port
Worker Event Port
SchedulerCore
Rx/TxCore
WorkerCore
Rx Tx
Timer & Tx Events
Next WorkerStage
Rx
Figure 2.12: The PPF prototype is programmed using DPDK’s Eventdev framework andwas configured with 7 event queues and 4 event ports. It runs on a minimum of 4 cores. Inthis figure, the CPU core running the DPDK master thread has been left out since it is notconfigured by the Eventdev framework.
2.3 Performance Optimization
This section describes the ideas that helped optimize the performance of the PPF prototype.Section 2.3.1 gives a brief introduction to some system metrics and their effects on theperformance of systems and applications. Section 2.3.2 presents a set of tools which canbe used to gather information about the presented system metrics.
2.3.1 System Performance Factors
There are a variety of system metrics and factors that are vital to a system’s performance.The performance impact of these metrics may be affected by reconfiguration and codeoptimization. A few of these are described below.
2.3.1.1 Context switch cost
A context switch (CS) means that the state of a process is saved and later restored to thesaved state. A CS can occur during multitasking when a process is swapped out for another,at an interrupt, or when switching between Linux user/kernel space. The number of CSsand cost of context switching can have a large impact on the system’s performance since

30 CHAPTER 2. BACKGROUND
each CS introduces additional overhead in execution time. The cost of a CS can depend onthe number of processes in the system, the size of a process, the choice of scheduler, etc. Forexample, if a CS occurs due to an excessive use of system calls in an application, i.e. the CS isa switch between Linux user and kernel space, then the performance of the application maybe optimized by reducing the number of system calls. Figure 2.13 shows general process ofa CS.
RAM
Execution time
Process 2
Program Counter
R0
R1
R2
Rn
...
CPU
CS
Program Counter
R0
R1
R2
Rn
...
Process 1
Program Counter
R0
R1
R2
Rn
...
Process 1
Process 2
Figure 2.13: The general process of a context switch (CS). Before the CS, the CPU executesprocess 1. During the CS, the CPU stores its registers in main memory, and loads into itsregisters the previously stored registers from process 2 from main memory. Process 2 thenproceeds to execute. The diagram at the bottom illustrates the execution time overhead ofthe CS.
2.3.1.2 Memory access cost
The number of memory access and the cost of memory access by an application can havea large impact on system performance. The cost of memory access is determined bythe bandwidth and latency of memory access operations, which result from the system’shardware specifications, the amount of contention for memory resources, etc. The cachehit/miss rate also affects memory access, as we shall see next.
2.3.1.3 Cache hit/miss ratio
To reduce the cost of memory access, most modern general purpose processors are equippedwith a small amount of fast but expensive memory called cache memory. This cache memoryis often arranged in a hierarchy of increasingly larger but slower memories as the distanceto the processor increases. A common cache configuration is to have level 1 (L1 cache), 2(L2 cache), and 3 (L3 or LLC for last level cache) caches. The L1 cache is often divided intoseparate a instruction cache and data cache. When an application makes a memory access,

CHAPTER 2. BACKGROUND 31
a lookup of the accessed memory address will simultaneously be performed in the cachehierarchy. If the address is present in a cache, then the instruction or data will be fetchedfrom the cache instead of the main memory. This is referred to as a cache hit and is usuallymany times faster than accessing the main memory. If the accessed address is not present ina cache, the instruction or data will be fetched from main memory and usually also copiedto the cache for future references. This is referred to as a cache miss. If the cache is full whenbringing a new entry into the cache, old entries must be evicted. Maintaining a high cachehit rate can be an important factor in performance optimization.
Caches generally store instructions and data that have recently been used, or that have beenfetched from memory due to their close proximity in the memory’s address space. Theproximity of accesses in time is often referred to as temporal locality, and proximity in addressspace as spatial locality. To utilize the cache as much as possible, it is important to consider thetemporal and spatial locality of memory access when programming an application. Effectiveuse of a system’s caches can often drastically increase the performance of an application.
2.3.1.4 CPU Load Balance
A balanced workload among the CPU cores is an important factor when optimizing parallelcode in a multicore system. DPDK’s Eventdev framework performs dynamic load balancingamong its worker cores. However, there are still potential bottlenecks when the number ofscheduling, Rx/Tx, and worker cores are static. For example, with a large number of workercores, having only a single scheduling or Rx/Tx core might form a bottleneck. With sucha bottleneck, speedup of the packet processing by the worker cores will not help. For thisreason, it is important to assign the right number of cores to each functionality.
2.3.2 Performance Profiling
This section presents the set of tools that were used to gather information about the metricsdescribed in Section 2.3.1 in order to present a basis for optimization of the 5G RAN PPF.
2.3.2.1 LMbench
LMbench [32] is a benchmark suite for Linux systems capable of measuring a variety ofsystem performance metrics. LMbench provides benchmarks for the bandwidth of cachedfile reads, memory copying, memory reads, etc. as well as latency benchmarks for contextswitching, process creation, signal handling, memory reads, etc. This thesis project usedLMbench 3 alpha 9 to measure and compare host and guest machine performance (seeSection 2.2.1. LMbench can be configured using its config-run script, which configuresdifferent test parameters and gathers basic performance information such as the CPU’sclock frequency. Using the results script, the tests are then performed according to theconfiguration file produced by config-run. Test results can be viewed using the make seecommand from the LMbench root directory. The following process was used to gatherperformance information on the PPF prototype’s host and guest machines:
1. Shut down the PPF process
32 CHAPTER 2. BACKGROUND
2. Run LMbench3 script ./config-run from the lmbench/scripts/ directory
3. Run LMbench3 script ./results from the lmbench/scripts/ directory
4. Get result report using the make see command from the lmbench/ directory
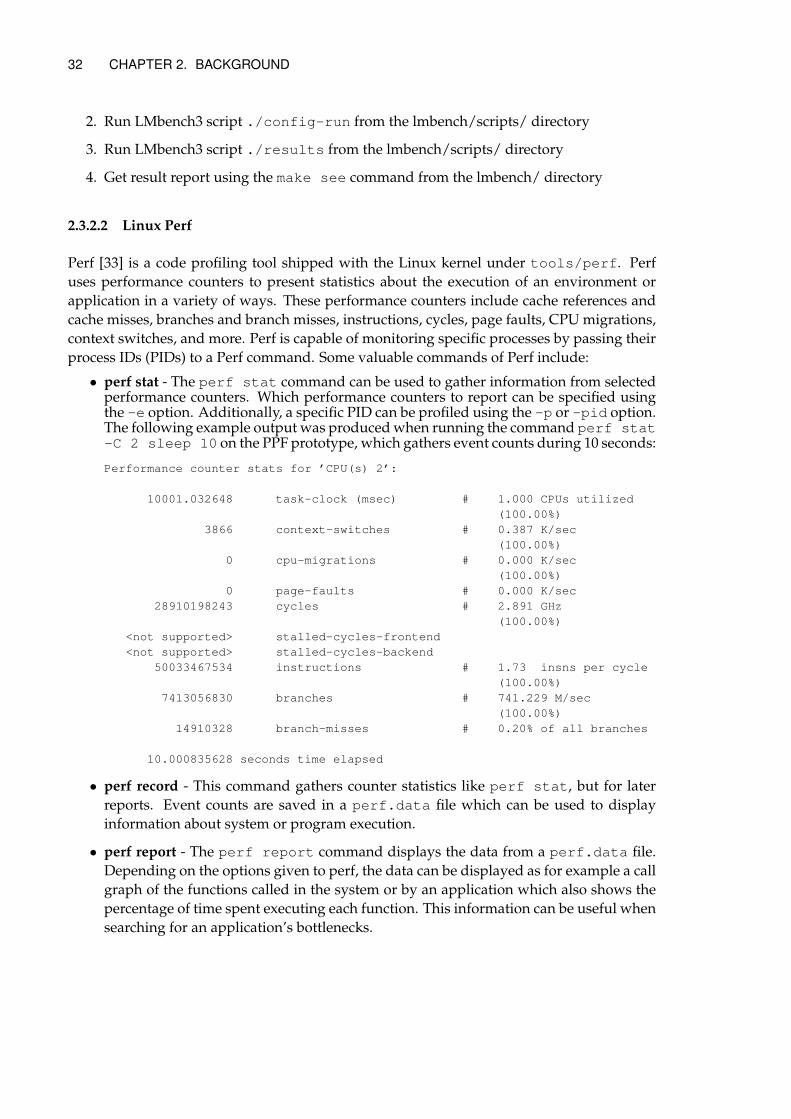
2.3.2.2 Linux Perf
Perf [33] is a code profiling tool shipped with the Linux kernel under tools/perf. Perfuses performance counters to present statistics about the execution of an environment orapplication in a variety of ways. These performance counters include cache references andcache misses, branches and branch misses, instructions, cycles, page faults, CPU migrations,context switches, and more. Perf is capable of monitoring specific processes by passing theirprocess IDs (PIDs) to a Perf command. Some valuable commands of Perf include:
• perf stat - The perf stat command can be used to gather information from selectedperformance counters. Which performance counters to report can be specified usingthe -e option. Additionally, a specific PID can be profiled using the -p or -pid option.The following example output was produced when running the command perf stat-C 2 sleep 10 on the PPF prototype, which gathers event counts during 10 seconds:
Performance counter stats for ’CPU(s) 2’:
10001.032648 task-clock (msec) # 1.000 CPUs utilized(100.00%)
3866 context-switches # 0.387 K/sec(100.00%)
0 cpu-migrations # 0.000 K/sec(100.00%)
0 page-faults # 0.000 K/sec28910198243 cycles # 2.891 GHz
(100.00%)<not supported> stalled-cycles-frontend<not supported> stalled-cycles-backend
50033467534 instructions # 1.73 insns per cycle(100.00%)
7413056830 branches # 741.229 M/sec(100.00%)
14910328 branch-misses # 0.20% of all branches
10.000835628 seconds time elapsed
• perf record - This command gathers counter statistics like perf stat, but for laterreports. Event counts are saved in a perf.data file which can be used to displayinformation about system or program execution.
• perf report - The perf report command displays the data from a perf.data file.Depending on the options given to perf, the data can be displayed as for example a callgraph of the functions called in the system or by an application which also shows thepercentage of time spent executing each function. This information can be useful whensearching for an application’s bottlenecks.

CHAPTER 2. BACKGROUND 33
2.3.2.3 IxNetwork
Ixia’s IxNetwork [34] is a traffic generator application capable of generating a variety oftypes of network traffic. This thesis uses IxNetwork to measure the throughput and latencyof Ericsson’s 5G RAN PPF prototype.

Chapter 3
Methodology
This chapter describes the methodology used to find an optimized implementation ofEricsson’s 5G RAN PPF prototype, including the testbed setup, the parameters which weretweaked and the software that was used for the performance measurements.
3.1 Testbed Setup
This section provides an overview of the machines involved in the experiments and theirconnections, as well as the configuration used for the 5G RAN PPF prototype. For thepurpose of the experiments in this thesis, the PPF prototype was configured to use a UDPrelay which receives and forwards UDP packets with a four stage packet processing pipeline,instead of the more complicated software used in a real world deployment of the 5G RANPPF. This was done to focus the optimization effort on the efficiency of the Eventdev andVM configurations rather than on the packet processing code. The testbed setup and testenvironment were provided by Ericsson. This both makes the results of these measurementsmore generically usable and makes them unrepresetative for the performance of the actualEricsson 5G RAN PPF.
Figure 3.1 displays an overview of the testbed setup. The PPF prototype runs as a VM witha Wind River Linux 8 guest OS. In the testbed used in the experiments for this thesis, theQEMU-KVM hypervisor was used. Table 3.1 lists the specifications of the testbed.
34
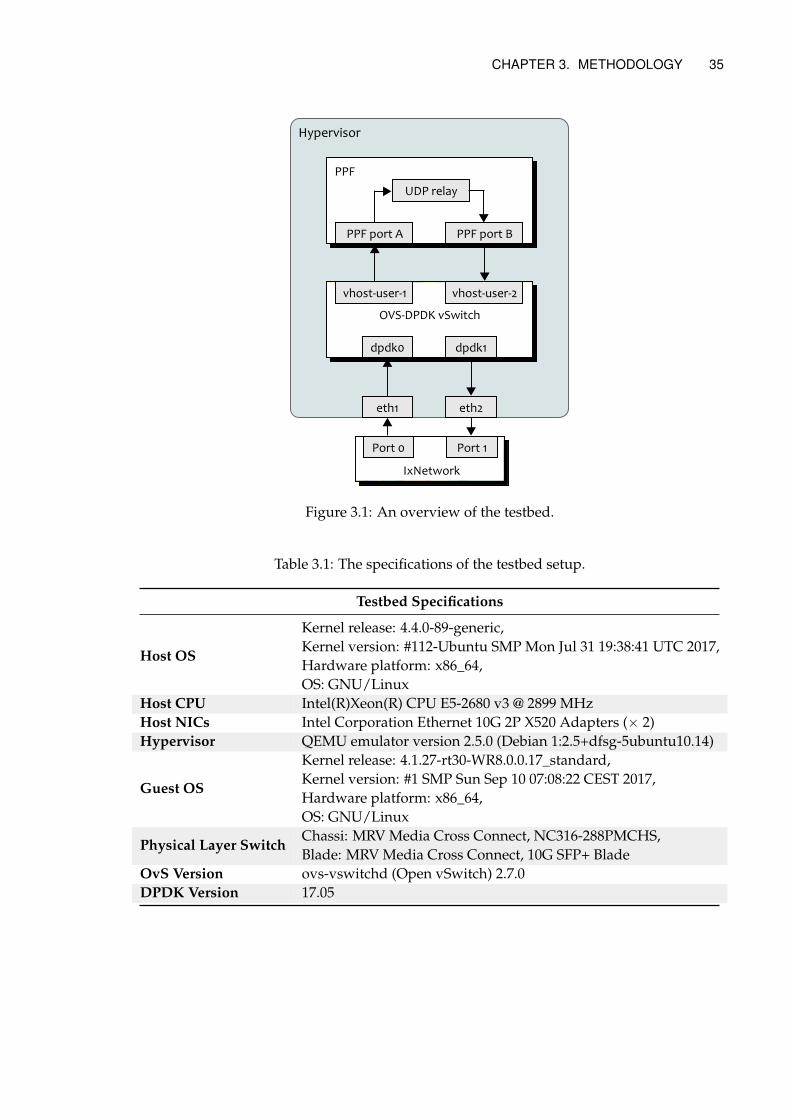
CHAPTER 3. METHODOLOGY 35
IxNetwork
OVS-DPDK vSwitch
PPF
Hypervisor
Port 0 Port 1
eth1 eth2
dpdk0 dpdk1
vhost-user-1
UDP relay
vhost-user-2
PPF port A PPF port B
Figure 3.1: An overview of the testbed.
Table 3.1: The specifications of the testbed setup.
Testbed Specifications
Host OS
Kernel release: 4.4.0-89-generic,Kernel version: #112-Ubuntu SMP Mon Jul 31 19:38:41 UTC 2017,Hardware platform: x86_64,OS: GNU/Linux
Host CPU Intel(R)Xeon(R) CPU E5-2680 v3 @ 2899 MHzHost NICs Intel Corporation Ethernet 10G 2P X520 Adapters (× 2)Hypervisor QEMU emulator version 2.5.0 (Debian 1:2.5+dfsg-5ubuntu10.14)
Guest OS
Kernel release: 4.1.27-rt30-WR8.0.0.17_standard,Kernel version: #1 SMP Sun Sep 10 07:08:22 CEST 2017,Hardware platform: x86_64,OS: GNU/Linux
Physical Layer SwitchChassi: MRV Media Cross Connect, NC316-288PMCHS,Blade: MRV Media Cross Connect, 10G SFP+ Blade
OvS Version ovs-vswitchd (Open vSwitch) 2.7.0DPDK Version 17.05

36 CHAPTER 3. METHODOLOGY
To prepare the PPF prototype for throughput and latency tests, the hypervisor and VM wereoptimized to process traffic with minimum packet drops. To reduce the number of packetdrops caused by the host and guest OS, the following configuration was used:
• CPU core pinning using the isolcpus boot parameter. This reduces unwanted CPUmigrations and context switches by isolating the selected CPU cores from the Linuxkernel scheduler. By isolating the cores on which PPF threads are running, the kernelwill not schedule other tasks unless CPU affinity system calls are explicitly made forthis purpose. On the hypervisor, QEMU-KVM processes running the PPF/VM threadswere pinned to the physical CPU cores 6, 8, 10, 12, 14, 16, 18, 20, 22 on socket 0. Core 0was assigned the non-PMD threads of DPDK and QEMU-KVM/VM. The OvS bridgePMD threads (one per NIC) were pinned to cores 2 and 4 respectively.
• The nohz_full [35] boot parameter was set for the cores running QEMU-KVM/PPF andOvS threads. This parameter tells the kernel to omit scheduling-clock ticks for selectedcores, which can reduce OS jitter by for example reducing the number of contextswitches. This parameter was set for cores 2, 4, 6, 8, 10, 12, 14, 16, 18, 20, and 22 onthe host machine. The VM guest kernel was compiled without this capability.
• The rcu_nocbs boot parameter was set for the cores running PPF threads so that theydo not receive RCU callbacks, which would take time away from the processing ofpackets.
• Disabling CPU frequency throttling by the command:cpupower frequency-set -g performance -d 2.9G -u 2.9G, to avoid a pe-riod of decreased performance when the CPU has been in an idle state before itincreases the CPU frequency.
• Disabling automatic NUMA balancing by the command:echo 0 > /proc/sys/kernel/numa_balancing. Automatic NUMA balancingoptimizes the performance of an application running on a NUMA system by movingthe application’s tasks closer to the memory that it references. The PPF prototype isconfigured to run on a single NUMA socket, making NUMA balancing unnecessary.Relocation of a PPF thread would temporarily halt its processing of packets whichcould decrease performance and cause packet drops.
• Disabling HyperThreading by the command: ./set_ht 0. Enabling HyperThread-ing may increase performance. However, for the purpose of reproducibility of thebenchmarks in this thesis, all PPF prototype threads were run on physical cores.
• Setting echo 0 > /sys/module/kvm/parameters/halt_poll_ns to avoid halt-ing idle virtual CPUs of the KVM guest, which would require to wake them up whennew processing work is received. The process of waking threads up may negativelyimpact the latency performance of the PPF.
3.2 Throughput Measurements
This thesis evaluates the maximum throughput of the modified PPF prototype underdifferent configurations. To measure the maximum throughput, IxNetwork was used to
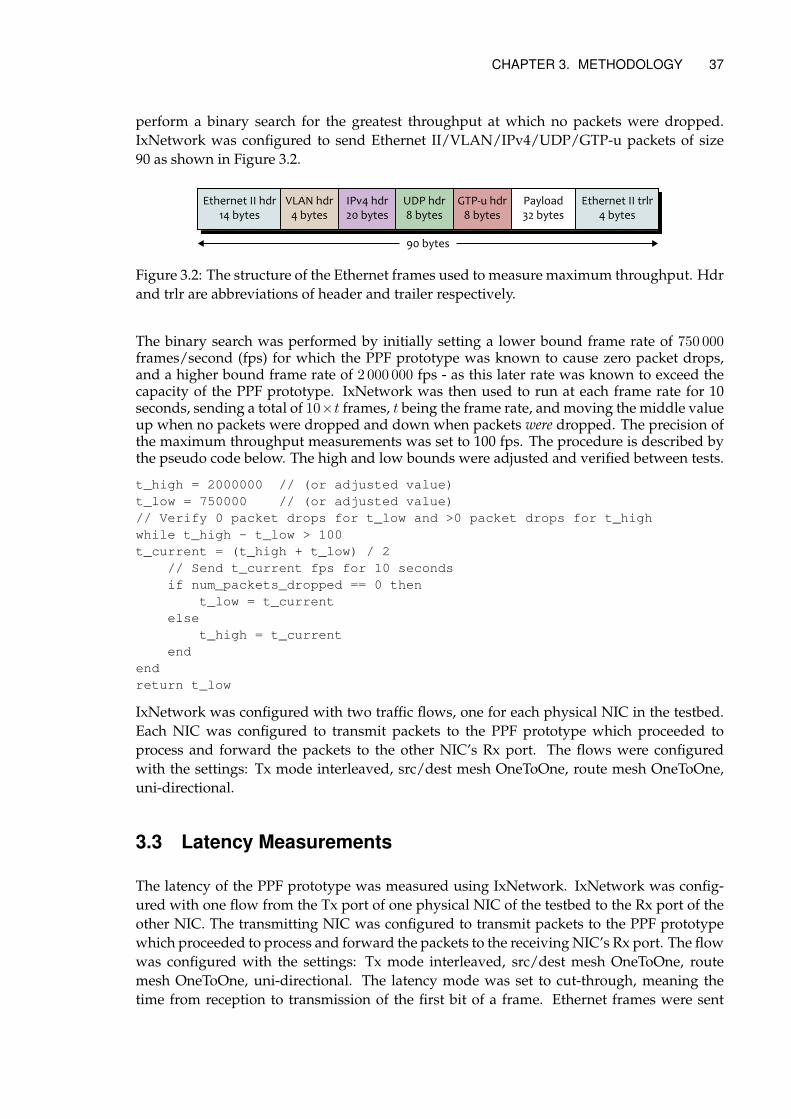
CHAPTER 3. METHODOLOGY 37
perform a binary search for the greatest throughput at which no packets were dropped.IxNetwork was configured to send Ethernet II/VLAN/IPv4/UDP/GTP-u packets of size90 as shown in Figure 3.2.
Ethernet II hdr14 bytes
90 bytes
VLAN hdr4 bytes
IPv4 hdr20 bytes
UDP hdr8 bytes
GTP-u hdr8 bytes
Payload32 bytes
Ethernet II trlr4 bytes
Figure 3.2: The structure of the Ethernet frames used to measure maximum throughput. Hdrand trlr are abbreviations of header and trailer respectively.
The binary search was performed by initially setting a lower bound frame rate of 750 000frames/second (fps) for which the PPF prototype was known to cause zero packet drops,and a higher bound frame rate of 2 000 000 fps - as this later rate was known to exceed thecapacity of the PPF prototype. IxNetwork was then used to run at each frame rate for 10seconds, sending a total of 10×t frames, t being the frame rate, and moving the middle valueup when no packets were dropped and down when packets were dropped. The precision ofthe maximum throughput measurements was set to 100 fps. The procedure is described bythe pseudo code below. The high and low bounds were adjusted and verified between tests.
t_high = 2000000 // (or adjusted value)t_low = 750000 // (or adjusted value)// Verify 0 packet drops for t_low and >0 packet drops for t_highwhile t_high - t_low > 100t_current = (t_high + t_low) / 2
// Send t_current fps for 10 secondsif num_packets_dropped == 0 then
t_low = t_currentelse
t_high = t_currentend
endreturn t_low
IxNetwork was configured with two traffic flows, one for each physical NIC in the testbed.Each NIC was configured to transmit packets to the PPF prototype which proceeded toprocess and forward the packets to the other NIC’s Rx port. The flows were configuredwith the settings: Tx mode interleaved, src/dest mesh OneToOne, route mesh OneToOne,uni-directional.
3.3 Latency Measurements
The latency of the PPF prototype was measured using IxNetwork. IxNetwork was config-ured with one flow from the Tx port of one physical NIC of the testbed to the Rx port of theother NIC. The transmitting NIC was configured to transmit packets to the PPF prototypewhich proceeded to process and forward the packets to the receiving NIC’s Rx port. The flowwas configured with the settings: Tx mode interleaved, src/dest mesh OneToOne, routemesh OneToOne, uni-directional. The latency mode was set to cut-through, meaning thetime from reception to transmission of the first bit of a frame. Ethernet frames were sent

38 CHAPTER 3. METHODOLOGY
using a custom IMIX configuration with frames of size 86 bytes with weight 7, 592 byteswith weight 4, and 1522 bytes with weight 1. The choice of 86 bytes as the size for smallpackets was made because this was the smallest frame size to accommodate internal headers.For the large frames, 1522 bytes was chosen as the size as this is the standard MaximumTransmission Unit (MTU) of an Ethernet II frame with VLAN tagging when not using jumboframes. 592 bytes was chosen by Ericsson as a suitable size of medium frames. Initial testsrevealed that the average cut-through latency reported generally stabilized after about 40seconds, thus 40 second latency measurements were performed in subsequent testing. Thethroughput was set to 500 000 fps because early tests revealed this was a safe number thatmost configurations could handle.
3.4 Code Profiling
Code profiling with Linux Perf was used as a complement to the throughput and latencymeasurements. Linux Perf was used to look for slow functions, bad cache performance orother performance inhibiting behavior. The main commands used to perform profiling werethe "perf record", "perf report", and "perf stat" commands. To gain knowledge about theexecution time of different functions in the code, the following command was used: "perfrecord -C <core IDs> sleep 10". This command records the portions of the total executiontime that different functions spend executing on the specified cores during 10 seconds. Thesestatistics can then be viewed using "perf report".
To gain knowledge about cache statistics, the following command was used: "perf stat -C <core IDs> -e L1-dcache-loads,L1-dcache-load-misses,L1-dcache-stores sleep 10". Thiscommand reports the cache miss ratio on the specified cores during 10 seconds. Thiscommand can also be used with "stat" replaced by "record", which produces a record ofwhere cache hits/misses occur.
3.5 Multicore Performance Scaling
To gain some insight into the parallelism of the PPF, multicore performance scaling tests wereperformed with different numbers of Rx/Tx cores and worker cores. Figure 3.3 shows theevent path with the default core assignment with the maximum number of workers.

CHAPTER 3. METHODOLOGY 39
Rx/TxCore
WorkerCore
WorkerCore
WorkerCore
RxQueue
TxQueue
Worker StageQueues
WorkerCore
WorkerCore
WorkerCore
WorkerCore
1
2
3
4
Figure 3.3: The default core assignment and path of events with 1 Rx/Tx core and 7 workercores.
Each test included measurements of throughput and latency according to the methodologydescribed in Sections 3.2 and 3.3. Tests seemed to reveal that no significant performancegain occurred when increasing the number of workers beyond 4 or 5, which could suggest abottleneck in the delivery of packets from the Rx/Tx core to the worker cores. To investigatethis, the PPF prototype was reprogrammed to support multiple Rx/Tx cores, with an optionto reconfigure the core affinity at boot time by reading a parameter file. The throughput andlatency scaling tests were then rerun with 2 Rx/Tx cores and up to 6 worker cores. Figure3.4 shows the event path with the new assignment of cores.

40 CHAPTER 3. METHODOLOGY
Rx/TxCore
Rx/TxCore
WorkerCore
WorkerCore
RxQueue
TxQueue
Worker StageQueues
WorkerCore
WorkerCore
WorkerCore
WorkerCore
Figure 3.4: An alternative core assignment and path of events using 2 Rx/Tx cores and 6worker cores.
3.6 Packet Processing Stage Consolidation
The Eventdev framework enables the programmer to perform packet processing in differentstages. The default configuration of the PPF prototype has workers performing packetprocessing in 4 stages (illustrated in figure 3.5):
1. A classification stage where events are classified depending on their type and sent onto the next event queue for further processing.
2. A dummy stage which simulates time consumption from packet processing by activelyconsuming the specified number of instruction cycles. This stage consumes a config-urable number of cycles per packet event and forwards the events to the next stage’sevent queue. For the baseline tests, this stage was configured to consume 0 cycles.
3. Another dummy stage like stage 2. This stage was set to consume 0 cycles for baselinetests.
4. The last worker stage consumes instruction cycles (set to 0 for baseline tests) in thesame way as the previous two stages, and continues to process the packets and sendthem to the Tx event queue.

CHAPTER 3. METHODOLOGY 41
Rx
PacketsPackets
TxRx/Tx Core
Scheduler Core
Timer
WorkerDispatcher(Stage 1)
Dummy“Processing”
(Stage 2)
Worker Core
Dummy“Processing”
(Stage 3)
PacketProcessing(Stage 4)
Figure 3.5: The path taken by packet events. The Rx/Tx core receives packets and forwardsevents into the eventdev. The worker processes packet (and timer) events through its fourstages and sends them back to the Rx/Tx core through the event queues. The Rx/Tx coretakes Tx events and sends out packets. The scheduler core schedules events for the differentcores and decides their processing order.
One of the reasons for performing the packet processing in multiple stages is to presentthe Eventdev framework with smaller units of work which can be balanced among theworker cores. However, when the processing requires events to maintain their original orderbetween stages, this introduces overhead from a larger number of enqueue and dequeueoperations. More stages also introduces a degree of parallelism overhead due to lockingmechanisms resulting from the atomic scheduling of events. For this reason, it makes senseto test a configuration with consolidated processing stages which classify packets early andprocesses them to completion. This approach should reduce the amount of overhead andpotentially improve the cache hit ratio by keeping the events in the CPUs’ L1 caches forlonger. These potential improvements are at the cost of potentially having the workloadsunevenly balanced. To test this approach, the PPF prototype was reprogrammed with areduced number of worker stages, as shown in figure 3.6:
1. The same classification stage as before.
2. A consolidation of stages 2, 3, and 4, where packets need only be dequeued once andenqueued once, and no synchronization between events of the same flow is needed.The same total amount of cycles were consumed as in the default configuration.

42 CHAPTER 3. METHODOLOGY
Rx
PacketsPackets
TxRx/Tx Core
Scheduler Core
Timer
WorkerDispatcher(Stage 1)
Dummy“Processing”
(Stage 2)
Worker Core
Dummy“Processing”
(Stage 3)
PacketProcessing(Stage 4)
Figure 3.6: The event path with consolidated worker stages. The classification of packetsremains in its own stage while the 3 subsequent stages have been merged into a single stage.
To test its throughput and latency, the consolidated configuration was then included in themulticore performance scaling tests described in Section 3.5.
3.7 Rx Optimization - RSS Patch
The Rx driver of the PPF prototype makes use of DPDK’s RSS functionality, as described inSection 2.2.3. The RSS hash value is computed using the Toeplitz hash function, providedby DPDK’s hash library [30]. When profiling the PPF prototype using Linux Perf on theRx/Tx core after it was discovered that Rx seemed to be a performance bottleneck, it wasrevealed that a substantial portion of the execution time was spent performing RSS hashcomputations. When sending packets with a flow setup as described in Section 3.2 butwith both flows reconfigured to send continuous traffic at 1 200 000 fps which was closeto the maximum throughput achieved for the default PPF prototype configuration using2 Rx/Tx cores, Linux Perf reported that the portion of time spent computing the RSShash function was 29% on the Rx/Tx core. The computation loops through each bit ofa 32-bit integer, checks if each bit is set, and performs further operations if the bit is set.This is unnecessarily inefficient, since there are alternatives which avoid looping throughall the unset bits. An example of this was suggested in a patch by Zhou Yangchao [36].This patch uses the rte_bsf32 function, which is an inline function calling GCC’s built-in function __builtin_ctz() [37]. The __builtin_ctz() takes an unsigned integerargument and returns the number of trailing zeros starting with the least significant bit. Tomitigate the effects of the RSS computation, Yangchao’s methodology was adopted for thePPF prototype’s Rx driver. The results using this patch are displayed in Section 4.3.
3.8 Optimization Workflow
The optimization workflow used in the experiments can be summarized as follows:

CHAPTER 3. METHODOLOGY 43
1. Configure the PPF prototype to have only 1 worker core.
2. Perform throughput and latency measurements. Linux Perf was used to gatherinformation about the time consumed by different function calls made by the PPFprototype, as well as overall system statistics including the cache hit ratio and more.
3. Increase number of worker cores.
4. Repeat from step 2 until no further CPU cores are available.
5. After running all measurements with 1 Rx/Tx core - repeat from step 1 using 2 Rx/Txcores.
6. Optimize code and repeat all measurements.
7. Compilation, comparison, and analysis of the results, as seen in Sections 4, 5, and 6.
The basic idea of the experiments described in this thesis was to isolate the parameters ofthe PPF which affected the throughput and/or latency the most, and adjusting the valuesusing IxNetwork and Linux Perf as measurement and profiling tools. IxNetwork was usedto generate network traffic and to measure throughput and latency while Linux Perf wasused for deeper performance analysis of for example cache statistics, Instructions Per Cycle(IPC) statistics, and context switching.

Chapter 4
Results
This chapter summarizes the results of the throughput and latency measurements for thetested PPF prototype configurations.
4.1 Core Reassignment Results
The PPF prototype has access to 10 CPU cores, of which a minimum of 3 are used for theDPDK master core, scheduling, and Rx/Tx. The remaining cores can be used to run workerthreads. This section summarizes the scaling of throughput for different assignments of theCPU cores using an otherwise unchanged configuration of the PPF prototype. Throughputwas measured according to the methodology described in Section 3.2. Figure 4.1 shows themaximum throughput of the PPF prototype with one worker core reassigned to Rx/Tx. Noother changes were made to the PPF configuration. The throughput was lower with 2 Rx/Txcores for all numbers of worker cores.
1 2 3 4 5 6 7
1 Rx/Tx Core 616724 1033289 1289624 1586975 1591461 1590767 1583984
2 Rx/Tx Cores 573364 991058 1237061 1273224 1291351 1278412
500 000
700 000
900 000
1 100 000
1 300 000
1 500 000
1 700 000
Throughput (fps)
Num workers
Throughput Scaling - Core Reassignment
Figure 4.1: Maximum throughput results with reassigned CPU cores: 1 Rx/Tx cores and upto 7 worker cores; and 2 Rx/Tx cores and up to 6 worker cores.
Figures 4.2, 4.3, and 4.4 display the latency results of the core reassignments. The resultsshow that the average latency increased for each respective number of worker cores when
44
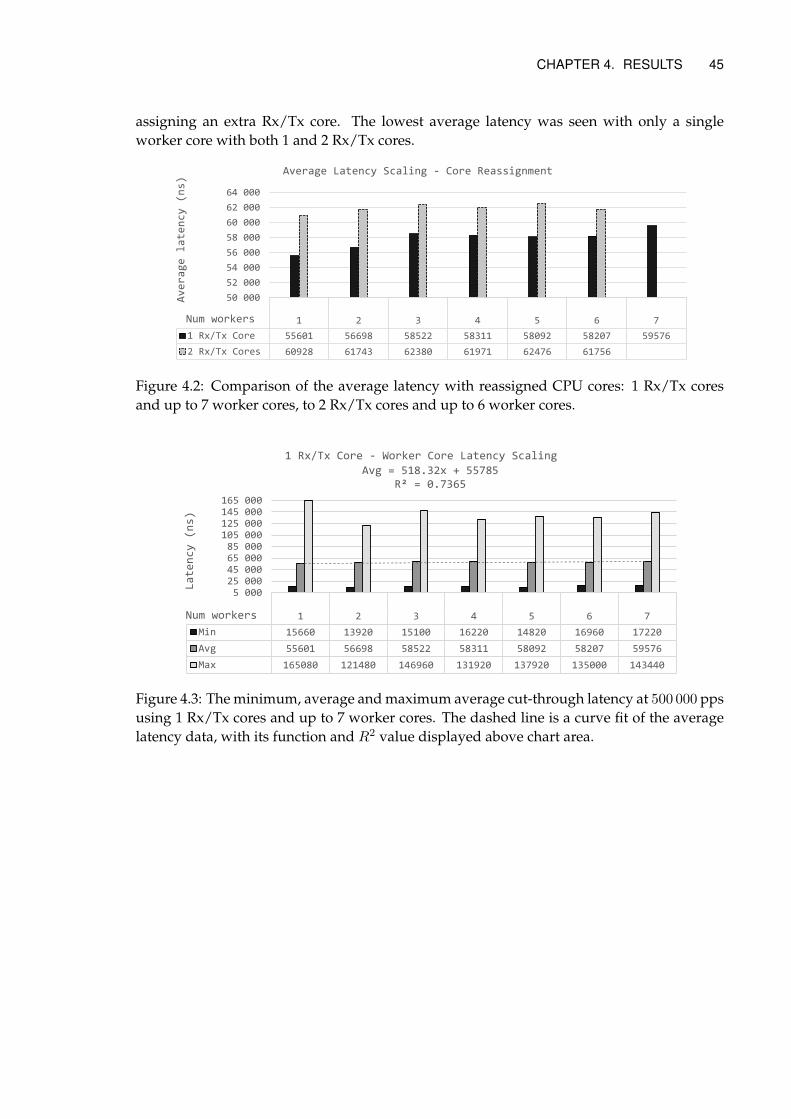
CHAPTER 4. RESULTS 45
assigning an extra Rx/Tx core. The lowest average latency was seen with only a singleworker core with both 1 and 2 Rx/Tx cores.
1 2 3 4 5 6 7
1 Rx/Tx Core 55601 56698 58522 58311 58092 58207 59576
2 Rx/Tx Cores 60928 61743 62380 61971 62476 61756
50 000
52 000
54 000
56 000
58 000
60 000
62 000
64 000
Average latency (ns)
Num workers
Average Latency Scaling - Core Reassignment
Figure 4.2: Comparison of the average latency with reassigned CPU cores: 1 Rx/Tx coresand up to 7 worker cores, to 2 Rx/Tx cores and up to 6 worker cores.
1 2 3 4 5 6 7
Min 15660 13920 15100 16220 14820 16960 17220
Avg 55601 56698 58522 58311 58092 58207 59576
Max 165080 121480 146960 131920 137920 135000 143440
Avg = 518.32x + 55785R² = 0.7365
5 00025 00045 00065 00085 000
105 000125 000145 000165 000
Latency (ns)
Num workers
1 Rx/Tx Core - Worker Core Latency Scaling
Figure 4.3: The minimum, average and maximum average cut-through latency at 500 000 ppsusing 1 Rx/Tx cores and up to 7 worker cores. The dashed line is a curve fit of the averagelatency data, with its function and R2 value displayed above chart area.

46 CHAPTER 4. RESULTS
1 2 3 4 5 6
Min 16740 16700 16240 17600 17520 16540
Avg 60928 61743 62380 61971 62476 61756
Max 163560 146600 145260 145680 154080 143040
Avg = 169.43x + 61283R² = 0.3233
5 00025 00045 00065 00085 000105 000125 000145 000165 000
Latency (ns)
Num workers
2 Rx/Tx Cores - Worker Core Latency Scaling
Figure 4.4: The minimum, average and maximum average cut-through latency at 500 000 ppsusing 2 Rx/Tx cores and up to 6 worker cores. The dashed line is a curve fit of the averagelatency data, with its function and R2 value displayed above chart area.
4.2 Worker Stage Consolidation Results
This section displays the results of the tests with consolidated worker stages. Throughputand latency was measured using 1 Rx/Tx core and up to 7 worker cores, and 2 Rx/Tx coresand up to 6 worker cores. The highest throughput was achieved using 2 Rx/Tx cores and 6worker cores. The maximum throughput using consolidated worker stages was higher thanthe maximum throughput using the default packet processing stages, at 1.99 Mpps versusthe the default maximum throughput of 1.59 Mpps.
1 2 3 4 5 6 7
1 Rx/Tx Core * 748413 1268652 1530566 1608203 1595117 1509180 1589453
2 Rx/Tx Cores * 704736 1179016 1279358 1412366 1982635 1989777
500 000
700 000
900 000
1 100 000
1 300 000
1 500 000
1 700 000
1 900 000
2 100 000
Throughput (fps)
Num workers
Throughput Scaling - Consolidated Worker Stages
Figure 4.5: Maximum throughput results with consolidated worker stages. Throughput wasmeasured with 1 and 2 Rx/Tx cores and 7 and 6 worker cores respectively.
Figures 4.6, 4.7, and 4.8 show the results of the latency measurements. The average cut-through latency increased for all respective numbers of worker cores when using 2 Rx/Txcores instead of 1.
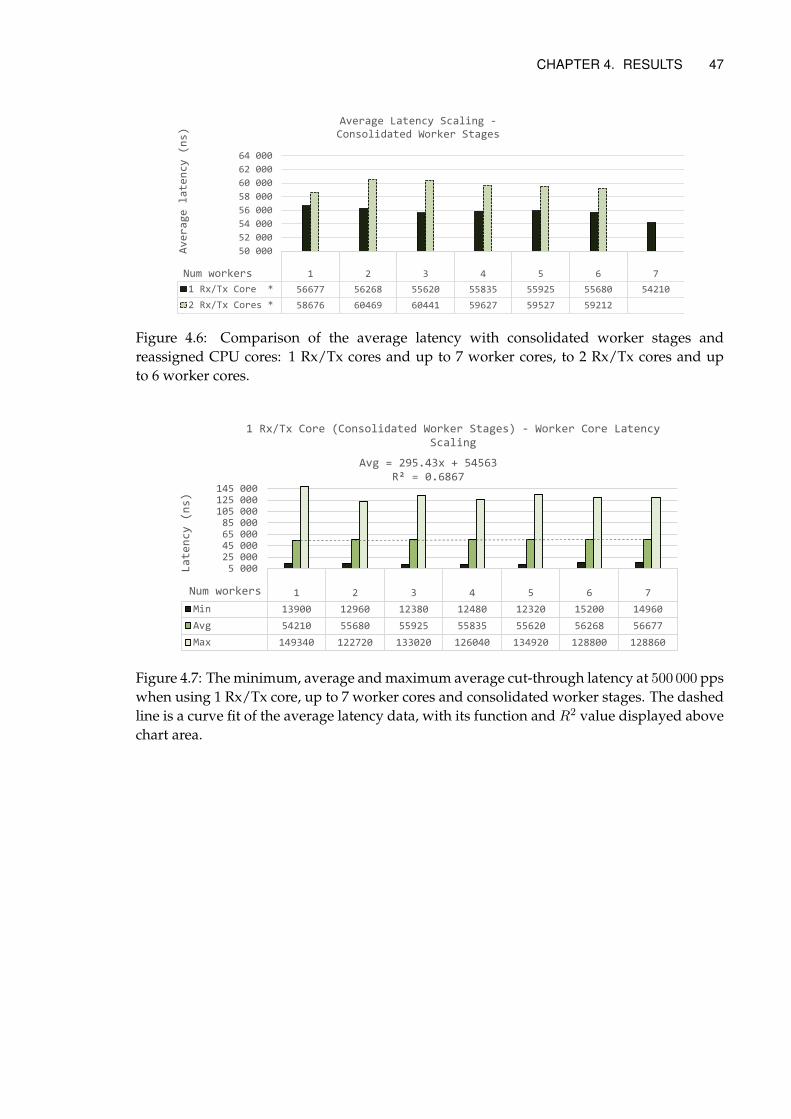
CHAPTER 4. RESULTS 47
1 2 3 4 5 6 7
1 Rx/Tx Core * 56677 56268 55620 55835 55925 55680 54210
2 Rx/Tx Cores * 58676 60469 60441 59627 59527 59212
50 000
52 000
54 000
56 000
58 000
60 000
62 000
64 000
Average latency (ns)
Num workers
Average Latency Scaling -Consolidated Worker Stages
Figure 4.6: Comparison of the average latency with consolidated worker stages andreassigned CPU cores: 1 Rx/Tx cores and up to 7 worker cores, to 2 Rx/Tx cores and upto 6 worker cores.
1 2 3 4 5 6 7
Min 13900 12960 12380 12480 12320 15200 14960
Avg 54210 55680 55925 55835 55620 56268 56677
Max 149340 122720 133020 126040 134920 128800 128860
Avg = 295.43x + 54563R² = 0.6867
5 00025 00045 00065 00085 000105 000125 000145 000
Latency (ns)
Num workers
1 Rx/Tx Core (Consolidated Worker Stages) - Worker Core Latency Scaling
Figure 4.7: The minimum, average and maximum average cut-through latency at 500 000 ppswhen using 1 Rx/Tx core, up to 7 worker cores and consolidated worker stages. The dashedline is a curve fit of the average latency data, with its function and R2 value displayed abovechart area.

48 CHAPTER 4. RESULTS
1 2 3 4 5 6
Min 13280 13480 13820 14400 15480 13980
Avg 59212 59527 59627 60441 60469 58676
Max 151460 140160 144160 144280 148300 133180
Avg = 27.429x + 59563R² = 0.0054
5 00025 00045 00065 00085 000
105 000125 000145 000
Latency (ns)
Num workers
2 Rx/Tx Core (Consolidated Worker Stages) - Worker Core Latency Scaling
Figure 4.8: The minimum, average and maximum average cut-through latency at 500 000 ppswhen using 2 Rx/Tx core, up to 6 worker cores and consolidated worker stages. The dashedline is a curve fit of the average latency data, with its function and R2 value displayed abovechart area.
4.3 RSS Patch Results
This section displays the results of the tests with consolidated worker stages and the RSSpatch applied. Throughput and latency was measured using 2 Rx/Tx core and up to7 worker cores, and 2 Rx/Tx cores and up to 6 worker cores. The highest maximumthroughput with this configuration was achieved using 2 Rx/Tx cores and 6 worker cores,as shown in Figure 4.9. The case with 1 Rx/Tx core and 1 worker core was excluded due totests failing with strange results.
1 2 3 4 5 6 7
1 Rx/Tx Core ** 1261597 1462793 1762598 1763281 1757935 1750366
2 Rx/Tx Cores ** 707275 1182263 1276114 1403381 1582275 2225891
500 000
700 000
900 000
1 100 000
1 300 000
1 500 000
1 700 000
1 900 000
2 100 000
2 300 000
Throughput (fps)
Num workers
Throughput Scaling - Consolidated Stages + RSS Patch
Figure 4.9: Maximum throughput results with consolidated worker stages and the RSS patchapplied. Throughput was measured with 1 and 2 Rx/Tx cores and 7 and 6 worker coresrespectively.

CHAPTER 4. RESULTS 49
Figures 4.10, 4.11, and 4.12 display the latency results for the PPF configuration withconsolidated worker stages and the RSS patch applied. Reassigning a worker core to Rx/Txincreased the latency for all configurations.
1 2 3 4 5 6 7
1 Rx/Tx Core ** 55240 55583 55799 55075 56028 56530
2 Rx/Tx Cores ** 58244 58694 58024 59296 59675 58138
50 000
52 000
54 000
56 000
58 000
60 000
62 000
64 000
Average latency (ns)
Num workers
Average Latency Scaling -Consolidated Worker Stages + RSS Patch
Figure 4.10: Comparison of the average latency with consolidated worker stages, the RSSpatch applied and reassigned CPU cores: 1 Rx/Tx cores and up to 7 worker cores, to 2 Rx/Txcores and up to 6 worker cores.
1 2 3 4 5 6
Min 11780 12780 12800 12840 12980 13420
Avg 55240 55583 55799 55075 56028 56530
Max 124080 130080 124440 132900 134720 137880
Avg = 201.74x + 55003R² = 0.501
5 00025 00045 00065 00085 000105 000125 000145 000
Latency (ns)
Num workers
1 Rx/Tx Core - Worker Core Latency Scaling- Consolidated Stages + SoftRSS Patch
Figure 4.11: The minimum, average and maximum average cut-through latency at 500 000pps when using 1 Rx/Tx core, up to 7 worker cores, consolidated worker stages, and the RSSpatch. The dashed line is a curve fit of the average latency data, with its function and R2
value displayed above chart area.

50 CHAPTER 4. RESULTS
1 2 3 4 5 6
Min 14280 14240 15020 14360 14700 14700
Avg 58244 58694 58024 59296 59675 58138
Max 150460 142000 139000 138280 135200 140380
Avg = 105.29x + 58310R² = 0.0849
5 00025 00045 00065 00085 000105 000125 000145 000
Latency (ns)
Num workers
2 Rx/Tx Cores - Worker Core Latency Scaling- Consolidated Stages + SoftRSS Patch
Figure 4.12: The minimum, average and maximum average cut-through latency at 500 000pps when using 2 Rx/Tx core, up to 6 worker cores, consolidated worker stages, and the RSSpatch. The dashed line is a curve fit of the average latency data, with its function and R2
value displayed above chart area.
4.4 Summarized Results
Figure 4.13 shows the throughput achieved when using one scheduling core, 1 Rx/Tx coreand 2 Rx/Tx cores, and an increasing number of worker cores up to the maximum of 7 and6 cores respectively. The highest maximum throughput (2.23 Mpps) was achieved using 2Rx/Tx cores, 6 worker cores, consolidated worker stages, and the RSS patch applied. Thesereconfigurations improved the throughput performance by 40.52% compared to the defaultPPF configuration with 1 Rx/Tx core and 7 worker cores, which achieved a throughput of1.58 Mpps.

CHAPTER 4. RESULTS 51
1 2 3 4 5 6 7
1 Rx/Tx Core 616724 1033289 1289624 1586975 1591461 1590767 1583984
2 Rx/Tx Cores 573364 991058 1237061 1273224 1291351 1278412
1 Rx/Tx Core * 748413 1268652 1530566 1608203 1595117 1509180 1589453
2 Rx/Tx Cores * 704736 1179016 1279358 1412366 1982635 1989777
1 Rx/Tx Core ** 1261597 1462793 1762598 1763281 1757935 1750366
2 Rx/Tx Cores ** 707275 1182263 1276114 1403381 1582275 2225891
500 000
700 000
900 000
1 100 000
1 300 000
1 500 000
1 700 000
1 900 000
2 100 000
2 300 000
Throughput (fps)
Num workers
Throughput Scaling - Summary
Figure 4.13: The throughput performance scaling with increasing number of workers. *denotes the PPF prototype with consolidated worker stages, and ** denotes the PPF withconsolidated worker stages and RSS patch applied. The test case failed for 1 Rx/Tx Core **,and the result was excluded.
Figure 4.14 shows a summary of the average cut-through latency results. The lowestobserved average latency of 54 210 ns was achieved using the PPF configuration withconsolidated worker stages, 1 Rx/Tx cores and 1 worker core. The average cut-throughlatency reported for the configuration with the highest observed throughput of 2.2 Mppswas 58 138 ns, which is 1 438 ns lower than that of the completely default PPF configuration.
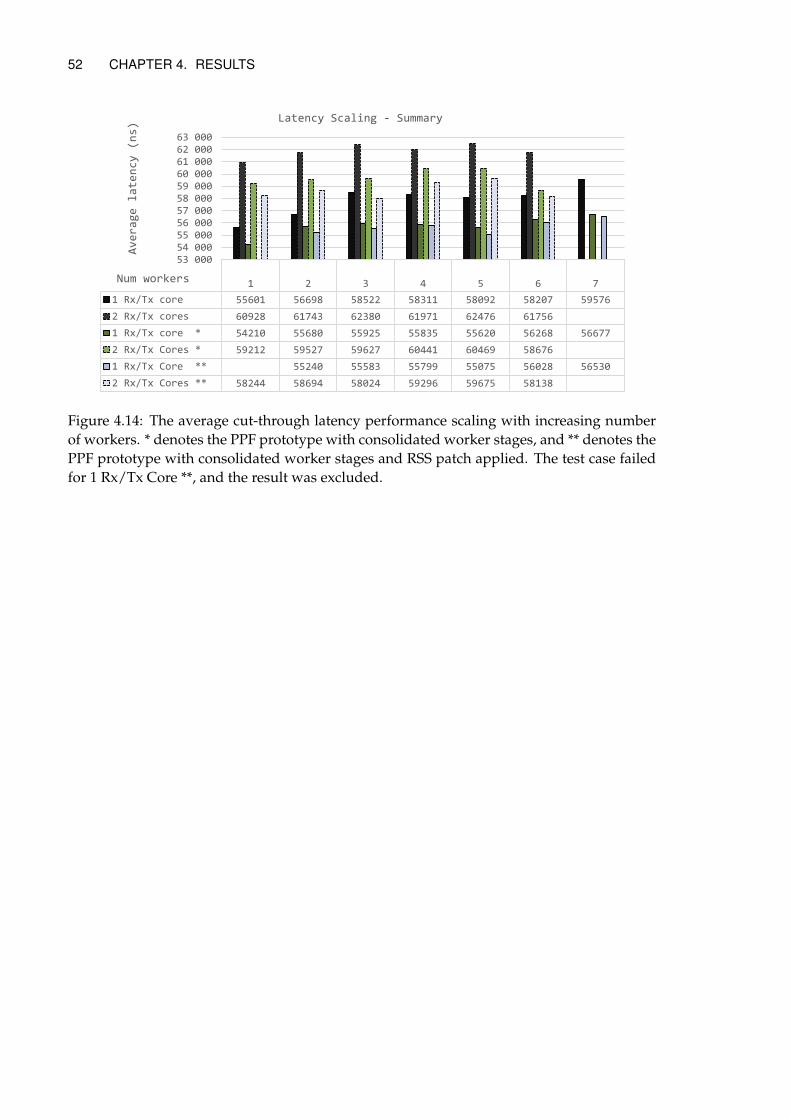
52 CHAPTER 4. RESULTS
1 2 3 4 5 6 7
1 Rx/Tx core 55601 56698 58522 58311 58092 58207 59576
2 Rx/Tx cores 60928 61743 62380 61971 62476 61756
1 Rx/Tx core * 54210 55680 55925 55835 55620 56268 56677
2 Rx/Tx Cores * 59212 59527 59627 60441 60469 58676
1 Rx/Tx Core ** 55240 55583 55799 55075 56028 56530
2 Rx/Tx Cores ** 58244 58694 58024 59296 59675 58138
53 00054 00055 00056 00057 00058 00059 00060 00061 00062 00063 000
Average latency (ns)
Num workers
Latency Scaling - Summary
Figure 4.14: The average cut-through latency performance scaling with increasing numberof workers. * denotes the PPF prototype with consolidated worker stages, and ** denotes thePPF prototype with consolidated worker stages and RSS patch applied. The test case failedfor 1 Rx/Tx Core **, and the result was excluded.

Chapter 5
Discussion
5.1 Results Analysis
During the beginning of this thesis project, cache optimization and context switching wasassumed to play an important role in the optimization of the PPF. When profiling the defaultPPF using Linux Perf, a miss ratio of 7.08% among the L1 data cache loads was reported onthe Rx/Tx core, and 3.55% on the worker cores. However, when looking at the cause of thecache misses, it was discovered that a majority were an intended result of prefetching, andsome due to locking mechanisms. Linux Perf reported 387 CS/second on the Rx/Tx coreand 336 CS/second on the worker cores. The reconfigurations presented in this thesis didnot have a significant effect on the cache miss ratio or number of context switches. DPDKtakes several measures to optimize cache utilization and minimize context switching. Forthis reason, focus was shifted from these aspects towards the multicore performance scalingof the PPF.
By adding support for multiple Rx/Tx cores in the PPF prototype, and measuring themaximum, minimum, and average throughput, and maximum cut-through latency usingdifferent core assignments, it was discovered that a plateau in throughput was reachedwhen using only 4 or 5 of the available 7 worker cores. This plateau was assumed to becaused by a bottleneck in the Rx or Tx drivers or the scheduler. However, when addingan additional Rx/Tx core to the default PPF configuration, at the cost of one worker core,both the throughput and the latency performance got worse. The maximum throughputdropped by 23.9% when comparing the configuration with 1 Rx/Tx core and 7 worker coresto the configuration with 2 Rx/Tx cores and 6 worker cores, and the latency increased by3.66%. One of the reasons for this decrease in throughput seems to be that the Eventdevcannot schedule the Rx/Tx driver completely in parallel as it is not thread-safe. This leads todecreased efficiency in the Rx driver due to synchronization overhead. Linux Perf reportedthat 24.49% of the cycles on the Rx/Tx cores were spent on atomic scheduling, when using 2Rx/Tx cores instead of 1. When using the stat command of Linux Perf on the Rx/Tx coreswhile letting the PPF prototype process packets at close to the maximum throughput for twodifferent configurations of the PPF prototype, the output numbers shown in Table 5.1 wereproduced. This output shows that the IPC went from 1.73 on the single Rx/Tx core to 0.98over the 2 Rx/Tx cores: roughly a 77% drop. The number of CS per second also dropped by
53
54 CHAPTER 5. DISCUSSION
78%, from 387 to 217 CS per second. Additionally, the number of branches taken droppedby 64% while the number of branch misses almost doubled, from 0.20% to 0.38%. Whilethe reason for the increase in branch mispredictions could have been investigated also usingPerf, this investigation had to be left out due to limited time with the testbed equipment.
Table 5.1: Statistics reported by Linux Perf when processing packets at close to the maximumthroughput of two different configurations of the PPF prototype: 1.5 Mpps using 1 Rx/Txcore and 7 workers, and 1.2 Mpps using 2 Rx/Tx cores and 6 workers. The perf stat commandwas executed on all Rx/Tx cores in both cases.
1 Rx/Tx core, 7 workers 2 Rx/Tx Cores, 6 workers
CPU core utilization 1.000 2.000Number of CS 387 /sec 217 /secCPU migrations 0 0Page faults 0 0CPU clock frequency 2.891 2.891Instructions/cycle 1.73 0.98Branches 741.229 M/sec 453.175 M/secBranch misprediction % 0.20% 0.38%
However, when consolidating the last three worker stages, making them a single unit ofschedulable work, the throughput increased for all numbers of workers when using 1 Rx/Txcore, indicating a speedup in the worker cores. When reassigning one worker core to Rx/Tx,the throughput increased with 5 and 6 worker cores. This indicates a maximum throughputof around 1.6 Mpps for a single Rx/Tx core, without the RSS patch. To verify that Rx/Txwas indeed a throughput bottleneck, a 1000 cycle delay per packet was added to the fourthworker stage, while processing at 1.99 Mpps. Linux Perf reported that this increased thecycles consumed by the fourth worker stage from 6.08% to 26.92% of the total cycles on theworker cores, while the additional delay had no apparent impact on the throughput.
With support for the belief that Rx/Tx was the bottleneck, the Rx/Tx core was inspected.When profiling the Rx driver at a throughput of 1.2 Mpps for the default configuration, it wasreported that at least 29% of the instruction cycles were consumed by the RSS function of theRx core. Looking for to speedup the RSS code, the patch described in Section 3.7 was found.When measuring the maximum throughput using consolidated worker stages and the RSSpatch, a throughput of 2.2 Mpps was achieved with 2 Rx/Tx cores and 6 worker cores. Thisis a 40.52% increase in throughput from the default configuration. When profiling the Rxcode again at 1.2 Mpps, the portion of instruction cycles consumed by RSS computationshad dropped to 18.6%.
The average latency results varied for the different PPF configurations. Assigning an extraRx/Tx core seemed to increase the average latency for all of the tested configurations. Thisincrease in latency seemed to be a result of the synchronization overhead introduced whenrunning the Rx driver in parallel on two different cores. This overhead was reported tobe 24.49% on the dual Rx/Tx cores. However, the average latency increased by at most5 327 ns, corresponding to 9.58%, of the average latency for the case with 1 worker core andnone of the optimizations applied, when going from 1 to 2 Rx/Tx cores. The minimum
CHAPTER 5. DISCUSSION 55
recorded average latency recorded was 54 210 ns for the configuration with consolidatedworker stages, 1 Rx/Tx core and 1 worker core. However, this configuration achievedthe relatively low maximum throughput of 0.75 Mpps, compared to the greatest observedthroughput of 2.2 Mpps. For the configuration with the highest throughput, the averagelatency was 97.59% of the average latency for the completely unmodified PPF prototypewith 1 Rx/Tx core and 7 worker cores. Both optimizations, i.e. consolidating the last threeworker stages and applying the RSS patch, seemed to reduce the average latency with allcore configurations. Most of the line fits in each average latency scaling chart (Figures 4.3,4.4, 4.7 4.8, 4.11, 4.12) seem to suggest that the average latency increases with more workercores, although with a fairly large degree of uncertainty. Most of the latency seems to comefrom the constant term of each respective function.
5.2 Methodology Discussion
IxNetwork was used to find the maximum throughput and minimum, average, andmaximum cut-through latency for different configurations of the PPF prototype. This toolworked well when measuring the maximum throughput. However, it would have beendesirable to also measure the median cut-through latency of the PPF prototype, as well aslatency jitter and distribution. The latency measurements could have been performed inanother way, perhaps by gathering raw latency measurement data and doing further analysisoutside of the measurement tool. The main reason for using IxNetwork was that it was easyto use for traffic generation and measurements by the same tool, and that Ericsson’s testequipment was set up this way. The latter was difficult to change, and although it may havebeen possible to use another tool, that would have required much more effort and time thanusing IxNetwork.
Another improvement that could have been made to the methodology would have been toperform more consistent profiling with Linux Perf to find the reason for the behavior of thePPF prototype under different configurations. Due to unavailability of the testbed for muchof the duration of the project, the time window for testing became very limited. For thisreason, the focus was set on completing the throughput and latency scaling measurementswith different core assignments, with Perf as a complement where analysis was needed. Inthe end, this may not have been enough to gain all of the valuable insight that was potentiallyoffered. Systematic apples-to-apples tests using Linux Perf should have been made for eachof the configurations of the PPF prototype. This could have provided more informationabout the exact details of the atomic scheduling overhead and reason for the behavior of theminimum/average/maximum latency as the number of Rx/Tx and worker cores differed.

Chapter 6
Conclusions and Future Work
This section states the conclusions made from the results and analysis presented in Sections4 and 5. Also included in this section are required reflections regarding the ethics andsustainability aspects of this thesis project, and suggestions for future work related to the5G RAN PPF and its prototype.
6.1 Conclusions
The problem statement of this thesis project was: "Given an NFV PPF prototype for the 5GRAN based on the DPDK Eventdev framework, what are the bottlenecks of its packet processingpath, and how can their effects be mitigated?" The throughput of the PPF prototype in a 2 flowtraffic setup was raised by 40.52%, with a latency of 97.59% compared to the default PPFprototype configuration. This was done by reassigning one worker core to perform Rx/Tx,consolidating three of the packet processing stages into a single unit of schedulable work,and optimizing DPDK’s software RSS function. An intermediate result suggests that themaximum throughput of an unmodified Rx/Tx core of the PPF prototype is close to 1.6Mpps. One of the points of having multiple packet processing stages when using DPDK’sEventdev library is to have smaller units of schedulable work, which can be evenly balancedamong CPU cores. However, the PPF prototype seemed to benefit from fewer but longerprocessing stages to outweigh the negative impact that this change could have on loadbalancing.
6.2 Limitations
This thesis project was somewhat limited by the fact that all measurements were performedon a prototype of the 5G RAN PPF, which meant that the full processing path was notincluded in the tests. For example, the consolidation of packet processing stages mayhave a different meaning in a real-world application than they had in the prototype tests.Additionally, the tests had to be shaped around Ericsson’s testbed setups and what toolswere available to use for this setup. Gaining access to the testbed was non-trivial as ithad to be shared with Ericsson employees during many periods of the project, which made
56

CHAPTER 6. CONCLUSIONS AND FUTURE WORK 57
continuous testing difficult. This dragged out the duration of the tests and measurementswhich somewhat lowered the quality of the experiments, since only the most importantmeasurements could be done by the end of the project. For example, a more in-depth analysisof the PPF prototype using Linux Perf could have been made, as well as measurements of themedian latency and latency jitter and distribution, if there was more time and easier accessto the testbed.
6.3 Required Reflections
Optimizing the PPF for throughput may lead to a higher energy efficiency, which isimportant to the economic and environmental aspects of 5G RAN. With a higher throughput,the amount of CPU cores required by each PPF in the 5G RAN may be reduced. Also, lessPPF nodes may be required if a single node can handle the traffic that would otherwiserequire multiple nodes. Another consideration of the environmental aspect of the PPFprototype is that it utilized 100% of all of its assigned CPU cores, even when it is notprocessing any traffic. This may keep the PPF ready for incoming packets at all times, atthe cost of the energy required to run the CPU at full speed all the time. Perhaps it couldbe worth some extra initial latency to be able to put the PPF in an idle state when it is notprocessing traffic, or to scale its performance according to the amount of traffic that requiresprocessing.
6.4 Future Work
This thesis answers what some of the bottlenecks were and how to mitigate their effectsmainly on the throughput of the PPF prototype, as described by the problem statement, butfails in many cases to report the reasons why. A more systematic code profiling analysiscould have helped explain the effects seen in the results. Linux Perf was a useful tool, and infuture studies it should be utilized more than it was in this thesis project.
A few topics to investigate further emerged during this thesis project, which are summed upbelow:
• An interesting and desirable result of NFV is the potential portability of networkfunctions between physical machines. For this reason, it could be interesting to testhow the PPF performs with different host machines, host OS, and hypervisors.
• This thesis project used a UDP relay to simulate a packet processing pipeline. Acomplete optimization of the PPF should be performed on an instance with real worldsoftware instead of the placeholder code used for testing in this thesis project.
• The PPF runs its software with 100% CPU utilization at all times. If this is tokeep the cache hot and to keep the PPF ready for incoming packets, this may leadto increased performance. However, if there is no traffic being processed, this isinefficient as the resources are left unused. To leave room for other VNFs as wellas for environmental reasons related to energy consumption, perhaps some allocatedresources could be released when traffic is low at the cost of higher latency in the earlyphase of transmission.

58 CHAPTER 6. CONCLUSIONS AND FUTURE WORK
• An interesting optimization to try would be to compile the VM guest OS kernel withNO_HZ=full capability, as this was a pre-test optimization used on the host machineto reduce OS jitter. Having a guest OS kernel with this capability may further reduceOS jitter.
• The measurements in this thesis are based on Ericsson’s pre-existing test cases. Thethroughput tests only set up 2 traffic flows, and the latency test only set up 1 IMIXtraffic flow. It could be interesting to evaluate the PPF with a greater variety of networkflows, and with different payloads and packet sizes.
• Software RSS proved to be an expensive functionality of the Rx driver. Experimentscould be made with RSS offloading. The NICs for the experiments in this thesis projecthave RSS hardware offloading capability, yet RSS is performed in software. One ofthe reasons for running the PPF as a VNF is to be able to run it on different types ofhardware. However, if RSS offloading capability is detected, this could likely boost thePPF’s performance.
Additionally, the DPDK libraries used by the PPF have a number of configurable parameterswhich were originally intended as a part of the PPF optimization in this project. Theseparameters could affect both throughput and latency. Some of these parameters are:
• Enqueue and dequeue depths of Eventdev event ports - The event device uses eventqueues to contain events of different types and to allow the scheduler to dynamicallydistribute the load when processing events. The event queues are linked to event portswhich can be set to enqueue and dequeue events in bursts of configurable sizes. Theseburst sizes are called the enqueue and dequeue depths. Tuning these parameters tofind the right balance can affect the throughput and latency when processing events:increasing the burst size may increase both throughput and latency and may also affectcache performance.
• New event threshold on Eventdev event ports - This parameter is used to protect theevent device from being overwhelmed when the system is under heavy load. It limitsthe amount of new events that are enqueued in the event queues. If the new eventthreshold is set too low, the event device will be underutilized due to starvation frombackpressure at the ingress, and if set too high the event device may be flooded withnew events which can lead to increased latency.
• Eventdev scheduling quanta - The number of events scheduled at each schedulingfunction call. This parameter serves as a hint to the scheduler, which may not adhereto the configured quanta.

Bibliography
[1] Cisco, “Cisco Visual Networking Index: Global Mobile Data Traffic Forecast Update,2015–2020,” Cisco Systems, Inc., Tech. Rep. C11-738429-00, Feb. 2016. [Online].Available: http://www.cisco.com/c/en/us/solutions/collateral/service-provider/visual-networking-index-vni/mobile-white-paper-c11-520862.pdf
[2] P. Pirinen, “A brief overview of 5G research activities,” in 1st InternationalConference on 5G for Ubiquitous Connectivity. Akaslompolo, Finland: IEEE, 2014. doi:10.4108/icst.5gu.2014.258061. ISBN 978-1-63190-055-6 pp. 17–22. [Online]. Available:http://ieeexplore.ieee.org/document/7041023/
[3] ITU, “ITU defines vision and roadmap for 5G mobile development,” ITU, Geneva,Tech. Rep., Jun. 2015. [Online]. Available: http://www.itu.int/net/pressoffice/press_releases/2015/27.aspx#.VYhFl-1VhBe
[4] L. contributors of NFV ISG, “Network Functions Virtualization - An Introduction,Benefits, Enablers, Challenges & Call for Action,” in SDN and OpenFlow World Congress,Darmstadt, Germany, Oct. 2012. [Online]. Available: https://portal.etsi.org/NFV/NFV_White_Paper.pdf
[5] ——, “Network Functions Virtualisation (NFV) - Network Operator Perspectives onNFV priorities for 5G,” in NFV#17 Plenary meeting, Bilbao, Spain, Feb. 2017. [Online].Available: https://portal.etsi.org/NFV/NFV_White_Paper_5G.pdf
[6] B. Pinczel, D. Géhberger, Z. Turányi, and B. Formanek, “Towards High PerformancePacket Processing for 5G,” in 2015 IEEE Conference on Network Function Virtualization andSoftware Defined Network (NFV-SDN). IEEE, 2015. doi: 10.1109/NFV-SDN.2015.7387408.ISBN 978-1-4673-6884-1 pp. 67–73. [Online]. Available: http://ieeexplore.ieee.org/stamp/stamp.jsp?arnumber=7387408
[7] G. P. Katsikas, “Realizing High Performance NFV Service Chains,” Licentiate Thesis,KTH Royal Institute of Technology, Stockholm, Sweden, Dec. 2016. [Online]. Available:http://kth.diva-portal.org/smash/record.jsf?pid=diva2%3A1044355&dswid=3351
[8] “DPDK.org,” Jan. 2017. [Online]. Available: http://dpdk.org/
[9] DPDK, “DPDK doc (v 17.05.0) - rte_eventdev.h File Reference.” [Online]. Available:http://dpdk.org/doc/api/rte__eventdev_8h.html
[10] ITU-R, “IMT Vision – Framework and overall objectives of the future developmentof IMT for 2020 and beyond,” ITU, Geneva, Schweiz, Tech. Rep. M.2083-0, Sep.
59
60 BIBLIOGRAPHY
2015. [Online]. Available: https://www.itu.int/dms_pubrec/itu-r/rec/m/R-REC-M.2083-0-201509-I!!PDF-E.pdf
[11] ——, “Requirements related to technical performance for IMT-Advanced radiointerface(s),” ITU, Tech. Rep. M.2135, Nov. 2008. [Online]. Available: http://www.itu.int/dms_pub/itu-r/opb/rep/R-REP-M.2134-2008-PDF-E.pdf
[12] W. Xiang, K. Zheng, and X. S. Shen, 5G Mobile Communications, 1st ed.Springer International Publishing, 2017. ISBN 978-3-319-34208-5. [Online]. Available:http://www.springer.com/gp/book/9783319342061
[13] M. Nohrborg, “LTE Overview,” 2017. [Online]. Available: http://www.3gpp.org/technologies/keywords-acronyms/98-lte
[14] G. A. Abed, M. Ismail, and K. Jumari, “The Evolution to 4g CellularSystems: Architecture and Key Features of LTE-Advanced Networks,” IRACST- International Journal of Computer Networks and Wireless Communications,vol. 2, no. 1, 2012. [Online]. Available: https://pdfs.semanticscholar.org/8e1c/4295c2533f49ef6e0636ac047afd54a16420.pdf
[15] M. Qian, Y. Zhou, W. Wei, Y. Huang, Y. Wang, and J. Shi, “Efficient design andimplementation of LTE UE link-layer protocol stack,” in Wireless Communications andNetworking Conference (WCNC), 2013 IEEE. Shanghai, China: IEEE, Jul. 2013. doi:10.1109/WCNC.2013.6554682. ISBN 978-1-4673-5939-9 pp. 895–900. [Online]. Available:http://ieeexplore.ieee.org/stamp/stamp.jsp?arnumber=6554682
[16] T. Nakamura, “3gpp RAN work towards ’5G’,” May 2016. [Online].Available: http://www.3gpp.org/ftp/Information/presentations/presentations_2016/160527_ICC_5GWS-REV2.pdf
[17] Telefónica and Ericsson, “Cloud RAN Architecture for 5G,” Telefónica, White Paper,2016. [Online]. Available: http://www.tid.es/sites/526e527928a32d6a7400007f/content_entry5321ef0928a32d08900000ac/578f4eda1146dde411001d0e/files/WhitePaper_C-RAN_for_5G_-_In_collab_with_Ericsson_SC_-_quotes_-_FINAL.PDF
[18] P. Rost, C. J. Bernardos, A. De Domenico, M. Di Girolamo, M. Lalam, A. Maeder,D. Sabella, and D. Wübben, “Cloud Technologies for Flexible 5G Radio AccessNetworks,” IEEE Communications Magazine, vol. 52, no. 5, pp. 68–76, Sep. 2014.[Online]. Available: http://ieeexplore.ieee.org/stamp/stamp.jsp?arnumber=6898939
[19] 5G PPP Architecture Working Group, “View on 5G Architecture,” Jul.2016. [Online]. Available: https://5g-ppp.eu/wp-content/uploads/2014/02/5G-PPP-5G-Architecture-WP-July-2016.pdf
[20] E. Westberg, “Ericsson Technology Review: 4G/5G RAN Architecture: How aSplit Can Make the Difference,” Charting the Future of Innovation, vol. 93, no. 6,Jul. 2016. [Online]. Available: https://www.ericsson.com/assets/local/publications/ericsson-technology-review/docs/2016/etr-ran-architecture.pdf
[21] Intel, “Intel R© Open Network Platform Release 2.1 Performance Test Report -SDN/NFV Solutions with Intel R© Open Network Platform,” Intel, Tech. Rep.,Mar. 2016. [Online]. Available: https://download.01.org/packet-processing/ONPS2.1/Intel_ONP_Release_2.1_Performance_Test_Report_Rev1.0.pdf

BIBLIOGRAPHY 61
[22] “napi,” Nov. 2016. [Online]. Available: https://wiki.linuxfoundation.org/networking/napi
[23] W. Wu, M. Crawford, and M. Bowden, “The performance analysis of linux networking– Packet receiving,” Computer Communications, vol. 30, no. 5, pp. 1044–1057,Mar. 2007. [Online]. Available: http://www.sciencedirect.com/science/article/pii/S0140366406004221
[24] A. Cox and F. La Roche, “Ubuntu-kernel, skbuff.h,” Aug. 2014.[Online]. Available: https://github.com/Canonical-kernel/Ubuntu-kernel/blob/master/include/linux/skbuff.h
[25] R. Biro, F. N. van Kempen, D. Becker, A. Cox, R. Underwood, S. Becker, J. Cwik, andA. Gulbrandsen, “Ubuntu-kernel, ip_input.c,” Jan. 2014. [Online]. Available: https://github.com/Canonical-kernel/Ubuntu-kernel/blob/master/net/ipv4/ip_input.c
[26] P. Roque and I. P. Morris, “Ubuntu-kernel, ip6_input.c,” Jan. 2014. [Online].Available: https://github.com/Canonical-kernel/Ubuntu-kernel/blob/master/net/ipv6/ip6_input.c
[27] O. Zborowski, R. Biro, and F. N. van Kempen, “Ubuntu-kernel, socket.c,” Aug.2014. [Online]. Available: https://github.com/Canonical-kernel/Ubuntu-kernel/blob/master/net/socket.c
[28] J. Corbet and A. Rubini, Linux Device Drivers, 2nd ed. O’Reilly Media, Jun. 2001.ISBN 0-596-00008-1. [Online]. Available: http://www.xml.com/ldd/chapter/book/ch14.html#t5
[29] T. Hudek, “Introduction to Receive Side Scaling,” Apr. 2017. [Online].Available: https://docs.microsoft.com/en-us/windows-hardware/drivers/network/introduction-to-receive-side-scaling
[30] V. Medvedkin, “rte_thash.h,” 2015. [Online]. Available: http://dpdk.org/doc/api-17.05/rte__thash_8h_source.html
[31] DPDK, “DPDK Programmer’s Guide Release 16.11.0,” Nov. 2016. [Online]. Available:http://fast.dpdk.org/doc/pdf-guides/prog_guide-16.11.pdf
[32] L. McVoy, “LMbench,” Jun. 1998. [Online]. Available: http://www.bitmover.com/lmbench/
[33] “Perf Wiki,” Sep. 2015. [Online]. Available: https://perf.wiki.kernel.org/index.php/Main_Page
[34] “www.ixiacom.com.” [Online]. Available: https://www.ixiacom.com/products/ixnetwork
[35] “NO_hz: Reducing Scheduling-Clock Ticks.” [Online]. Available: https://www.kernel.org/doc/Documentation/timers/NO_HZ.txt
[36] Z. Yangchao, “[dpdk-dev] hash: optimize the softrss computation,” Aug. 2017.[Online]. Available: http://dpdk.org/dev/patchwork/patch/27714/
[37] “Using the GNU Compiler Collection (GCC) - 6.59 Other Built-in Functions

62 BIBLIOGRAPHY
Provided by GCC.” [Online]. Available: https://gcc.gnu.org/onlinedocs/gcc-7.2.0/gcc/Other-Builtins.html

Appendix A
LMbench Output
This section contains the output when running LMbench on the host and guest machines onwhich the 5G RAN PPF was evaluated.
A.1 Host (Physical) Machine Results
L M B E N C H 3 . 0 S U M M A R Y------------------------------------
(Alpha software, do not distribute)
Processor, Processes - times in microseconds - smaller is better------------------------------------------------------------------------------Host OS Mhz null null open slct sig sig fork exec sh
call I/O stat clos TCP inst hndl proc proc proc--------- ------------- ---- ---- ---- ---- ---- ---- ---- ---- ---- ---- ----selistnh0 Linux 4.4.0-8 2899 0.10 0.13 0.39 0.92 2.40 0.10 0.68 193. 559. 947.
Basic integer operations - times in nanoseconds - smaller is better-------------------------------------------------------------------Host OS intgr intgr intgr intgr intgr
bit add mul div mod--------- ------------- ------ ------ ------ ------ ------selistnh0 Linux 4.4.0-8 0.5000 0.0400 1.0600 8.1700 9.0600
Basic float operations - times in nanoseconds - smaller is better-----------------------------------------------------------------Host OS float float float float
add mul div bogo--------- ------------- ------ ------ ------ ------selistnh0 Linux 4.4.0-8 1.0300 1.7200 4.6700 2.8800
Basic double operations - times in nanoseconds - smaller is better------------------------------------------------------------------Host OS double double double double
add mul div bogo--------- ------------- ------ ------ ------ ------selistnh0 Linux 4.4.0-8 1.0300 1.7200 7.0700 4.8300
63
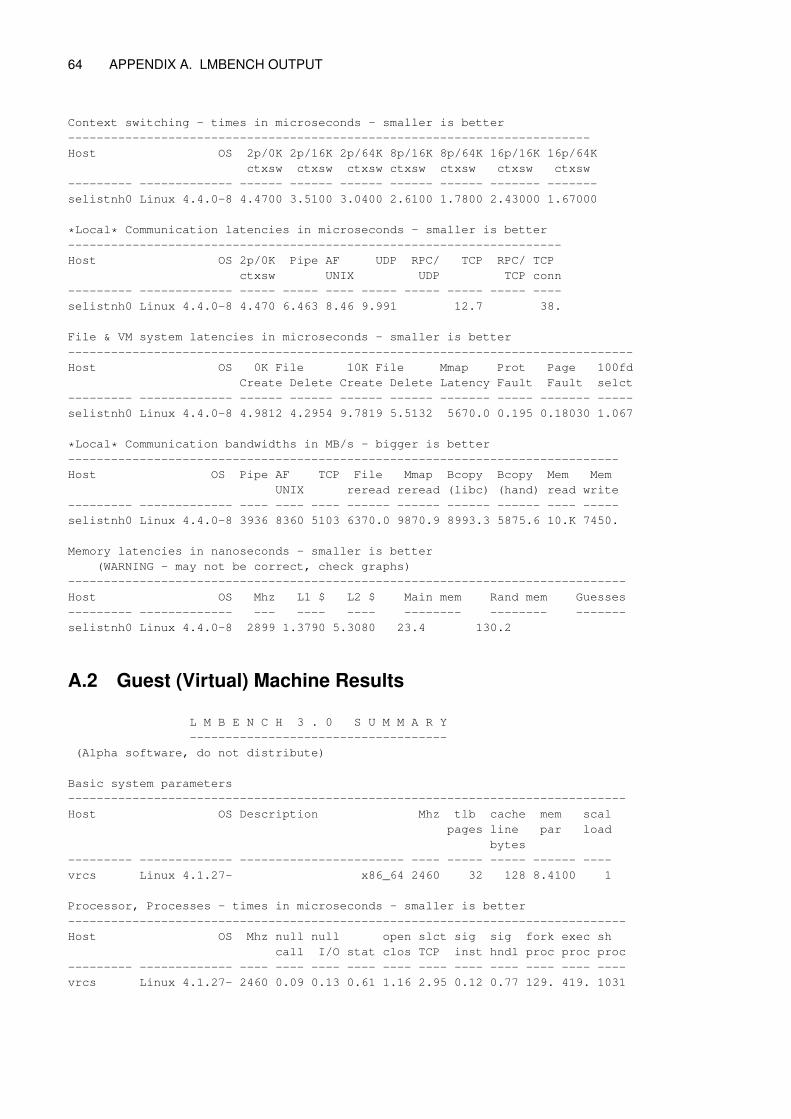
64 APPENDIX A. LMBENCH OUTPUT
Context switching - times in microseconds - smaller is better-------------------------------------------------------------------------Host OS 2p/0K 2p/16K 2p/64K 8p/16K 8p/64K 16p/16K 16p/64K
ctxsw ctxsw ctxsw ctxsw ctxsw ctxsw ctxsw--------- ------------- ------ ------ ------ ------ ------ ------- -------selistnh0 Linux 4.4.0-8 4.4700 3.5100 3.0400 2.6100 1.7800 2.43000 1.67000
*Local* Communication latencies in microseconds - smaller is better---------------------------------------------------------------------Host OS 2p/0K Pipe AF UDP RPC/ TCP RPC/ TCP
ctxsw UNIX UDP TCP conn--------- ------------- ----- ----- ---- ----- ----- ----- ----- ----selistnh0 Linux 4.4.0-8 4.470 6.463 8.46 9.991 12.7 38.
File & VM system latencies in microseconds - smaller is better-------------------------------------------------------------------------------Host OS 0K File 10K File Mmap Prot Page 100fd
Create Delete Create Delete Latency Fault Fault selct--------- ------------- ------ ------ ------ ------ ------- ----- ------- -----selistnh0 Linux 4.4.0-8 4.9812 4.2954 9.7819 5.5132 5670.0 0.195 0.18030 1.067
*Local* Communication bandwidths in MB/s - bigger is better-----------------------------------------------------------------------------Host OS Pipe AF TCP File Mmap Bcopy Bcopy Mem Mem
UNIX reread reread (libc) (hand) read write--------- ------------- ---- ---- ---- ------ ------ ------ ------ ---- -----selistnh0 Linux 4.4.0-8 3936 8360 5103 6370.0 9870.9 8993.3 5875.6 10.K 7450.
Memory latencies in nanoseconds - smaller is better(WARNING - may not be correct, check graphs)
------------------------------------------------------------------------------Host OS Mhz L1 $ L2 $ Main mem Rand mem Guesses--------- ------------- --- ---- ---- -------- -------- -------selistnh0 Linux 4.4.0-8 2899 1.3790 5.3080 23.4 130.2
A.2 Guest (Virtual) Machine Results
L M B E N C H 3 . 0 S U M M A R Y------------------------------------
(Alpha software, do not distribute)
Basic system parameters------------------------------------------------------------------------------Host OS Description Mhz tlb cache mem scal
pages line par loadbytes
--------- ------------- ----------------------- ---- ----- ----- ------ ----vrcs Linux 4.1.27- x86_64 2460 32 128 8.4100 1
Processor, Processes - times in microseconds - smaller is better------------------------------------------------------------------------------Host OS Mhz null null open slct sig sig fork exec sh
call I/O stat clos TCP inst hndl proc proc proc--------- ------------- ---- ---- ---- ---- ---- ---- ---- ---- ---- ---- ----vrcs Linux 4.1.27- 2460 0.09 0.13 0.61 1.16 2.95 0.12 0.77 129. 419. 1031

APPENDIX A. LMBENCH OUTPUT 65
Basic integer operations - times in nanoseconds - smaller is better-------------------------------------------------------------------Host OS intgr intgr intgr intgr intgr
bit add mul div mod--------- ------------- ------ ------ ------ ------ ------vrcs Linux 4.1.27- 0.4100 0.0400 1.2600 9.6500 10.7
Basic float operations - times in nanoseconds - smaller is better-----------------------------------------------------------------Host OS float float float float
add mul div bogo--------- ------------- ------ ------ ------ ------vrcs Linux 4.1.27- 1.2200 2.0400 5.5200 2.9000
Basic double operations - times in nanoseconds - smaller is better------------------------------------------------------------------Host OS double double double double
add mul div bogo--------- ------------- ------ ------ ------ ------vrcs Linux 4.1.27- 1.2200 2.0400 8.3500 5.7400
Context switching - times in microseconds - smaller is better-------------------------------------------------------------------------Host OS 2p/0K 2p/16K 2p/64K 8p/16K 8p/64K 16p/16K 16p/64K
ctxsw ctxsw ctxsw ctxsw ctxsw ctxsw ctxsw--------- ------------- ------ ------ ------ ------ ------ ------- -------vrcs Linux 4.1.27- 0.6300 1.0500 1.2400 1.8400 2.5000 2.16000 2.60000
*Local* Communication latencies in microseconds - smaller is better---------------------------------------------------------------------Host OS 2p/0K Pipe AF UDP RPC/ TCP RPC/ TCP
ctxsw UNIX UDP TCP conn--------- ------------- ----- ----- ---- ----- ----- ----- ----- ----vrcs Linux 4.1.27- 0.630 3.380 5.16 5.939 7.743 25.
File & VM system latencies in microseconds - smaller is better-------------------------------------------------------------------------------Host OS 0K File 10K File Mmap Prot Page 100fd
Create Delete Create Delete Latency Fault Fault selct--------- ------------- ------ ------ ------ ------ ------- ----- ------- -----vrcs Linux 4.1.27- 2.5258 1.5459 5.4627 2.9655 4941.0 0.473 0.22480 1.058
*Local* Communication bandwidths in MB/s - bigger is better-----------------------------------------------------------------------------Host OS Pipe AF TCP File Mmap Bcopy Bcopy Mem Mem
UNIX reread reread (libc) (hand) read write--------- ------------- ---- ---- ---- ------ ------ ------ ------ ---- -----vrcs Linux 4.1.27- 4340 4792 4384 4896.9 7060.4 6465.8 4137.3 6640 5599.
Memory latencies in nanoseconds - smaller is better(WARNING - may not be correct, check graphs)
------------------------------------------------------------------------------Host OS Mhz L1 $ L2 $ Main mem Rand mem Guesses--------- ------------- --- ---- ---- -------- -------- -------vrcs Linux 4.1.27- 2460 1.6340 11.5 70.4 136.3

66 APPENDIX A. LMBENCH OUTPUT
A.3 LMbench Config-Run Script Sample Output
=====================================================================
L M B E N C H C ON F I G U R A T I O N----------------------------------------
You need to configure some parameters to lmbench. Once you have configuredthese parameters, you may do multiple runs by saying
"make rerun"
in the src subdirectory.
NOTICE: please do not have any other activity on the system if you canhelp it. Things like the second hand on your xclock or X perfmetersare not so good when benchmarking. In fact, X is not so good whenbenchmarking.
=====================================================================
If you are running on an MP machine and you want to try runningmultiple copies of lmbench in parallel, you can specify how many here.
Using this option will make the benchmark run 100x slower (sorry).
NOTE: WARNING! This feature is experimental and many results areknown to be incorrect or random!
MULTIPLE COPIES [default 1]:=====================================================================
Options to control job placement1) Allow scheduler to place jobs2) Assign each benchmark process with any attendent child processes
to its own processor3) Assign each benchmark process with any attendent child processes
to its own processor, except that it will be as far as possiblefrom other processes
4) Assign each benchmark and attendent processes to their ownprocessors
5) Assign each benchmark and attendent processes to their ownprocessors, except that they will be as far as possible fromeach other and other processes
6) Custom placement: you assign each benchmark process with attendentchild processes to processors
7) Custom placement: you assign each benchmark and attendentprocesses to processors
Note: some benchmarks, such as bw_pipe, create attendent childprocesses for each benchmark process. For example, bw_pipeneeds a second process to send data down the pipe to be readby the benchmark process. If you have three copies of thebenchmark process running, then you actually have six processes;three attendent child processes sending data down the pipes andthree benchmark processes reading data and doing the measurements.

APPENDIX A. LMBENCH OUTPUT 67
Job placement selection [default 1]:=====================================================================
Hang on, we are calculating your timing granularity.OK, it looks like you can time stuff down to 100000 usec resolution.
Hang on, we are calculating your timing overhead.OK, it looks like your gettimeofday() costs X usecs.
Hang on, we are calculating your loop overhead.OK, it looks like your benchmark loop costs X.XXXXXXXX usecs.
=====================================================================
Several benchmarks operate on a range of memory. This memory should besized such that it is at least 4 times as big as the external cache[s]on your system. It should be no more than 80% of your physical memory.
The bigger the range, the more accurate the results, but larger sizestake somewhat longer to run the benchmark.
MB [default XXXX]:Checking to see if you have XXXX MB; please wait for a moment...XXXXMB OKXXXXMB OKXXXXMB OKHang on, we are calculating your cache line size.OK, it looks like your cache line is bytes.
=====================================================================
lmbench measures a wide variety of system performance, and the full suiteof benchmarks can take a long time on some platforms. Consequently, weoffer the capability to run only predefined subsets of benchmarks, onefor operating system specific benchmarks and one for hardware specificbenchmarks. We also offer the option of running only selected benchmarkswhich is useful during operating system development.
Please remember that if you intend to publish the results you either needto do a full run or one of the predefined OS or hardware subsets.
SUBSET (ALL|HARWARE|OS|DEVELOPMENT) [default all]:=====================================================================
This benchmark measures, by default, memory latency for a number ofdifferent strides. That can take a long time and is most useful if youare trying to figure out your cache line size or if your cache line sizeis greater than 128 bytes.
If you are planning on sending in these results, please don’t do a fastrun.
Answering yes means that we measure memory latency with a 128 byte stride.
FASTMEM [default no]:=====================================================================
This benchmark measures, by default, file system latency. That can

68 APPENDIX A. LMBENCH OUTPUT
take a long time on systems with old style file systems (i.e., UFS,FFS, etc.). Linux’ ext2fs and Sun’s tmpfs are fast enough that thistest is not painful.
If you are planning on sending in these results, please don’t do a fastrun.
If you want to skip the file system latency tests, answer "yes" below.
SLOWFS [default no]:=====================================================================
This benchmark can measure disk zone bandwidths and seek times. These canbe turned into whizzy graphs that pretty much tell you everything you mightneed to know about the performance of your disk.
This takes a while and requires read access to a disk drive.Write is not measured, see disk.c to see how if you want to do so.
If you want to skip the disk tests, hit return below.
If you want to include disk tests, then specify the path to the diskdevice, such as /dev/sda. For each disk that is readable, you’ll beprompted for a one line description of the drive, i.e.,
Iomega IDE ZIPorHP C3725S 2GB on 10MB/sec NCR SCSI bus
DISKS [default none]:=====================================================================
If you are running on an idle network and there are other, identicallyconfigured systems, on the same wire (no gateway between you and them),and you have rsh access to them, then you should run the network partof the benchmarks to them. Please specify any such systems as a spaceseparated list such as: ether-host fddi-host hippi-host.
REMOTE [default none]:=====================================================================
Calculating mhz, please wait for a moment...mhz: should take approximately 30 secondsI think your CPU mhz is
4267 MHz, 0.2344 nanosec clock
but I am frequently wrong. If that is the wrong Mhz, type in yourbest guess as to your processor speed. It doesn’t have to be exact,but if you know it is around 800, say 800.
Please note that some processors, such as the P4, have a core whichis double-clocked, so on those processors the reported clock speedwill be roughly double the advertised clock rate. For example, a1.8GHz P4 may be reported as a 3592MHz processor.
Processor mhz [default XXXX MHz, X.XXXX nanosec clock]:=====================================================================

APPENDIX A. LMBENCH OUTPUT 69
We need a place to store a 128 Mbyte file as well as create and delete alarge number of small files. We default to /usr/tmp. If /usr/tmp is amemory resident file system (i.e., tmpfs), pick a different place.Please specify a directory that has enough space and is a local filesystem.
FSDIR [default /var/tmp]:=====================================================================
lmbench outputs status information as it runs various benchmarks.By default this output is sent to /dev/tty, but you may redirectit to any file you wish (such as /dev/null...).
Status output file [default /dev/tty]:=====================================================================
There is a database of benchmark results that is shipped with newreleases of lmbench. Your results can be included in the databaseif you wish. The more results the better, especially if they includeremote networking. If your results are interesting, i.e., for a newfast box, they may be made available on the lmbench web page, which is
http://www.bitmover.com/lmbench
Mail results [default yes]: noOK, no results mailed.=====================================================================
Confguration done, thanks.
There is a mailing list for discussing lmbench hosted at BitMover.Send mail to [email protected] to join the list.

TRITA-ICT-EX-2017:198
www.kth.se


![Orchestrating Virtualized Network Functionsperformance [11], [12]. NFV provides ample opportunities for network optimization and cost reduction. Previously, middle-boxes were hardware](https://static.fdocument.pub/doc/165x107/5ed155afefd7b2537304c8d8/orchestrating-virtualized-network-functions-performance-11-12-nfv-provides.jpg)