peptide separation by capillary electrophoresis with ultraviolet ...
15
The Malaysian Journal of Analytical Sciences, Vol 15 No 2 (2011): 273 - 287 273 PEPTIDE SEPARATION BY CAPILLARY ELECTROPHORESIS WITH ULTRAVIOLET DETECTION: SOME SIMPLE APPROACHES TO ENHANCE DETECTION SENSITIVITY AND RESOLUTION (Pemisahan Peptida Oleh Elektroforesis Rerambut Dengan Pengesan Ultra-Lembayung: Pendekatan Mudah Untuk Meningkatkan Isyarat Pengesanan Dan Resolusi) L. Noumie Surugau Industrial Chemistry Program, School of Science and Technology, Universiti Malaysia Sabah, Locked Bag 2073, 88999 Kota Kinabalu, Sabah, Malaysia. *Corresponding author: [email protected] Abstract Capillary electrophoresis (CE) is one of the leading separation technologies for analysis of water-soluble analytes. CE has many advantages over the more established methods such as liquid chromatography and gel electrophoresis particularly in rapid analysis, require very little sample, use less or no toxic organic solvent, high peak efficiency and ease of automation. Despite the many attractive advantages of CE, CE users continue to seek improvements particularly on detection sensitivity, resolution and selectivity. This paper presented several simple approaches to improve detection sensitivity using simple sample pre- concentration called field-enhanced sample injection (FESI) and chromatographic-based ZipTip C 18 pre-concentrator. Also, some improvements in the resolution of complex peptides mixture when using two strategies namely, capillary coating and manipulation of the hydrophobicity of peptides using perfluorinated acids as background electrolyte (BGE), which have anionic conjugate base forms with hydrophobic character. As test compounds, standard peptide mixture and proteins digests were used for these studies. The results showed that FESI has significantly enhanced the detection signal of peptide standards and bovine serum albumin (BSA) tryptic digests. As for the use of ZipTip C 18 pre-concentrator, selective enhancement in detection signal was particularly notable on the late migrating peptides. Coating the capillary proved to have little changes on the CE of peptides when used in conjunction with acidic BGE. Electropherograms of BSA tryptic peptides in pentafluoropropionic acid (PFPA) and heptafluorobutyric acid (HFBA) showed interesting profile, with notable resolution improvement for peptides with close similarity in electrophoretic mobilities. Keywords: Capillary electrophoresis, peptide, protein digests, pre-concentration, detection sensitivity, resolution. Abstrak Elektroforesis rerambut (CE) merupakan salah satu teknologi pemisahan terkini untuk analisis analit boleh-larut air. CE mempunyai banyak kelebihan berbanding dengan kaedah-kaedah yang lebih terkenal seperti kromatografi cecair dan elektroforesis jel, antaranya ialah analisis yang pantas, memerlukan sampel yang amat sedikit, menggunakan amat kurang atau tiada langsung pelarut organik toksik, keberkesanan puncak yang tinggi dan automasi yang mudah. Walaupun mempunyai banyak kelebihan-kelebihan yang menarik, namun pengguna-pengguna CE masih berusaha untuk menambahbaik kaedah ini terutamanya dari segi kepekaan pengesanan, resolusi dan selektiviti. Kertaskerja ini melaporkan beberapa pendekatan- pendekatan mudah untuk meningkatkan kepekaan pengesanan dengan menggunakan kaedah pra-pemekatan mudah yang dipanggil suntikan sampel medan-diperkuat (FESI) dan pra-pemekat berasaskan kromatografi ZipTip C 18 . Juga, beberapa kaedah penambahbaikan resolusi campuran peptida yang kompleks dengan menggunakan dua strategi yang dipanggil penyalutan rerambut dan manipulasi ciri hidropobisiti peptida dengan mengunakan asid-asid perfluorin sebagai elektrolit latarbelakang (BGE). Asid-asid perfluorin membentuk bes konjugat anionik yang memberikan ciri hidropobik kepada BGE. Sebatian peptida piawai dan hasil hadaman beberapa protein telah digunakan sebagai sebatian ujian dalam kajian ini. Hasil kajian menunjukkan bahawa kaedah FESI dapat meningkatkan isyarat pengesanan sebatian sebatian peptida piawai dan hasil hadaman BSA dengan berkesan. Bagi penggunaan pra-pemekat ZipTip C 18 pula, peningkatan secara selektif ke atas isyarat pengesanan dapat
Transcript of peptide separation by capillary electrophoresis with ultraviolet ...

The Malaysian Journal of Analytical Sciences, Vol 15 No 2 (2011): 273 - 287
273
PEPTIDE SEPARATION BY CAPILLARY ELECTROPHORESIS WITH
ULTRAVIOLET DETECTION: SOME SIMPLE APPROACHES TO ENHANCE
DETECTION SENSITIVITY AND RESOLUTION
(Pemisahan Peptida Oleh Elektroforesis Rerambut Dengan Pengesan Ultra-Lembayung: Pendekatan Mudah Untuk
Meningkatkan Isyarat Pengesanan Dan Resolusi)
L. Noumie Surugau
Industrial Chemistry Program,
School of Science and Technology,
Universiti Malaysia Sabah,
Locked Bag 2073, 88999 Kota Kinabalu, Sabah, Malaysia.
*Corresponding author: [email protected]
Abstract
Capillary electrophoresis (CE) is one of the leading separation technologies for analysis of water-soluble analytes. CE has many
advantages over the more established methods such as liquid chromatography and gel electrophoresis particularly in rapid
analysis, require very little sample, use less or no toxic organic solvent, high peak efficiency and ease of automation. Despite the
many attractive advantages of CE, CE users continue to seek improvements particularly on detection sensitivity, resolution and
selectivity. This paper presented several simple approaches to improve detection sensitivity using simple sample pre-
concentration called field-enhanced sample injection (FESI) and chromatographic-based ZipTip C18 pre-concentrator. Also,
some improvements in the resolution of complex peptides mixture when using two strategies namely, capillary coating and
manipulation of the hydrophobicity of peptides using perfluorinated acids as background electrolyte (BGE), which have anionic
conjugate base forms with hydrophobic character. As test compounds, standard peptide mixture and proteins digests were used
for these studies. The results showed that FESI has significantly enhanced the detection signal of peptide standards and bovine
serum albumin (BSA) tryptic digests. As for the use of ZipTip C18 pre-concentrator, selective enhancement in detection signal
was particularly notable on the late migrating peptides. Coating the capillary proved to have little changes on the CE of peptides
when used in conjunction with acidic BGE. Electropherograms of BSA tryptic peptides in pentafluoropropionic acid (PFPA) and
heptafluorobutyric acid (HFBA) showed interesting profile, with notable resolution improvement for peptides with close
similarity in electrophoretic mobilities.
Keywords: Capillary electrophoresis, peptide, protein digests, pre-concentration, detection sensitivity, resolution.
Abstrak
Elektroforesis rerambut (CE) merupakan salah satu teknologi pemisahan terkini untuk analisis analit boleh-larut air. CE
mempunyai banyak kelebihan berbanding dengan kaedah-kaedah yang lebih terkenal seperti kromatografi cecair dan
elektroforesis jel, antaranya ialah analisis yang pantas, memerlukan sampel yang amat sedikit, menggunakan amat kurang atau
tiada langsung pelarut organik toksik, keberkesanan puncak yang tinggi dan automasi yang mudah. Walaupun mempunyai
banyak kelebihan-kelebihan yang menarik, namun pengguna-pengguna CE masih berusaha untuk menambahbaik kaedah ini
terutamanya dari segi kepekaan pengesanan, resolusi dan selektiviti. Kertaskerja ini melaporkan beberapa pendekatan-
pendekatan mudah untuk meningkatkan kepekaan pengesanan dengan menggunakan kaedah pra-pemekatan mudah yang
dipanggil suntikan sampel medan-diperkuat (FESI) dan pra-pemekat berasaskan kromatografi ZipTip C18. Juga, beberapa kaedah
penambahbaikan resolusi campuran peptida yang kompleks dengan menggunakan dua strategi yang dipanggil penyalutan
rerambut dan manipulasi ciri hidropobisiti peptida dengan mengunakan asid-asid perfluorin sebagai elektrolit latarbelakang
(BGE). Asid-asid perfluorin membentuk bes konjugat anionik yang memberikan ciri hidropobik kepada BGE. Sebatian peptida
piawai dan hasil hadaman beberapa protein telah digunakan sebagai sebatian ujian dalam kajian ini. Hasil kajian menunjukkan
bahawa kaedah FESI dapat meningkatkan isyarat pengesanan sebatian sebatian peptida piawai dan hasil hadaman BSA dengan
berkesan. Bagi penggunaan pra-pemekat ZipTip C18 pula, peningkatan secara selektif ke atas isyarat pengesanan dapat
L. Noumie Surugau: PEPTIDE SEPARATION BY CAPILLARY ELECTROPHORESIS WITH ULTRAVIOLET
DETECTION: SOME SIMPLE APPROACHES TO ENHANCE DETECTION
SENSITIVITY AND RESOLUTION
274
diperhatikan terutamanya pada peptida yang termigrasi lewat. Menyalut rerambut menunjukkan perubahan yang sedikit ke atas
CE peptida apabila digunakan bersama dengan BGE berasid. Elektroferogram-elektroferogram peptida triptik BSA dalam asid
pentafluoropropionik dan asid heptafluorobutirik sebagai BGE menunjukkan corak yang menarik, di mana peningkatan resolusi
peptida yang mempunyai mobiliti elektroforetik yang hampir sama adalah jelas kelihatan.
Kata kunci: Elektroforesis rerambut, peptida, hasil penghadaman protein, pra-pemekatan, kepekaan pengesanan, resolusi.
Introduction
Peptides represent a large and complex group of biomolecules playing variable and vitally important roles in a
living organism. Peptides act, among others, as hormones, neutrotransmitters, immunomodulators, coenzymes or
enzyme inhibitors, drugs, toxins and antibiotics. Peptide and protein assays in biological samples are increasingly
important in the diagnosis and treatment of a number of diseases. The importance of peptides in proteomics is ever
increasing, since both the structure and function of many proteins are identified via their peptide fragments [1,2].
Traditionally, peptides have been analyzed by high-performance liquid chromatography (HPLC); CE is becoming
rapidly accepted as complementary to this method. CE has several advantages over HPLC, including rapid analysis
time, high separation efficiency, requires very little sample amount and eliminates the use of toxic solvents and
handling their waste. CE, both CE-ultraviolet (CE-UV) and CE-mass spectrometry (CE-MS) has been utilized for
the separation and characterization of peptides. This is reflected in the large number of publications on CE of
peptides in various samples. For instance, peptides in human serum [3], polypeptides in urine and cerebrospinal
fluid [4] and body fluid [5], Amadori compounds [6], plasma [7], to name a few of the recent publications.
In CE, the narrow bore capillary allows injection of 2 - 10 nL normally, which is very convenient for analysis of
biological sample. Paradoxically, this advantage leads to major drawbacks [8]. Most commercial CE detectors rely
on on-column UV absorption, therefore, the optical pathlength (Equation 1) is essentially equal to the internal
diameter (i.d.) of the capillary; which is normally 50 – 100 m.
pA l C (1)
where A is absorbance, is the molar absorption coefficient, C the sample concentration, and lp the optical
pathlength.
This poses a severe limitation on account of the Beer-Lambert Law. The concentration limit of detection (CLOD) in
CE, which typically ranges from 10-5
to 10-6
M, is thus poorer than HPLC. Unfortunately, protein concentrations in
biological samples (e.g. blood, plasma, cells) can be in the sub-micromolar range. At these concentrations, tryptic
fragments represented in the peptide map are undetectable by the conventional CE with UV absorbance detection.
Over the years, several techniques have been developed for improving detection sensitivity in CE. These
improvement efforts can be grouped into two areas: CE detection technology and sample pre-concentration. On
detection sensitivity, attempts were aimed at lengthening the detection pathlength lp such as Z-shaped cells [8,9],
bubble-shaped cells [10] or multi-reflection detection cells [11] and rectangular CE [12]. This technology produces
the best sensitivity enhancement (by one order of magnitude), but decreases resolution and remains expensive.
Other attempts have aimed to improve the performance of other detection schemes such as MS [13,14], laser-
induced fluorescence (LIF) with derivatization [15] and without derivatization [16], electrochemical [17] and
chemiluminescene [18]. MS is universal with very high detection sensitivity for peptides but is expensive and
requires complex instrumentation. LIF detectors are more sensitive than UV but not as flexible as UV detectors, e.g.
they require specific derivatization reagents among other limitations. As for electrochemical and chemiluminescene
detection schemes, their applications are still limited in peptides and proteins.
A simpler and more straightforward technique of improving the detection sensitivity in CE-UV is sample pre-
concentration. There are two mechanisms of sample pre-concentration: electrophoretic-based and chromatographic-
based. In this report, sample pre-concentration using field-enhanced sample injection (FESI) and chromatographic-
based using commercial ZipTip C18 pre-concentrator are described. FESI pre-concentration is based on the

The Malaysian Journal of Analytical Sciences, Vol 15 No 2 (2011): 273 - 287
275
difference between the velocity of the analyte in the sample plug and the velocity in the running buffer. The
stacking process occurs when the injection part of the capillary is still in the sample vial, which is during the
injection using voltage. Then, the focusing process occurs after replacing the sample vial with the buffer vial and
during the start of the CE run. This is very simple to perform in any CE analysis: a small plug of water (or any
solution with lower conductivity than the BGE is injected into the capillary after filling it with BGE, then sample
injection is performed using electrokinetic injection. The chromatographic-based pre-concentrator ZipTip C18 tips
are commonly used for sample clean-up. At the same time, it also pre-concentrates the analyte into a small sample
volume. Details of the extraction and pre-concentration procedures are given in the methodology section.
Interaction between analyte and inner capillary wall is detrimental to CE. The small diffusion coefficients of
proteins, of the order of 10-10
m2 s
-1 compared to 10
-8 m
2 s
-1 for small molecules such as peptides, should in theory
give peak efficiencies of the order of 106 theoretical plates. However, these values are not achieved experimentally,
and in many cases peak tailing is seen to occur. This is a result of strong electrostatic interactions between regions
of net positive charge density on the protein or peptide surface with negatively charged capillary inner wall. In the
current study, therefore, the inner wall of the bare fused silica capillary was coated with a coating solution
commercially available from Target Discovery (Palo Alto, CA, USA) called UltraTrol. The exact properties of the
coating solution are not available due to intellectual property factors, but according to the manufacturer it is a class
of linear polyacrylamide, N-substituted acrylamide co-polymers for the control of electroomostic force and
electroosmotic flow (EOF). The solution is used to pre-coat the bare fused silica capillary and not added into the
BGE, therefore no alteration occurs to the viscosity or ionic strength of the BGE. Because it alters the EOF, it is
expected to affect the electrophoretic mobilities of the analyte. Manipulation of the intrinsic electrophoretic
mobilities of analytes would offer an opportunity to enhance their selectivity and thus improve resolution.
Another effort carried out to improve the peptide resolution in this study is ion interaction strategy. CE separations
are based on differences in analyte charge-to-size ratios. In theory, therefore, positively charged peptides of the
same molecular size and charge, differing only in hydrophobicity, would not be separated by CE. Thus, selectivity
of CE separations can only be optimized based on other characteristics, such as their hydrophobicity [19]. In cases
where resolution of peptides is poor due to close similarity in electrophoretic mobility arising from there being little
difference in charge and/or size, manipulating their hydrophobicity could be an alternative to optimize their
separation. In reversed-phase-liquid chromatography (RP-LC) the process of ion-pairing has been widely utilized to
enhance selectivity for the separation of analytes with similar hydrophobicity. The most widely used anionic ion-
pairing reagents for RP-LC of peptides were perfluorinated carboxylic acids, such as trifluoroacetic acid (TFA) and
its higher homologues such as pentafluoropropionic acid (PFPA) and heptafluorobutyric acid (HFBA) [20, 21].
Thus, in the current study, PFBA and HFBA were employed as separation buffers (to replace phosphate buffer) to
investigate if they would affect the resolution of peaks in the complex peptide mixture of a BSA digest.
Experimental
Chemicals and materials
Acetonitrile (ACN), trifluoroacetic acid (TFA), phosphoric acid, 85 % (w/v), HPLC-grade water, peptide standards
mixture (P2693), bovine serum albumin (BSA), TPCK-treated trypsin [EC 3.4.21.4], 4-dimethylaminopyridine
(DMAP), HFBA, PFPA and lithium hydroxide were purchased from Sigma-Aldrich (Poole, UK). The six-protein
mixture digest (P/N 161088) was obtained from LC Packings, Dionex Co. (Amsterdam, The Netherlands);
ammonium bicarbonate was bought from BDH Laboratory Supplies (Poole, UK); ZipTip C18 pipette tips were
obtained from Millipore Ltd. (Watford, UK); and UltraTrol dynamic pre-coating (ULHN-02841-6905-SM0010)
was bought from Target Discovery Inc. (Palo Alto, CA, USA). Fused-silica capillaries were obtained from
Composite Metal Services Ltd. (Ilkely, UK). All reagents were of analytical grade; BSA, protein digests and
peptide standards were used without any further purification.
Apparatus and procedures
CE-UV analyses were performed in 50 cm, 50 m i.d. and 365 m o.d. uncoated fused-silica capillary on a
Beckman P/ACE MDQ system (Beckman-Coulter, High Wycombe, UK) equipped with a UV diode array detector.
The UV absorbance scan range from 190 to 300 nm took place at 10 cm from outlet end through a window created
by removal of 1 cm of polyimide coating. The polyimide coating was also removed 2-3 mm from both ends to
L. Noumie Surugau: PEPTIDE SEPARATION BY CAPILLARY ELECTROPHORESIS WITH ULTRAVIOLET
DETECTION: SOME SIMPLE APPROACHES TO ENHANCE DETECTION
SENSITIVITY AND RESOLUTION
276
minimize adsorption of the positively charge peptides on the coating [22]. For a new capillary, it was conditioned by
rinsing with solutions in the following order: (i) MeOH (5 min), (ii) HPLC water (30 min) (iii) 1 M HCl (30 min),
(iv) HPLC water (30 min), (v) 1 M NaOH (30 min), (vi) HPLC water (30 min) and (vii) BGE (30 - 60 min). For
used but still good capillary, it was conditioned with 0.1 M NaOH (15 – 30 min), HPLC-grade water (30 min) and
then BGE (30 - 40 min) prior to analysis. In between runs, capillary was rinsed with running buffer for 2 – 5 min.
Re-conditioning of the capillary was performed again if the reproducibility of migration time and peak area was
poor. Separation was carried out using applied voltage of +15 – 30 kV. Temperatures of samples compartment and
capillary during analysis were set constant at 25oC. All analyses were carried out in triplicate or more. Other
experimental details are described in Results and Discussion.
Preparation of buffer, standard and sample solutions
Except for the II-CE experiments, the BGE was 80 mM phosphate buffer which was prepared from a concentrated
phosphoric acid 85 % (w/v). Similarly, the 80 mM PFBA and 80 mM HFPA buffers were prepared from
concentrated PFBA and HFPA, respectively. In all cases the pH of the BGEs were adjusted to 2.3 with 1.0 M LiOH.
Meanwhile, the digestion buffer was 50 mM ammonium bicarbonate, pH 7.8, prepared from ammonium bicarbonate
salt. The final pH of each buffer was measured using a Corning ion analyzer 150 (Halstead, UK). All buffers were
sonicated for 20 min or more, filtered through a 0.2 m microfilter (Sartorius, Göttingen, Germany) prior to use. A
stock solution of nine peptide standards (P2693) (containing 25 µg of each peptide) was prepared by adding 450 µL
HPLC-grade water and 50 L of 0.1 % TFA into the mixture vial to give 50 g mL-1
each peptide. Further dilution
into 10% BGE was carried out to obtain solution with the concentration of 5.0 g mL-1
each peptide. The six-protein
mixture digest working solution of 1.0 pmol L-1
was prepared by adding 100 L 0.05 % TFA in HPLC-grade
water into the vial containing 100 pmol each protein. All solutions were prepared in HPLC-grade water.
Protein digestion procedures
About 0.5 mg of BSA or six-protein mixture was dissolved in 0.5 mL digestion buffer. TPCK-treated trypsin was
added to the BSA digestion solution at a substrate-to-enzyme ratio of 1:20 to 1:50. The digestion vial was then
incubated in a water bath at 37oC for 18 h. Phosphoric acid (0.5 mL, 1.0 M) was added into the digest to terminate
the proteolysis and acidify the digest solution. The mixture was then centrifuged at 5,500 g for 10 - 15 min to obtain
a clear solution. 100 L of the clear solution were diluted with 20 L phosphate BGE and made up to 200 L with
HPLC-grade water to give a final concentration of 250 g mL-1
total peptides. If necessary, further dilution was
carried out to obtain more diluted digest samples. The samples were analyzed immediately.
Sample pre-concentration procedures
FESI
Procedures for the FESI stacking experiments were as previously reported by Monton and Terabe [27]. The
procedures were as follows: (i) capillary was filled with BGE (20 psi, 2 min), (ii) injection of water plug (0.5 psi, 5
– 7 s), (iii) sample injection using voltage (electrokinetic injection) (+5 – +7 kV, 5 – 10 s), (iv) injection of BGE
(0.5 psi, 5 s), (v) separation (+25 – +30 kV, until analysis completed).
ZipTip C18
Procedures for ZipTip C18 pre-concentration were as recommended by Millipore Corp. (UK). For this experiment, a
10 µL pipette (Eppendorf UK, Cambridge, UK) was used, where the ZipTip C18 pre-concentrator was assembled on
the pipette as a tip. The solutions used were: (i) wetting solution (A): 100 % ACN; (ii) equilibration (B) and
washing (C) solutions: 0.1 % TFA; (iii) elution solution (D): 0.1 % TFA in 50:50 (v/v) ACN:H2O. Three processes
were involved namely, (i) equilibrium, (ii) binding and washing, and (iii) elution. Prior to use, the ZipTip tip was
conditioned by rinsing with solution A twice, then rinsed three times with solution B. For binding, the sample
solution was aspirated from and dispensed into its original tube 15 times. Then, the ZipTip tip was rinsed with
solution C, also 15 times. To elute the bound analytes, the ZipTip tip was rinsed by aspirating and dispensing 4 L
solution D into a sample tube 15 times. The pre-concentrated sample was then analysed with CE.

The Malaysian Journal of Analytical Sciences, Vol 15 No 2 (2011): 273 - 287
277
Dynamic coating procedures
Procedures for application of the UltraTrol dynamic pre-coating were as recommended by the manufacturer (Target
Discovery Inc., USA).
Ion interaction CE (II-CE)
The procedures were similar to those in other CE analyses, but 80 mM phosphate (pH 2.3) buffer was replaced by
PFBA or HFPA at similar concentration and pH.
Results and Discussion
FESI pre-concentration
Initially the capillary is filled with BGE, followed by a hydrodynamic injection of a short plug of water, which
guarantees the presence of a sufficiently long zone of low conductivity [23]. At low pH, the electroosmosis is
limited, which means that the plug of water stays at the injection end. Injection of a BGE plug after the sample
injection aids this process and prevents expulsion of any of the water plug due to Joule heating and expansion of the
capillary contents. Being positively charged, the peptides that enter the capillary rapidly move to the front of the
water plug. At this point they encounter a lower electric field and slowed down immediately, a process that literally
stacks the peptides at the front of the water plug/BGE interface. After substituting the sample vial with a BGE vial
at the inlet, the CE voltage is turned on, and the focused analytes separate according to their electrophoretic
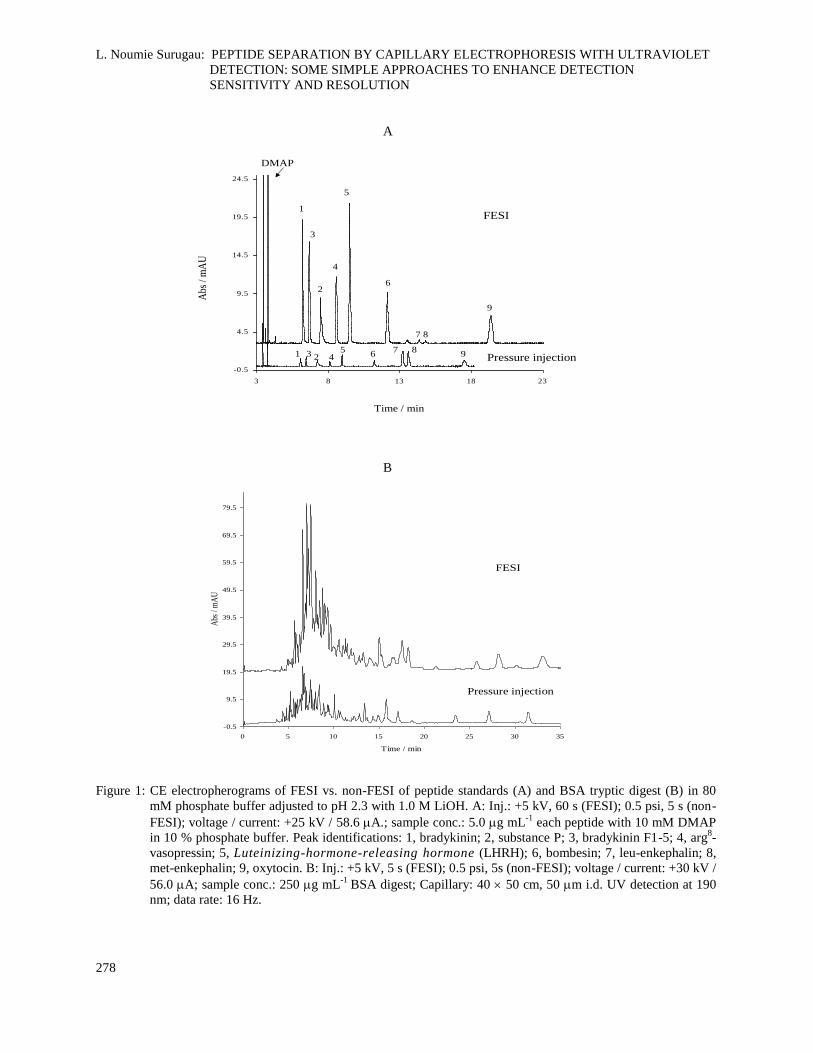
mobility. The electropherograms of FESI stacking and non-FESI (i.e. using normal pressure injection) of peptide
standard mixture and BSA tryptic digest are shown in Figures 1A and 1B, respectively.
Figure 1A showed significant increased in the detection signal (i.e. UV absorbance) of the peptides. The injected
sample volume in the non-FESI was approximately 6.0 nL, which corresponds to 29 pg each peptide. In the FESI
method, the electric field across the capillary under applied voltage would not be uniform due to the water plug at
the injection end, and calculation of the injected amount using the formula for electrokinetic injection (Equation 2)
would not be accurate.
21
ep eo inj inj4( )Q D E Ct (2)
where, Q is the amount injected, µep and µeo are electrophoretic and electroosmotic mobilities, respectively, Einj is
the field strength across the injection zone, D is the capillary internal diameter, C is the solute concentration and tinj
is the injection duration.
The amount of sample loaded by electrokinetic injection was, therefore, using approximated by peak area
comparison [24]. Using bradykinin (peak 1) as a basis, the peak area when using FESI was 35.5 times bigger
relative to that obtained by typical pressure injection, which is equivalent to 210 nl of injected sample solution. As
described in Introduction, narrow bore capillary allows injection of 2 - 10 nL normally using pressure injection. It is
shown here that FESI method allows much larger injection of sample which ultimately produce enhanced detection
signal. The effect of FESI was evaluated by direct comparison of peak height in FESI and non-FESI
electropherograms of the test peptides. Table 1 shows the reproducibility (expressed as % relative standard
deviation, % RSD) of migration time and, peak height, corrected peak area (PA) and sensitivity enhancement factor
(SEF) of the peptide mixture for the FESI studies.
As seen in Table 1, % RSD of migration time increases on descending the column which most probably due to the
decrease of electrophoretic mobility, and therefore greater susceptibility to EOF variations from run to run. Previous
researchers also noted high variations in FESI which caused difficulty in quantification [25]. On the basis of the
present data, peak height has better reproducibility than peak area. According to Ledger et al. [25], this is because
peak height is less influenced by migration time and integration errors. Thus, the SEF was expressed in term of peak
height.
L. Noumie Surugau: PEPTIDE SEPARATION BY CAPILLARY ELECTROPHORESIS WITH ULTRAVIOLET
DETECTION: SOME SIMPLE APPROACHES TO ENHANCE DETECTION
SENSITIVITY AND RESOLUTION
278
A
-0.5
4.5
9.5
14.5
19.5
24.5
3 8 13 18 23
Time / min
Ab
s /
mA
U
DMAP
1
2
3
4
5
6
7 8
9
1 3 2 45
67 8
9 Pressure injection
FESI
Time / min
Abs
/m
AU
B
-0.5
9.5
19.5
29.5
39.5
49.5
59.5
69.5
79.5
0 5 10 15 20 25 30 35
Time / min
Abs
/ m
AU
Pressure injection
FESI
Figure 1: CE electropherograms of FESI vs. non-FESI of peptide standards (A) and BSA tryptic digest (B) in 80
mM phosphate buffer adjusted to pH 2.3 with 1.0 M LiOH. A: Inj.: +5 kV, 60 s (FESI); 0.5 psi, 5 s (non-
FESI); voltage / current: +25 kV / 58.6 A.; sample conc.: 5.0 g mL-1
each peptide with 10 mM DMAP
in 10 % phosphate buffer. Peak identifications: 1, bradykinin; 2, substance P; 3, bradykinin F1-5; 4, arg8-
vasopressin; 5, Luteinizing-hormone-releasing hormone (LHRH); 6, bombesin; 7, leu-enkephalin; 8,
met-enkephalin; 9, oxytocin. B: Inj.: +5 kV, 5 s (FESI); 0.5 psi, 5s (non-FESI); voltage / current: +30 kV /
56.0 A; sample conc.: 250 g mL-1
BSA digest; Capillary: 40 50 cm, 50 m i.d. UV detection at 190
nm; data rate: 16 Hz.
The Malaysian Journal of Analytical Sciences, Vol 15 No 2 (2011): 273 - 287
279
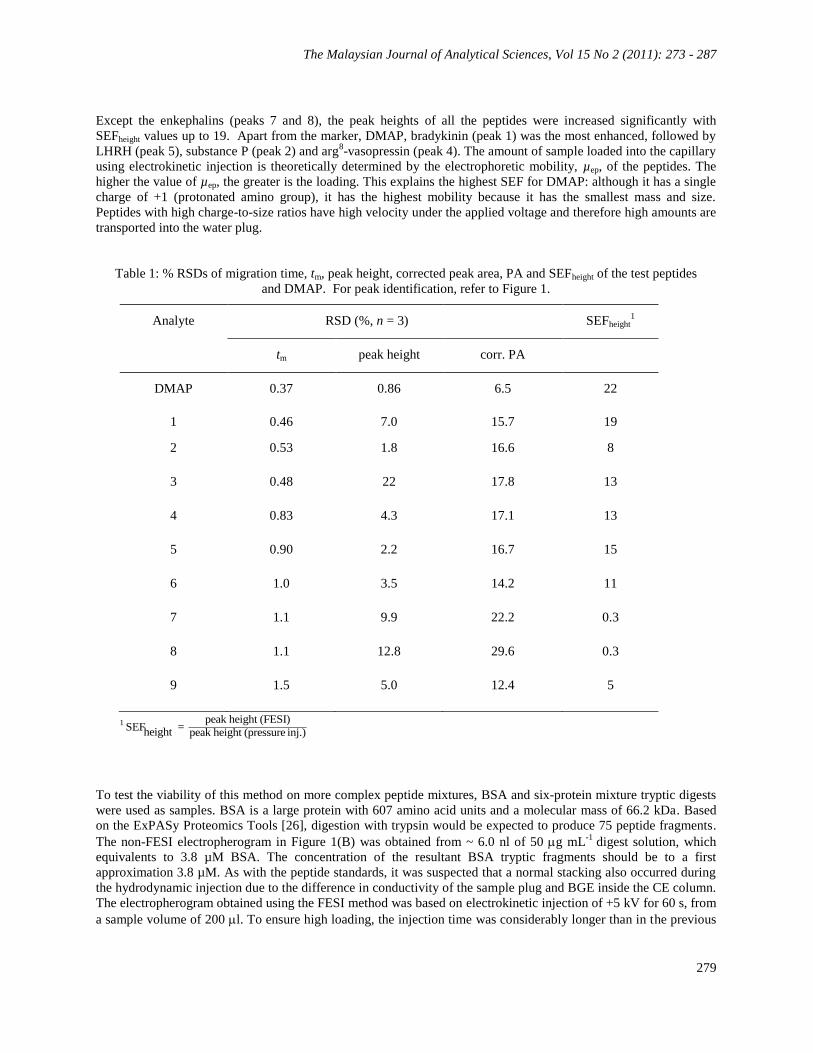
Except the enkephalins (peaks 7 and 8), the peak heights of all the peptides were increased significantly with
SEFheight values up to 19. Apart from the marker, DMAP, bradykinin (peak 1) was the most enhanced, followed by
LHRH (peak 5), substance P (peak 2) and arg8-vasopressin (peak 4). The amount of sample loaded into the capillary
using electrokinetic injection is theoretically determined by the electrophoretic mobility, µep, of the peptides. The
higher the value of µep, the greater is the loading. This explains the highest SEF for DMAP: although it has a single
charge of +1 (protonated amino group), it has the highest mobility because it has the smallest mass and size.
Peptides with high charge-to-size ratios have high velocity under the applied voltage and therefore high amounts are
transported into the water plug.
Table 1: % RSDs of migration time, tm, peak height, corrected peak area, PA and SEFheight of the test peptides
and DMAP. For peak identification, refer to Figure 1.
Analyte RSD (%, n = 3) SEFheight1
tm peak height corr. PA
DMAP 0.37 0.86
6.5 22
1 0.46 7.0 15.7 19
2 0.53 1.8 16.6 8
3 0.48 22 17.8 13
4 0.83 4.3 17.1 13
5 0.90 2.2 16.7 15
6 1.0 3.5 14.2 11
7 1.1 9.9 22.2 0.3
8 1.1 12.8 29.6 0.3
9 1.5 5.0 12.4 5
1 peak height (FESI)SEF =height peak height (pressure inj.)
To test the viability of this method on more complex peptide mixtures, BSA and six-protein mixture tryptic digests
were used as samples. BSA is a large protein with 607 amino acid units and a molecular mass of 66.2 kDa. Based
on the ExPASy Proteomics Tools [26], digestion with trypsin would be expected to produce 75 peptide fragments.
The non-FESI electropherogram in Figure 1(B) was obtained from ~ 6.0 nl of 50 g mL-1
digest solution, which
equivalents to 3.8 µM BSA. The concentration of the resultant BSA tryptic fragments should be to a first
approximation 3.8 µM. As with the peptide standards, it was suspected that a normal stacking also occurred during
the hydrodynamic injection due to the difference in conductivity of the sample plug and BGE inside the CE column.
The electropherogram obtained using the FESI method was based on electrokinetic injection of +5 kV for 60 s, from
a sample volume of 200 l. To ensure high loading, the injection time was considerably longer than in the previous
L. Noumie Surugau: PEPTIDE SEPARATION BY CAPILLARY ELECTROPHORESIS WITH ULTRAVIOLET
DETECTION: SOME SIMPLE APPROACHES TO ENHANCE DETECTION
SENSITIVITY AND RESOLUTION
280
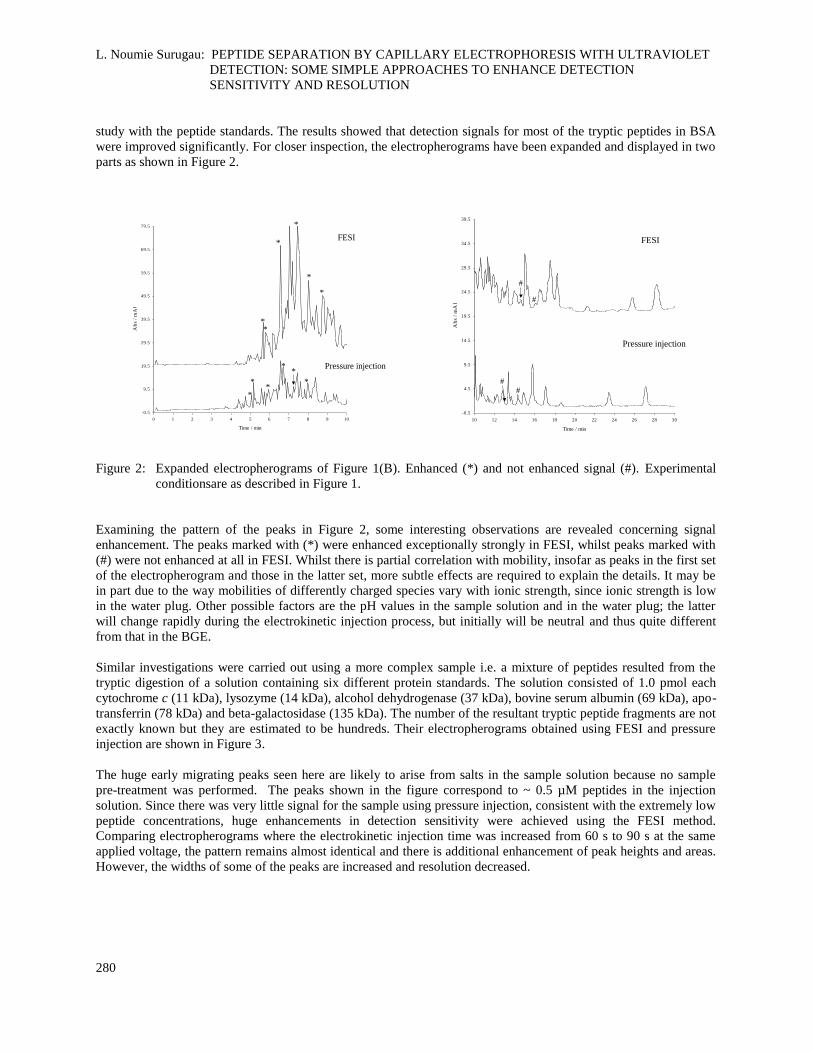
study with the peptide standards. The results showed that detection signals for most of the tryptic peptides in BSA
were improved significantly. For closer inspection, the electropherograms have been expanded and displayed in two
parts as shown in Figure 2.
-0.5
9.5
19.5
29.5
39.5
49.5
59.5
69.5
79.5
0 1 2 3 4 5 6 7 8 9 10
Time / min
Ab
s /
mA
U
*
FESI
Pressure injection
*
*
*
*
*
*
**
**
*
-0.5
4.5
9.5
14.5
19.5
24.5
29.5
34.5
39.5
10 12 14 16 18 20 22 24 26 28 30
Time / min
Ab
s /
mA
U
FESI
Pressure injection
#
#
#
#
Figure 2: Expanded electropherograms of Figure 1(B). Enhanced (*) and not enhanced signal (#). Experimental
conditionsare as described in Figure 1.
Examining the pattern of the peaks in Figure 2, some interesting observations are revealed concerning signal
enhancement. The peaks marked with (*) were enhanced exceptionally strongly in FESI, whilst peaks marked with
(#) were not enhanced at all in FESI. Whilst there is partial correlation with mobility, insofar as peaks in the first set
of the electropherogram and those in the latter set, more subtle effects are required to explain the details. It may be
in part due to the way mobilities of differently charged species vary with ionic strength, since ionic strength is low
in the water plug. Other possible factors are the pH values in the sample solution and in the water plug; the latter
will change rapidly during the electrokinetic injection process, but initially will be neutral and thus quite different
from that in the BGE.
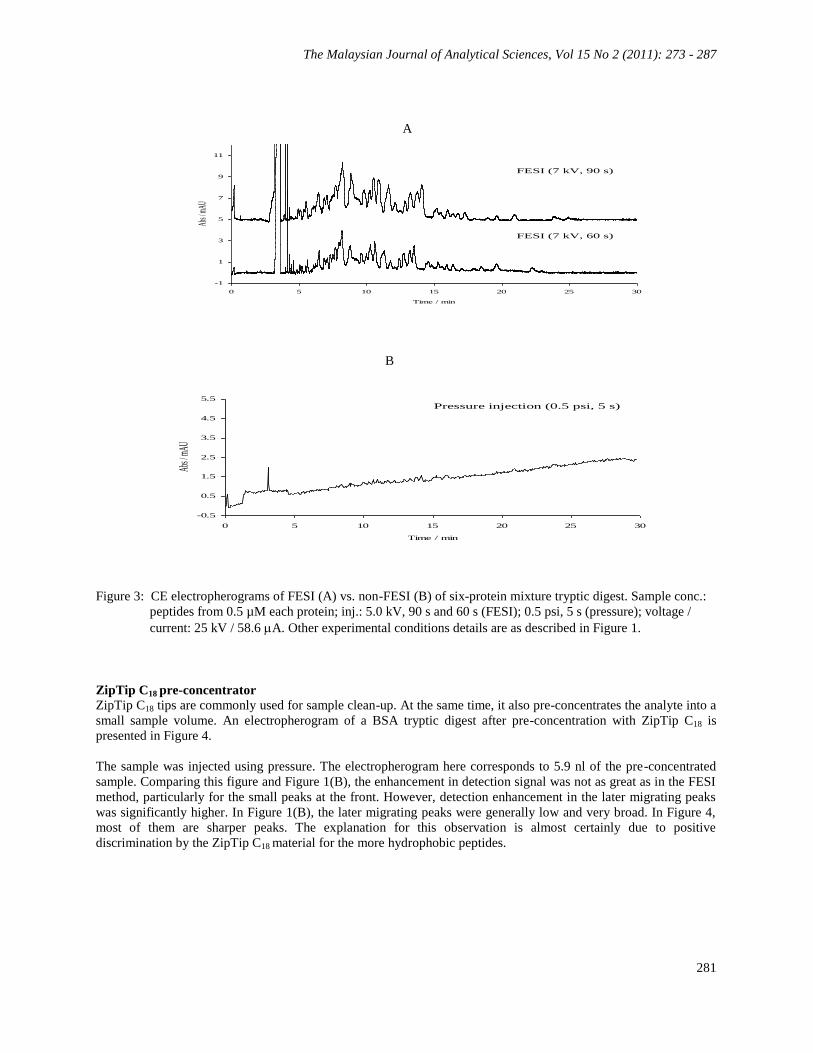
Similar investigations were carried out using a more complex sample i.e. a mixture of peptides resulted from the
tryptic digestion of a solution containing six different protein standards. The solution consisted of 1.0 pmol each
cytochrome c (11 kDa), lysozyme (14 kDa), alcohol dehydrogenase (37 kDa), bovine serum albumin (69 kDa), apo-
transferrin (78 kDa) and beta-galactosidase (135 kDa). The number of the resultant tryptic peptide fragments are not
exactly known but they are estimated to be hundreds. Their electropherograms obtained using FESI and pressure
injection are shown in Figure 3.
The huge early migrating peaks seen here are likely to arise from salts in the sample solution because no sample
pre-treatment was performed. The peaks shown in the figure correspond to ~ 0.5 µM peptides in the injection
solution. Since there was very little signal for the sample using pressure injection, consistent with the extremely low
peptide concentrations, huge enhancements in detection sensitivity were achieved using the FESI method.
Comparing electropherograms where the electrokinetic injection time was increased from 60 s to 90 s at the same
applied voltage, the pattern remains almost identical and there is additional enhancement of peak heights and areas.
However, the widths of some of the peaks are increased and resolution decreased.
The Malaysian Journal of Analytical Sciences, Vol 15 No 2 (2011): 273 - 287
281
-1
1
3
5
7
9
11
0 5 10 15 20 25 30
Time / min
Abs /
mAU
FESI (7 kV, 60 s)
FESI (7 kV, 90 s)
-0.5
0.5
1.5
2.5
3.5
4.5
5.5
0 5 10 15 20 25 30
Time / min
Abs /
mAU
Pressure injection (0.5 psi, 5 s)
Figure 3: CE electropherograms of FESI (A) vs. non-FESI (B) of six-protein mixture tryptic digest. Sample conc.:
peptides from 0.5 µM each protein; inj.: 5.0 kV, 90 s and 60 s (FESI); 0.5 psi, 5 s (pressure); voltage /
current: 25 kV / 58.6 A. Other experimental conditions details are as described in Figure 1.
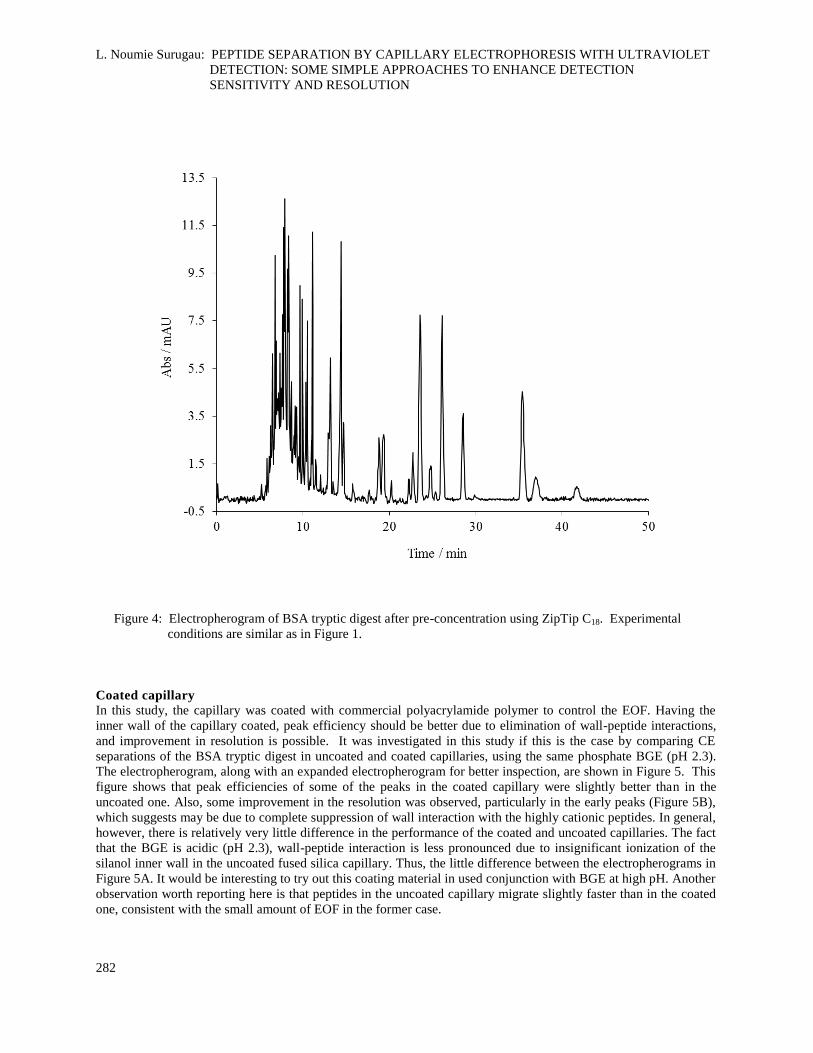
ZipTip C18 pre-concentrator
ZipTip C18 tips are commonly used for sample clean-up. At the same time, it also pre-concentrates the analyte into a
small sample volume. An electropherogram of a BSA tryptic digest after pre-concentration with ZipTip C18 is
presented in Figure 4.
The sample was injected using pressure. The electropherogram here corresponds to 5.9 nl of the pre-concentrated
sample. Comparing this figure and Figure 1(B), the enhancement in detection signal was not as great as in the FESI
method, particularly for the small peaks at the front. However, detection enhancement in the later migrating peaks
was significantly higher. In Figure 1(B), the later migrating peaks were generally low and very broad. In Figure 4,
most of them are sharper peaks. The explanation for this observation is almost certainly due to positive
discrimination by the ZipTip C18 material for the more hydrophobic peptides.
A
B
L. Noumie Surugau: PEPTIDE SEPARATION BY CAPILLARY ELECTROPHORESIS WITH ULTRAVIOLET
DETECTION: SOME SIMPLE APPROACHES TO ENHANCE DETECTION
SENSITIVITY AND RESOLUTION
282
Figure 4: Electropherogram of BSA tryptic digest after pre-concentration using ZipTip C18. Experimental
conditions are similar as in Figure 1.
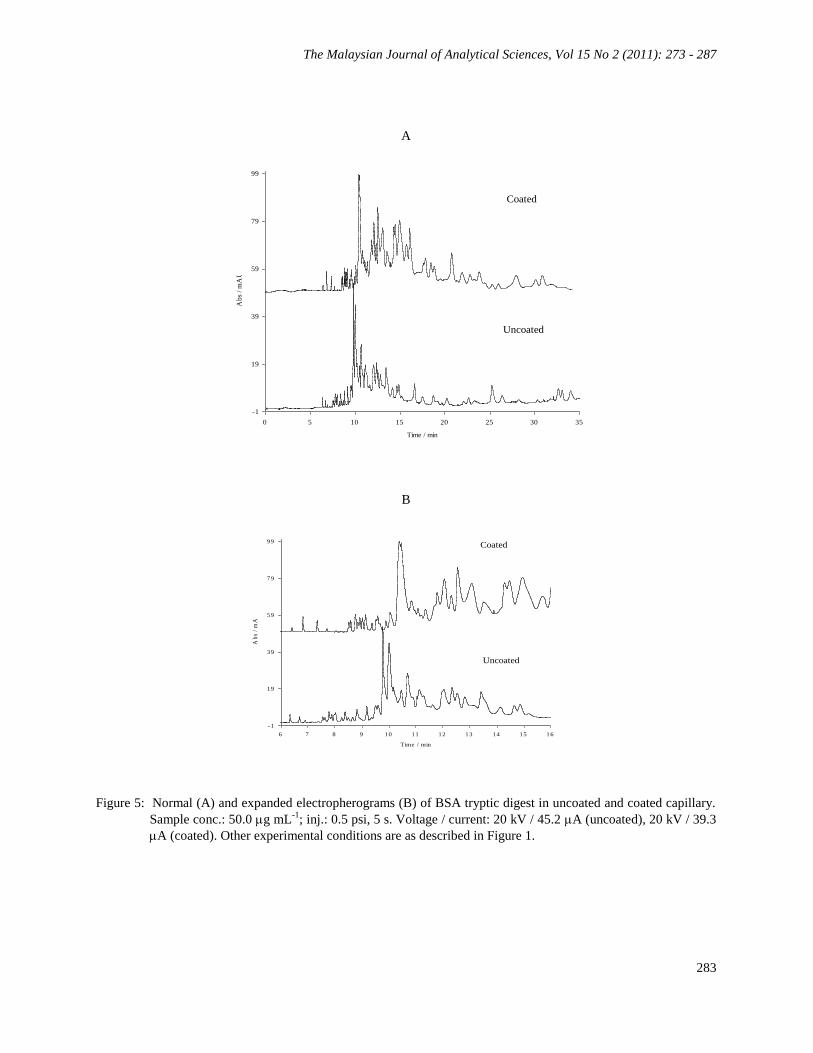
Coated capillary
In this study, the capillary was coated with commercial polyacrylamide polymer to control the EOF. Having the
inner wall of the capillary coated, peak efficiency should be better due to elimination of wall-peptide interactions,
and improvement in resolution is possible. It was investigated in this study if this is the case by comparing CE
separations of the BSA tryptic digest in uncoated and coated capillaries, using the same phosphate BGE (pH 2.3).
The electropherogram, along with an expanded electropherogram for better inspection, are shown in Figure 5. This
figure shows that peak efficiencies of some of the peaks in the coated capillary were slightly better than in the
uncoated one. Also, some improvement in the resolution was observed, particularly in the early peaks (Figure 5B),
which suggests may be due to complete suppression of wall interaction with the highly cationic peptides. In general,
however, there is relatively very little difference in the performance of the coated and uncoated capillaries. The fact
that the BGE is acidic (pH 2.3), wall-peptide interaction is less pronounced due to insignificant ionization of the
silanol inner wall in the uncoated fused silica capillary. Thus, the little difference between the electropherograms in
Figure 5A. It would be interesting to try out this coating material in used conjunction with BGE at high pH. Another
observation worth reporting here is that peptides in the uncoated capillary migrate slightly faster than in the coated
one, consistent with the small amount of EOF in the former case.
The Malaysian Journal of Analytical Sciences, Vol 15 No 2 (2011): 273 - 287
283
A
-1
19
39
59
79
99
0 5 10 15 20 25 30 35
Time / min
Ab
s /
mA
U
Uncoated
Coated
B
-1
19
39
59
79
99
6 7 8 9 10 11 12 13 14 15 16
Time / min
Ab
s /
mA
U
Uncoated
Coated
Figure 5: Normal (A) and expanded electropherograms (B) of BSA tryptic digest in uncoated and coated capillary.
Sample conc.: 50.0 g mL-1
; inj.: 0.5 psi, 5 s. Voltage / current: 20 kV / 45.2 A (uncoated), 20 kV / 39.3
A (coated). Other experimental conditions are as described in Figure 1.
L. Noumie Surugau: PEPTIDE SEPARATION BY CAPILLARY ELECTROPHORESIS WITH ULTRAVIOLET
DETECTION: SOME SIMPLE APPROACHES TO ENHANCE DETECTION
SENSITIVITY AND RESOLUTION
284
A
-5
0
5
10
15
20
25
30
5 10 15 20 25 30 35
Ab
s / m
AU
Time / min
B
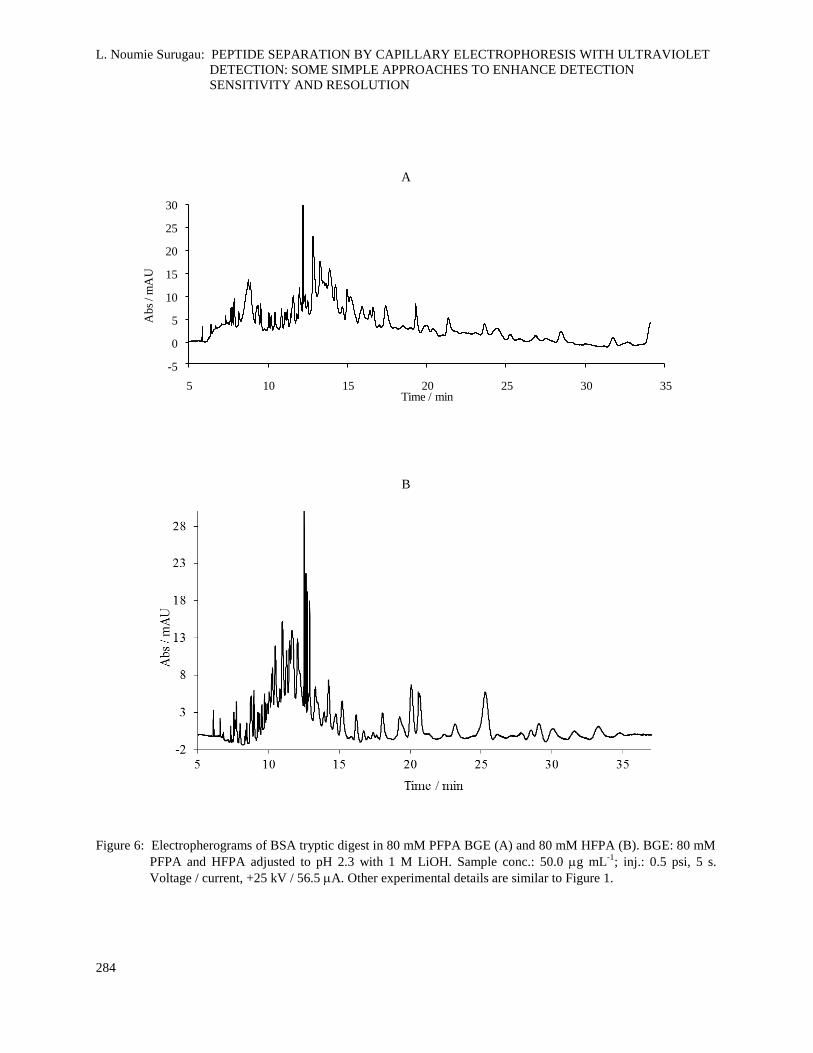
Figure 6: Electropherograms of BSA tryptic digest in 80 mM PFPA BGE (A) and 80 mM HFPA (B). BGE: 80 mM
PFPA and HFPA adjusted to pH 2.3 with 1 M LiOH. Sample conc.: 50.0 g mL-1
; inj.: 0.5 psi, 5 s.
Voltage / current, +25 kV / 56.5 A. Other experimental details are similar to Figure 1.

The Malaysian Journal of Analytical Sciences, Vol 15 No 2 (2011): 273 - 287
285
Ion interaction-CE
In the previous electropherograms of the BSA tryptic digest (Fig. 1A), the peaks in the middle (10-16 min) were
mostly not fully resolved. This may implies that there are a large number of peptides with almost similar mobilities.
In this experiment, phosphate buffer was replaced with PFPA or HFBA, perfluorinated acids which have low pKa
values and anionic conjugate base forms having some hydrophobic character. These more hydrophobic anions were
expected to show ion-pair interactions with the cationic peptides [27], modifying their migration times and changing
the profile of the electropherogram. It was hoped that this would also improve the resolution. The concentrations of
the perfluorinated acids were kept the same as phosphoric acid (80 mM), as were the pH values (2.3). The same
basic solution, 1 M LiOH, was used to adjust the pH. The electropherogram obtained with PFPA and HFBA is
shown in Figure 6A and B, respectively.
It should be noted that the current is almost the same as that obtained in the phosphate BGE, i.e. 56.5 A as
compared to 58.6 µA for the same applied voltage of 25 kV. This implies that ionic concentrations are similar in the
two BGEs. Comparing Figures 1(B) and 6(A), differences between these two electropherograms can be easily seen.
Some of the unresolved peaks in the middle are now further resolved with better peak shape. Similarly, in HFPA
(Figure 6(B), significant improvements in the resolution and peak efficiencies were observed here. The explanation
for this may be hydrophobic interaction between the hydrophobic amino acids in the peptides and the perfluorinated
anions. Manipulation in the degree of ion-ion/hydrophobic interactions of these peptides appears to have resulted in
improved efficiency in the CE, and thus the observed improvement in the peak resolution. Because anions of HFBA
are more hydrophobic than in PFPA, the effects would be expected to be greater with HFBA. Similar observations
were reported by Popa et al. [27] in CE resolution of synthetic peptides when phosphoric acid in the buffer was
replaced by perfluorinated acids. They also observed further improvements in resolution in HFBA compared to in
PFBA.
Conclusions
Detection sensitivity, resolution and peak effeciency have all been improved by one or other of the different
strategies explored in this study. FESI offers the benefits of simplicity, and can be done on-line with minimal
adaptation of the CE conditions: it is simple to inject a water plug prior to the sample, and to use electrokinetic
rather than pressure injection. The detection sensitivity for species which are charged at the sample pH was shown
to be substantially enhanced using this approach, while uncharged species are not injected and not amplified. Use of
the commercial ZipTip C18 tips gave very good results for the late-migrating peptides, and generally provided
benefits for improving the quality of the CE separation of peptides. This is due to a combination of desalting and
selective retention of hydrophobic species on the C18 stationary phase in the ZipTip. Coating the capillary made
little changes in the electropherograms, thus offers no benefit to CE of peptides at low pH. Ionic interaction CE was
found to cause interesting changes in the peptide separation. This is the first time such experiments have been
carried out on a protein digest. The use of HFBA was found to offer most promise in sharpening the peaks.
Acknowledgement
The author is grateful to Universiti Malaysia Sabah for the financial support.
References
1. Washburn, M.P., Wolters, D., Yates III, J.R. 2001. Large-scale analysis of the yeast proteome by
multidimensional protein identification technology. Nat. Biotechnol. 19: 242-248.
2. Wittke, S., Fliser, D., Haubitz, M., Bartel, S., Krebs, R., Hausadel, F., Hillmann, M., Golovko, I., Koester, P.,
Haller, H., Kaiser, T., Mischak, H.,Weissinger, E.M. 2003. Determination of peptides and proteins in human
urine with capillary electrophoresis–mass spectrometry, a suitable tool for the establishment of new diagnostic
markers. J. Chromatogr. A 1013(1-2): 173-181.
3. Sassi, A.P., Andell III, F., Bitter, H.-M., Brown, M.P.S., Chapman, R.G., Espiritu, J. Greenquist, A.C., Guyon,
I., Horchi-Alegre, M., Stults, K.L., Wainright, A., Heller, J.C., Stults, J.T. 2005. An automated, sheathless
capillary electrophoresis-mass spectrometry platform for discovery of biomarkers in human serum.
Electrophoresis 26(7-8): 1500-1512.
L. Noumie Surugau: PEPTIDE SEPARATION BY CAPILLARY ELECTROPHORESIS WITH ULTRAVIOLET
DETECTION: SOME SIMPLE APPROACHES TO ENHANCE DETECTION
SENSITIVITY AND RESOLUTION
286
4. Wittke, S., Mischak, H., Walden, M., Kolch, W., Rädler, T., Wiedemann, K. 2005. Discovery of biomarkers in
human urine and cerebrospinal fluid by capillary electrophoresis coupled to mass spectrometry: Towards new
diagnostic and therapeutic approaches. Electrophoresis 26(7-8): 1476-1487.
5. Kaiser, T., Wittke, S., Just, I., Krebs, R., Bartel, S., Fliser, D., Mischak, H., Weissinger, E.M. 2004. Capillary
electrophoresis coupled to mass spectrometer for automated and robust polypeptide determination in body
fluids for clinical use. Electrophoresis 25(13): 2044-2055.
6. Hau, J., Devaud, S., Blank, I. 2005. Detection of Amadori compounds by capillary electrophoresis coupled to
tandem mass spectrometry. Electrophoresis 26(13): 2077-2083.
7. Ullsten, S., Zuberovic, A., Wetterhall, M., Hardenborg, E., Markides, K.E., Berquist, J. 2004. A polyamine
coating for enhanced capillary electrophoresis-electrospray ionization-mass spectrometry of proteins and
peptides. Electrophoresis 25(13): 2090-2099.
8. Moring, S.E., Reel, R.T., van Soest, R.E.J., Lauer, H.H. 1993. Optical improvements of a Z-shaped cell for
high-sensitivity UV absorbance detection in capillary electrophoresis. Anal. Chem. 65(23): 3454-3459.
9. Chervet, J.P., Van Soest, R.E.J., Ursem, M. 1991. Z-shaped flow cell for UV detection in capillary
electrophoresis. J. Chromatogr. A 543: 439-449.
10. Heiger, D. N. 1992. High Performance Capillary Electrophoresis. Hewlett-Packard, USA. pp. 100–101.
11. Wang, T., Aiken, J.H., Huie, C.W., Hartwick, R.A. 1991. Nanoliter-scale multireflection cell for absorption
detection in capillary electrophoresis. Anal. Chem. 63(14): 1372-1376.
12. Cifuentes, A., Rodriguez, M.A., Garcia-Montelongo, J. F. 1996. Rectangular capillary electrophoresis: study of
some dispersive effects. J. Chromatogr. A 737(2): 243-253.
13. Stutz, H. 2005. Advances in the analysis of proteins and peptides by capillary electrophoresis with matrix-
assisted laser desorption/ionization and electrospray-mass spectrometry detection. Electrophoresis 26(7-8):
1254-1290.
14. Simpson, D. C., Smith, R.D. 2005. Combining capillary electrophoresis with mass spectrometry for
applications in proteomics. Electrophoresis 26(7-8): 1291-1305.
15. Timperman, A.T., Oldenburg, K.E., Sweedler, J.V. 1995. Native fluorescence detection and spectral
differentiation of peptides containing tryptophan and tyrosine in capillary electrophoresis. Anal. Chem. 67(19):
3421-3426.
16. Tong, W., Yeung, E.S. 1996. Determination of insulin in single pancreatic cells by capillary electrophoresis and
laser-induced native fluorescence. J. Chromatogr. B: Biomed. Sci. Appl. 685(1): 35-40.
17. Voegel, P.D., Baldwin, R.P. 1997. Electrochemical detection in capillary electrophoresis. Electrophoresis
18(12): 2267-2278.
18. Staller, T.D., Sepaniak, M.J. 1997. Chemiluminescence detection in capillary electrophoresis. Electrophoresis
189(12-13): 2291-2296.
19. Grossman, P.D., Wilson, K.J., Petrie, G., Lauer, H.J. 1988. Effect of buffer pH and peptide composition on the
selectivity of peptide separations by capillary zone electrophoresis. Anal. Biochem. 173(2): 265-270.
20. Popa, T.V., Mant, C.T., Hodges, R.S. 2004. Capillary electrophoresis of cationic random coil peptide standards:
Effect of anionic ion-pairing reagents and comparison with reversed-phase chromatography. Electrophoresis
25(9): 1219-1229.
21. Mant, C.T., Hodges, R.S. 1991. High-Performance Liquid Chromatography of Peptides and Proteins:
Separation, Analysis and Conformation, CRC Press, Boca Raton, FL.
22. Ensing, K., de Boer, T., Schreuder, N., de Zeeuw, R. 1999. Separation and identification of neuropeptide Y,
two of its fragments and their degradation products using capillary electrophoresis–mass spectrometry. J.
Chromatogr. B: Biomed. Sci. Appl. 727(1-2): 53-61.
23. Zhang, C.-X., Thormann, W. 1996. Head-Column Field-Amplified Sample Stacking in Binary System
Capillary Electrophoresis: A Robust Approach Providing over 1000-Fold Sensitivity Enhancement. Anal.
Chem. 68(15): 2523-2532.
24. Monton, M. R. N., Terabe, S. 2004. Field-enhanced sample injection for high-sensitivity analysis of peptides
and proteins in capillary electrophoresis–mass spectrometry. J. Chromatogr. 1032(1-2): 203-211.
25. Ledger, R., Tucker, I.G., Walker, G.F. 2002. Quantitative capillary electrophoresis assay for the proteolytic
stability of luteinizing hormone-releasing hormones. J. Chromatogr. B 769(2): 235-242.
26. http://www.expasy.org/tools/peptidecutter/.
The Malaysian Journal of Analytical Sciences, Vol 15 No 2 (2011): 273 - 287
287
27. Popa, T.V., Mant, C.T., Hodges, R.S. 2006. Ion-interaction–capillary zone electrophoresis of cationic
proteomic peptide standards. J. Chromatogr. A 1111(2): 192-199.