Packet #5
20
Chapter 5 The Balance Sheet & Its Analysis
description
Transcript of Packet #5
Chapter 5The Balance Sheet & Its Analysis

Balance Sheet
Balance Sheet: summarizes the financial condition of the business at a point in time Estimate of owner’s equity (net worth) Can change daily
Income Statement: summarizes those financial transactions that affect revenue and expenses over a period of time Estimate of profit

Purpose of Balance Sheet
Organizes everything “owned” and “owed” at a given point in time
Asset: anything of value owned by indiv. or business
Liability: debt or financial obligation owed
Balance sheet lists assets, liabilities, and the difference between them is the owner’s equity
Purpose of Balance Sheet
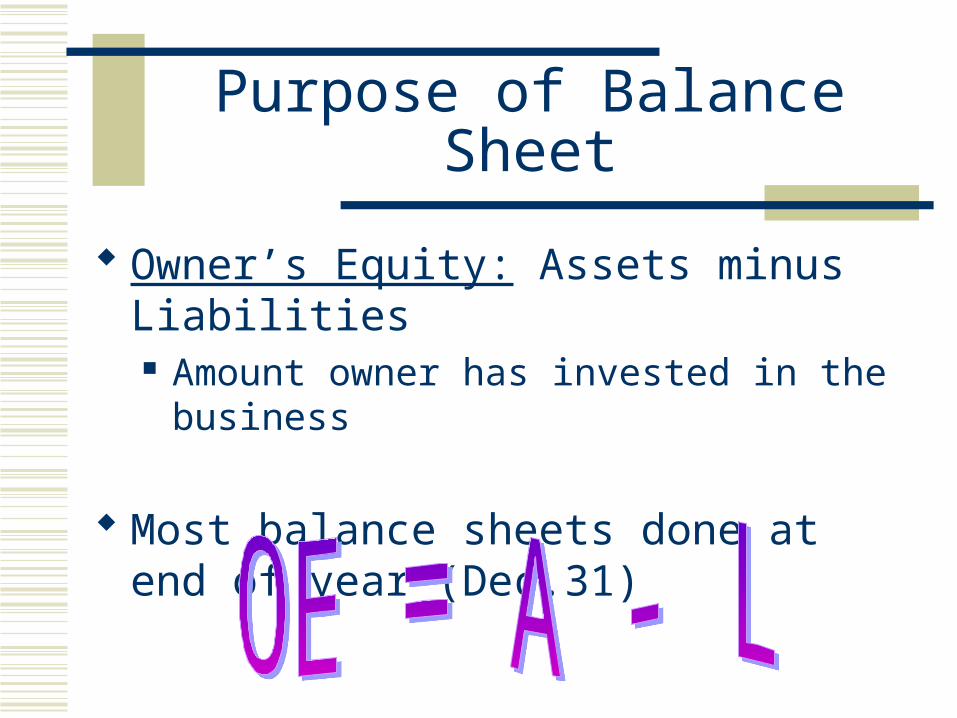
Owner’s Equity: Assets minus Liabilities Amount owner has invested in the business
Most balance sheets done at end of year (Dec.31)
Measure Financial Position
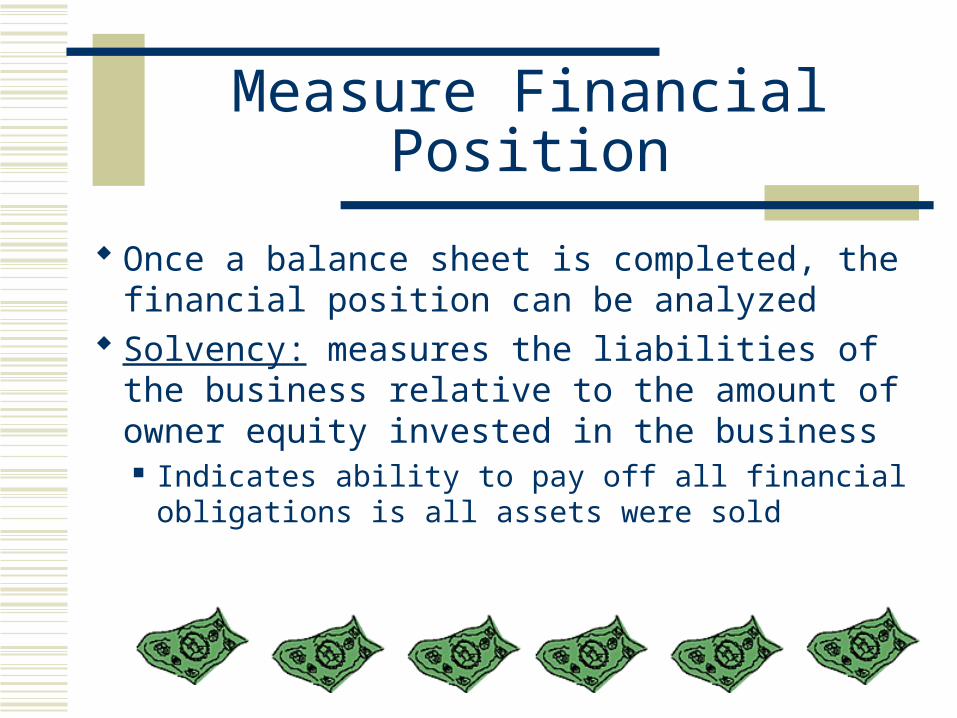
Once a balance sheet is completed, the financial position can be analyzed
Solvency: measures the liabilities of the business relative to the amount of owner equity invested in the business Indicates ability to pay off all financial
obligations is all assets were sold

Liquidity: measures the ability of the business to meet financial obligations as they come due without disrupting the normal operations of the business. Measures the ability to generate cash at the time
it is needed Short-run concept
Measure Financial Position

Balance Sheet Format
Assets LiabilitiesCurrent Assets xxx Current Liabilities xxxNoncurrent Assets xxx Noncurrent Liabilities xxx
Total Liabilities xxxOwner’s Equity xxxTotal Liabilities and
Total Assets xxx owner’s equity xxx
Assets
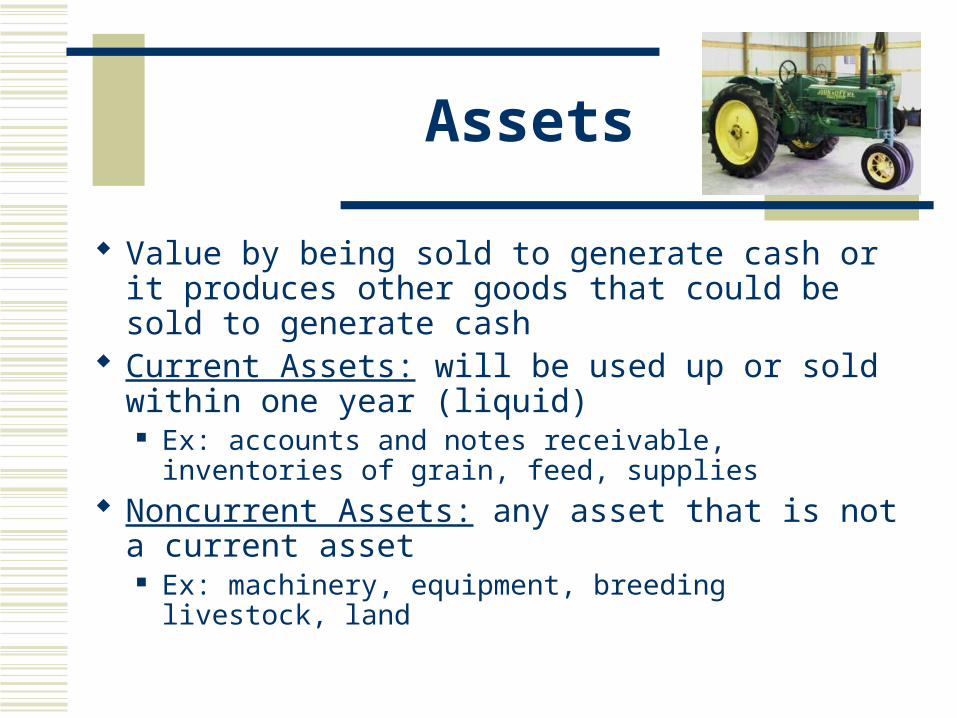
Value by being sold to generate cash or it produces other goods that could be sold to generate cash
Current Assets: will be used up or sold within one year (liquid) Ex: accounts and notes receivable, inventories of grain,
feed, supplies Noncurrent Assets: any asset that is not a current
asset Ex: machinery, equipment, breeding livestock, land
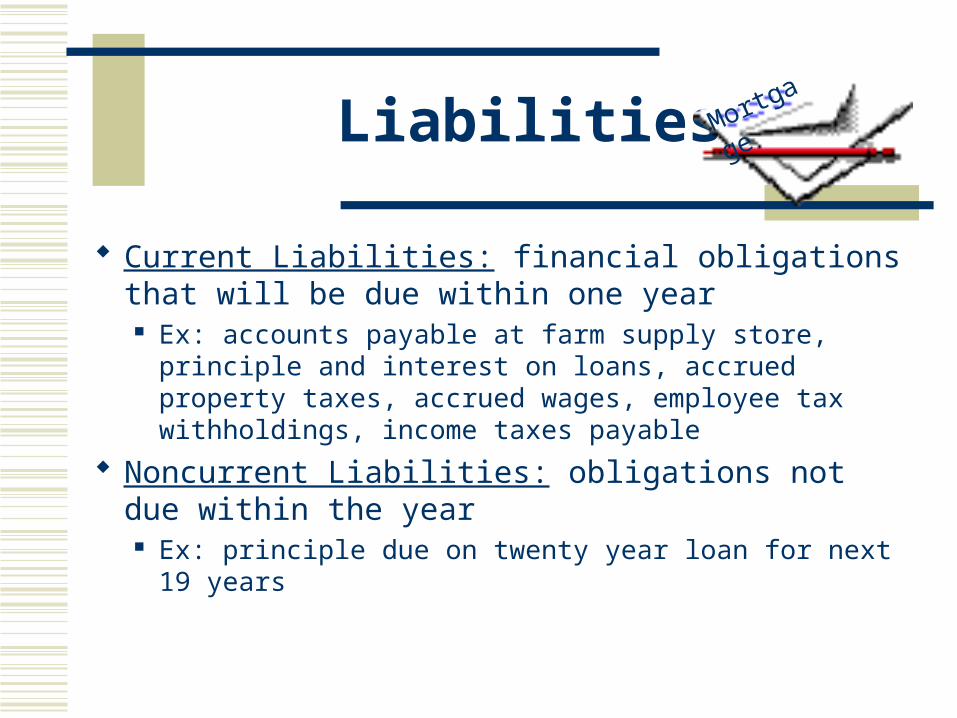
Liabilities
Current Liabilities: financial obligations that will be due within one year Ex: accounts payable at farm supply store, principle and
interest on loans, accrued property taxes, accrued wages, employee tax withholdings, income taxes payable
Noncurrent Liabilities: obligations not due within the year Ex: principle due on twenty year loan for next 19 years
Mortgage

Owner Equity
Owner Equity: amount of money left for the owner if all assets were sold and all liabilities paid off on the date of the balance sheet
Also called Net Worth
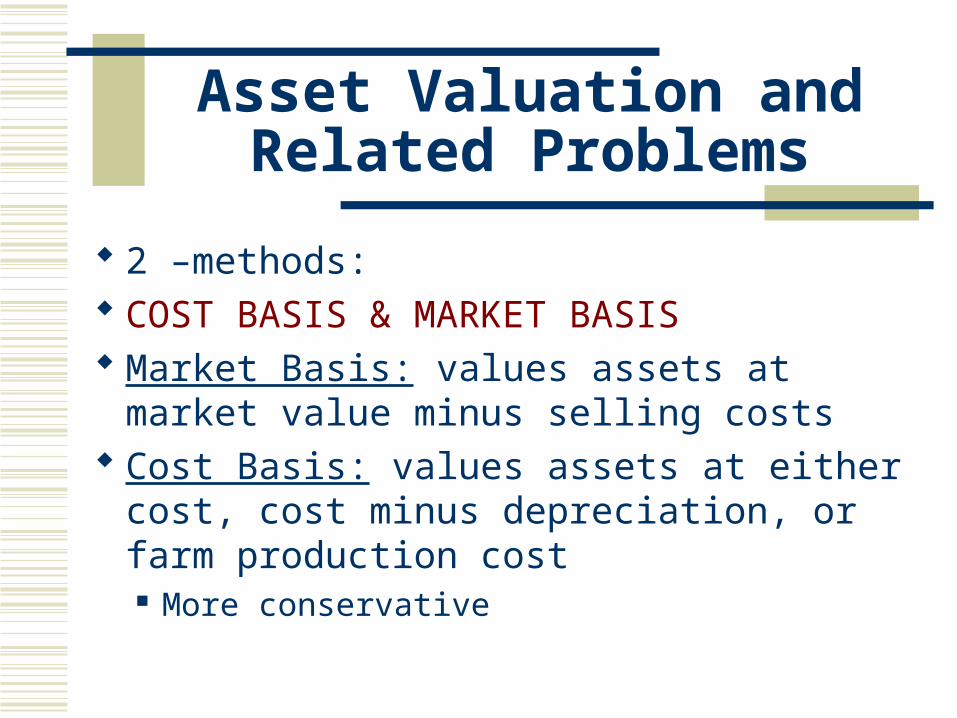
Asset Valuation and Related Problems
2 –methods: COST BASIS & MARKET BASIS Market Basis: values assets at market value
minus selling costs Cost Basis: values assets at either cost, cost
minus depreciation, or farm production cost More conservative
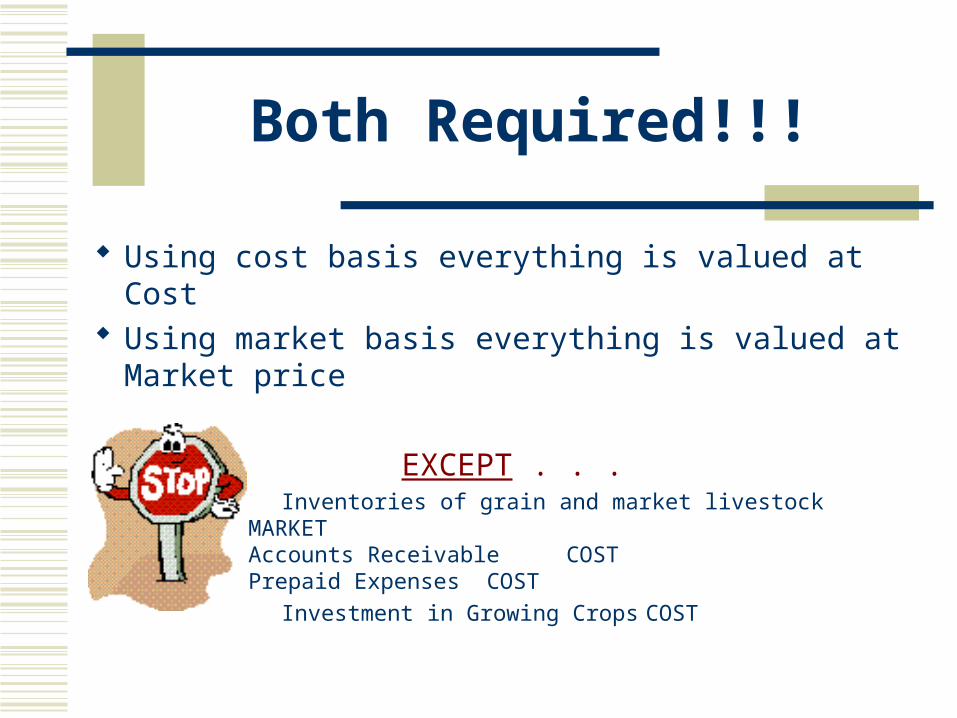
Both Required!!!
Using cost basis everything is valued at Cost Using market basis everything is valued at Market
price
EXCEPT . . . Inventories of grain and market livestock MARKET
Accounts Receivable COSTPrepaid Expenses COST
Investment in Growing Crops COST

Balance Sheet Example
Asset Section Inventory valued at market in both cases
Liability Section Income taxes payable (taxes due on taxable net farm
income for past year) Current Deferred income taxes (taxes that would be paid
on revenue from the sale of current assets minus any tax deductible expenses) – NO taxes payable at this time
Noncurrent Deferred income taxes (estimate of taxes that would result from liquidation of assets at market value)
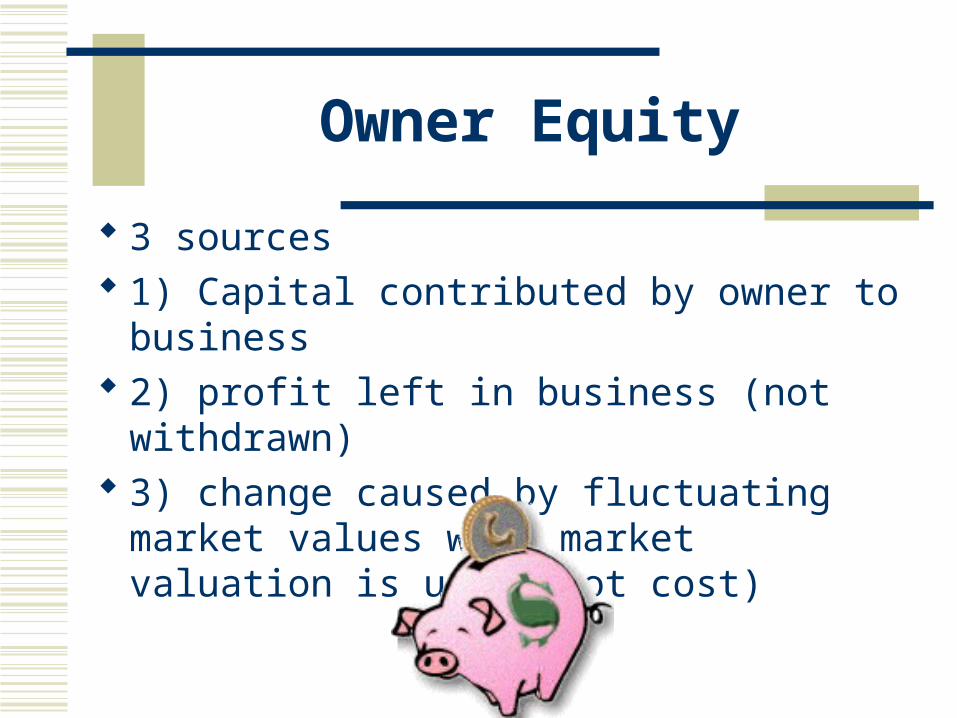
Owner Equity
3 sources 1) Capital contributed by owner to business 2) profit left in business (not withdrawn) 3) change caused by fluctuating market
values when market valuation is used (not cost)
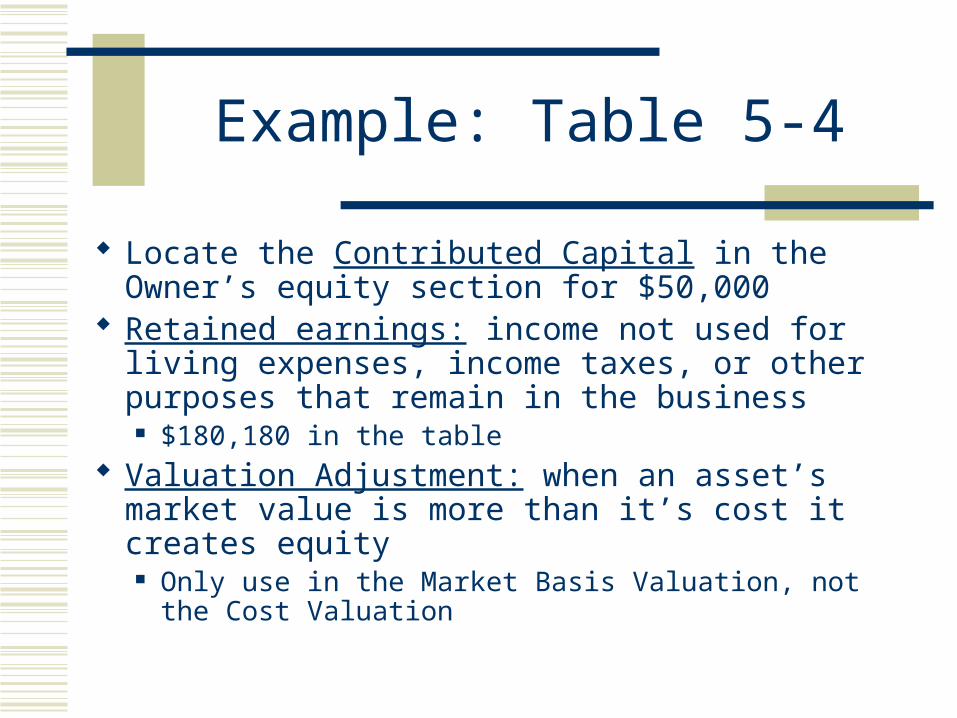
Example: Table 5-4
Locate the Contributed Capital in the Owner’s equity section for $50,000
Retained earnings: income not used for living expenses, income taxes, or other purposes that remain in the business $180,180 in the table
Valuation Adjustment: when an asset’s market value is more than it’s cost it creates equity Only use in the Market Basis Valuation, not the Cost
Valuation

Balance Sheet Analysis
Ratios: measure the relative strength or weakness of a business
Allows businesses of various sizes to be compared
Help make lending decisions
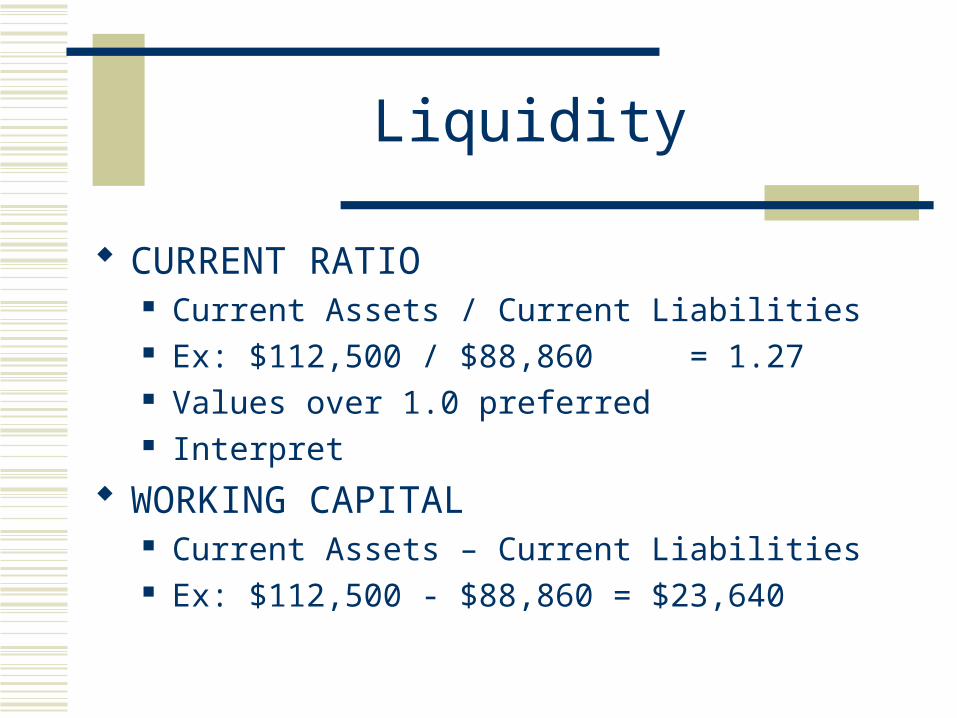
Liquidity
CURRENT RATIO Current Assets / Current Liabilities Ex: $112,500 / $88,860 = 1.27 Values over 1.0 preferred Interpret
WORKING CAPITAL Current Assets – Current Liabilities Ex: $112,500 - $88,860 = $23,640
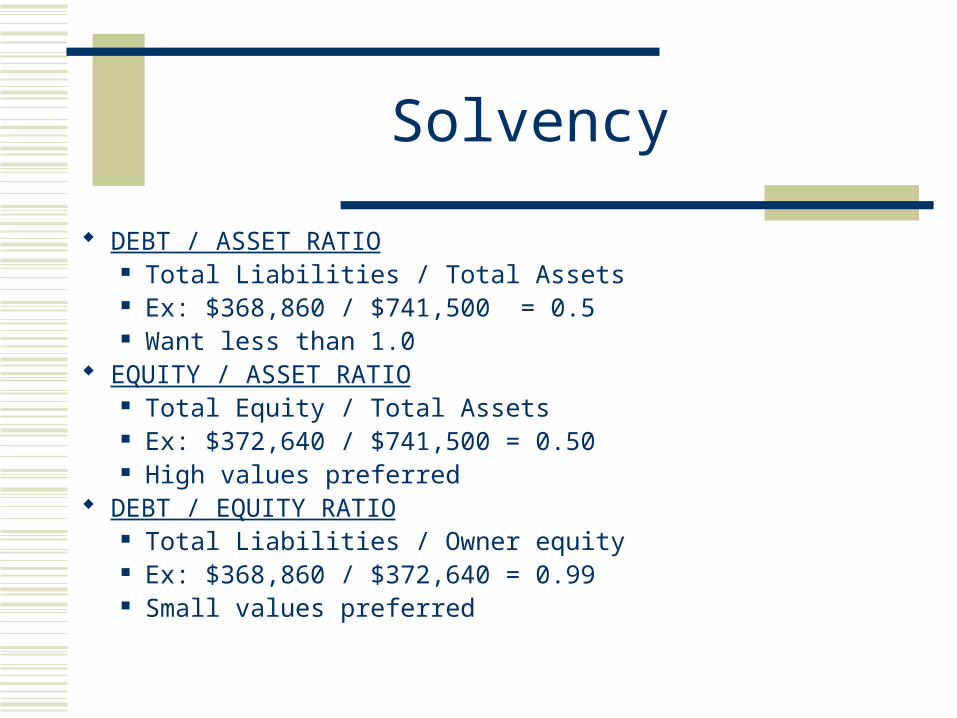
Solvency
DEBT / ASSET RATIO Total Liabilities / Total Assets Ex: $368,860 / $741,500 = 0.5 Want less than 1.0
EQUITY / ASSET RATIO Total Equity / Total Assets Ex: $372,640 / $741,500 = 0.50 High values preferred
DEBT / EQUITY RATIO Total Liabilities / Owner equity Ex: $368,860 / $372,640 = 0.99 Small values preferred
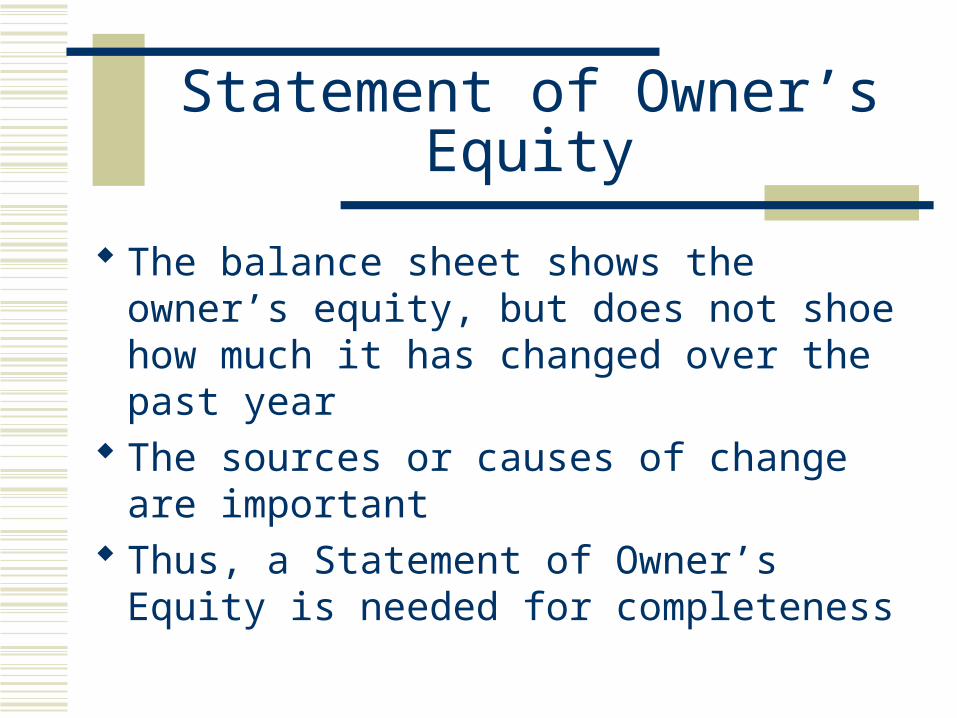
Statement of Owner’s Equity
The balance sheet shows the owner’s equity, but does not shoe how much it has changed over the past year
The sources or causes of change are important
Thus, a Statement of Owner’s Equity is needed for completeness
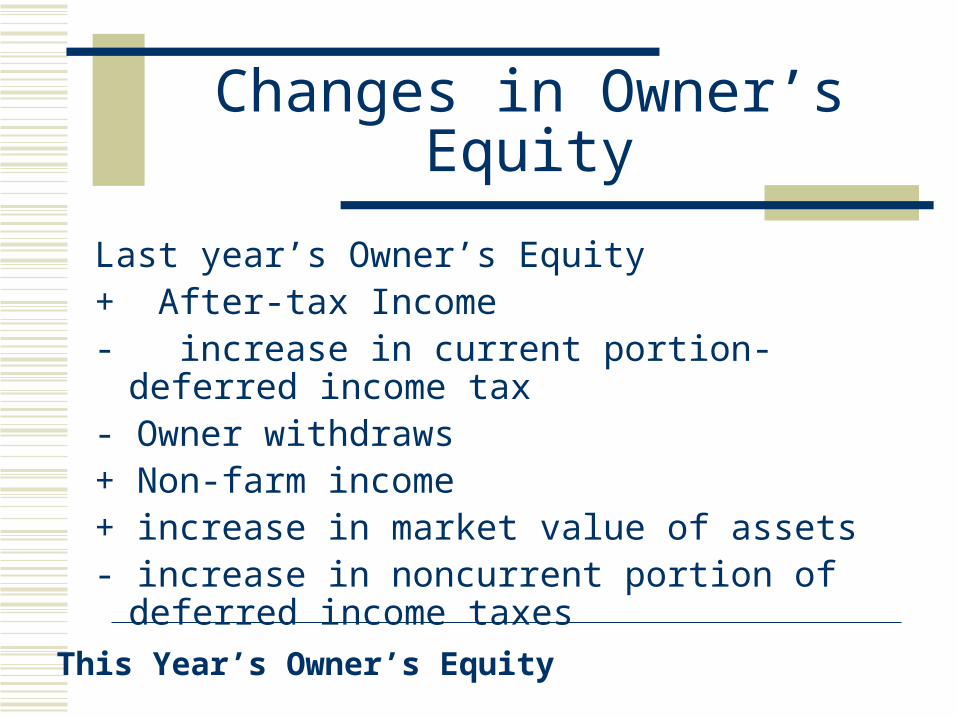
Changes in Owner’s Equity
Last year’s Owner’s Equity+ After-tax Income- increase in current portion-deferred income tax- Owner withdraws+ Non-farm income + increase in market value of assets- increase in noncurrent portion of deferred income
taxes
This Year’s Owner’s Equity