P06 P15 P20 COPPER ELECTROLESS DURABILIDADE DE PITTING ...
30
Transcript of P06 P15 P20 COPPER ELECTROLESS DURABILIDADE DE PITTING ...

COPPER ELECTROLESS PLATING IN PRESENCE OF COBALT IONS USING HYPOPHOSPHITE AS REDUCTANT
DURABILIDADE DE COLETORES SOLARES TÉRMICOS: INSPEÇÃO E ANÁLISE DE FALHA EM FUNÇÃO DA CORROSIVIDADE AMBIENTAL
PITTING CORROSION OF 304 STAINLESS STEEL IN AN ACTIVATED CARBON FILTER
J. I. Mar�ns, M. C. Nunes and P. B. Tavares
T. C. Diaman�no, M. J. Carvalho, A. Nunes e C. Ferreira
J. I. Mar�n and C. M. B. Mar�ns
P06 P15 P20
2016, JAN-JUN, VOL. 35, Nº1, 1-30 ISSN 2182 - 6587


DIRECTORATeresa Cunha Diamantino
DIRECTORA ADJUNTAIsabel Figueira Vasques
CONSELHO EDITORIALAlda Simões (IST)Ana Cabral (ISQ)Carla Ferreira (APT)Elisabete AlmeidaElsa Pereira (LNEC)Inês Fonseca (FCUL)Isabel Tissot (Archeofactu)João Salvador (IST)Jorge Correia (FCUL)José Gomes (Consultor)José Inácio Mar�ns (FEUP)José M. AnteloLeonor Côrte-Real (Hempel)Manuela Salta (LNEC)Maria João Carmezim (I.P.Setúbal)Victor Lobo (UC)Zita Lourenço (Zetacorr)
COMISSÃO CIENTÍFICACésar Sequeira (IST)Christopher Bre� (UC)Fernando Fragata (CEPEL, BR)Paula Rodrigues (LNEC)João Machado (CIN)José Luís Nogueira (ARCP)Manuel Morcillo (CENIM, ES)Mário Ferreira (UA)Zehbour Panossian (IPT, BR)
DESIGNLemos design . www.lemos.pt
EDITORLNEG - Laboratório Nacional de Energia e Geologia, I.P.LMR - Laboratório de Materiais e RevestimentosEstrada do Paço do Lumiar, nº 22, Edif. E, R/C1649-038 LisboaTel. + 351 21 092 46 51/[email protected]
DEPÓSITO LEGAL28088/89ISSN: 2182-6587
CAPA Fotografia do interior de uma tubagem de aço (1º lugar no concurso "Dia Mundial da Sensibilização para a Corrosão", 2016. Autor: Rute Fon�nha, LNEC)
P04COMENTÁRIOMachado LeiteLNEG
P06ARTIGO
COPPER ELECTROLESS PLATING IN PRESENCE OF COBALT IONS USING HYPOPHOSPHITE AS REDUCTANT.J. I. Mar�ns, M. C. Nunes and P. B. Tavares
P15ARTIGO
DURABILIDADE DE COLETORES SOLARES TÉRMICOS: INSPEÇÃO E ANÁLISE DE FALHA EM FUNÇÃO DA CORROSIVIDADE AMBIENTAL.T. C. Diaman�no, M. J. Carvalho, A. Nunes e C. Ferreira
P21ARTIGO
PITTING CORROSION OF 304 STAINLESS STEEL IN AN ACTIVATED CARBON FILTER.J. I. Mar�n and C. M. B. Mar�ns
P26NOVIDADES
P27REGULAMENTAÇÃO
P28
NOTÍCIAS BREVES
P29CALENDÁRIO DE EVENTOS
P30INSTRUÇÕES PARA OS AUTORES
FICHA TÉCNICA
SUMÁRIO
P03 CORROS. PROT. MATER., Vol. 35, Nº1 (2016)

Tarefa ingrata a de contribuir para o comentário ao presente número
da revista Corrosão e Protecção de Materiais, quando o autor tem pouca
proximidade ao estado da arte e não tem acompanhado a evolução das
tendências e perspe�vas futuras da tecnologia, como é o caso presente.
Agradeço o convite, mas devo declarar desde já que as minhas origens na
pura e "dura" tecnologia da mineração que, embora lidando com
materiais, situa-se no extremo oposto da fileira da transformação.
Foi precisamente esta tangência que me deu o mote do que poderia
trazer a este fórum de discussão - a explorabilidade dos recursos minerais
e a crescente necessidade da produção de bens.
O modelo de desenvolvimento económico em que temos vivido tem o
seu principal suporte no crescimento, baseado essencialmente no
aumento da riqueza derivada da produção de bens transacionáveis.
Quando as soluções que garantem o crescimento são tomadas em
contexto exclusivo de compe��vidade e sustentabilidade de cada
negócio de per si, frequentemente a decisão carece de uma raciona-
lidade inicial mais generalizada, que jamais será recuperada ao longo do
processo. Por exemplo, opta-se pela produção de bens menos duráveis
porque, simplesmente, potenciam o negócio a mais longo prazo, nunca
levando em linha de conta o desperdício de energia nem o consumo de
matérias-primas.
Aqui entronca, precisamente, a discussão do binómio da escassez ou
da abundância de recursos minerais. É sabido que a crusta terrestre é um
reservatório imenso de recursos minerais, no entanto desde muito cedo
o Homem percebeu que esses recursos, embora ocorram quase
ubiquamente, a generalidade das ocorrências não alberga quan�dade de
recurso suficiente para suportar a sua exploração industrial, isto é, a
massa de substância ú�l con�da em determinada porção da crusta, em
termos médios, não comporta valor económico suficiente para garan�r a
explorabilidade. Para projetar uma exploração industrial é necessário
que os elementos úteis em que estamos interessados ocorram numa
concentração de várias ordens de magnitude superior à média - 5 vezes
no caso do Fe, 250 vezes para o Cu e o Zn, 2000 vezes para o Sn e W e 5000
vezes para o Au! A classificação de uma determinada ocorrência como
Jazigo Mineral exige, pois, que a natureza dos processos geológicos nesse
local tenha conduzido a uma acumulação anómala dos elementos úteis. É
a par�r da exploração industrial dos Jazigos Minerais que o Homem
acede aos recursos primários geradores das matérias-primas que
suportam a a�vidade da indústria transformadora.
É compreensível que o valor limiar da acumulação de um elemento
numa determinada ocorrência mineral que suporta a sua classificação
como Jazigo dependa da evolução tecnológica e, naturalmente, da
valorização desse elemento no mercado (cotação). Ora é sabido que
durante o sec. XX, o desenvolvimento extraordinário da industrialização
da economia mundial foi acompanhado pela subida ver�ginosa do
consumo de recursos minerais, mas não se assis�u a uma correspon-
dente valorização das cotações como essa crescente procura permi�ria
antever, havendo estudos que, pelo contrário, apontam para uma ligeira
depreciação se forem descontados os efeitos dos períodos de grande
conturbação polí�ca, económica e social que ocorreram ao longo de todo
esse período.
Uma das razões que jus�fica esse fenómeno será, por certo, a
evolução tecnológica surpreendente dos processos e técnicas de
prospeção mineira, com par�cular destaque para os métodos de
prospeção geoquímica e geo�sica, nomeadamente os aero-
transportados, os novos processos de mineração suportados por intensa
mecanização e automação, que no caso das explorações a céu aberto
a�ngiu capacidades de produção extraordinárias, garan�das por
máquina de carga e transporte por vezes de dimensões gigantes e novas
soluções tecnológicas de processamento de minérios adaptadas ao
tratamento dessas enormes capacidades, como britadores giratórios,
moagem autogénea e moinhos de enorme diâmetro, pré-moagem em
rolos de alta pressão, células de flutuação de vários metros cúbicos de
volume, entre outras. Todas estas inovações se conjugaram no sen�do de
viabilizar a exploração de jazigos mais pobres, mas de (muito) grandes
dimensões, que compensam o baixo teor com o volume de recurso, de
modo a se a�ngir o nível de riqueza explorável necessária para viabilizar a
economicidade do inves�mento em capital intensivo. Crescentemente
também se tem vindo a assis�r à evolução tecnológica no domínio da
reciclagem e da reu�lização, nuns casos melhor sucedida do que em
outros, na qual se depositam esperanças crescentes como forma de
diminuir o consumo de recursos primários.
COMENTÁRIO DE ABERTURA
Mário RuiMachado Leite
Vogal do Conselho Direc�vo do LNEG
P04 CORROS. PROT. MATER., Vol. 35, Nº1 (2016), 4-5

A consequência mais evidente desta evolução tecnológica na
indústria mineira Portuguesa concre�zou-se no encerramento no fim da
década de 1980 de grande parte da indústria mineira metálica tradicional
que explorava jazigos de pequena dimensão, porventura mais ricos e, na
grande maioria dos casos, aflorantes à super�cie, tendo apenas resis�do
as minas da Panasqueira (W), as de Neves Corvo (Cu, Zn, Sn) e a de
Aljustrel (Cu, Zn), que man�veram ou recuperaram a a�vidade. Face ao
raciocínio que temos vindo a desenvolver, é sintomá�co que a maior
dimensão de cada um desses três jazigos os permita classificar como de
"world class", podendo concluir-se que terá sido essa dimensão elevada
que jus�ficou os avultados inves�mentos neles realizados e que
garan�ram a con�nuidade económica do projeto.
Ora, esta será, porventura, a raiz maior do dilema vivido pela
economia europeia no que às matérias-primas minerais diz respeito:
esgotados os jazigos minerais mais ricos albergados em território
europeu e exis�ndo dire�vas comunitárias e vária legislação nacional de
cada país que introduz custos elevados de contexto ambiental, a indústria
transformadora europeia passou a ser tendencialmente abastecida por
produções originárias de outros con�nentes a par�r de jazigos de
grandes dimensões cuja exploração beneficia de economias de escala
muito significa�vas e menores custos de contexto. Todavia esse
abastecimento não está isento de riscos, o que levou a CE a desenvolver
em 2008-9 uma profunda reflexão que ficou exarada em dois
importantes documentos: Inicia�va Matérias-Primas e Matérias-Primas
Crí�cas para a EU, nos quais muitos leram que iria chegar uma onda de
oportunidades e inves�mento para a indústria extra�va europeia.
Entretanto passaram mais de seis anos sobre o lançamento dessas
missivas da CE e tarda o aparecimento de novos projetos mineiros em
Portugal, pese embora o significa�vo inves�mento privado realizado em
prospeção e pesquisa. Mesmo os melhores indícios porventura já ob�dos
não foram ainda suficientes para sustentar o arranque de uma nova
mina, não sendo alheia a este facto a indisponibilidade financeira da
economia Portuguesa e a crónica inexperiência e incapacidade da banca
nacional para lidar com o projeto mineiro.
O LNEG, consciente da importância de definir e prosseguir obje�vos
estratégicos de polí�ca mineira, tem vindo a alertar os sucessivos
Governos para a necessidade de inserir inves�mento público nas GOP
para acolher projetos ins�tucionais de prospeção regional que visem
novos alvos mineiros ocultos, localizados a maiores profundidades,
procurando-os em zonas geológicas em que predominam espessuras
consideráveis de metassedimentos e onde no passado foi revelada a
existência de importantes reservas mineiras, de que se destacam as
séries da Faixa Piritosa Ibéria e dos Xistos das Beiras.
O Governo reagiu posi�vamente a este desiderato e prepara de
momento um programa de inves�mento para atualização de toda a
cartografia geológica e de recursos, o qual inclui realização de campanhas
de geoquímica e de geo�sica nas regiões indicadas: na Faixa Piritosa
Ibérica, cinturão metalífero de metais base (Cu, Zn, Pb), no qual o Estado,
através do Serviço Geológico, fez inves�mentos no passado que levaram
a vários sucessos (Neves Corvo e Lagoa Salgada) e onde o LNEG mantém
ligações a desenvolvimentos que decorrem atualmente sob a alçada de
empresas, aportando conhecimento especializado, sendo sabido que
mergulho desse horizonte geológico em profundidade para ocidente é
propício a uma maior probabilidade para novas descobertas em
profundidade no lado Português dessa faixa mineira; nos Xistos das
Beiras onde existem espessuras de sedimentos existe potencial para
albergar jazigos ocultos de dimensão considerável, como é o caso da
Mina da Panasqueira, cuja prospeção, se bem que orientada por critérios
geológicos, tem necessariamente de ser efetuada por métodos indiretos.
A Economia Portuguesa, no atual processo de recuperação, não deve
prescindir do aproveitamento das vantagens compara�vas de que
dispõe. Não restam dúvidas de que os recursos minerais são uma fonte
de riqueza primária que deve ser valorizada racionalmente em cada
momento da história económica da sociedade. Compete às Revistas a
divulgação da inves�gação cien�fica e tecnológica ins�tucional, como é
exemplo a Revista de Corrosão e Protecção de Materiais do LNEG,
desempenhando um papel muito importante na inovação e, sobretudo,
na assessoria tecnológica às empresas.
P05 CORROS. PROT. MATER., Vol. 35, Nº1 (2016), 4-5

COPPER ELECTROLESS PLATING IN PRESENCE OF COBALT IONS USING HYPOPHOSPHITE AS REDUCTANT
1,2,* 1 3J. I. Martins , M. C. Nunes and P. B. Tavares
¹ Universidade do Porto, Faculdade de Engenharia, Departamento de Engenharia Química, Rua Roberto Frias, 4200-465 Porto, Portugal.² Lab2PT, Ins�tuto de Ciências Sociais, Universidade do Minho, Campus do Gualtar, 4710-057 Braga, Portugal, [email protected]³ Centro de Química - Vila Real, ECVA, Universidade de Trás-os-Montes e Alto Douro, 5001-801 Vila Real, Portugal, [email protected]
*A quem a correspondência deve ser dirigida, [email protected]
ABSTRACTThe electroless copper plating using sodium hypophosphite as the reductant and sodium citrate as the chelating agent was studied by gravimetric and electrochemical measurements. The effects of temperature, pH, boric acid, citrate, hypophosphite, and cobalt catalyst concentration were evaluated.The kinetics of the electroless copper deposition was interpreted on the basis of the dehydrogenation of the reductant, mixed potential theory, and in the ionic speciation of the bath.Scanning electron microscopy, X-ray microanalysis by energy dispersive spectroscopy and X-ray diffraction applied on surfaces show that the deposits are composed by binary (Cu-Co) and ternary alloys (Cu-Co-P), and that their morphology and crystallinity depends on cobalt and phosphorus content.
Keywords: Electroless, Copper Pla�ng, Sodium Hypophosphite, Ionic Specia�on, Copper-Cobalt Alloys
DEPOSIÇÃO DE COBRE NÃO ELECTROLÍTICO NA PRESENÇA DE IÕES DE COBALTO UTILIZANDO O HIPOFOSFITO COMO REDUTOR
RESUMOO revestimento de cobre não electrolítico usando hipofosfito de sódio como redutor e o citrato de sódio como agente complexan-te foi estudado através de medições gravimétricas e electroquí-micas. Avaliaram-se os efeitos da temperatura, pH, ácido bórico, citrato, hipofosfito e concentração do catalisador de cobalto.A cinética de deposição de cobre não electrolítico foi interpre-tada na base da desidrogenação do redutor, teoria do potencial misto e na especiação iónica do banho.A microscopia electrónica de varrimento, microanálise de raios X por espectroscopia de dispersão de energia e a difracção de raios-X aplicada nas superfícies mostram que os depósitos são constituídos por ligas binárias (Cu-Co) e ternárias (Cu-Co-P), e que a sua morfologia e cristalinidade depende do teor de cobalto e fósforo.
Palavras-chave: Reves�mento não Electrolí�co, Deposição de Cobre, Hipofosfito de Sódio, Especiação Iónica, Ligas de Cobre-cobalto
P06 CORROS. PROT. MATER., Vol. 35, Nº1 (2016), 6-14
http://dx.medra.org/10.19228/j.cpm.2016.35.03

cathodic and anodic areas impose opposite signal overpotentials
(h). In the absence of an ohmic drop in steady state, the surface is
practically equipotential, i.e., works under the mixed potential (E ).MP
Anodic overpotential: = E – E (3) R MP R
Cathodic overpotential: �� = E – E (4)M MP M
According to the Wagner-Traud postulate [25], the plating rate
i is given by,p
(5)
where i and i are the anodic and cathodic partial currents of the Rj Mj
reactions in plating system.
The cathodic and anodic phenomena, in the absence of
convection, will be interpreted as exclusively being controlled by
diffusion or activation.
In diffusional control the current is independent of potential
and takes the form [26]:
(6)
where D is the diffusion coefficient, the diffusion layer thickness,
A the area of the sample, n the number of electrons, F the Faraday b sconstant, and C and C the concentrations of the electroactive
species, respectively, in the bulk solution and on the surface.
If the concentration of the electroactive species on the metal
interface is null, the expression (6) takes the form of so-called
limiting current:
(7)
When the electrochemical phenomena are controlled by
activation under strong field, the current is related exponentially to
the overpotential by Tafel equation:
(8)
owhere i and � are the Tafel parameters.
The mixed potential on the solid surface therefore depends on
the type of control established in the system. Thus, in a system
where cathodic and anodic reactions are under diffusion and
activation control, respectively, the surface potential is:
(9)
In the case in which the cathodic reaction is controlled by
activation and anodic reaction by diffusion, the surface potential is
then:
(10)
The goal of this work is to study the kinetics, morphology and
crystallinity of copper-cobalt alloys from electroless process with
hypophosphite as reductant.
2. EXPERIMENTAL
2.1. Chemicals and solutions
The standard bath solution consists of 0.024 M copper sulphate .(CuSO .5H O), 0.27 M sodium hypophosphite (NaH PO H O), 0.052 M 4 2 2 2 2
1. INTRODUCTION
Copper electroless plating has been an important field in
industry to produce articles for decorative and functional purposes,
such as dielectrics [1], printed circuit boards [2], insulating
substrates [3, 4] and patterns of complex geometry [5].
Autocatalytic metal plating on polymer substrates is particularly
interesting on flexible and transparent device applications. The
physicochemical properties of autocatalytic deposits of copper and
nickel are closely dependent on the composition of the baths and
respective operating conditions [6, 7]. Hence, the interest of
researchers about the kinetic phenomena involved at the
metal/solution interface in electroless plating systems [8-10].
Common electroless copper baths use i) formaldehyde [11], as
the reducing (ii) sodium potassium tartrate (called as "Rochelle
salt"), sodium malate, sodium citrate, triethanolamine (TEA),
ethylenediamine (En), or ethylenediamine tetraacetic acid (EDTA),
as complexing agents, (iii) boric acid, or succinic acid as a buffer, (iv)
sulfur-containing compounds (sulfite, thiosulfates, sulfates),
nitrogen-containing compounds (tetracyanoethylene, cyanides,
pyridines, 2,2'-pyridil), or sulfur- and nitrogen-containing com-
pounds (cysteines, cystines, diethylditiocarbamates, thiosemicar-
bazide, thiourea) as stabilizers, and (V) cyanide or proprionitrile, as
additives for accelerating the reaction.
Formaldehyde baths produces high quality copper with
excellent electrical and mechanical properties at low-cost and
widely available. However, formaldehyde has been listed recently
as a hazardous material. Therefore, many researchers have sought
other electroless copper solutions using nonformaldehyde
reducing agents such as sodium hypophosphite [12, 13],
dimethylamine borane (DMBA) [14, 15], hydrazine [16], glyoxylic
acid [17], Co(II) [18], Fe(II) [19], sodium bisulphite and sodium
thiosulfate [20]. Among them, the coating process based on
hypophosphite has been the subject of enough research because of
its safety, low price, good bath stability, and relatively easy to
control plating conditions. However, the hypophosphite-based
electroless copper plating process is difficult since copper does not
catalyze the oxidation of hypophosphite. One approach to perform
the oxidation of the reducing agent is to add cobalt [21] or nickel
[22] ions to the bath, since cobalt and nickel catalyze the oxidation
of hypophosphite.
The use of complexing agents in the baths aims to control the
effective availability of copper ion in the desired cathodic reaction.
The stability of the bath, grain size and the composition of the binary
Cu-Co or ternary Cu-Co-P alloys depend on the ionic speciation of
the solution, i.e., the resulting complexes of copper ion and the
ligand. The coordination numbers of copper complexes are six or
four, and their geometric forms are octahedral and tetrahedral or
square planar, respectively. However, on the structural
perspective, it is difficult to distinguish between these three
structures [23, 24].
A chemical displacement process requires that the solid side of
the interface is not equipotential. Thus, there may be the
occurrence of a redox couple associated with the oxidation of a
reductant (R) on the anodic areas and the reduction of metallic ions n+(M ) on the cathodic areas.
n+Anodic reaction: R → R + ne, (1) n+Cathodic reaction: M + ne → M (2)
After soaking the solid surface in the electroless bath closes the
electrochemical circuit, and the phenomena of polarization in the
P07 CORROS. PROT. MATER., Vol. 35, Nº1 (2016), 6-14 J. I. Martins et al.

.sodium citrate (Na C H O 2H O), 0.50 M boric acid (H BO ), and 3 6 5 7 2 3 3
.0.004 M cobalt sulphate (CoSO 6H O), pH was adjusted to 10.0 with 4 2-
sodium hydroxide or sulphuric acid, and temperature 65 ºC. All
chemicals were reagent grade, and deionized water was used to
prepare the solutions.
2.2. Plating procedure
A volume of 80 mL plating bath was placed in a four-neck Pyrex
Quickfit vessel 120 mL capacity with a heating jacket. The
temperature was controlled with accuracy ± 0.5 °C, and a spiral
condenser was placed to maintain the atmospheric pressure and
eliminate the water losses. The volume of the bath was considered
to be enough to guarantee a system in steady state during 30
minutes of deposition. The alkalinity of the solutions was evaluated
with accuracy ± 0.02 pH units using a Cryson 2002 apparatus. 3Aluminium (99 %) sheets (1.5 x 1.0 x 0.3 cm ) placed in a glass
support were used as a substrate for deposits of Cu-Co alloys. The
samples prior to be suspended into the plating solution were pre-
treated according to the following operative sequence: clean-up
with acetone; -1 -1alkaline degreasing (30 g L Na CO , 8 g L Na SiO , 2 3 2 3
T = 80 ºC, t = 2-4 min); acid pickling (HNO 50 % v/v, T = 40 ºC, t = 2 3
min); and washing with deionized water.
Metal deposition rate was determined by weight change of
initial aluminium boards to the end plating process, after
appropriate rinsing, immersion in ketone, and drying. The
aluminum content in the end of the tests was determined by atomic
absorption spectroscopy (AAS) using a Perkin Elmer Model 5100PC
for possible correction of these measures.
2.3. Electrochemical procedures
The electrochemical experiments were performed in one-
compartment cell with three electrodes connected to Autolab
model PGSTAT20 potentiost/galvanostat with pilot integration
controlled by GPES 4.4 software. The working electrode rod (1 cm
diameter) was aluminium, copper or cobalt 99 %. The electrodes
were mechanically polished with abrasive paper (1200-grade) and
rinsed with water before each electrochemical experiment.
Platinum was used as auxiliary electrode, and potentials were
measured versus an Ag/AgCl (1.0 M KCl) or SCE reference
electrode.
2.4. Microscopy, spectroscopy and X-ray diffraction analysis
The scanning electron microscopy (SEM) images and the
analysis by energy dispersive X-ray spectroscopy (EDS) were made
with a FEI Quanta 400FEG, fitted with an EDAX Genesis X4M micro
analysis probe, in CEMUP.
The X-ray diffraction patterns were acquired on ABS samples 2+ 2+ 2+with copper deposits obtained at different [Co ] / [(Co + Cu )] total total
mole ratio in the solutions, and also at different temperatures for
the standard bath composition.
ABS (polybutadiene block grafted by styrene acrylonitrile
copolymer) samples were subjected to a pretreatment before the
metallization process, according to the following procedure: 1) -1 -1degreasing in alkaline solution - 20 g L Na CO + 10 g L sodium 2 3
-1 -1gluconate + 30 g L Na PO + 1.5 g L sodium dodecyl (ester) sulfate, 3 4
at 65 ºC with stirring for 10 min; 2) washing in water at 65 °C with
stirring for 5 min; 3) etching with chromic solution to provide -1
hydrophilic and micro-roughened surface - 375-425 g L H CrO + 2 4
-1180-220 ml L H SO (98 %), at 65-70 °C with stirring for 12-15 min; 2 4
4) washing with water at 25 °C with stirring for 6 min; 5) conversion -1of Cr (VI) to Cr (III) in 30 g L NaHSO solution, at 25°C with stirring 3
for 2-3 min; 6) washing in water at 25º C with stirring for 4 min; 7)
pre-activation in HCl (30 %) solution with stirring at 25 °C for 4 min; -1 -18) sensitization in 10 g L SnCl + 60 ml L HCl (37 %), at 30-32 ºC 2
with moderate stirring for 5 min; 9) washing with water at 25 ºC with
moderate stirring for 1-2 min; 10) activation to produce catalytic
sites that will enable chemical deposition of nickel or copper in -1 -10.5 g L PdCl + 20 mL L HCl (37 %) at 40 ºC for 5 min; 11) washing 2
with water at 25 ºC with moderate agitation for 4 min; 12) post -1activation or acceleration in a 50 g L H SO (98 %) at 25 °C with 2 4
moderate stirring for 2-4 min; 13) washing in water at 25 ºC with
moderate stirring for 4 min.
The X-ray diffraction (XRD) spectra was carried out in a
PANalytical X'Pert Pro MPD equipped with a X'Celerator detector
and secondary monochromator (Cu K� = 0.154 nm, 40 kV, 30 mA;
data recorded with 0.017 step size, 100 s/step). The species
identification was performed trough the HighScore Plus software
with the ICDD database. Rietveld refinement with PowderCell
software (CCP14, Federal Institute for Materials Research and
Testing) was used to calculate lattice parameters and crystallite
size from the XRD diffraction patterns.
The content of copper, cobalt and phosphorus inside the deposit
was determined directly on the coating by SEM/EDS, and also by AA
after dissolving the same in nitric acid solution.
3. CHEMICAL MODEL TO COPPER PLATING SYSTEM
The chemical model [22] proposed for the determination of the
composition of the copper plating solutions, twenty five species,
includes nineteen correlations, equations (11) to (29) listed in Table
1, and the following material and charge balances:
Citrate: C = X + X + X + X + X + X + X + X 1 1 5 6 7 12 13 14 15 (30)
Boric acid: C = X + X + X + X (31)2 8 9 10 11
Hypophosphite: C = X + X (32)3 24 25
Copper: C = X + X + X + X + X + X + X (33)4 3 12 14 20 21 22 23
Cobalt: C = X + X + X + X + X + X (34)5 4 13 15 17 18 19
Charge balance: 3C + C + X + 2X + 2 X + X + X = 3X +2X + 1 3 2 3 4 17 20 1 5
X6 + 3X + 2X + X + X + X + X + X + 2X + X + 2C + 2C (35)8 9 10 14 15 16 19 23 22 4 5
When adjusting the pH with NaOH, the concentration of sodium
ion is taken into account in equation (35).
The activity coefficients of the ionic species necessary for to
know the factors G, Table 1, were calculated from the modified i
Debye-Hückel equation utilizing the modifications proposed by
Robinson and Guggenheim and Bates [27]:
(36)
where z is the charge of the ion, and I the ionic strength calculated i
by the following equation:
(37)
P08 CORROS. PROT. MATER., Vol. 35, Nº1 (2016), 6-14 J. I. Martins et al.

Table 1 - Chemical equilibrium in copper plating solutions.
The numerical solution of the equations proposed for the
chemical model has been obtained by the Newton-Raphson method
[31]. In this model the cobalt and copper are distributed among
ionic free form, citrate complexes and hydroxide complexes.
Assuming that at the solution/metal interface the cathodic reaction
related to metal deposition is a function of the respective positive 2+ + 2+ +ionic species in the bath, [Cu ], [CuOH ], [Co ] and [CoOH ], we will
considerer the sum of all these concentrations to interpret the
kinetics data.
(38)
����������� (39)
4. RESULTS AND DISCUSSION
4.1. Morphology and crystallinity
The morphology varies significantly with operating conditions, 2+ 2+ 2+particularly with the [Co ] / [(Co + Cu )] mole ratio in the total total
solutions, i.e., the metallic ratio of catalyst (MRC). Fig. 1(a) and 1(b)
for MRC = 0.111 (Co1) shows a uniform cubic crystalline structure,
as well as for MRC equal to 0.238 (Co2) with a grain size between
0.4 �m and 1 �m. Increasing MRC to 0.500 (Co3) and 0.750 (Co4) the
structure changes completely and appears a uniform globular
structure (Fig. 1(c)), such as a cauliflower-like of particles with an
average size of 10-30 nm (Fig. 1(d) and 1(e)) to form larger clusters
of about 0.7-1.0 �m, Fig. 1(f)), which seems a loss in the crystallinity.
Samples Co1, Co2, Co3 and Co4 showed phosphorus weight
percentage, respectively, 0.32, 0.43, 1.37 and 2.23 % and the cobalt
content 4.42, 5.93. 12.11 and 17.66 %. The deposits with the highest
phosphorus (Fig.1(d) and 1(e)) content display some holes related
to hydrogen evolution.
Fig. 1 – SEM micrographs of copper deposits from standard solution with the
following alterations: a), b) [CoSO ] = 0.005 M and [CuSO ] = 0.040 M, MRC = 0.111; c), 4 4
d) [CoSO ] = 0.020 M and [CuSO ] = 0.020 M, MRC = 0.500; e), f) [CoSO ] = 0.030 M and 4 4 4
[CuSO ] = 0.010 M, MRC = 0.750.4
The XRD patterns of the copper films obtained for different MRC
in the bath, Fig. 2, show peaks at 2� = 29.8° (110), 36.6° (111), 42.3°
(200), 61.4 (220), and 73.5° (311), which according to the standard
powder diffraction card of JCPDS [32] have been attributed to
cuprous oxide (lattice parameter � =4.288±0.001Å), and at 2���= 43.5°
(111), 50.6° (200), 74.2º (220), 90.0° (311) and 95.3° (222) attributed
to copper (lattice parameter �=3.621±0.001Å). The characteristic
reflections of the hexagonal cobalt structure could not be found.
The magnification of the copper peak (111), Fig. 3, presents a
deviation of its position from the Co1 sample to the Co4 sample with
a slight increase in the lattice parameter (3.620 to 3.622 Å). The
crystallite sizes, determined by the Williamson-Hall plot, are in the
range of 25±5 nm for samples Co1 and Co2, 14±3 nm for sample Co3
and 10±2 nm for sample Co4. According to constitutional phase
diagram [33] copper-cobalt alloys constitute mixtures of virtually
pure components, but the mutual solubility of the components in
solid state is only 1 % w/w. We consider that the cobalt substitutes
the copper in the face-centered cubic lattice, thus pointing
substitutional solid solutions, as has been already claimed by
Povetkin and Devyatkova [34]. The broad peak at around 20 deg is
P09
(a) (b)
(c)
(d)
(e) (f)
CORROS. PROT. MATER., Vol. 35, Nº1 (2016), 6-14 J. I. Martins et al.
Reaction Notation Equilibrium Constant
equation (11)
equation (12)
equation (13)
equation (14)
equation (15)
equation (16)
equation (17)
equation (18)
equation (19)
equation (20)
equation (21)
equation (22)
equation (23)
equation (24)
equation (25)
equation (26)
equation (27)
equation (28)
equation (29)
K = G X X /X1 1 1 2 5
K = G X X /X2 2 5 2 6
K = G X X /X3 3 6 2 7
K = G X X /X4 4 24 2 25
K = G X X /X5 5 8 2 9
K = G X X /X6 6 9 2 10
K = G X X /X7 7 10 2 11
K = G X /X X8 8 12 3 5
K = G X /X X9 9 14 1 3
K = G X /X X10 10 13 4 5
K = G X /X X11 11 15 1 4
K = G X X12 12 2 16
K = G X /X X13 13 20 3 16
K = G X /X X14 14 21 16 20
K = G X /X X15 15 22 16 21
K = G X /X X16 16 23 16 22
K = G X /X X17 17 17 4 16
K = G X /X X18 18 18 16 17
K = G X /X X19 19 19 16 18
pK = 6.40 [27]1
pK = 4.76 [27]2
pK = 3.13 [27]3
pK = 1.10 [27]4
pK = 13.80 [27]5
pK = 12.74 [27]6
pK = 9.24 [27]7
logK = 9.80 [28]8
log K = 5.90 [28]9
logK = 10.44 [29]10
logK = 6.19 [29]11
pK = 14.00 [27] 12
logK = 7.00 [27]13
logK = 6.68 [27]14
logK = 3.32 [27]15
log K = 1.50 [27]16
logK = 4.30 [30]17
logK = 4.10 [30]14
logK = 1.30 [30]19
Symbols: X = molar fraction of species i; G = factor relating the activity coefficient of the ionic species.i i

Fig. 4 – SEM micrograph of the cross section of copper film deposited in the ABS for
the sample Co3.
4.2. Effect of electroless plating time
The thermodynamic and kinetic feasibility of the electroless
process requires the adsorption of hypophosphite on the substrate
surface and the breaking of P-H bond, in order to promote its
oxidation. The materials able to do this interaction are the so-called
catalytic materials, such as nickel, cobalt, gold, and palladium [37].
In the case of aluminum substrate, the cobalt deposition is initiated
by galvanic displacement giving rise to the catalytic surface on
which, thereafter, the Cu-Co electroless deposit develops. It is
obvious that in this early stage of the process there is also a
chemical shift of copper.
The tests with the standard composition of the bath shows that
the thickness of the deposits increases linearly with time over 60
minutes. This means that the solution composition is not
significantly affected during this time interval, i.e., there is no
interference of composition on the phenomena of charge transfer
at the solution-metal interface for anodic and cathodic areas. The
average cobalt content in deposits is around 4.5 % and the
phosphorus 0.2-0.3 % for time interval between 20 and 60 minutes.
Therefore, all the trials have been performed during 30 minutes.
4.3. Effect of cobalt catalyst
Figure 5 shows the effect of formal concentration of catalyst on
the deposition rate and coating composition. There is an increase in
overall rate with increasing cobalt content in deposit while the
phosphorus remains practically constant. The �� profile increases Co
with the catalyst concentration which justifies the increase in
percentage of cobalt in the deposit, and therefore of the catalytic
centers responsible for the oxidation of hypophosphite. The
dependence of the reaction rate with the proportion of cobalt is less -1pronounced from 0.003 mol L , which is associated with the alloy
composition. It is concluded that the reaction is controlled
electrochemically. In terms of mechanism and designating the
active centers by (Cu-Co), the controlling step of hypophosphite
oxidation passes by dehydrogenation on the surface with the
formation of a radical [9, 38],
(40)
���������������������� (41)
related to ABS substratum [35]. The difference in the intensity of
the peaks is related to the thickness of the copper plating. The
observation of the section of the sample Co3 cracked after being
immersed in liquid nitrogen, shows a thickness of the order of 3
microns, Fig. 4. This finding confirms the intensity of the peaks
observed in samples Co1 and Co2 to 2 20º given the EDS depth of
field. The detected cuprous oxide particularly on samples Co1 and
Co2 comes from their surface oxidation [36] occurred in the time
interval that has elapsed between their acquisition and analysis by
X-ray diffraction. The X-ray diffraction results show that the Cu-Co-
P alloys retain their crystallinity for phosphorus until at least 2%
(MRC = 0.75). In the case of Cu-Ni-P alloys for MRC = 0.75 the
phosphorus content is about 3 times higher, and these alloys
become amorphous for phosphorus content higher than 8.7 % [22].
Fig. 2 – XRD patterns of the Cu-Co-P alloys for different ratios between [CoSO ] and 4
([CuSO ] + [CoSO ]), MRC: a) Co1, MRC = 0.111; b) Co2, MRC = 0.238; c) Co3, MRC 4 4
=0.500; Co4, MRC = 0.750.
Fig. 3 – Magnification of the (111) copper peak showing the deviation of the peak
position in sample Co1 to higher d space value (lower 2q), possible due to the
formation of a solid solution with cobalt.
P10 CORROS. PROT. MATER., Vol. 35, Nº1 (2016), 6-14 J. I. Martins et al.

converted immediately into phosphite according to the reaction:
(42)
(43)
In line with Gutzeit [39] the hypophosphite dehydrogenation
passes through the formation of metaphosphite anion,
(44)
followed by the formation of phosphite according to:
(45)
The atomic hydrogen may be recombined in molecular
hydrogen or be oxidized to water.
(46)
(47)
(48)
The cathodic reaction will be:
(49)
Fig. 5 - Influence of catalyst concentration on deposition rate, ionic speciation of
copper and cobalt positive ions, and alloy composition, for standard bath composition.
4.4. Effect of pH
Table 2 shows that the reaction rate increases with pH, an effect
of concentration on the step of hypophosphite oxidation, equations
(42) or (45). The alkalinity decreases the concentration of solvated 2+ +species Cu and increase the Cu(OH) concentration, an effect of
ionic distribution in the bath composition. However, as the Cu
concentration of the reaction rate increases with the pH range
despite the little reduction in cobalt content in the alloy, it must be
admitted that the deposition rate depends on all positive ions in
solution. Thus, removal of the hydroxyl ion in the metallic
complexes takes place simultaneously with the step of charge
transfer.
(50)
Table 2 - Influence of pH on deposition rate, ionic speciation of positive copper ions,
and alloy composition, for standard bath composition.
4.5. Effect of hypophosphite
Figure 6 shows a linear dependence between the concentration
of the reductant and the deposition rate. Nevertheless, for higher
reducing agent concentrations of 0.6 M the global reaction rate
tends to a plateau indicative of a diffusional control for cathodic -2 -1 -11 -14reaction: v = 8.3 mg cm h ;��� = 2.1 x 10 M;��� = 3.1 x 10 M; and Cu Co
Cu-4.60Co-0.30P composition alloy. Considering the Faraday
equation and alloy composition, the limiting current density for -2copper deposition is j (Cu) = 6.7 mA cm . The surplus negative L
charge in the substrate will be consumed in the hydrogen evolution.
(51)
The voltammograms obtained from cyclic voltammetry
performed on cobalt electrode show that the oxidation of
hypophosphite for the pH between 10.0 and 10.5 is in the range of
-0.65 to -0.75 V vs. Ag/AgCl, which agree well with the results of
Ohno et al [37].
Fig. 6 - Influence of hypophosphite concentration on deposition rate and alloy
composition, for standard bath composition.
4.6. Effect of citrate
The observation of Fig.7 shows that the deposition rate
decreases for citrate concentrations higher than 0.05 M in spite of
the cobalt and phosphorus content remain practically constant,
respectively, 4.6 % and 0.3 %. This behavior is explained by a
speciation effect of citrate on the positive metallic ions in solution,
i.e., in reducing and concentrations. Thus, in those situations Cu Co
the system is operating under cathodic diffusional control.
P11 CORROS. PROT. MATER., Vol. 35, Nº1 (2016), 6-14 J. I. Martins et al.

Fig. 7- Influence of citrate concentration on deposition rate, ionic speciation of copper
and cobalt positive ions, and alloy composition, for standard bath composition.
4.7. Effect of boric acid
The influence of boric acid on the deposition rate is synthesised in
Fig. 8. The results allow saying that the buffering action is
manifested in the ionic speciation of the bath. The deposition rate
decreases with the concentration of boric acid due to decreasing
concentrations of � � and � � , which is consistent with the analysis Cu Co
made for the citrate. Eventually some specific action of the buffer
on the substrate surface may also occur [10, 40].
Fig. 8 - Influence of boric acid on deposition rate, ionic speciation of copper and cobalt
positive ions, and alloy composition, for standard bath composition.
4.8. Effect of concentration ratio between [CoSO ] and ([CuSO ] + 4 4
[CoSO ])4
Figure 9 shows that increasing the mole fraction of cobalt in the
bath decreases the overall deposition rate. This negative effect is in
agreement with the information contained therein: decrease of �� , Cu
increase of �� , and increasing contents of Co and phosphorus in the Co
coating.
Experimentally, it has been found that increased cobalt content
in the bath promotes the release of hydrogen and the co-deposition
of phosphorus according to the following reaction:
(52)
This reaction indicates that alkalinity reduces the content of
phosphorus in the deposit in agreement with the results already
discussed for pH.
The equilibrium phase diagrams of Co-P or Cu-P exhibit
basically no solid solubility of phosphorus in cobalt or copper at
ambient temperatures [33, 41]. The alloy is mainly pure copper, a-
(Cu-Co) phase, and the possible intermetallic Co P and Cu P [42-2 3
44]. The increase of phosphorus content until 2% with the increase
of MRC is responsible by appearing of a microcrystallinity.
Despite the decrease in �� , but given that �� increases as well Cu Co
as the cobalt content in the deposit with MRC value, the decrease in
deposition rate may be explained with the reduction in the active
centers on surface due the presence of phosphorus atoms or the
activation energy to promote the oxidation of hypophosphite on
cobalt catalyst.
Fig. 9 - Influence of ratio between the catalyst and the amount of the catalyst plus
metal, on deposition rate, ionic speciation of copper and cobalt positive ions, and alloy
composition, for standard bath composition.
4.9. Effect of temperature
Table 3 shows the effect of temperature on the global
deposition rate. The analyses of these results according to -1Arrhenius equation reveals activation energy of 51.4 kJ mol . This
system is under electrochemical control, i.e., the anodic reaction is
controlled by activation energy of the hypophosphite on the copper-
cobalt alloys, which matches with the analysis performed for the
MRC effect.
2+ -3Table 3 - Effect of bath (standard composition with [Co ] = 2 x 10 M) temperature on
the deposition rate, and on cobalt and phosphorus content in the films.
4.10. Potential of electroless deposition
Monitoring the potential of aluminum substratum (Fig. 10),
through the copper-cobalt alloy deposition from standard
composition of the bath, proved the existence of three stages: 1) At
first, the negative potential associated with the aluminum
solubilization increases sharply to a maximum, which is associated
with the deposition of copper and cobalt by chemical shift; 2)
P12
Temperature (ºC) > 40 55 60 65 70 75 80 85
v (mg -2
cm-1
h ) 1.1 3.3 4.5 5.2 7.1 7.7 8.5 9.6
% Co 3.1 3.7 3.8 4.6 4.4 4.5 4.7 4.5
% P 0.5 0.3 0.4 0.3 0.3 0.5 0.4 0.5
CORROS. PROT. MATER., Vol. 35, Nº1 (2016), 6-14 J. I. Martins et al.

Second, there is again a potential return to more negative values
but less steeply than in the first stage to a minimum value, i.e.,
polarization phenomena, and at this stage the metal deposition
derives from the oxidation of hypophosphite; 3) In the third step the
potential remains constant, around -1.028 V vs SCE, and
corresponds to the mixed potential. Li and Kohl [45] have observed
that the steady OCP for copper deposition from a similar bath
composition using nickel as catalyst is between -0.981 and -1.064 V
vs SCE, and Martins et al [22] -0.997 V vs Ag/AgCl (1.0 M KCl). It
should be noted that for the sample without catalyst in the bath,
MRC = 0, takes place solely the first stage of deposition, i.e., no
growth of the deposit. According to the electrochemistry, the
standard reduction potential of copper, cobalt, phosphite and
hypophosphite are shown as follows [46]:
(53)
(54)
(55)
(56)
(57)
To estimate the theoretical open circuit potential for the above
reactions it has been considered that standard potential is a linear
function of temperature.
(58)
According to the results of the effect of time on plating rate for
the standard bath composition we can say that the system is under
steady-state, i.e., both bath and alloy composition are practically
constant. Then, taking into account the ionic speciation of the 2+ -14 2+ -15 standard bath composition ([Cu ] = 5.6 x 10 M; [Co ] = 7.4 x 10 M;
-[H PO ] = 0.27 M; pH = 10) and supposing a concentration of 2 2
-20 phosphide ion around 10 M, it was obtained the following open
circuit potentials for the above described reactions:
Fig. 10 – Evolution of potential along the electrodeposition of the copper-cobalt alloy:
Co4, MRC = 0.75; Co3, MRC = 0.50; Co2, MRC = 0.238; Co0, MRC = 0.
Assuming the validity of the mixed potential theory for
electroless copper deposition, it is sketched in Fig.11 the respective
Evans diagram. Clearly, the deposition of phosphorus cannot be
explained by the electrode reaction (56), since its open circuit
potential is lower than the deposition potential at which the system
operates. Thus, reaction (52) is more consistent, i.e., the formation
of phosphorus from a radical reaction: the hydrogen radical in the
active centers of the Cu-Co interacts with hypophosphite and
promotes the alloying of P into Cu-Co.
Fig. 11 - Sketch of Evans diagram for the electrode reactions in the electroless copper
plating system according to the theory of mixed potential.
5. CONCLUSIONS
A chemical model based on reversible reactions has been
established to determine ionic speciation into electroless copper
plating baths. The values of and , associated with the alloy Cu Co
composition and microstructure allow understanding the influence
of the plating factors on the kinetics of copper deposition.
The effect of pH on the deposition rate shows that the cathodic
reaction has to be extended to the cationic complexes of copper
with the hydroxyl ions. Increasing the pH decreases slightly the
cobalt and phosphorus contents.
The action of the hypophosphite shows for higher concen-
trations that the cathodic reaction is controlled by diffusion, and -2 -1that the maximum deposition rate is 8.3 mg cm h for the
.following conditions: 0.024 M CuSO .5H O, 0.60 M NaH PO H O, 4 2 2 2 2
. .0.052 M Na C H O 2H O, 0.50 M H BO , 0.004 M CoSO 6H O, pH = 3 6 5 7 2 3 3 4 2
10.0 and temperature 65 ºC.-1 The calculated activation energy of 51.4 kJ mol shows that the
system is under electrochemical control. Increasing the [CoSO ] / 4
([CoSO + CuSO ]) ratio above 0.25, despite the increase of� � � � and 4 4 Co
cobalt content in the alloy, the deposition rate is successively lower.
This is due to the increase of phosphorus content in the alloy that
may poison the active centers and/or the change of activation
energy of hypophosphite oxidation with the alloy composition. The
morphology of the alloys is changed, of a uniform cubic crystalline
structure to a globular structure, with the increase of MRC value of
0.111 to 0.750, but the structure remains crystalline in spite of
phosphorus content 2 %.
The operating potential of the system for the standard
composition of the bath is – 1.028 V vs SCE, but the open circuit
potential for the deposition of phosphorus from phosphite,
according to ionic speciation of the plating bath is – 1.486 V vs NHE.
This confirms the electrocatalytic oxidation of hypophosphite by
dehydrogenation. Thus, the deposition of phosphorus in the Cu-Co-
P13 CORROS. PROT. MATER., Vol. 35, Nº1 (2016), 6-14 J. I. Martins et al.
; ; ;
; ;
å å
å

AcknowledgementsThe work has financial support from the UID/AUR/04509/2013 Project by FCTMEC through national funds and, where applicable, the FEDER co-financing under the new PT2020 partnership agreement. This work is dedicated to the memory of Professor Luísa Maria Abrantes.
REFERENCES1 J. Cai, M. Lan, D. Zhang and W. Zhang, Electrical resis�vity and dielectric proper�es of helical
microorganism cells coated with silver by electroless pla�ng, Appl. Surf. Sci., 258, 8769-8774 (2012).
2 J. F. Rohan, G. O'Riordan and J. Boardman, Selec�ve electroless nickel deposi�on on copper as a final barrier/bonding layer material for microelectronics applica�ons, Appl. Surf. Sci., 185, 289-297 (2002).
3 M. Bazzaoui, J. I. Mar�ns, E. A. Bazzaoui, A. Albourini, R. Wang and P. D. Hong, A simple method for acrylonitrile butadiene styrene metalliza�on, Surf. Coat. Tech., 224, 71-76 (2013).
4 M. Bazzaoui, J. I. Mar�ns, E. A. Bazzaoui and A. Albourini, Environmentally friendly process for nickel electropla�ng of ABS, Appl. Surf. Sci., 258, 7968-7975 (2012).
5 Y. Shacham-Diamand and V. M. Dubin, Copper electroless deposi�on technology for ultra-large-scale-integra�on (ULSI) metalliza�on, Microelectron. Eng., 33, 47-58 (1997).
6 B. Ui, J. Li, Q. Zhao, T. Liang and L. Wang, Effect of CuSO4 content in the pla�ng bath on the proper�es of composites from electroless pla�ng of Ni-Cu-P on birch veneer, BioResources, 9, 2949-2959 (2014).
7 B. Hu, R. Sun, G. Yu, L. Liu, Z. Xie, X. He and X. Zhang, Effect of bath pH and stabilizer on electroless nickel pla�ng of magnesium alloys, Surf. Coat. Tech., 228, 84-91 (2013).
8 L. M. Abrantes and J. P. Correia, On the mechanism of electroless Ni-P pla�ng, J. Electrochem. Soc., 141, 2356-2360 (1994).9 J. E. A. M. Van Den Meerakkker, On the mechanism of electroless pla�ng. II. One
mechanism for different reductants, J. Appl. Electrochem., 11, 395-400 (1981).10 A. Hung and K. M. Chen, Mechanism of hypophosphite-reduced electroless copper pla�ng,
J. Electrochem. Soc., 136, 72-75 (1989).11 J. Dumesic, J. A. Koutsky and T. W. Chapman, The rate of electroless copper deposi�on by
formaldehyde reduc�on, J. Electrochem. Soc., 121, 1405-1412. (1974) .12 T. Anik, M. E. Touhami, K. Himm, S. Schireen, R. A. Belkhmima, M. Abouchane and M. Cissé,
Influence of pH solu�on on electroless copper pla�ng using sodium hypophosphite as reducing agent, Int. J. Electrochem. Sci., 7, 2009 - 2018 (2012).
13 R. Touir, H. Larhzil, M. Ebntouham, M. Cherkaoui and E. Chassaing, Electroless deposi�on of copper in acidic solu�ons using hypophosphite reducing agent, J. Appl. Electrochem., 36, 69-75 (2006).14 D. Plana, A. I. Campbell, S. N. Patole, G. Shul and R. A. Dryfe, Kine�cs of electroless
deposi�on: the copper-dimethylamine borane system, Langmuir, 26, 10334-10340 (2010).15 Y. Liao, S. Zhang and R. Dryfe, Electroless copper pla�ng using dimethylamine borane as
reductant, Par�cuology, 10, 487-491 (2012).16 C. Xu, G. Liu, H. Chen, R. Zhou and Y. Liu, Fabrica�on of condu�ve copper-coated glass fibers
through electroless pla�ng process, J. Mater. Sci.-Mater. El., 25, 2611-2617 (2014).17 L. You, L. Guo, R. Preisser and R. Alkolkar, Autocatalysis during Electroless Copper
Deposi�on using Glyoxylic Acid as Reducing Agent, J. Electrochem. Soc., 160, D3004-D3008 (2013).
18 M. Selvam, Electroless silver deposi�on on ABS plas�c using Co(II) as reducing agent, Transac�ons of the IMF, 88, 198-203 (2010).
19 M. Sone, K. Kobayakawa, M. Saitou and Y. Sato, Electroless copper pla�ng using Fe(II) as a reducing agent, Electrochim. Acta, 49, 233-238 (2004).
20 C. Y. Hung , H. C. Yuan, L. F. Der Lai , R. M. Loan, C. K. Nan and Y. J. Taut, Electroless deposi�on of the copper sulfide coa�ng on polyacrylonitrile with a chela�ng agent of triethanolamine and its EMI Shielding Effec�veness, Thin Solid Films, 517, 4984-4988 (2009).
21 M. W. Liang, H. T. Yen and T. E. Hsieh, Inves�ga�on of electroless cobalt-phosphorous layer and its diffusion barrier proper�es of Pb-Sn solder, J. Electron. Mater., 35, 1593-1599 (2006).
22 J. I. Mar�ns and M. C. Nunes, On the kine�cs of copper electroless pla�ng with hypophosphite reductant, Surface Eng., 32,363-371 (2016).
23 F. A. Co�on, L. M. Daniels, C. A. Murillo and J. F. Quesada, Hexaaqua diposi�ve ions of the first transi�on series: new and accurate structures; expected and unexpected trends, Inorg. Chem., 32, 4861-4867 (1993).
24 P. E. M. Wijnands, J. S. Wood, J. Reedijk and W. J. A. Maaskant, Disordered CuN6 Jahn-Teller centers in hexakis(1 methyltetrazole)copper(II)tetrafluoroborate: a temperature-dependent X-ray diffrac�on and EPR study, Inorg. Chem., 35, 1214-1222 (1996).
25 C. Wagner and W. Traud, The analysis of corrosion procedures through the interac�on of electrochemical par�al procedures and on the poten�al difference of mixed electrodes, Z. Electrochim., 44, 391-402 (1938).
26 A. J. Bard and L. R. Faulkner, Electrochemical Methods: fundamental and applica�ons, John Wiley & Sons, Inc., Toronto (1980).
27 J-A. Dean, Lange's: Handbook of Chemistry, 11th ed., McGraw-Hill, New York (1973).28 E. Campi, G. Ostacoli, M. Meirone and G. Saini, Stability of the complexes of tricarballylic
and citric acids with bivalente ions in aqueous solu�on, J. Inorg. Nucl. Chem., 26, 553-564 (1964).
29 Na�onal Ins�tute of Standards and Technology (NIST) thermochemical database 46 version 7, 2003.
30 E. Högfeldt, Stability constants of Metal-Ion Complexes: Part A. Inorganic ligands, Pergamon, Oxford (1982).
31 K. E. Atkinson, An Introduc�on to Numerical Analysis, John Wiley & Sons, Inc., (1989).32 JCPDS Interna�onal Center for Diffrac�on Data, Swarthmore, 1997, Pennsylvania, U.S.A.,
copper file no. 04-0836.33 M. Hansen and K. Anderko, Cons�tu�on of Binary Alloys, McGraw-Hill, New York, 1958.
Translated under the �tle Struktury dvoinykh splavov, Moscow: Metal-lurgiya, vol. 1, p. 624 (1962).
34 V. V. Povetkin and O. V. Devyatkova, Codeposi�on of Copper and Cobalt from Trilonate Baths and the Proper�es of the Alloys Produced, Prot. Met., 37, 314-316 (2001).
35 Z. Chang, Y. Chang, J. Xu, Z. Wu, J. Xu, H. MA and Z. Lei, Structures and proper�es characteriza�on of acrylonitrilebutadiene-styrene /organo-palygorskite clay composites, Journal of Wuhan University of Technology-Mater. Sci. Ed., 27, 1068-1071 (2012).
36 C.M.B. Mar�ns and J. I. Mar�ns, Mechanism of corrosion of roman coins from Senhora do Castelo, Corros. Prot. Mater., 28, 126-133 (2009).
37 I. Ohno, O. Wakabayashi and S. Haruyama, Anodic oxida�on of reductant in electroless pla�ng, J. Electrochem. Soc., 132, 2323-2330 (1985).
38 Y. Zeng, Y. Zheng, S. Yu, K. Chen and S. Zhou, An ESR study of the electrocataly�c oxida�on of hypophosphite on a nickel electrode, Electrochem. Commun., 4, 293-295 (2002).
39 G. Gutzeit, An outline of the chemistry involved in the process of cataly�c nickel deposi�on from aqueous solu�on. Part (IV), Pla�ng, 47, 63-70 (1960).
40 Y. Tsuru, M. Nomura, F. R. Foulkes, Effects of boric acid on hydrogen evolu�on and internal stress in films deposited from a nickel sulfamate bath, J. Appl. Electrochem., 32, 629-634 (2002).
41 D. T. Hawkins and R. Hultgren, Metals Handbook, 8th ed., Vol. 8, Lyman, Taylor, American Society for metals (1973).
42 I. Kosta, A. Vicenzo, C. Müller and M. Sarret, Mixed amorphous-nanocrystalline cobalt phosphorous by pulse pla�ng, Surf. Coat. Techn., 207, 443-449 (2012).
43 K. M. Nam, J. H. Shim, H. Ki, S. I. Choi, G. Lee, J. K. Jang, Y. Jo, M. H. Jung, H. Song and J. T. Park, Single-crystalline hollow face-centered-cubic cobalt nanopar�cles from solid face-centered-cubic cobalt oxide nanopar�cles, Angew. Chem. Int. Ed., 47, 9504-9508 (2008).
44 Hui-Sheng Yu, Shou-Fu Luo and Yong-Rui Wang, A compara�ve study on the crystalliza�on behavior of electroless Ni-P and Ni-Cu-P deposits, Surf. Coat. Tech., 148, 143-148 (2001).
45 J. Li and P. A. Kohl, The deposi�on characteris�cs accelerated nonformaldehyde electroless copper pla�ng, J. Electrochem. Soc., 150, C558-C562. (2003).
46 S. G. Bratsch, Standard electrode poten�als and temperature coefficients in water at 298.15 K, J. Phys. Chem. Ref. Data, 18, 1-21 (1989).
P14 J. I. Martins et al.CORROS. PROT. MATER., Vol. 35, Nº1 (2016), 6-14
P alloy can be explained by the interaction of an H atom removed
from P-H bond with a new molecule of hypophosphite.
The use of cobalt ions instead of nickel ions allows obtaining
copper-cobalt deposits with levels of phosphorus in the order of
0.2-0.3 %, and consequently doesn't change significantly the
properties of these metallic coatings.

P15
DURABILIDADE DE COLETORES SOLARES TÉRMICOS: INSPEÇÃO E ANÁLISE DE FALHA EM FUNÇÃO DA CORROSIVIDADE AMBIENTAL
1* 1 1 1Teresa C. Diamantino , Maria João Carvalho , Ana Nunes e Cristina Ferreira
¹ Laboratório Nacional de Energia e Geologia, I. P. , Estrada do Paço do Lumiar, 1649-038 Lisboa, [email protected], cris�[email protected]
* A quem a correspondência deve ser dirigida, teresa.diaman�[email protected]
RESUMOPortugal é um país com grande potencial de aproveitamento da energia solar térmica, devido ao elevado recurso solar. No entanto, este facto, aliado a uma extensa linha de costa, tem um forte impacto na durabilidade dos materiais utilizados nos coletores, quer sejam metálicos ou poliméricos, resultando na diminuição do seu tempo de vida útil. Com base num inquérito e em visitas de inspeção realizados a nove instalações existentes em Portugal de média e grande dimensão, pretendeu-se identificar os danos existentes nos coletores solares térmicos, quais os componentes com maiores danos e verificar se existe correlação entre o nível de degradação observado nos materiais metálicos, a proximidade da orla marítima e a corrosividade ambiental.Muitos dos problemas encontrados não se deveram apenas a inadequadas especificações dos materiais mas também se deveram a deficiente projeto e/ou fabrico dos coletores, assim como da própria montagem das instalações. No entanto, os resultados obtidos apontam para a existência de uma correlação entre a proximidade do mar/categoria de corrosividade e o grau de degradação observado nos diferentes componentes metálicos. Este trabalho permitiu também concluir que é fundamental integrar ensaios adequados de qualificação dos materiais nos esquemas de certificação de coletores, nomeadamente ao nível da superfície absorsora e dos materiais elastoméricos, assim como um sistema de avaliação da ventilação do coletor.
Palavras-Chave: Coletor Solar Térmico, Desempenho, Componentes, Durabilidade, Corrosão Atmosférica
ABSTRACTPortugal is a country with great potential for the use of solar thermal energy due to the high solar resource. However, this fact, combined with an extensive coastline, has a strong impact on the durability of the materials used in the collectors, whether metallic or polymeric, resulting in the reduction of their lifetime.Based on a survey and on inspection visits made to nine medium and large dimension installations existing in Portugal it was intended to identify the damages in the solar thermal collectors and the components with greater damages and also to verify if a correlation exists between the degradation level observed in the metallic materials, the proximity to the coast and the environmental corrosivity.Many of the problems found were due not only to inappropriate specification of the materials but also to deficient design and/or manufacture of the collectors as well as assembly of the installations. However, the results obtained point to the existence of a correlation between the proximity of the sea/corrosivity category and the level of degradation observed in the different metallic components. This work allowed also to conclude that is fundamental to integrate adequate qualification tests of the materials in collectors certification schemes particularly regarding the absorber and elastomeric materials, as well as a procedure to evaluate collector ventilation.
Keywords: Solar Thermal Collector, Performance, Components, Durability, Atmospheric Corrosion
DURABILITY OF SOLAR THERMAL COLLECTORS IN ENVIRONMENTS WITH DIFFERENT CORROSIVITY: INSPECTION AND FAULT ANALYSIS
CORROS. PROT. MATER., Vol. 35, Nº1 (2016), 15-20
http://dx.medra.org/10.19228/j.cpm.2016.35.02

P16
1. INTRODUÇÃO
No início do século XXI verificou-se uma grande expansão do
mercado dos coletores solares térmicos (CST) a qual sofreu algum
abrandamento a partir de 2011/2012 devido à crise económica
observada em Portugal e também na Europa. Apesar de
atualmente ser comercializada uma grande variedade de produtos,
a área do solar térmico está ainda numa fase tecnológica expan-
siva, procurando-se produzir novos coletores com melhor desem-
penho e de menor custo, tanto para baixas temperaturas ( 80 °C)
como para a gama de médias temperaturas (80-250 °C) [1-3].
Sendo equipamentos de custo relativamente elevado, espera-se
que tenham elevada durabilidade, rendimento e fiabilidade.
Nos últimos anos as políticas públicas deram incentivos à
instalação de CST, quer através de apoios financeiros diretos, quer
através de legislação que impõem a sua utilização para obtenção de
água quente em novos edifícios. A estimativa de CST instalados e
em funcionamento correspondia, no final de 2013, a uma área de 2cerca de 905000 m e a uma potência de pico de 633 MWt [4]. Este
valor está longe ainda do que foi considerado o potencial exequível 2de instalação de CST em Portugal, 2800000 m , tendo as aplicações
industriais um grande potencial ainda não explorado [5].
Um coletor deve cumprir 3 funções distintas: captação de
energia pelo absorsor, transferência de energia do absorsor para o
fluido circulante e transporte de energia pelo fluido circulante
através das tubagens. Além destas, podem ainda considerar-se
outras duas secundárias: confinamento e resistência estrutural
(degradação física, química, mecânica e dinâmica) [6].
É neste contexto que se enquadra a corrosão, com um elevado
impacto económico, ambiental e de segurança na sociedade, que
pode ser quantificado através da análise dos seus custos diretos e
indiretos. Um estudo encomendado pelo Congresso Americano,
realizado de 1999 a 2001 nos EUA, estimou que os custos diretos da
corrosão são 3,1 % do PIB americano e que 20 % a 30 % desses
custos são evitáveis [7]. Em Portugal, tendo em conta este estudo e
o nosso grau de industrialização os custos da corrosão podem ser
estimados entre 3-4 % do PIB. Considerando que 20 % são custos
evitáveis, estes traduzem-se em valores, de acordo com o PIB de
2014, entre 1040-2000 milhões de euros, onde a corrosão
atmosférica é a que mais contribui para os custos da corrosão [8].
Portugal é um país com grande potencial de aproveitamento da
energia solar térmica, devido ao elevado recurso solar. Este facto,
aliado a uma extensa linha de costa, tem um forte impacto na
durabilidade dos materiais utilizados nos coletores, quer sejam
metálicos ou poliméricos e, consequentemente, uma diminuição do
seu tempo de vida útil.
Existem várias metodologias de ensaio para a qualificação e
certificação de coletores solares térmicos [9]. No entanto, não
estão integradas neste processo as metodologias de ensaio dos
diferentes materiais/componentes desses sistemas, embora
existam referenciais normativos para os componentes elastomé-
ricos, comumente utilizados como vedantes, ISO 9808:1990 [10] e
ISO 9553:1997 [11], assim como a norma ISO 22975-3: 2014 [12]
para a qualificação de superfícies absorsoras solares em termos de
durabilidade. Nas duas primeiras assume-se que os principais
factores ambientais que contribuem para a degradação dos
componentes elastoméricos são a temperatura e o ozono. No
entanto, é também largamente conhecida a importância da
radiação UV como uma das causas de degradação destes materiais.
Na norma ISO 22975-3:2014 [12] assume-se que os principais
fatores ambientais que afetam a durabilidade de uma superfície
absorsora solar são: temperatura, humidade relativa e a
contaminação por dióxido de enxofre.
Encontra-se descrito e internacionalmente normalizado que os
fatores responsáveis por uma maior corrosividade ambiental são: a
temperatura, a humidade relativa, a poluição por dióxido de
enxofre e a salinidade [13, 14]. No entanto, para a qualificação de
superfícies absorsoras solares apenas o dióxido de enxofre é
considerado como o contaminante principal. Esta consideração é
discutível quando se trata de ambientes com uma forte influência
marítima como acontece em Portugal e muitos Países do Sul e do
Norte da Europa [15, 16]. No entanto, são estas zonas costeiras as
mais adequadas para a implantação dos sistemas de energia solar
atendendo à maior densidade populacional [17] e aos níveis de
radiação aí existentes, especialmente nas regiões de baixas
latitudes [18].
Portugal, tendo em conta a sua extensa linha de costa tem
ambientes de alta (categoria de corrosividade C4), muito alta (C5) e
de extrema corrosividade (CX) devido principalmente à temperatu-
ra, humidade relativa, ao dióxido de enxofre mas fundamental-
mente devido ao elevado teor de cloretos [14, 15].
Assim, urge a necessidade de quantificar o impacto das
atmosferas salinas em coletores solares térmicos por forma a
melhorar as especificações dos materiais e a se reduzirem os
riscos dos investimentos e os custos de manutenção destes
sistemas.
Os objetivos deste trabalho são identificar os danos existentes
nos diferentes componentes dos coletores solares térmicos e
verificar se existe correlação entre o nível de degradação obser-
vado e a corrosividade ambiental de Portugal tendo por base um
inquérito e visitas de inspeção realizados às instalações existentes
em Portugal de média e grande dimensão, com tempos similares
de funcionamento (13-17 anos).
2. METODOLOGIAS
A partir da década de 80 existiram programas financiados pelo
Governo Português para a instalação deste tipo de sistemas. Tendo
por base a informação da localização e a descrição das
características destas instalações, foi preparado e enviado um
inquérito para os proprietários destas instalações para caracte-
rizar as suas condições de funcionamento. O inquérito era com-
posto por duas partes, a primeira sobre a caracterização da
instalação e a segunda sobre os dados cronológicos. Na tabela 1
estão indicadas as principais questões colocadas no inquérito
relativamente à caracterização da instalação. Após a recolha das
respostas aos inquéritos, foram planeadas as visitas aos locais
tendo sido considerados 3 grupos definidos pela distância à orla
marítima, a ausência de fontes de poluição industrial/microclimas
e o tempo de funcionamento (Figura 1).
T. C. Diamantino et al.CORROS. PROT. MATER., Vol. 35, Nº1 (2016), 15-20

P17
Tabela 1 - Questões colocadas no inquérito para a caracterização das
instalações.
Fig. 1 - Localização geográfica das instalações visitadas
No contexto de uma iniciativa pública denominada "Água
Quente Solar para Portugal", havia já sido realizado um inquérito às
diferentes instalações de CST em 2003-2004. Os autores tiveram
acesso a estes dados que contêm informação muito relevante
sobre os modos de falha mais comuns nas instalações de coletores
solares térmicos [6]. As principais caraterísticas das instalações
visitadas estão indicadas na tabela 2, sendo coincidentes com as
inspecionadas em 2003-2004, permitindo perceber a evolução da
degradação dos sistemas nos últimos 10 anos.
QUESTÕES COLOCADAS
Tipo de Coletor
Fabricante
Nº de Coletores instalados
Finalidade da Instalação
Tipo de instalação solar
Sistema da apoio
Data de montagem da instalação
Periodicidade da manutenção
Plano
CPC
Tubos de Vácuo
Outro
Balneários
Cozinha
Lavandaria
Piscina
Outro
Circulação forçada
Termosifão
Eléctrico
Gás
Outro
Tabela 2 - Principais características das instalações visitadas.
Nota: n.s - absorsor não seletivo; s. - absorsor seletivo
As inspeções foram realizadas de modo a obter informação
sobre o estado geral do sistema e sobre o estado dos componentes
metálicos e elastoméricos. Na tabela 3 estão indicados os parâ-
metros que foram avaliados durante as visitas, sempre que
possível. A avaliação dos componentes foi também efectuada tendo
por base o Grau de Severidade descrito e adotado pela IEA-SHC
Task 27 [1] (tabela 4).
Tabela 3 - Avaliações efetuadas durante as visitas realizadas às instalações.
Tabela 4 - Critério de avaliação do modo de falha/processo de degradação
dos componentes.
Re
ferê
nci
a
Lo
cal
Dis
tân
cia
ap
roxi
ma
da
d
a L
inh
a d
e C
ost
a (k
m)
Nº
Co
lect
ore
s in
sta
lad
os
Da
ta In
sta
laçã
o/a
no
s e
m fu
nci
on
am
en
to
Tip
o d
e c
ole
tor
Ma
nu
ten
ção
Ca
teg
ori
a C
orr
osi
vid
ad
e
est
ima
da
[1
4, 1
5]
A
B
C
D
E
F
G
H
I
Tábua
Seia
Alcains
Olivais-Lisboa
Alcochete
Alcácel do Sal
Albufeira
Albufeira
Albufeira
69
93
127
31
44
25
0
0
0
30
27
18
10
39
60
110
200
4
1997 / 16
1996 / 17
1999 / 14
2000 e 2008 / 13 e 5
2000 / 13
1998 / 15
2000 / 13
1998 / 15
1999 / 14
CPC (s.)
CPC (s.)
Flat Plate (n. s.)
Flat Plate (s.)
Flat Plate (s.)
CPC (s.)
Flat Plate (n.s.)
Flat Plate (s.)
Flate Plate (s.)
2x por ano
2x por ano
1x por ano
2x por ano
2x por ano
1x por ano
1x por ano
1x por ano
1x por ano
C2-C3
C2-C3
C2-C3
C3
C3
C3
C4
C4
C4
COMPONENTES
Caixa do coletor
1. Fissuração
2. Empenamento
3. Corrosão
4. Penetração de chuva
Acessórios de montagem/estrutura de suporte
1. Falta de resistência
2. Falta de segurança
Revestimento do absorsor
1. Delaminação
2. Fissuração
3. Empolamentos
4. Corrosão/Degradação
5. Alteração de corTubagens, suportes do absorsor e adutores
1. Corrosão
2. Deformação
3. Fugas
4. Perdas de ligação
Vedantes / Juntas
1. Fissuração
2. Falta de aderência
3. Falta de elasticidade
Cobertura / Refletor
1. Fissuração
2. Fendilhação
3. Encurvamento
4. Laminação
5. Empenamento
6. Desgaseificação
Isolamento
1. Retenção da água
2. Desgaseificação
3. Degradação
AVALIAÇÃO GERAL
Correta posição da sonda de comando
Existência de proteção mecânica do isolamento
Existência de isolamento nas tubagens
Ligação permanente do circuito primário à rede
Circuito equilibrado
Disfunção do sistema de comando
Purgador de ar mal colocado/inexistente
Vaso de expansão corretamente colocado
Fugas no circuito primário
Manutenção periódica
Estabelecimento de prioridade ao sistema solar em relação ao apoio
Correta impermeabilização nos locais onde a canalização atravessa a placa
Boa integração arquitetónica, se aplicável
Edifícios próximos com efeito de proteção
Orientação e Inclinação
Área instalada e Capacidade
Ventos dominantes
Barreiras naturais aos ventos dominantes
Indústrias nas imediações
Microclima
Elevadas temperaturas de funcionamento do sistema
Severidade(S)
Nenhum efeito no componente
Efeito menor no produto mas nenhum efeito no funcionamento no sistema
Risco de falha de funcionamento
Certeza de falha no funcionamento do produto
Falha que pode afetar a segurança
Grau
1
2-3
4-6
7-9
10
T. C. Diamantino et al.CORROS. PROT. MATER., Vol. 35, Nº1 (2016), 15-20
A
C
B
G
I
H
D
F
E

3. RESULTADOS E DISCUSSÃO
Nas figuras 2-5 são apresentados os registos fotográficos que
ilustram as instalações globalmente, assim como os diferentes
componentes observados. Tendo em conta o objetivo deste
trabalho, os resultados apresentados incidem na degradação dos
materiais metálicos e elastoméricos.
Fig. 2 - Visão global das instalações visitadas.
Fig. 3 - Registos da degradação observada nos componentes elastoméricos (vedantes,
juntas e passa-tubos).
P18
A tabela 5 sintetiza o grau de severidade atribuído aos compo-
nentes observados.
As avaliações da degradação dos componentes foi dificultada
por não se dispor de informação sobre os materiais/revestimentos
colocados. No que respeita aos componentes metálicos das estru-
turas de suporte, as estruturas electrozincadas / galvanizadas
apresentavam-se muito mais corroídas nas instalações mais
próximas da costa. Relativamente às caixas dos colectores o facto
de a grande maioria serem de alumínio anodizado tornou difícil de
quantificar a corrosão por picadas. As superfícies absorsoras
observadas do Sul do País (H-I) apresentavam claramente um ele-
vado grau de degradação relativamente aos absorsores seletivos
das outras instalações, o que não se verificou com as superfícies
absorsoras não seletivas. No que diz respeito às tubagens, suporte
do absorsor e adutores observaram-se problemas que podem
estar associadas a uma incorreta especificação dos materiais, uma
vez que são observados problemas de corrosão galvânica.
Relativamente aos componentes elastoméricos, destaca-se a
retração dos vedantes, observada frequentemente. Foi também
observada fissuração em passa-tubos. Observou-se também em
muitos sistemas um embaciamento acentuado devido, em alguns
casos à deficiente conceção do sistema de ventilação do coletor
(orifícios de respiro de grande dimensão permitindo fácil entrada
de água ou contaminantes), mas também derivado de alterações
físicas na caixa do coletor (surgimento de frestas nos cantos da
caixa do coletor), assim como da redução dimensional dos vedantes
com consequente redução da estanquicidade dos mesmos e
aumento da corrosão/degradação do absorsor.
Globalmente, as superfícies absorsoras e os vedantes foram os
que apresentaram maior degradação.
Tabela 5 - Grau de severidade estimado para os componentes metálicos e elastomé-
ricos nas diferentes instalações de CST.
A B
C D
E F
G IH
A B C
Não há registosfotográficos
D E
F G
H
T. C. Diamantino et al.CORROS. PROT. MATER., Vol. 35, Nº1 (2016), 15-20
Instalação
Anos de funcionamento
Distância da orla marítima (Km)
Distância média da orla marítima (Km)
Categoria de corrosividade (estimada)
A B C D E F G H I
Médiacomponentes (S)Componentes Metálicos Grau de Severidade (S)
Caixa do coletor
Estrutura de suporte do coletor
Absorsor
Tubagens, suporte do absorsor e adutores
Média/Grau de Severidade
Materiais elastométricos
Vedantes/Juntas
16 17 14 13 13 15 13 15 14
69 93 127 31 44 25 0 0 0
96 33 0
C2-C3 C3 C4
4,0 1,7 3,0 3,7 4,0 5,0 4,0 4,3 3,7 3,7
2,7 3,0 2,3 2,7 2,3 4,0 3,0 4,3 3,7 3,1
3,0 X 1,0 5,0 4,0 3,3 4,7 7,0 5,3 4,2
2,3 X 1,7 2,7 5,0 5,0 3,7 4,7 3,0 3,5
3,0 2,3 2,0 3,5 3,8 4,3 3,8 5,1 3,9 3,5
4,3 X 3,7 4,3 4,3 4,7 4,0 4,3 2,3 4,0

P19 T. C. Diamantino et al.CORROS. PROT. MATER., Vol. 35, Nº1 (2016), 15-20
Fig. 4 - Registos da degradação observada nos diferentes componentes metálicos.
SEVERIDADE(S)
A
B
C
D
E
F
G
H
I
Refª Estruturade suporte
CaixaColetor
Absorsor Tubagens, suporte do absorsor e adutores
Não háregisto
fotográfico

P20
Fig. 5 - Correlação entre o grau de severidade e a distância da costa para as 9 instalações.
4. CONCLUSÕES
Muitos dos problemas encontrados não se devem apenas a
inadequadas especificações dos materiais mas também se devem a
deficiente projeto e/ou fabrico dos coletores, assim como da própria
montagem das instalações. Contudo, a separação das causas da
degradação observada nem sempre é fácil porque muitas vezes
existem sinergias entre as mesmas. Um deficiente funcionamento
por incorreções na instalação dos sistemas pode conduzir à rápida
perda de desempenho dos coletores.
No entanto, os resultados obtidos sugerem existir uma corre-
lação entre a proximidade do mar/categoria de corrosividade e o
grau de degradação observado nos diferentes componentes
metálicos. Algumas instalações com 15 anos apresentavam risco de
falha do sistema, nomeadamente as localizadas no Sul do País.
Também nas instalações mais próximas da orla marítima foi
constatado o maior grau de insatisfação dos proprietários, assim
como de componentes inoperacionais. Estes resultados corrobo-
ram os resultados recentemente publicados [16, 19].
Relativamente aos componentes elastoméricos, verificou-se,
em particular no caso dos vedantes, a inadequação frequente do
material à aplicação, concluindo-se ser fundamental a qualificação
destes componentes e que esta inclua a avaliação do efeito da
radiação UV [20] além dos efeitos da temperatura e do ozono.
Este trabalho evidencia como o desempenho dos coletores
solares térmicos depende da durabilidade dos seus componentes,
em particular da superfície absorsora e dos componentes
elastoméricos, bem como do sistema de ventilação do coletor.
Conclui-se assim que é fundamental integrar ensaios de
qualificação dos materiais daqueles componentes nos sistemas de
certificação de colectores, assim como um sistema de avaliação da
ventilação do coletor. É ainda fundamental que todos os materiais
metálicos dos restantes componentes sejam especificados em
função da corrosividade ambiental dos locais onde vão ser
instalados.
Agradecimentos:Agradece-se à Fundação da Ciência e Tecnologia pelo Financiamento
concedido através do Projeto DURASOL - Durabilidade de Coletores Solares
Térmicos (FCOMP-01-0124-FEDER-027507 (Ref. FCT RECI/EMS-
ENE/0170/2012)). Agradece-se também aos proprietários das instalações
visitadas todo o apoio prestado, recetividade e acolhimento.
Referências 1 Performance and Durability Assessment. Op�cal Materials for Solar Thermal Systems. (M.
Köhl, B. Carlsson, G. J. Jorgensen and A. W. Czanderna, Editors), Elsevier (2004) (ISBN 0-08-
044401-6).
2 B. Carlsson, Solar Energy Materials & Solar Cells, 91, 1338-1349 (2007).
( ).h�p://dx.doi.org/10.1016/j.solmat.2007.05.011
3 IEA SHC - task 33 and Solar PACES - Task IV, subtask C: Solar Heat for industrial processes -
Medium temperature collectors, Eds. W. Weii, M. Rommel, AEE Intec, Austria (2005).
(h�p://www.iea-ship.org/documents/Medium_Temperature_Collectors_Task33-
IV_email.pdf).
4 Franz Mauthner, Werner Weiss, Monika Spörk-Dür, 2015, "Solar Heat Worldwide - Markets
and Contribu�on to the Energy Supply 2013" IEA Solar Hea�ng & Cooling Programme
( ) h�p://www.iea-shc.org/data/sites/1/publica�ons/Solar-Heat-Worldwide-2015.pdf
5 Forum das energias renováveis em Portugal, Uma contribuição para os obje�vos de polí�ca
energé�ca e ambiental. (H. Gonçalves, A. Joyce, L. Silva, Ed.) (2002).
( ).h�p://dx.doi.org/10.1016/j.porgcoat.2008.08.010
6 M. Lopes Prates, A. Neves, M. J. Carvalho, J. Farinha Mendes e S. Spencer, (Análise dos
resultados da inspeção visual de instalações solares em operação, da inspeção final no
processo de qualificação de coletores e da avaliação do risco dos seus potenciais modos de
falha), Procedimentos CIES 2006 - XIII Congresso Ibérico e VIII Congresso Ibero-Americano
de Energia Solar, 9-10 de Novembro, Lisboa (2006).
7 (15/12/2015).h�ps://www.nace.org/uploadedFiles/Publica�ons/ccsupp.pdf
8 C. Guedes Soares, Y. Garbatov, A. Zayed and G. Wang, Corros. Sci., 51, 2014-2026 (2009).
( ).h�p://dx.doi.org/10.1016/j.corsci.2009.05.028
9 ISO 9806:2013. (Solar energy - Solar thermal collectors -- Test methods), ISO, Geneve,
Switzerland (2013).
10 ISO 9808:1990. (Solar water heaters - Elastomeric materials for absorbers, connec�ng pipes
and fi�ngs - Method of assessment), ISO, Geneve, Switzerland (1990).
11 ISO 9553:1997. (Solar energy - Methods of tes�ng preformed rubber seals and sealing
compounds used in collectors), ISO, Geneve, Switzerland (1997).
12 ISO 22975-3:2013. (Solar energy -- Collector components and materials -- Part 3: Absorber
surface durability), ISO, Geneve, Switzerland (2013).
13 ISO 9223:2012. (Corrosion of metals and alloys -- Corrosivity of atmospheres -
Classifica�on, determina�on and es�ma�on), ISO, Geneve, Switzerland (2012).
14 Corrosão Atmosférica. Mapas de Portugal. (M. Elisabete M. Almeida e M. G. S. Ferreira,
Ed.), INETI, Lisboa, 438pp, (1997). (ISBN: 972-676-161-1).
15 Karolina Slamova, Rüdiger Glaser, Chris�an Schill, Stefan Wiesmeier and Michael Köhl. J.
Photon. Energy. 2(1), 022003, (2012). ( ).h�p://dx.doi.org/10.1117/1.JPE.2.022003
16 Karolina Slamova, Ines Duerr, Thomas Kaltenbach and Michael Koehl, Solar Energy
Materials & Solar Cells,147, 246-254 (2016).
17 Eurostat Regional Yearbook 2011. Publica�on of the European Union, Luxembourg (2011).
18_h�p://energiasrenovaveis.com/DetalheConceitos.asp?ID_conteudo=47&ID_area=8&ID_s
ub_area=27 (3/12/2015).
19 T. Kaltenbach, E.Klimm, T. Meier, M. Köhl and K.-A.Weiß, Energy Procedia, 48, 731 - 738
(2014).
20 A. R. I. G. Rosado, "Avaliação do envelhecimento de componentes elastoméricos de EPDM
de um coletor solar térmico plano", Dissertação para a obtenção do grau de Mestre em
Química Tecnológica, FCT/UNL, Caparica, Portugal (2015).
T. C. Diamantino et al.CORROS. PROT. MATER., Vol. 35, Nº1 (2016), 15-20
0 20 40 60 80 100 120 140
6.0
5.0
4.0
3.0
2.0
1.0
0
Gra
u d
e s
eve
rid
ad
e (
S)
Distância da Linha de Costa (Km)
2R = 0.8067
C4
C3
C2-C3

P21
PITTING CORROSION OF 304 STAINLESS STEEL IN AN ACTIVATED CARBON FILTER
1,2* 1,2J.I. Martins and C.M.B. Martins
* A quem a correspondência deve ser dirigida, [email protected]
ABSTRACT Water leakages of an orange color were found in the cross welding zone and barrel of an activated carbon filter used in a wastewater treatment plant. The analysis of the chloride content in the plant flowsheet showed that the equipment was subjected to unsuited chloride concentration for 304 stainless steel resistance to pitting corrosion. The inside shows holes distributed randomly from about 20 cm above the welding zone to the lower outlet port of the equipment.The rehabilitation of the equipment was made by replacing the damaged cylindrical part and performing an inner liner of polymer matrix composite.It was recommended to eliminate the entry of oxidants in the filter, and a better control of coal saturation.
Keywords: Stainless Steel 304, Pi�ng Corrosion, Ac�vated Carbon Filter, Hypochlorite, Welding, Composites
CORROSÃO POR PICADA DE UM AÇO INOXIDÁVEL 304 NUM FILTRO DE CARVÃO ACTIVADO
RESUMOFugas de água de uma cor laranja foram encontradas na zona de soldadura transversal e corpo de um filtro de carvão activado usado numa estação de tratamento de águas residuais. A análise do teor de cloreto no fluxograma da planta mostrou que o equipamento foi submetido a uma concentração de cloreto inadequada para a resistência do aço inoxidável 304 à corrosão por picada. O interior mostra perfurações distribuídas aleatoria-mente a partir de cerca de 20 cm acima da zona de soldadura da saída inferior do equipamento. A reabilitação do equipamento foi feita através da substituição da parte cilíndrica danificada e aplicando um revestimento interior de um compósito com matriz polimérica. Foi sugerido a eliminação da entrada de oxidantes no filtro e um melhor controlo da saturação do carvão.
Palavras-chave: Aço Inoxidável 304, Corrosão por Picada, Filtro de Carvão ac�vado, Hipoclorito, Soldadura, Compósitos
¹ Universidade do Porto, Faculdade de Engenharia, Departamento de Engenharia Química, Rua Roberto Frias, 4200-465 Porto, Portugal² Universidade do Minho, Ins�tuto de Ciências Sociais, Lab2PT- Laboratório de Paisagens, Património e Território, Campus do Gualtar, 4710-057 Braga, Portugal, carlamariabrazmar�[email protected]
CORROS. PROT. MATER., Vol. 35, Nº1 (2016), 21-25
http://dx.medra.org/10.19228/j.cpm.2016.35.01

with a FEI Quanta 400FEG equipment, fitted with a probe for micro
analysis EDAX Genesis X4M. The pressure inside the chamber was -2about 6x10 Pa. The distance between the objective lens and the
sample, ranged between 6 mm and 15 mm. The SEM filament was
operated at variable current and at 15 kV voltage. The SEM/EDS
analysis has been performed in CEMUP (Materials Centre of the
Oporto University).
Radiographs were performed using the equipment XRS-3 with
a pulsed X-ray source and the Vidisco imaging system. The analysis
of chloride in the effluent was performed by volumetric and
potentiometric titration.
3. ASSESSMENT OF THE SITUATION
It is an activated carbon filter used in the installation of
wastewater treatment of a cosmetic industry, Fig. 1a), showing
leakages in the region of circumferential weld seam, Fig. 1b), and
under the plastic coating to protect the equipment against
scratches on shipping, Fig. 1c).
Fig. 1 - Activated carbon filter.
a) Equipment: h = 2.80 m, D = 0.90 m, e = 2 mm (body) and 2.5 mm (top and bottom);
material, stainless steel 304;
b) Leakages with orange color in the welding zone;
c) Bubble with leakages under the plastic lining.
After removing the activated carbon, plastic lining and cleaning
the inside of the equipment, it was possible to gather more
information inserted in Fig.2. With all this information, we can
reach the following conclusions:
• The device is coated with plastic on the cylindrical portion except
the area adjacent to the circumferential weld bead, Fig. 1a).
• The water leakages of orange color on the cylindrical body
emanate from the welding bead, Fig. 1b) and Fig. 2a), and from
non-visible holes under the plastic, Fig.1c) and Fig. 2b).
• The plastic removal in zone 30 cm from the bottom outlet of the
equipment showed several perforations originating from the
inside to the outside.
• Pits have a variable size from 0.7 to 2.5 mm, and tend to
aggregation.
• Control valves do not show the presence of pits.
1. INTRODUCTION
Activated carbon is a material obtained from natural products
subjected to a pyrolysis (400-600°C) in the absence of oxygen
followed by a physical or chemical treatment. The first stage is
aimed to convert the raw-material in elemental carbon, and the
second to open and multiply the pores. This last phase confers a
large specific surface area, in addition to forming functional groups
responsible for the charcoal active sites [1, 2], which makes it
suitable in wastewater treatment for removing organic substances
[3, 4], metal cations and residual chlorine [5].
The manufacture of active carbon filters equipment is usually
performed with special-mixed fiberglass, AISI 304 or 316 SS or
carbon steel with rubber lining or epoxy resin against corrosion.
Austenitic stainless steels have high corrosion resistance in
several aqueous medium, attributed to the presence of a thin
invisible film and passive characterized by stability, durability,
adhesion and self-repairs [6]. However, in chloride environments
[7-10] these stainless steels may undergo pitting corrosion,
according to concentration level of chloride. Once initiated, the rate
of pitting corrosion is quite serious, since it continues to grow even -when the adjacent area remains intact. The hypochlorite ion (ClO ) is
also a key factor in pitting, particularly in dry-wet situation as has
been showed by Martins et al. [11]. In this case, the residual
chlorine content must not exceed 2 ppm or 5 ppm, respectively, for
304L and 316L stainless steels (AWWA Standards C651 / 65).
The crack or crevice corrosion in water is rare in stainless
steels at a pH above 6 and ambient temperature, which is mostly
the typical situation of industrial waste effluents. Under severe
conditions, for example, narrow slits, low pH, high temperature,
low flow rates, and other situations where there is a risk of a
localized concentration of chloride, stainless steel 304L and 316L
should be used for chloride content up to 50 ppm and 250 ppm,
respectively.
Weld decay is a corrosion process that may occur in austenitic
stainless steels as a result of sensitization in the heat affected
zones (HAZ) of metal during welding operations [12]. At
temperature range of 425-815 ºC the stainless steels may have a
depletion in chromium, as the result of chromium carbide
formation along the grain boundaries of the austenitic structure.
Thus, the region adjacent to the grain boundary [13] becomes
sensitive to intergranular corrosion attack, particularly in the
presence of chlorides. Usually, the stainless steels of low carbon
content are immune to sensitization.
This article analyzes the causes responsible for stainless steel
304 failure in an activated carbon filter equipment used in a
wastewater treatment plant.
2. EXPERIMENTAL DETAILS
The steel was analyzed by emission spectrometry using a
Spectrolab equipment, Table 1, and the composition shows a
stainless steel 304.
Table 1 - Chemical composition of stainless steel 304.
The scanning electron microscopy (SEM) images and the
analysis by energy dispersive spectroscopy X-ray (EDS) were made
P22
STEEL TYPE C Mn Si S P Ni Cr
304 0.03 1.65 0.50 0.03 0.03 8.04 18.31
a b
J. I. Martins and C. M. B. Martins
c
CORROS. PROT. MATER., Vol. 35, Nº1 (2016), 21-25

Fig. 2 - a) Detail of the weld zone; b) Hole under the plastic; c) Area inside the filter
below the welding; d) Area in the vicinity of the circumferential weld seam; e) and f)
Inside areas below the welding with a reference scale.
4. FLOWSHEET OF WASTEWATER TREATMENT
Fig. 3 shows the processing wastewater plant diagram with the
flow rates and the respective composition of chlorides. The
information set on flowsheet show the following:
• The chlorides are present in the raw wastewater and
consequently their concentration is not increased significantly
from the primary antifoam coagulant used in the physico-
chemical unit to promote flocculation.
• It is added to the effluent treatment plant, before adsorption unit, -1 -1a flow of 10,000 L d with a chloride concentration of 36 mg L
from a factory osmosis unit that uses the public water previously
dechlorinated and decalcified for protecting the osmosis
polymeric membrane.-1• The incoming flow in the adsorption unit is 11,000 L d with 177.1
-1mg L chloride content.
• Microfiltration unit periodically needs to promote the cleansing of
the ceramic membrane with a closed loop system using the
following operative sequence: 1) washing with water; 2) cleaning
with an alkaline solution of sodium hydroxide (0.5 %) and sodium
hypochlorite (2,000 ppm); 3) washing with water; 4) washing with
citric acid solution; 5) washing with water. Thus, from time to time
it is introduced into the treated water storage tank, an effluent
with residual chlorine (not determined) from the remaining
hypochlorite.
• The hypochlorite handling for the recovery of ceramic membrane
is in the vicinity of the activated carbon adsorption unit, wherein
the storage tank sewage drains by gravity to the hand-tight tank
feeding the adsorption unit.
Taking into account the composition of the input and output
streams, a material balance of chlorides in the adsorption unit
gives:
(1)
V = volume of solution within the adsorption unit, assumed as 40%
of equipment capacity, V = 712 L.-[Cl ] = chloride concentration in the solution inside the equipment. s
-The equation (1) shows that [Cl ] = 4,028 ppm, which means a s
passage of chloride ions from activated carbon to the effluent. Thus,
the interior of the equipment has been subjected to a high chloride
concentration at neutral pH and room temperature.
P23
Zoom the pit
a b
c d
e f
J. I. Martins and C. M. B. MartinsCORROS. PROT. MATER., Vol. 35, Nº1 (2016), 21-25
Fig. 3 - Flowsheet of the wastewater treatment.
Tank purges
Actived carbon feed tank
Accumulation tank
Osmosisconcentrates
Microfiltration unit
Wastewatergross
Biological unit (BU) Absorption unit
Tensioactivedosing
Coagulantdosing
pH dosing
Receiving tank
Homogenization tank
Feed tank BU
-[Cl ] = 3985 mg/L
-[Cl ] = 2257 mg/LQ = 1000 L/d
Filter bands
Sludges Physico-chemicalunit
Dispenser
-[Cl ] = 1588 mg/LQ = 1000 L/d
-[Cl ] = 36 mg/LQ = 10000 L/d
-[Cl ] = 437,8 mg/LQ = 1. 1000 L/d
AISI 304Treatedeffluent
pH = 6,5 - 7,5
PSV 1 7bar
KR1 PSV23bar
AISI 304AISI 304

P24
5. TREATMENT OF WASTEWATER WITH ACTIVATED CHARCOAL
Activated carbon is commonly used in drinking water treatment
or wastewater, for color removal, odor, and bad taste, through an
adsorption mechanism.
Chemicals such as chlorine and hypochlorite employed in
disinfection or organic material oxidation in the water are removed
by a process somewhat different from the simple adsorption. In this
case there is a catalytic decomposition of the oxidizing agent on the
surface of the activated carbon according to the following reactions:
(2)
(3)
(4)
According to reactions (2) and (3), the cleaning of the ceramic
membrane of the microfiltration unit will be an operation
responsible for the chloride concentration increasing in the tank
inside the adsorption unit.
The adsorption isotherms establish the relationship between
the amount or concentration of adsorbed on the adsorbent (q ), and e
the equilibrium concentration of the adsorbate in the solution (C ). e
The equilibrium data for plotting this relationship, Fig. 4a), are
obtained from "batch" experiments using the following expression:
(5)
V = volume of the solution used in the test (L).-1C = initial concentration of adsorbate in the solution (mg L ).o
C = concentration of adsorbate in equilibrium in the solution (mg e
-1 L ).
q = concentration of the adsorbate in the adsorbent in equilibrium e
-1 with the solution (mg g of adsorbent).
Fig. 4 - a) Isothermal of carbon adsorption; b) Breakthrough curve.
After some time, the loading of the carbon increases, the
available adsorption places are filled, and breakthrough of the
chloride in the effluent occurs, Fig. 4b). However, there may be
chloride transfer from the solid phase to the effluent even when the
adsorbent is not saturated. The inverse behavior of the activated
carbon is explained by analyzing the equilibrium adsorption
isotherm data, Fig. 4a). Indeed, it is only necessary that the input
effluent to the adsorption unit has a chloride concentration (Ce1)
smaller than the equilibrium concentration (Ce2) related with the
content accumulated in the adsorbent (qe2). In this case it is
established a concentration gradient of chloride ion that will
impose on the system an evolution for a pseudo equilibrium
position with chloride concentrations q and C , respectively, to the es es
adsorbent and solution, so that it satisfies the following material
balance:
(6)
V = volume of solution within the adsorption unit (L).- -1C = [Cl ] = chloride concentration in the solution (mg L ].es s
M = total mass of activated carbon inside de filter (g).c
q = concentration of the adsorbate in the adsorbent at pseudo es
-1 equilibrium (mg g of carbon).
q = concentration of the adsorbate in the adsorbent at point 2 in e2
-1 equilibrium isotherm (mg g of carbon).
According to the transcript about the flowsheet of the
wastewater plant this situation can occur several times.
6. RESULTS
6.1 Radiographs of weld
The radiographs in the welding zone of the equipment, Fig. 5 a),
show a good penetration and uniform bead, even in the place where
holes have been observed. As holes were found in areas outside the
welding zone we must conclude that the material failure is not due
to welding, but instead to the high aggressiveness of the
environment for the steel alloy in question.
6.2 Chemical analysis by SEM/EDS
The chemical analysis performed from the fusion zone until the
parent metal, Fig. 5, shows a chromium content according to
passivation.
The chromium content ranges from about 19.0 % in the fusion
zone to 18.3 %, and nickel from 8.7 % to 8.0 %.
Fig. 5 - Welding area. a) Macrograph; b) Chromium and nickel content from fusion
zone to parent metal.
7. DISCUSSION
The interior of the filtration unit is constituted by a diffuser plate
positioned slightly above the bottom outlet, on which 25 cm of sand
and an activated carbon bed with about 1.8 - 2.0 m thick are placed.
The pressure drop in the unit is in the order of 0.8 bar. Despite the
existence of an expansion chamber in the system, there will always
be preferential paths in the effluent percolating through the filter
bed. This occurrence originates differential cell concentration
responsible for localized attack [14], which is also associated with
the composition of the effluent. This parameter with regard to the
J. I. Martins and C. M. B. MartinsCORROS. PROT. MATER., Vol. 35, Nº1 (2016), 21-25
a b
-1q
/(m
g g
)e
C e1 C e2
a)
q e1
q e2
Eff
lue
nt
con
cen
tra
tio
n
b)
breakthroung
C /(mg e
-1L ) Effluent volume treated
C 1 C 2
C 0 C 0
1 2

P25
chloride content is essential, in view of the adverse effect of this
anion on the 304 stainless steel passivation. The concentration of
sodium chloride may increase inside the filter unit when the
activated carbon is close to saturation by one of the following ways:
1 - When cleaning the ceramic membrane microfiltration unit, since
residual chlorine in contact with activated coal is converted into the
chloride according to reaction 2) and 3);
2 - When the concentration of chlorides in the input chloride
effluent has a lower value corresponding to the equilibrium
saturation of carbon. In this case, it is noted that the interior
material was subjected to a concentration (4,028 ppm) much
greater than the value taken as acceptable. The aggressiveness of
the hypochlorite ion in the stainless steel is also associated to its
cathodic behavior besides the reduction reaction of oxygen [11].
(7)
In order to solve the problems in the activated carbon the
following actions were taken:
1 - Eliminate chlorine in the input stream of the filter unit coming
from the ceramic membrane cleaning. The discharge of the
downstream effluent must be made to a tank containing a reducing
agent (e.g., sodium bisulfite) for limiting the residual chlorine
content to 0.01 ppm before entering the public network.
2 - Remove the plastic coating, which is only performed for
protection of the equipment during road or railway transport.
3 - Control the chloride content in the input stream and output of
adsorption unit to set the breakthrough of chlorides suitable to
avoid the inversion of the adsorption mechanism of the activated
carbon.
4 - Avoiding the stainless steel 304 contact with the effluent
proceeding to its coating with a polymer (polyester) matrix
composite, Fig. 6. In this mode the stainless steel only provides the
mechanical properties.
Fig. 6 - Activated carbon filter. a) Equipment after repair; b) Top interior view; c)
Bottom interior view; d) Flange.
J. I. Martins and C. M. B. Martins
References 1 H. Teng, J. A. Ho and Y. F. Hsu, Carbon, 35, 275-283 (1997).
2 N. R. Khalili, M. Campbell, G. Sandi and J. Golas, Carbon, 38, 1905-1915 (2000).
3 C. Moreno-Cas�lla, Carbon, 42, 83-94 (2004).
4 G. M. Mwangi and G. B. Ogun�mein, West Indian Journal of Engineering, 35, 65-71 (2013).
5 M. I. Yusufu, C. C. Ariahu, N.N. Nkpa and B. D. Igbabul, J. Chem. Eng. Mater. Sci., 3, 23-29 (2012).
6 J. Sedriks (Corrosion of Stainless Steels), 2ⁿ� Edi�on, John Wiley & Sons, New York, USA (1996).
7 A. Fossa�, F. Borgioli, E. Galvane�o and T. Bacci, Corros. Sci., 48, 1513-1527 (2006).
8 Q. Yang and J. L. Luo, Electrochim. Acta, 46, 851-859 (2001).
9 E. A. Abd El Meguid, N. A. Mahmoud and S. S. Abd El Rehim, Mater. Chem. Phys., 63, 67-74
(2000).
10 S. S. El-Egamy and W. A. Badway, J. Appl. Electrochem., 34, 1153-1158 (2004).
11 C. M. B. Mar�ns, J. L. Moreira and J. I. Mar�ns, Engineering Failure Analysis, 39, 65-71
(2014).
12 M. Song and K. Guan, Engineering Failure Analysis, 18, 1613-1618 (2011).
13 D. A. Jones (Principles and Preven�on of Corrosion), MacMillan, New York. pp. 115, 200 and
291 (1992)
14 J. I. Mar�ns and M. C. Nunes, Electrochim. Acta, 52, 552-559 (2006).
a b
d
Inside lining:polymer matrixcomposite c
CORROS. PROT. MATER., Vol. 35, Nº1 (2016), 21-25
8. CONCLUSIONS
According to the observations and experimental results it is
concluded the following:
1 - The perforations observed on the metal surface of the 304
stainless steel activated carbon filter develop from the inside to the
outside of the equipment.
2 - The radiographs performed on the welding zone don't show
technical deficiencies in its execution.
3 - The interior of the filtration unit was subjected to a chloride
content which is incompatible with the pitting corrosion resistance
of stainless steel 304, in the order of 4,000 ppm.

Os frascos de vidro para conterem medicamentos injetáveis
(vials) são amplamente utilizados na Indústria Farmacêutica. Os
problemas de delaminação do vidro e a criação de partículas e flocos
visíveis e subvisíveis nos medicamentos comercializados têm
aumentado significativamente nos últimos anos e originado
numerosas recolhas do mercado. Os ingredientes farmacêuticos
ativos (APIs), particularmente os biológicos, utilizados nas terapias
modernas são cada vez mais complexos e requerem formulações
mais complexas. Os APIs e os excipientes podem interagir e aderir
ao vidro não tratado, provocando a sua delaminação. Os fabricantes
de vials e as empresas farmacêuticas têm vindo a tomar diversas
medidas para resolver este problema. Uma solução efetiva que tem
sido utilizada é o revestimento interior dos vials.
Infelizmente, a delaminação do vidro é frequentemente detetada
só depois de vários meses de armazenamento dos medicamentos
em vials de vidro. Nesta situação, a única solução é a recolha dos
produtos do mercado. Para complicar a situação, não existe uma
causa direta para a delaminação do vidro e consequentemente não
existem métodos simples para prever e triar este problema. De
facto, a delaminação resulta de um ataque químico da superfície do
vidro. Isto pode causar a formação de partículas, conduzindo a
interações com o medicamento e a uma diminuição da sua eficácia
bem como causar possíveis efeitos secundários devido à lixiviação de
elementos do vidro para a formulação do medicamento. Por
exemplo, a adsorção de proteínas pode levar à redução da
estabilidade dos medicamentos biológicos sensíveis. A lixiviação de
iões metálicos do vidro pode, entretanto, afetar o pH das
formulações dos medicamentos e reduzir a sua estabilidade e
possivelmente a eficácia da bioterapêutica.
As reações químicas que ocorrem nos frascos de vidro são
determinadas pelos seguintes fatores: tipo de recipiente de vidro,
composição do vidro, gama de pH, tipo de medicamento, formulação
do medicamento, tempo e temperatura de armazenamento,
condições de fabrico do recipiente e processo de esterilização. Uma
pequena alteração numa destas variáveis pode influenciar a
reatividade da superfície de vidro. O vidro é atacado no caso dos
medicamentos ácidos, pelos sistemas aquosos através da permuta
iónica e, no caso dos medicamentos básicos, pela dissolução. A
permuta iónica envolve a difusão da água através do vidro,
conduzindo à lixiviação (permuta de hidrogénio com iões alcalinos). A
dissolução envolve a destruição da cadeia de silicato pelos iões
hidroxilo. Ambos os mecanismos podem resultar na formação de
uma camada lixiviada que se pode destacar rapidamente da
superfície de vidro. Os fosfatos utilizados nos medicamentos
formulados com soluções tampão baseadas em fosfatos podem
também reagir com o vidro, levando à formação de camadas que
podem descamar.
A composição do vidro e os seus processos de fabrico podem ter
impacto na capacidade da sua superfície resistir a essas interações.
Todos os medicamentos injetáveis têm que ser armazenados em
vidro Tipo 1 e satisfazer os requisitos de resistência eletrolítica.
REVESTIMENTOS DE FRASCOS DE VIDRO PARA APLICAÇÕES MÉDICAS
Contudo, mesmo assim, a composição do vidro pode variar
significativamente de fabricante para fabricante.
Uma grande variedade de revestimentos têm sido explorados
para promover a resistência química dos vials de vidro utilizados para
aplicações farmacêuticas. O sulfato de amónio é, algumas vezes,
utilizado nos vials para reduzir a alcalinidade da superfície de vidro.
Em alternativa, um revestimento fino de quartzo é, algumas vezes,
usado para inibir a difusão da água. Um revestimento de quartzo
quimicamente uniforme pode atuar como uma barreira efetiva às
interações entre APIs biológicos e as superfícies de vidro,
minimizando a absorção de proteínas e aumentando a estabilidade.
O fabricante de vidro, Schott, tem utilizado a técnica plasma impulse
chemical vapor deposi�on (PICVD) para aplicar diversas camadas de
moléculas de dióxido de silício (com uma espessura entre 100 e 200
micrómetros) nas superfícies de vidro. Estas finas camadas não
afetam as dimensões dos vials farmacêuticos e fornecem uma
barreira de difusão efetiva. De acordo, com esta empresa, o
revestimento, que é aplicado como parte de um processo validado e
permanentemente controlado, reduz a adsorção de produtos
radioativos e proteínas e melhora a resistência química e
estabilidade do material. Por outro lado, este revestimento reduz a
lixiviação de iões da superfície do vidro para níveis abaixo dos limites
de deteção.
A Schott tem desenvolvido revestimentos hidrofóbicos para os
frascos de vidro farmacêuticos. Estes revestimentos repelentes à
água têm uma superfície extremamente suave o que é ideal para
prolongar a estabilidade dos medicamentos sujeitos à liofilização.
Vials com revestimentos hidrofóbicos têm superfícies muito
homogéneas e evitam a aderência de substâncias liofilizadas nas
suas paredes internas. De acordo com a empresa, os produtos
liofilizados têm uma aparência agradável e tendem a redissolverem-
se mais rapidamente em água.
Entretanto, num projeto financiado pela UE denominado
"Adhesion and Cohesion at Interfaces in High Performance Glassy
Systems" foram desenvolvidas tecnologias de revestimento
inovadoras para modificar as forças nas interfaces com os materiais
de vidro, de modo a prever efeitos indesejáveis. No âmbito deste
projeto, foi usada uma técnica de modelagem para desenvolver
simulações atomísticas de adsorção de proteínas em interfaces
entre dióxido de silício, dióxido de titânio e água. Foram ainda
desenvolvidos estudos de propriedades mecânicas e químicas de
interfaces de finas camadas de vidro envolvidas na propagação de
fissuras. Os estudos experimentais foram feitos conjuntamente com
as avaliações teóricas. No desenrolar deste projeto, foi criado um
revestimento plasma anti-aderente para vials de vidro destinados a
aplicações farmacêuticas baseado num tipo de polietileno glicol
(PEG). Este revestimento tipo PEG apresenta, em condições ótimas,
uma adsorção significativamente mais baixa do que os vials padrão.
In "Coatings Tech", August 2016
João Machado ([email protected])
NOVIDADES
P26 CORROS. PROT. MATER., Vol. 35, Nº1 (2016)

REGULAMENTAÇÃO
P27 CORROS. PROT. MATER., Vol. 35, Nº1 (2016)
Acompanhando o progresso tecnológico de uma sociedade em
constante evolução e com o intuito de reduzir a carga burocrática
das empresas, previu-se já em 2011 a desmaterialização das Guias
de Acompanhamento de Resíduos (GAR), com a publicação do
Decreto-Lei n.º 73/2011 (artigo 21.º) de 17 de julho, relativo ao
transporte de resíduos.
As guias de acompanhamento de resíduos surgiram com a
publicação do Regime Geral de Gestão de Resíduos (RGGR), com o
Decreto-Lei n.º 239/97 de 9 de setembro e da Portaria que o
regulamenta, Portaria n.º 335/97 de 16 de maio. Com esta
legislação tornou-se obrigatória para o transporte rodoviário,
ferroviário, marítimo e aéreo em território nacional, a utilização de
dois modelos de formulário da Imprensa Nacional da Casa da
Moeda (INCM), que distinguiam os resíduos intitulados de uso geral
(modelo n.º 1428) dos resíduos hospitalares G.III e G.IV (modelo n.º
1429).
Atualmente, com o Sistema Integrado de Registo Eletrónico de
Resíduos (SIRER), as empresas cumprem as obrigações legais em
matéria ambiental através de uma plataforma informática, Siliamb.
Nesta plataforma encontram-se vários módulos como o MIRR
(Mapa Integrado de Registo de Resíduos), o MRRU (Mapa de Registo
de Resíduos Urbanos), o SILOGR (Sistema de Informação de
Operadores de Gestão de Resíduos), o MTR-LV e o MTR-LL (relativo
aos Movimentos Transfronteiriços de Resíduos), aguardando-se
para início de 2017 o lançamento do módulo das e-GAR.
As novas Guias Eletrónicas substituirão assim as atuais guias de
acompanhamento de resíduos (GAR), as guias de acompanha-
mento de resíduos hospitalares (GARH) e as guias de acompanha-
mento de resíduos de construção e demolição (GARCD), baseando-
se nas regras e estrutura do modelo INCM n.º 1428 das atuais GAR.
A emissão das mesmas ficará ao cargo do produtor ou de outro
interveniente, como o transportador ou o operador de gestão de
resíduos (desde que validadas pelo produtor), permitindo que
acompanhem o transporte em território nacional em formato físico
(papel impresso) ou formato digital. Esta ferramenta de gestão
permitirá assim, a rastreabilidade e a fiscalização do movimento de
resíduos deste a sua origem (produtor) até ao seu destino final.
Aguarda-se a publicação de uma portaria conjunta dos
membros do Governo responsáveis pelas áreas do ambiente e dos
transportes que regulamenta estas guias eletrónicas, ficando as e-
Gar disponíveis no dia seguinte à referida publicação. Os seis
meses seguintes à publicação da portaria assumem-se como um
período transitório e de adaptação às novas guias, onde podem ser
utilizados os modelos antigos da INCM ou as e-GAR. Terminado
este período, serão apenas válidas para transporte de resíduos as
guias de acompanhamento de resíduos emitidas na plataforma
informática Siliamb.
Mais informações sobre este tema podem ser encontradas no
website da Agência Portuguesa do Ambiente (APA) que tem
promovido sessões de apresentação do projeto e prevê realizar
sessões de informação, divulgação e formação sobre as e-GAR
após a publicação da portaria.
Carla Ferreira (cferreira@ap�ntas.pt)
E-GAR: GUIAS ELECTRÓNICAS DE ACOMPANHAMENTO DE RESÍDUOS

NOTÍCIAS BREVES
P28 CORROS. PROT. MATER., Vol. 35, Nº1 (2016)
O Laboratório Nacional de Energia e Geologia (LNEG), com o
apoio da Sociedade Portuguesa de Materiais (SPM), organizou no asdia 17 de novembro de 2016, em Lisboa, as 7 Jornadas de
Corrosão e Proteção de Materiais. Registou-se a presença de 153
participantes provenientes de empresas, universidades, institutos
públicos e institutos privados. As 20 apresentações orais estiveram
distribuidas por 4 sessões temáticas dedicadas aos temas
"Corrosão Metálica", "Monitorização e Técnicas de Caracteriza-
ção", "Novos Materiais e Revestimentos" e "Conservação e
Restauro de Património e Casos Reais".
A conferência plenária, proferida pelo Sr. Doutor Florian Sutter,
trouxe-nos um tema de grande atualidade e enorme relevância
como é o da durabilidade dos materiais e revestimentos nas
centrais solares de concentração.
Antes da Sessão de Encerramento tivemos a intervenção da
Senhora Professora Fátima Montemor, na sua qualidade de
Presidente da Federação Europeia de Corrosão, que nos falou
sobre as estratégias de intervenção da FEC no combate à corrosão.
À semelhança do verificado nas duas edições anteriores, em
2008 e 2011, voltou a realizar-se o Concurso de Fotografia. Foram
apresentadas 28 fotografias a concurso. Foram atribuídos prémios
às 3 fotografias mais votadas.
O "Prémio Jovem Investigador" já faz parte da "imagem de
marca" das Jornadas. Pela primeira vez nas suas 7 edições, este
incentivo a jovens investigadores teve o patrocínio do LNEG e da
SPM. O "Prémio de Jovem Investigador" foi atribuído ao trabalho
"Remoção química de reves�mentos orgânicos em aeronaves
militares - Estudo da eficiência dos decapantes químicos à base de
álcool benzílico" de Vanessa Baião, Jorge Correia e Cláudia
Magalhães.
Parabéns à vencedora do Prémio 2016 mas igualmente aos que
tiveram o mérito de se apresentar a concurso.
jornadas decorrosão e proteçãodemateriais
com o apoio:
patrocinadores
LISBOA17 2016NOV
fórum TECNOLÓGICO DE LISBOA
as7 JORNADAS DECORROSÃO E PROTEÇÃODE MATERIAIS
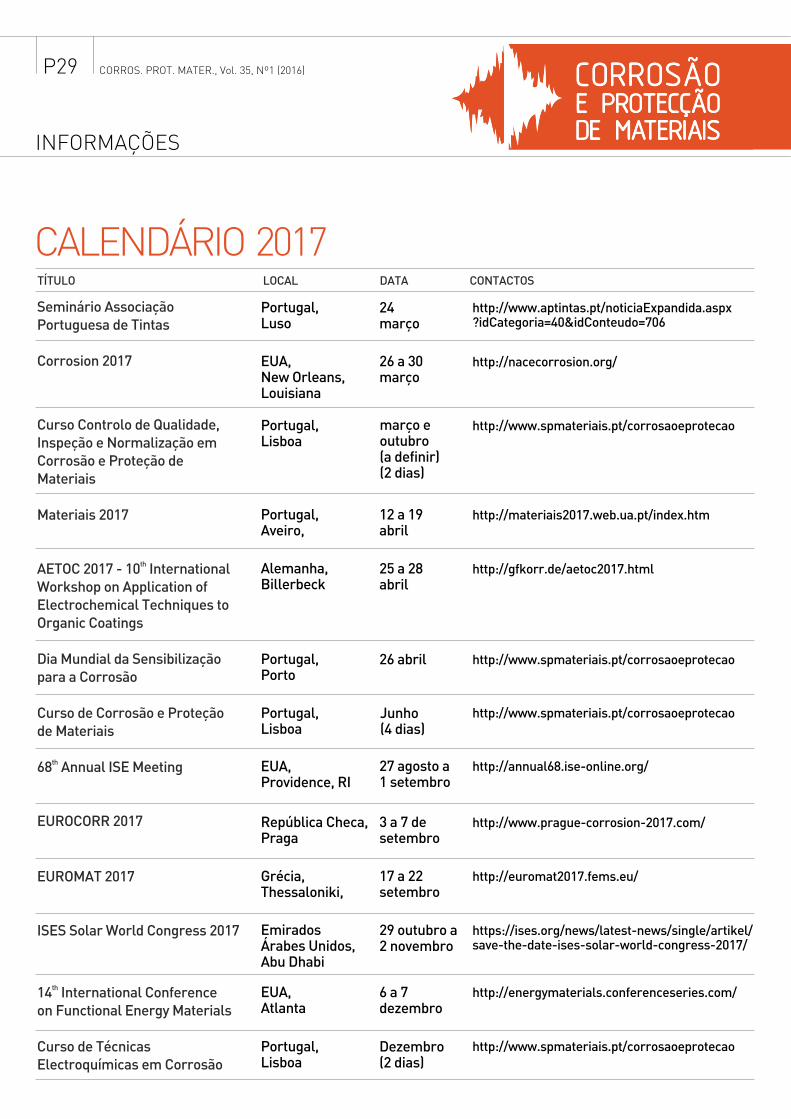
CALENDÁRIO 2017TÍTULO LOCAL DATA CONTACTOS
INFORMAÇÕES
P29 CORROS. PROT. MATER., Vol. 35, Nº1 (2016)
Seminário Associação Portuguesa de Tintas
Corrosion 2017
Curso Controlo de Qualidade, Inspeção e Normalização em Corrosão e Proteção de Materiais
Materiais 2017
thAETOC 2017 - 10 International Workshop on Application of Electrochemical Techniques to Organic Coatings
Dia Mundial da Sensibilização para a Corrosão
Curso de Corrosão e Proteção de Materiais
th68 Annual ISE Meeting
EUROCORR 2017
EUROMAT 2017
ISES Solar World Congress 2017
th14 International Conference on Functional Energy Materials
Curso de TécnicasElectroquímicas em Corrosão
Portugal, Luso
EUA, New Orleans, Louisiana
Portugal, Lisboa
Portugal, Aveiro,
Alemanha, Billerbeck
Portugal, Porto
Portugal, Lisboa
EUA, Providence, RI
República Checa, Praga
Grécia, Thessaloniki,
Emirados Árabes Unidos, Abu Dhabi
EUA, Atlanta
Portugal, Lisboa
24 março
26 a 30 março
março e outubro (a definir) (2 dias)
12 a 19 abril
25 a 28 abril
26 abril
Junho (4 dias)
27 agosto a1 setembro
3 a 7 de setembro
17 a 22 setembro
29 outubro a2 novembro
6 a 7 dezembro
Dezembro (2 dias)
http://www.aptintas.pt/noticiaExpandida.aspx?idCategoria=40&idConteudo=706
http://nacecorrosion.org/
http://www.spmateriais.pt/corrosaoeprotecao
http://materiais2017.web.ua.pt/index.htm
http://gfkorr.de/aetoc2017.html
http://www.spmateriais.pt/corrosaoeprotecao
http://www.spmateriais.pt/corrosaoeprotecao
http://annual68.ise-online.org/
http://www.prague-corrosion-2017.com/
http://euromat2017.fems.eu/
https://ises.org/news/latest-news/single/artikel/save-the-date-ises-solar-world-congress-2017/
http://energymaterials.conferenceseries.com/
http://www.spmateriais.pt/corrosaoeprotecao

TIPOS DE CONTRIBUIÇÕES
Serão considerados para publicação pela Direcção Editorial
artigos originais, comunicações breves, artigos de revisão e outros
conteúdos especiais (e.g. casos reais, formação) que se integrem
no domínio científico da corrosão/degradação e protecção de
materiais.
MANUSCRITOS
Os manuscritos podem ser escritos em português, inglês ou
espanhol e enviados por e-mail ([email protected]). O ficheiro
deve ser elaborado em formato de documento "word". Os
manuscritos não devem exceder 25 páginas A4, incluindo tabelas e
figuras, com espaçamento duplo entre linhas e escritos no tipo e
tamanho de letra "Arial 12". As margens das folhas devem ter uma
dimensão de 2,0 cm. A paginação deve ser feita de forma
sequencial, incluindo a primeira página e ao centro.
Os artigos devem ter, por ordem sequencial, os seguintes itens:
• Título curto e explícito, com letra a negrito, em maiúsculas e
com dimensão 12.
• Autores (texto centrado) com asterisco indicando o autor a
quem deve ser dirigida a correspondência. A afiliação deve ser
indicada para todos os autores e incluir o nome da instituição a três
níveis (Ex: Universidade, Faculdade e Departamento/Centro), o
código postal, a cidade, o país e o endereço de e-mail. No caso do
autor de correspondência, deverá acrescentar-se a respectiva
morada completa. A afiliação deve ser numerada e colocada
sequencialmente em nota de pé de página ((1), (2),…).
• O Resumo não pode exceder 125 palavras e com espaçamento
simples entre linhas.
• As Palavras-chave (máximo 6 palavras) com texto a negrito,
em itálico e alinhado à esquerda. Se o manuscrito for escrito em
Inglês ou Espanhol, os autores devem acrescentar o título, resumo
e palavras-chave em Português. Se for escrito em Português os
autores devem escrever o título, resumo e palavras-chave em
Inglês.
• Na Introdução os autores devem enquadrar adequadamente o
artigo no seu contexto científico ou tecnológico, bem como o
objectivo do trabalho. Por exemplo, devem indicar, de forma
resumida e com referências, qual a literatura existente nessa área
específica, evidenciando desse modo a contribuição do artigo para o
conhecimento.
• Nos itens Metodologias Experimentais, Resultados e Discus-
são todas as unidades devem ser especificadas de acordo com o
sistema SI. As figuras e as tabelas devem ser apresentadas centra-
das no texto, de um modo claro e, tanto quanto possível, compreen-
síveis sem ter de recorrer a outra informação. Os cabeçalhos das
tabelas devem ser centrados e a negrito. Todos os gráficos, dese-
nhos, fotografias e simbologia especial deverão ser apresentados
em boa qualidade (600 dpi) e enviados separadamente do
documento "Word" em formato jpg, bmp ou tif. As figuras devem
ser legendadas como "Fig.".
• Os manuscritos devem terminar com conclusões claras, exce-
pto nos casos onde isso não é apropriado (e.g. artigos de revisão).
• Os Agradecimentos não devem exceder 5 linhas com tamanho
de letra 10.
• As Referências devem ser numeradas sequencialmente, tal
como surgem no texto, entre parênteses rectos [1] e apresentadas
no fim do manuscrito, incluindo sempre os autores, o título do
trabalho referido (ou livro), o título da revista em itálico, abreviado,
seguido do número do volume, páginas e ano de publicação entre
parênteses ou, no caso dos livros, o editor, a cidade e o ano.
As abreviaturas das revistas devem estar de acordo com as
seguintes indicações:
Index Medicus journal abbreviations:
http://www.nlm.nih.gov/tsd/serials/lji.html;
List of title word abbreviations:
http://www.issn.org/2-22661-LTWA-online.php;
CAS (Chemical Abstracts Service):
http://www.cas.org/sent.html.
EXEMPLO:
Revistas:
[63] D. Wang and G. P. Bierwagen, Prog. Org. Coat., 64, 327- 338
(2009).
Livros:
[64] E. Almeida (Corrosão Atmosférica do Aço), in Corrosão
Atmosférica. Mapas de Portugal (M. E. M. Almeida e M. G. S.
Ferreira, ed.), INETI/IMP/LTR, Lisboa, Portugal, pp. 15-38 (1997).
"Proceedings":
[65] C. Arroyave, F. Echeverria and F. Herrera (NO2 Measurements
in Atmospheric Corrosion Studies) in Proceedings of Symposium on
Outdoor Atmospheric Corrosion, May, Phoenix, USA (2001).
Normas:
[66] ISO 9227: 2012. (Corrosion tests in artificial atmospheres - Salt
spray tests), ISO, Geneve, Switzerland (2012).
Os títulos mencionados anteriormente devem ser escritos a
negrito, com o texto alinhado à esquerda, numerados e em
maiúsculas (e.g. 1. INTRODUÇÃO, 2. METODOLOGIAS, etc.).
Todos os manuscritos submetidos para publicação serão
enviados à avaliação por pares. Uma vez recebido o manuscrito, a
Direcção Editorial reserva-se o direito de indicar aos autores
qualquer outra recomendação aqui não mencionada. Os autores
devem verificar cuidadosamente as provas e enviar as versões
corrigidas por e-mail ([email protected]), durante os dois dias
imediatos ao da recepção das referidas provas.
INSTRUÇÕESPARA OS AUTORES
INFORMAÇÕES
P30 CORROS. PROT. MATER., Vol. 35, Nº1 (2016)